Zip Codes with the Highest Percentage of Population Employed in Legal Services & Support in Danville, IL
RELATED REPORTS & OPTIONS
Legal Services & Support
Danville
Compare Zip Codes
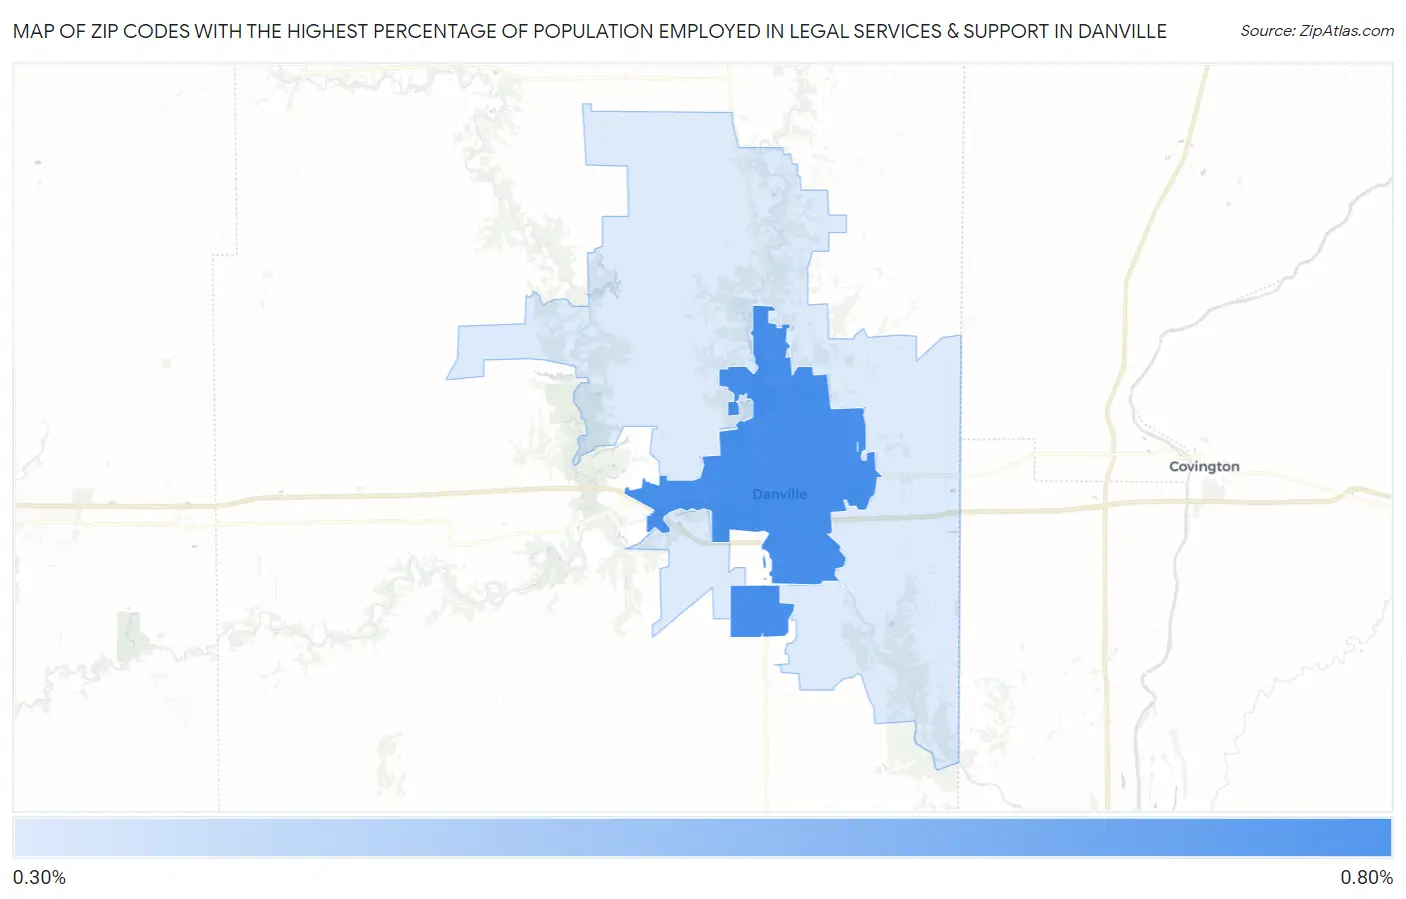
Map of Zip Codes with the Highest Percentage of Population Employed in Legal Services & Support in Danville
0.32%
0.72%
Zip Codes with the Highest Percentage of Population Employed in Legal Services & Support in Danville, IL
| Zip Code | % Employed | vs State | vs National | |
| 1. | 61832 | 0.72% | 1.3%(-0.625)#382 | 1.2%(-0.459)#10,158 |
| 2. | 61834 | 0.32% | 1.3%(-1.03)#599 | 1.2%(-0.866)#14,836 |
1
Common Questions
What are the Top Zip Codes with the Highest Percentage of Population Employed in Legal Services & Support in Danville, IL?
Top Zip Codes with the Highest Percentage of Population Employed in Legal Services & Support in Danville, IL are:
What zip code has the Highest Percentage of Population Employed in Legal Services & Support in Danville, IL?
61832 has the Highest Percentage of Population Employed in Legal Services & Support in Danville, IL with 0.72%.
What is the Percentage of Population Employed in Legal Services & Support in Danville, IL?
Percentage of Population Employed in Legal Services & Support in Danville is 0.75%.
What is the Percentage of Population Employed in Legal Services & Support in Illinois?
Percentage of Population Employed in Legal Services & Support in Illinois is 1.3%.
What is the Percentage of Population Employed in Legal Services & Support in the United States?
Percentage of Population Employed in Legal Services & Support in the United States is 1.2%.