Monee, IL Map & Demographics
Monee Map
Monee Overview
$60,890
PER CAPITA INCOME
$115,129
AVG FAMILY INCOME
$86,849
AVG HOUSEHOLD INCOME
46.8%
WAGE / INCOME GAP [ % ]
53.2¢/ $1
WAGE / INCOME GAP [ $ ]
0.42
INEQUALITY / GINI INDEX
5,120
TOTAL POPULATION
2,568
MALE POPULATION
2,552
FEMALE POPULATION
100.63
MALES / 100 FEMALES
99.38
FEMALES / 100 MALES
48.4
MEDIAN AGE
2.5
AVG FAMILY SIZE
2.1
AVG HOUSEHOLD SIZE
3,160
LABOR FORCE [ PEOPLE ]
69.2%
PERCENT IN LABOR FORCE
1.6%
UNEMPLOYMENT RATE
Monee Zip Codes
Monee Area Codes
Income in Monee
Income Overview in Monee
Per Capita Income in Monee is $60,890, while median incomes of families and households are $115,129 and $86,849 respectively.
| Characteristic | Number | Measure |
| Per Capita Income | 5,120 | $60,890 |
| Median Family Income | 1,341 | $115,129 |
| Mean Family Income | 1,341 | $161,738 |
| Median Household Income | 2,429 | $86,849 |
| Mean Household Income | 2,429 | $123,718 |
| Income Deficit | 1,341 | $0 |
| Wage / Income Gap (%) | 5,120 | 46.76% |
| Wage / Income Gap ($) | 5,120 | 53.24¢ per $1 |
| Gini / Inequality Index | 5,120 | 0.42 |
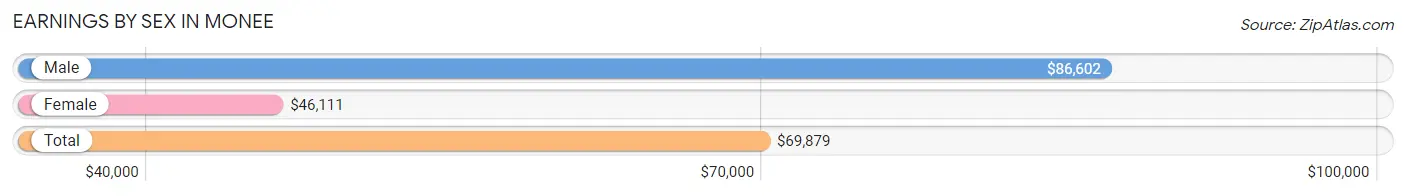
Earnings by Sex in Monee
Average Earnings in Monee are $69,879, $86,602 for men and $46,111 for women, a difference of 46.8%.
| Sex | Number | Average Earnings |
| Male | 1,806 (56.8%) | $86,602 |
| Female | 1,372 (43.2%) | $46,111 |
| Total | 3,178 (100.0%) | $69,879 |
Earnings by Sex by Income Bracket in Monee
The most common earnings brackets in Monee are $100,000+ for men (734 | 40.6%) and $55,000 to $64,999 for women (275 | 20.0%).
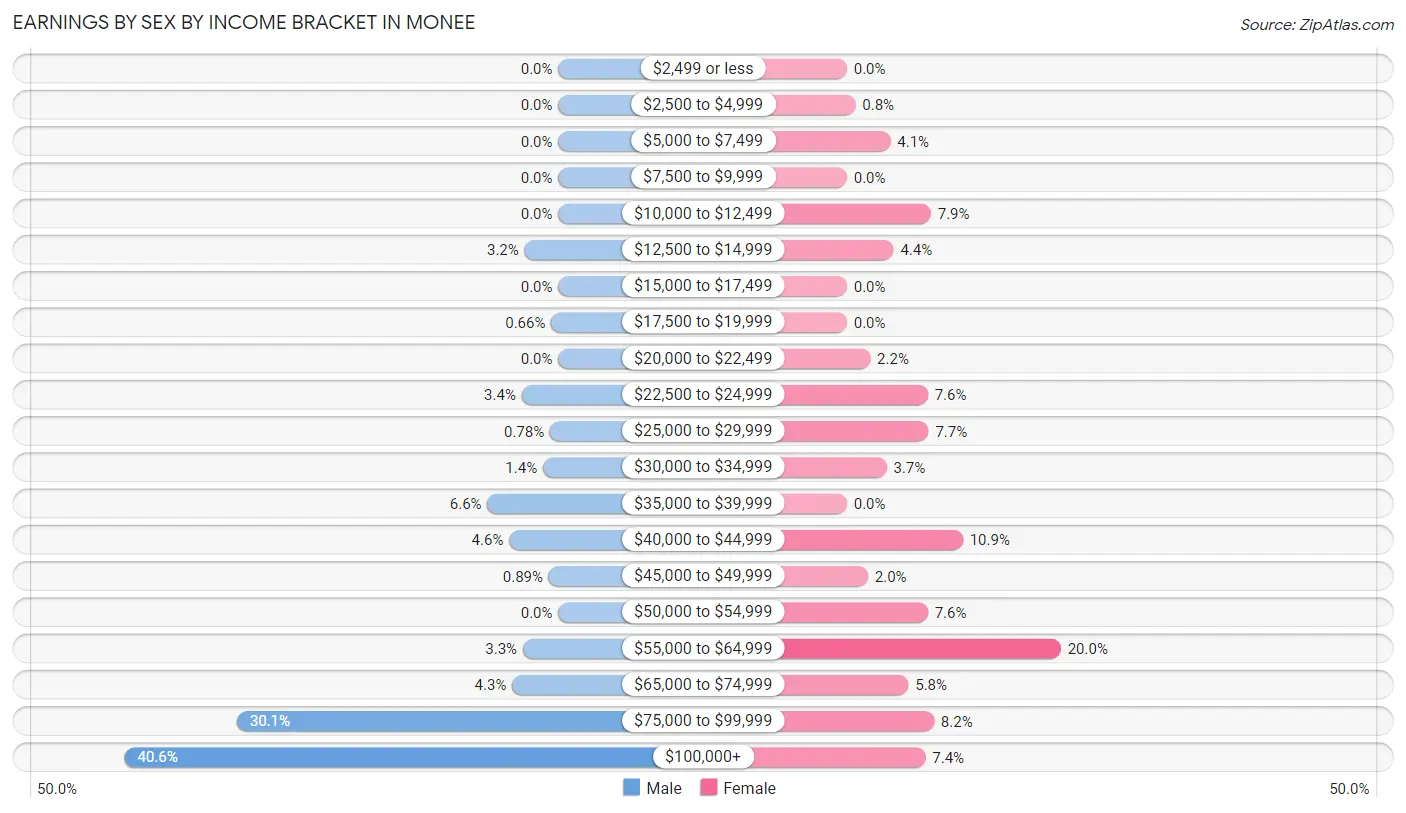
| Income | Male | Female |
| $2,499 or less | 0 (0.0%) | 0 (0.0%) |
| $2,500 to $4,999 | 0 (0.0%) | 11 (0.8%) |
| $5,000 to $7,499 | 0 (0.0%) | 56 (4.1%) |
| $7,500 to $9,999 | 0 (0.0%) | 0 (0.0%) |
| $10,000 to $12,499 | 0 (0.0%) | 108 (7.9%) |
| $12,500 to $14,999 | 57 (3.2%) | 60 (4.4%) |
| $15,000 to $17,499 | 0 (0.0%) | 0 (0.0%) |
| $17,500 to $19,999 | 12 (0.7%) | 0 (0.0%) |
| $20,000 to $22,499 | 0 (0.0%) | 30 (2.2%) |
| $22,500 to $24,999 | 62 (3.4%) | 104 (7.6%) |
| $25,000 to $29,999 | 14 (0.8%) | 105 (7.6%) |
| $30,000 to $34,999 | 26 (1.4%) | 51 (3.7%) |
| $35,000 to $39,999 | 120 (6.6%) | 0 (0.0%) |
| $40,000 to $44,999 | 83 (4.6%) | 149 (10.9%) |
| $45,000 to $49,999 | 16 (0.9%) | 27 (2.0%) |
| $50,000 to $54,999 | 0 (0.0%) | 104 (7.6%) |
| $55,000 to $64,999 | 60 (3.3%) | 275 (20.0%) |
| $65,000 to $74,999 | 78 (4.3%) | 79 (5.8%) |
| $75,000 to $99,999 | 544 (30.1%) | 112 (8.2%) |
| $100,000+ | 734 (40.6%) | 101 (7.4%) |
| Total | 1,806 (100.0%) | 1,372 (100.0%) |
Earnings by Sex by Educational Attainment in Monee
Average earnings in Monee are $86,815 for men and $46,111 for women, a difference of 46.9%. Men with an educational attainment of high school diploma enjoy the highest average annual earnings of $125,284, while those with college or associate's degree education earn the least with $86,173. Women with an educational attainment of college or associate's degree earn the most with the average annual earnings of $58,588, while those with bachelor's degree education have the smallest earnings of $32,012.
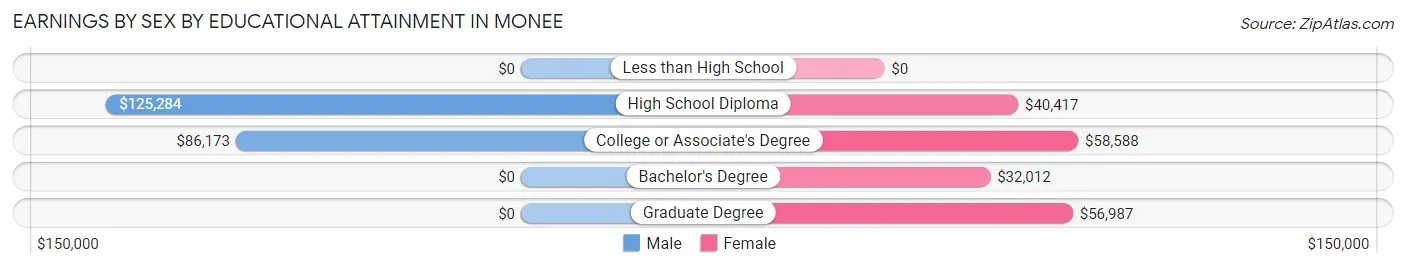
| Educational Attainment | Male Income | Female Income |
| Less than High School | - | - |
| High School Diploma | $125,284 | $40,417 |
| College or Associate's Degree | $86,173 | $58,588 |
| Bachelor's Degree | - | - |
| Graduate Degree | - | - |
| Total | $86,815 | $46,111 |
Family Income in Monee
Family Income Brackets in Monee
According to the Monee family income data, there are 382 families falling into the $200,000+ income range, which is the most common income bracket and makes up 28.5% of all families.
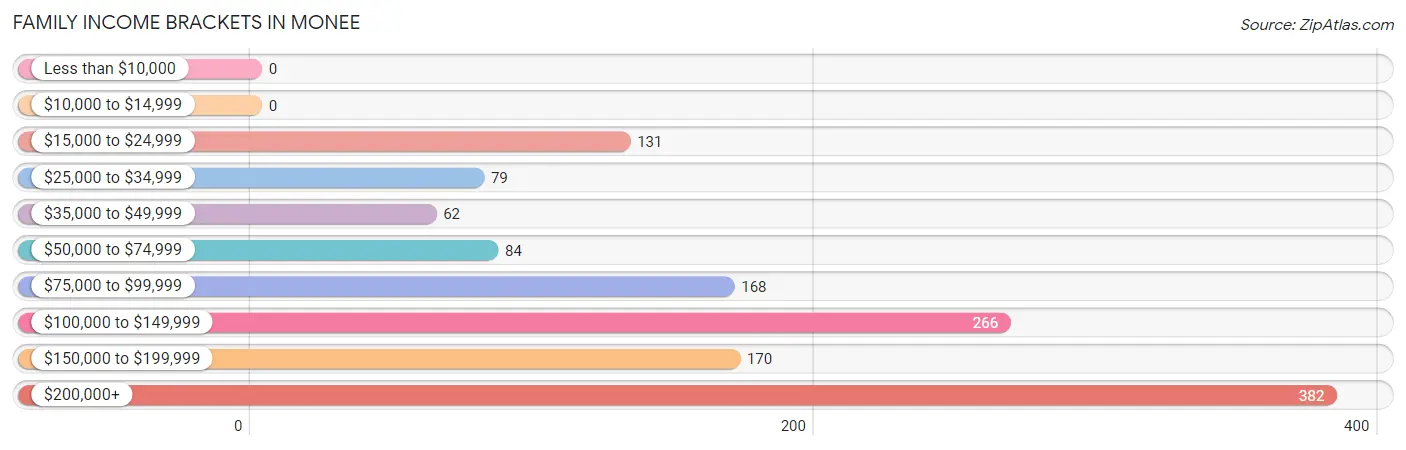
| Income Bracket | # Families | % Families |
| Less than $10,000 | 0 | 0.0% |
| $10,000 to $14,999 | 0 | 0.0% |
| $15,000 to $24,999 | 131 | 9.8% |
| $25,000 to $34,999 | 79 | 5.9% |
| $35,000 to $49,999 | 62 | 4.6% |
| $50,000 to $74,999 | 84 | 6.3% |
| $75,000 to $99,999 | 168 | 12.5% |
| $100,000 to $149,999 | 266 | 19.8% |
| $150,000 to $199,999 | 170 | 12.7% |
| $200,000+ | 382 | 28.5% |
Family Income by Famaliy Size in Monee
4-person families (158 | 11.8%) account for the highest median family income in Monee with $146,000 per family, while 2-person families (948 | 70.7%) have the highest median income of $55,338 per family member.
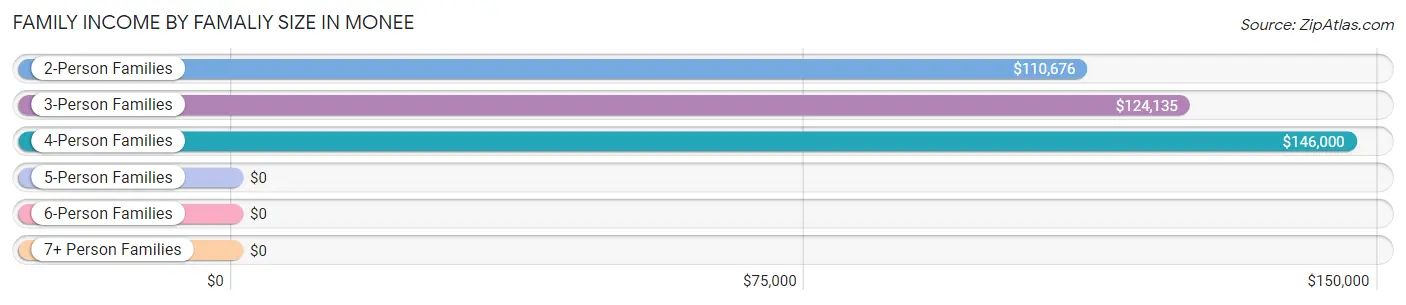
| Income Bracket | # Families | Median Income |
| 2-Person Families | 948 (70.7%) | $110,676 |
| 3-Person Families | 235 (17.5%) | $124,135 |
| 4-Person Families | 158 (11.8%) | $146,000 |
| 5-Person Families | 0 (0.0%) | $0 |
| 6-Person Families | 0 (0.0%) | $0 |
| 7+ Person Families | 0 (0.0%) | $0 |
| Total | 1,341 (100.0%) | $115,129 |
Family Income by Number of Earners in Monee
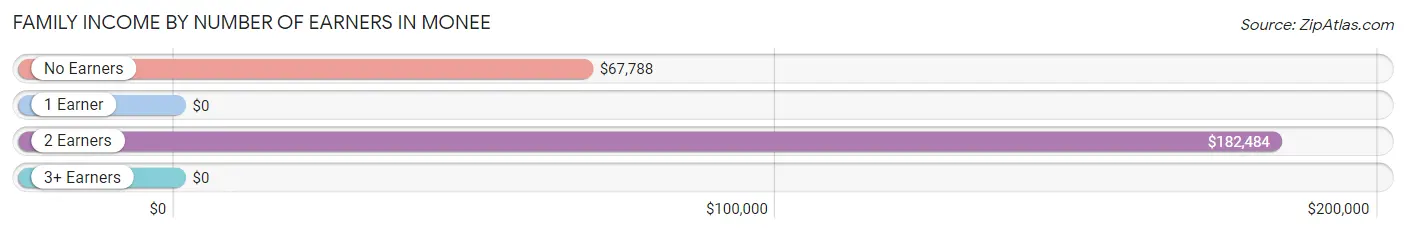
| Number of Earners | # Families | Median Income |
| No Earners | 155 (11.6%) | $67,788 |
| 1 Earner | 362 (27.0%) | $0 |
| 2 Earners | 777 (57.9%) | $182,484 |
| 3+ Earners | 47 (3.5%) | $0 |
| Total | 1,341 (100.0%) | $115,129 |
Household Income in Monee
Household Income Brackets in Monee
With 581 households falling in the category, the $75,000 to $99,999 income range is the most frequent in Monee, accounting for 23.9% of all households.
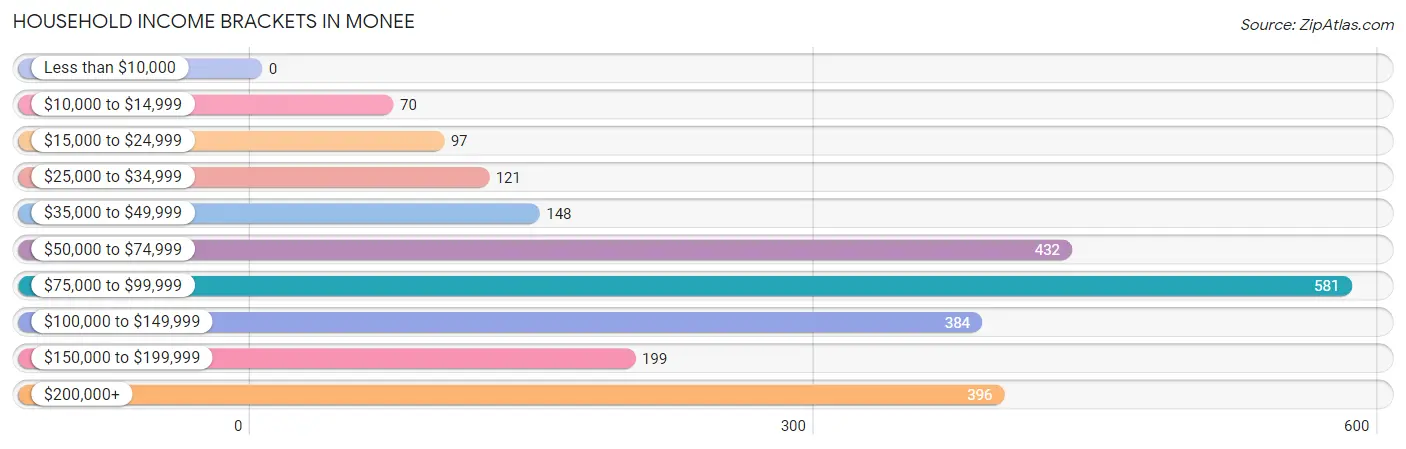
| Income Bracket | # Households | % Households |
| Less than $10,000 | 0 | 0.0% |
| $10,000 to $14,999 | 70 | 2.9% |
| $15,000 to $24,999 | 97 | 4.0% |
| $25,000 to $34,999 | 121 | 5.0% |
| $35,000 to $49,999 | 148 | 6.1% |
| $50,000 to $74,999 | 432 | 17.8% |
| $75,000 to $99,999 | 581 | 23.9% |
| $100,000 to $149,999 | 384 | 15.8% |
| $150,000 to $199,999 | 199 | 8.2% |
| $200,000+ | 396 | 16.3% |
Household Income by Householder Age in Monee
The median household income in Monee is $86,849, with the highest median household income of $121,000 found in the 45 to 64 years age bracket for the primary householder. A total of 1,136 households (46.8%) fall into this category.
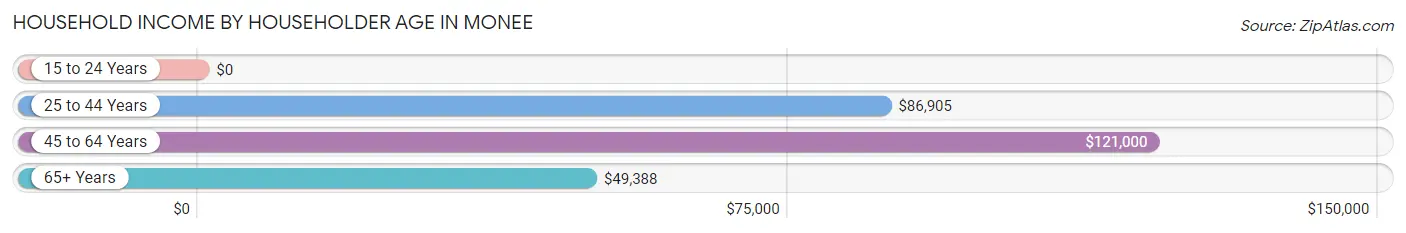
| Income Bracket | # Households | Median Income |
| 15 to 24 Years | 0 (0.0%) | $0 |
| 25 to 44 Years | 761 (31.3%) | $86,905 |
| 45 to 64 Years | 1,136 (46.8%) | $121,000 |
| 65+ Years | 532 (21.9%) | $49,388 |
| Total | 2,429 (100.0%) | $86,849 |
Poverty in Monee
Income Below Poverty by Sex and Age in Monee
With 8.9% poverty level for males and 1.9% for females among the residents of Monee, 25 to 34 year old males and 25 to 34 year old females are the most vulnerable to poverty, with 229 males (26.6%) and 26 females (6.2%) in their respective age groups living below the poverty level.
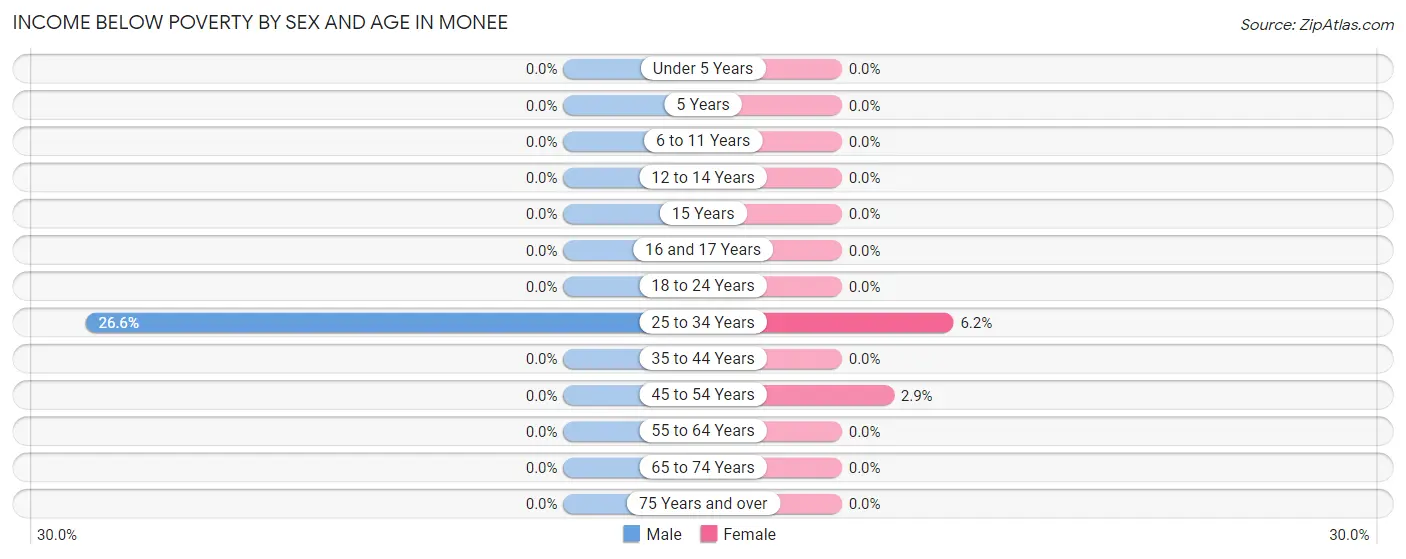
| Age Bracket | Male | Female |
| Under 5 Years | 0 (0.0%) | 0 (0.0%) |
| 5 Years | 0 (0.0%) | 0 (0.0%) |
| 6 to 11 Years | 0 (0.0%) | 0 (0.0%) |
| 12 to 14 Years | 0 (0.0%) | 0 (0.0%) |
| 15 Years | 0 (0.0%) | 0 (0.0%) |
| 16 and 17 Years | 0 (0.0%) | 0 (0.0%) |
| 18 to 24 Years | 0 (0.0%) | 0 (0.0%) |
| 25 to 34 Years | 229 (26.6%) | 26 (6.2%) |
| 35 to 44 Years | 0 (0.0%) | 0 (0.0%) |
| 45 to 54 Years | 0 (0.0%) | 18 (2.9%) |
| 55 to 64 Years | 0 (0.0%) | 0 (0.0%) |
| 65 to 74 Years | 0 (0.0%) | 0 (0.0%) |
| 75 Years and over | 0 (0.0%) | 0 (0.0%) |
| Total | 229 (8.9%) | 44 (1.9%) |
Income Above Poverty by Sex and Age in Monee
According to the poverty statistics in Monee, males aged under 5 years and females aged under 5 years are the age groups that are most secure financially, with 100.0% of males and 100.0% of females in these age groups living above the poverty line.
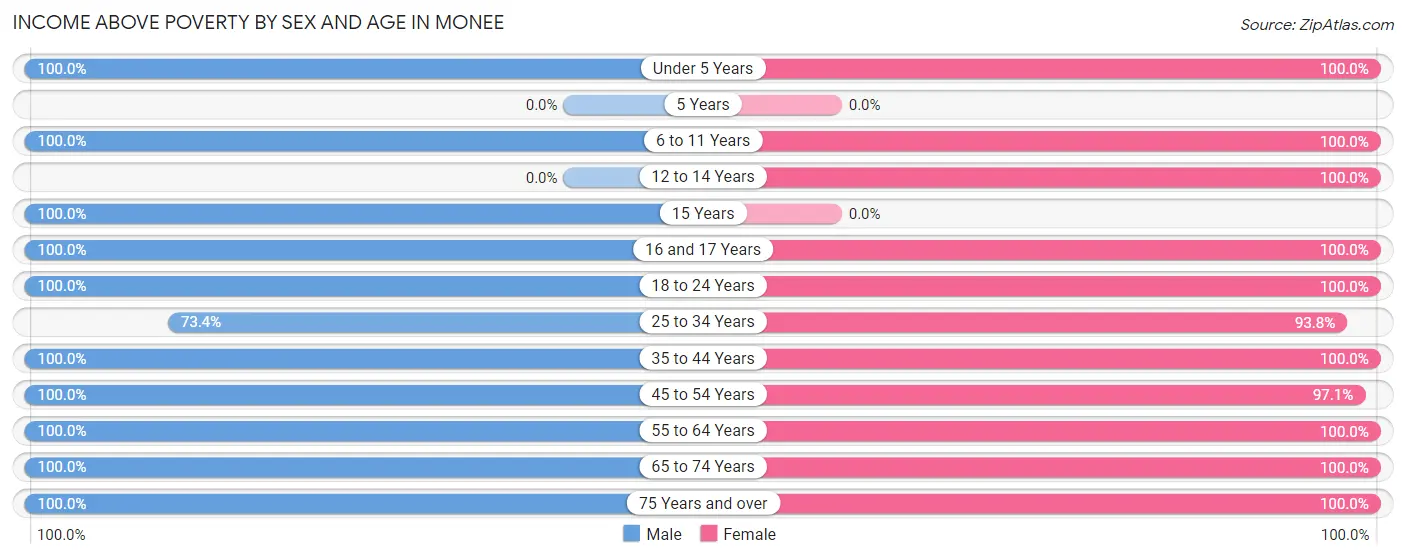
| Age Bracket | Male | Female |
| Under 5 Years | 126 (100.0%) | 32 (100.0%) |
| 5 Years | 0 (0.0%) | 0 (0.0%) |
| 6 to 11 Years | 10 (100.0%) | 116 (100.0%) |
| 12 to 14 Years | 0 (0.0%) | 29 (100.0%) |
| 15 Years | 6 (100.0%) | 0 (0.0%) |
| 16 and 17 Years | 40 (100.0%) | 13 (100.0%) |
| 18 to 24 Years | 105 (100.0%) | 26 (100.0%) |
| 25 to 34 Years | 632 (73.4%) | 392 (93.8%) |
| 35 to 44 Years | 341 (100.0%) | 46 (100.0%) |
| 45 to 54 Years | 289 (100.0%) | 602 (97.1%) |
| 55 to 64 Years | 578 (100.0%) | 416 (100.0%) |
| 65 to 74 Years | 107 (100.0%) | 250 (100.0%) |
| 75 Years and over | 100 (100.0%) | 354 (100.0%) |
| Total | 2,334 (91.1%) | 2,276 (98.1%) |
Income Below Poverty Among Married-Couple Families in Monee
| Children | Above Poverty | Below Poverty |
| No Children | 859 (100.0%) | 0 (0.0%) |
| 1 or 2 Children | 180 (100.0%) | 0 (0.0%) |
| 3 or 4 Children | 0 (0.0%) | 0 (0.0%) |
| 5 or more Children | 0 (0.0%) | 0 (0.0%) |
| Total | 1,039 (100.0%) | 0 (0.0%) |
Income Below Poverty Among Single-Parent Households in Monee
| Children | Single Father | Single Mother |
| No Children | 0 (0.0%) | 0 (0.0%) |
| 1 or 2 Children | 0 (0.0%) | 0 (0.0%) |
| 3 or 4 Children | 0 (0.0%) | 0 (0.0%) |
| 5 or more Children | 0 (0.0%) | 0 (0.0%) |
| Total | 0 (0.0%) | 0 (0.0%) |
Income Below Poverty Among Married-Couple vs Single-Parent Households in Monee
| Children | Married-Couple Families | Single-Parent Households |
| No Children | 0 (0.0%) | 0 (0.0%) |
| 1 or 2 Children | 0 (0.0%) | 0 (0.0%) |
| 3 or 4 Children | 0 (0.0%) | 0 (0.0%) |
| 5 or more Children | 0 (0.0%) | 0 (0.0%) |
| Total | 0 (0.0%) | 0 (0.0%) |
Race in Monee
The most populous races in Monee are White / Caucasian (2,711 | 52.9%), Black / African American (1,436 | 28.1%), and Hispanic or Latino (971 | 19.0%).
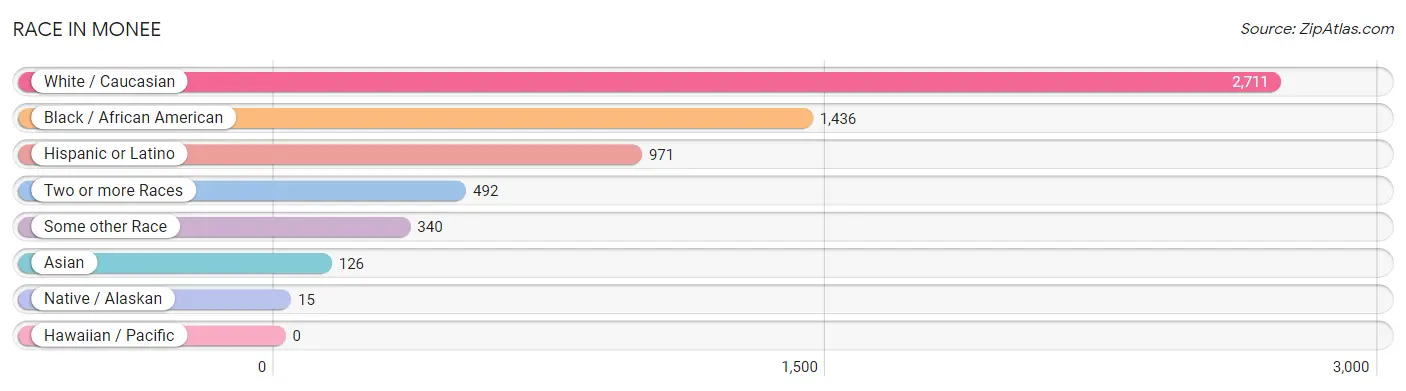
| Race | # Population | % Population |
| Asian | 126 | 2.5% |
| Black / African American | 1,436 | 28.1% |
| Hawaiian / Pacific | 0 | 0.0% |
| Hispanic or Latino | 971 | 19.0% |
| Native / Alaskan | 15 | 0.3% |
| White / Caucasian | 2,711 | 52.9% |
| Two or more Races | 492 | 9.6% |
| Some other Race | 340 | 6.6% |
| Total | 5,120 | 100.0% |
Ancestry in Monee
The most populous ancestries reported in Monee are Mexican (806 | 15.7%), German (691 | 13.5%), Irish (453 | 8.8%), Polish (413 | 8.1%), and African (356 | 7.0%), together accounting for 53.1% of all Monee residents.
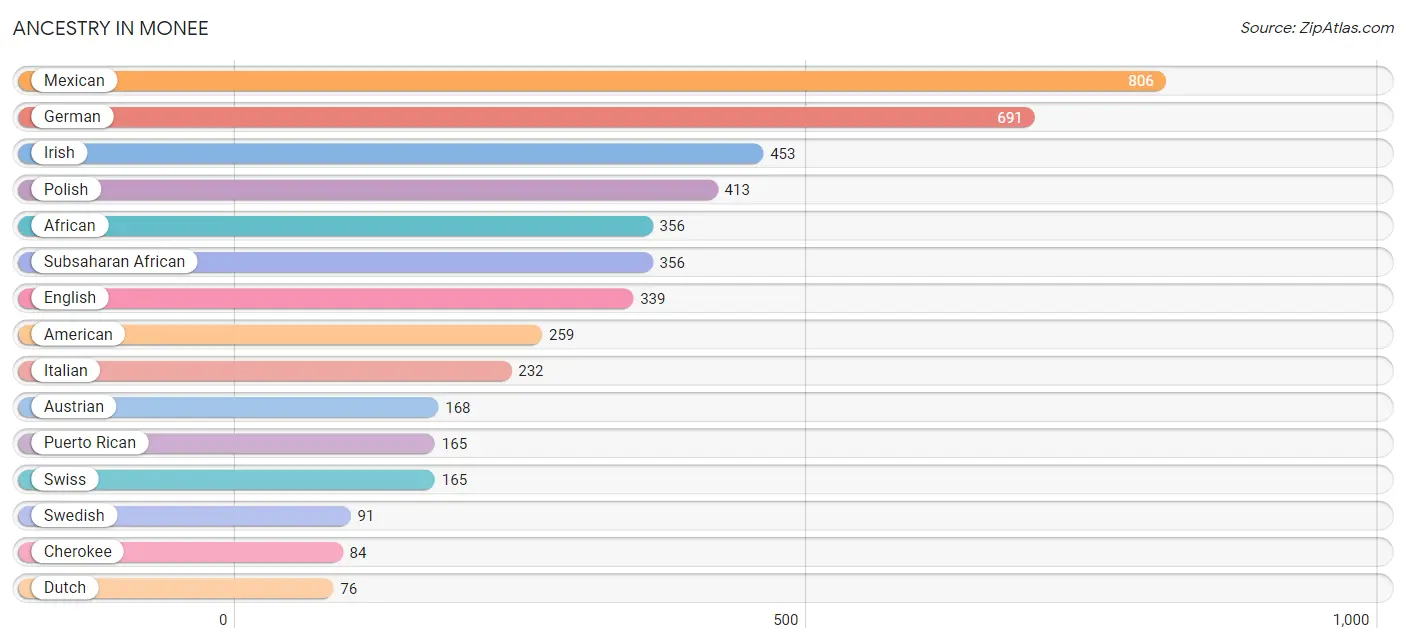
| Ancestry | # Population | % Population |
| African | 356 | 7.0% |
| American | 259 | 5.1% |
| Arab | 28 | 0.5% |
| Austrian | 168 | 3.3% |
| Cherokee | 84 | 1.6% |
| Croatian | 10 | 0.2% |
| Dutch | 76 | 1.5% |
| English | 339 | 6.6% |
| French | 21 | 0.4% |
| French Canadian | 15 | 0.3% |
| German | 691 | 13.5% |
| Hungarian | 11 | 0.2% |
| Irish | 453 | 8.8% |
| Italian | 232 | 4.5% |
| Korean | 64 | 1.3% |
| Lithuanian | 68 | 1.3% |
| Mexican | 806 | 15.7% |
| Mexican American Indian | 18 | 0.4% |
| Moroccan | 28 | 0.5% |
| Norwegian | 24 | 0.5% |
| Polish | 413 | 8.1% |
| Puerto Rican | 165 | 3.2% |
| Romanian | 31 | 0.6% |
| Russian | 63 | 1.2% |
| Scottish | 14 | 0.3% |
| Slovene | 39 | 0.8% |
| Subsaharan African | 356 | 7.0% |
| Swedish | 91 | 1.8% |
| Swiss | 165 | 3.2% |
| Thai | 62 | 1.2% | View All 30 Rows |
Immigrants in Monee
The most numerous immigrant groups reported in Monee came from Central America (510 | 10.0%), Latin America (510 | 10.0%), Mexico (510 | 10.0%), Africa (270 | 5.3%), and Morocco (257 | 5.0%), together accounting for 40.2% of all Monee residents.
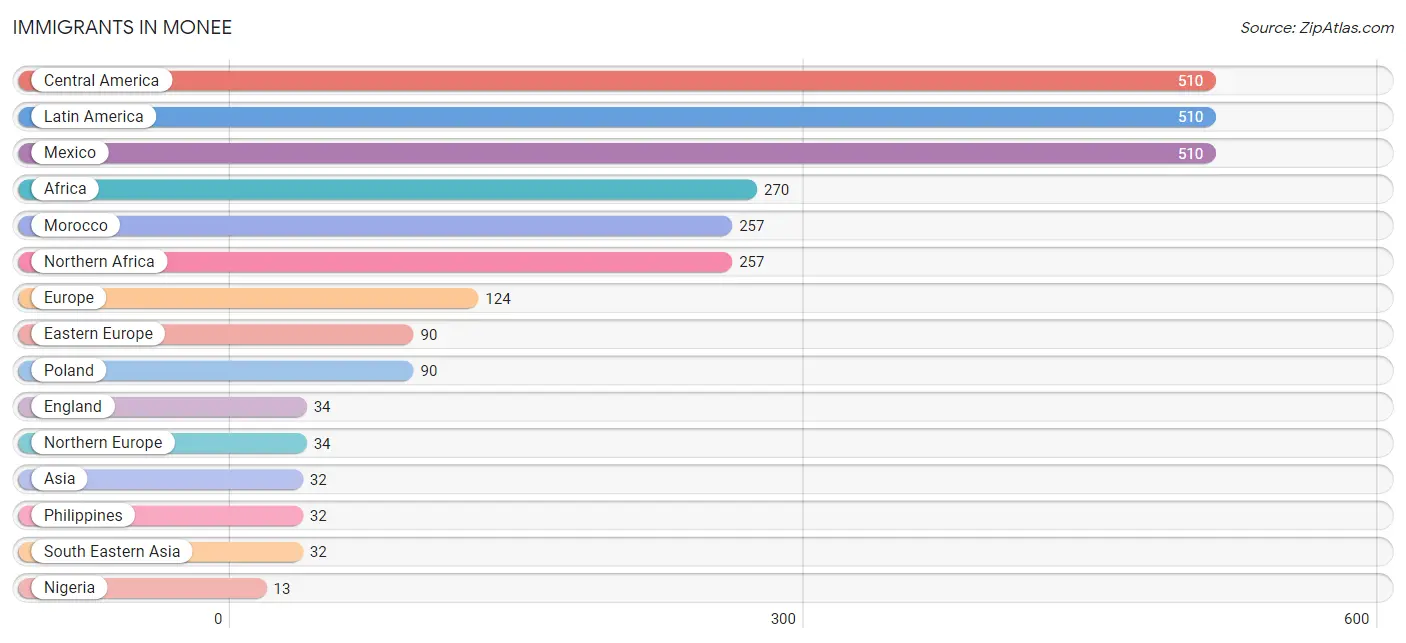
| Immigration Origin | # Population | % Population |
| Africa | 270 | 5.3% |
| Asia | 32 | 0.6% |
| Central America | 510 | 10.0% |
| Eastern Europe | 90 | 1.8% |
| England | 34 | 0.7% |
| Europe | 124 | 2.4% |
| Latin America | 510 | 10.0% |
| Mexico | 510 | 10.0% |
| Morocco | 257 | 5.0% |
| Nigeria | 13 | 0.3% |
| Northern Africa | 257 | 5.0% |
| Northern Europe | 34 | 0.7% |
| Philippines | 32 | 0.6% |
| Poland | 90 | 1.8% |
| South Eastern Asia | 32 | 0.6% |
| Western Africa | 13 | 0.3% | View All 16 Rows |
Sex and Age in Monee
Sex and Age in Monee
The most populous age groups in Monee are 25 to 29 Years (714 | 27.8%) for men and 50 to 54 Years (458 | 17.9%) for women.
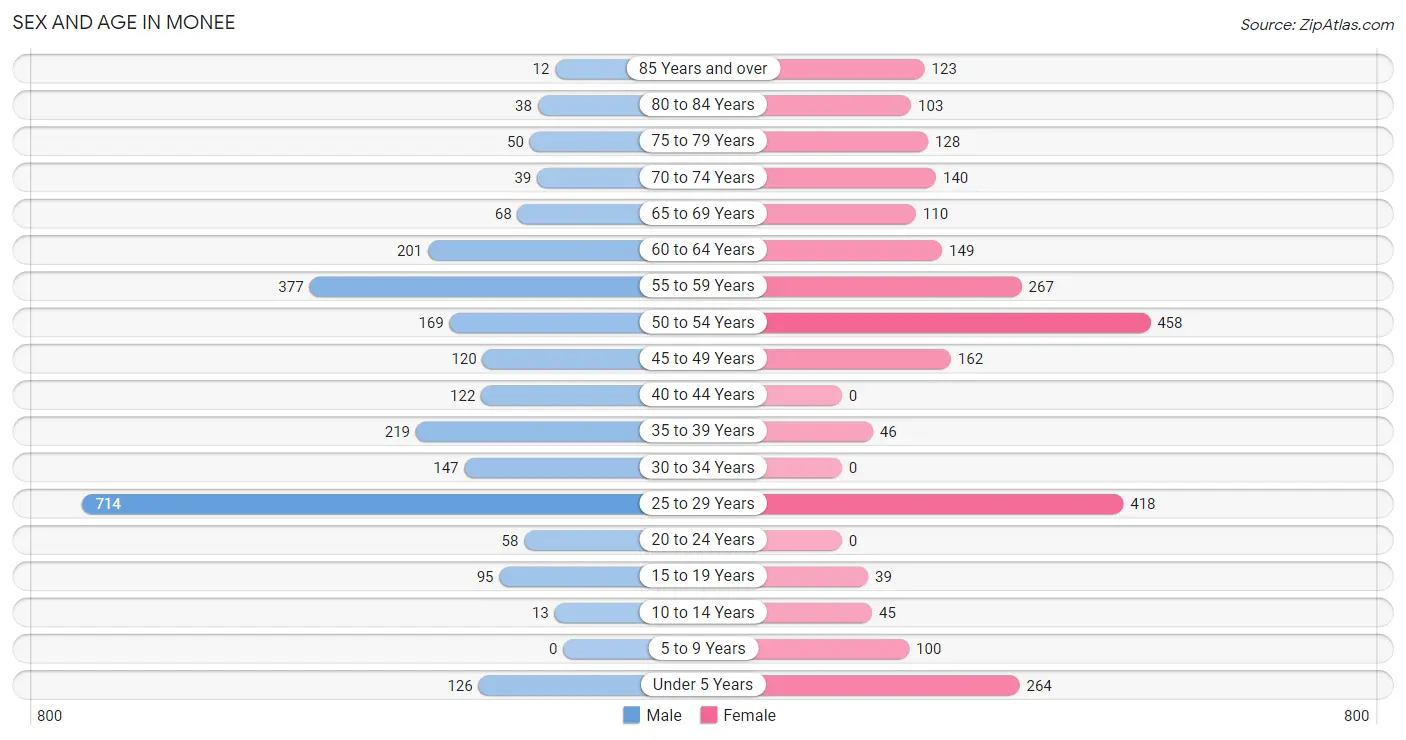
| Age Bracket | Male | Female |
| Under 5 Years | 126 (4.9%) | 264 (10.3%) |
| 5 to 9 Years | 0 (0.0%) | 100 (3.9%) |
| 10 to 14 Years | 13 (0.5%) | 45 (1.8%) |
| 15 to 19 Years | 95 (3.7%) | 39 (1.5%) |
| 20 to 24 Years | 58 (2.3%) | 0 (0.0%) |
| 25 to 29 Years | 714 (27.8%) | 418 (16.4%) |
| 30 to 34 Years | 147 (5.7%) | 0 (0.0%) |
| 35 to 39 Years | 219 (8.5%) | 46 (1.8%) |
| 40 to 44 Years | 122 (4.8%) | 0 (0.0%) |
| 45 to 49 Years | 120 (4.7%) | 162 (6.4%) |
| 50 to 54 Years | 169 (6.6%) | 458 (17.9%) |
| 55 to 59 Years | 377 (14.7%) | 267 (10.5%) |
| 60 to 64 Years | 201 (7.8%) | 149 (5.8%) |
| 65 to 69 Years | 68 (2.6%) | 110 (4.3%) |
| 70 to 74 Years | 39 (1.5%) | 140 (5.5%) |
| 75 to 79 Years | 50 (1.9%) | 128 (5.0%) |
| 80 to 84 Years | 38 (1.5%) | 103 (4.0%) |
| 85 Years and over | 12 (0.5%) | 123 (4.8%) |
| Total | 2,568 (100.0%) | 2,552 (100.0%) |
Families and Households in Monee
Median Family Size in Monee
The median family size in Monee is 2.53 persons per family, with single male/father families (34 | 2.5%) accounting for the largest median family size of 3.94 persons per family. On the other hand, single female/mother families (268 | 20.0%) represent the smallest median family size with 2.45 persons per family.
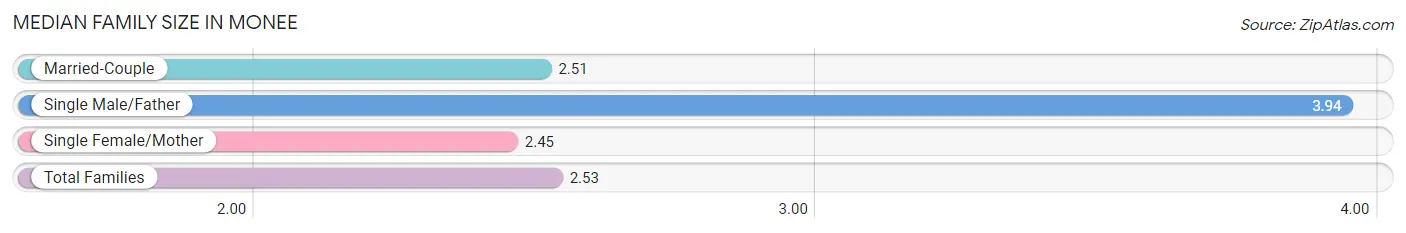
| Family Type | # Families | Family Size |
| Married-Couple | 1,039 (77.5%) | 2.51 |
| Single Male/Father | 34 (2.5%) | 3.94 |
| Single Female/Mother | 268 (20.0%) | 2.45 |
| Total Families | 1,341 (100.0%) | 2.53 |
Median Household Size in Monee
The median household size in Monee is 2.11 persons per household, with single male/father households (34 | 1.4%) accounting for the largest median household size of 4.71 persons per household. non-family households (1,088 | 44.8%) represent the smallest median household size with 1.48 persons per household.
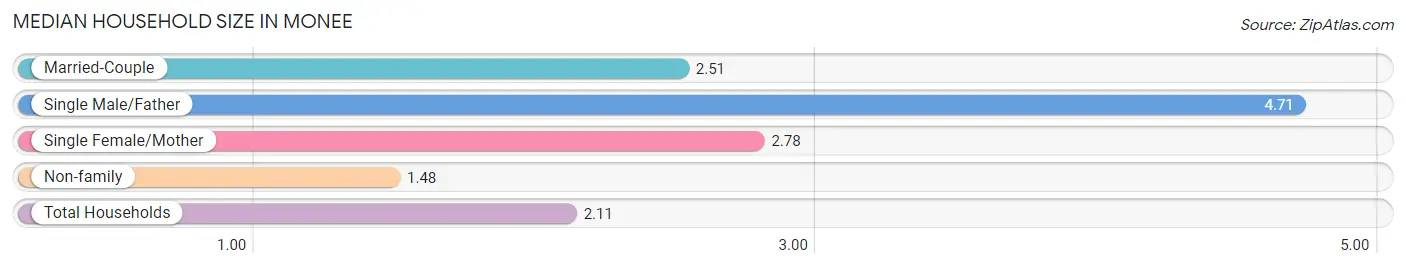
| Household Type | # Households | Household Size |
| Married-Couple | 1,039 (42.8%) | 2.51 |
| Single Male/Father | 34 (1.4%) | 4.71 |
| Single Female/Mother | 268 (11.0%) | 2.78 |
| Non-family | 1,088 (44.8%) | 1.48 |
| Total Households | 2,429 (100.0%) | 2.11 |
Household Size by Marriage Status in Monee
Out of a total of 2,429 households in Monee, 1,341 (55.2%) are family households, while 1,088 (44.8%) are nonfamily households. The most numerous type of family households are 2-person households, comprising 857, and the most common type of nonfamily households are 1-person households, comprising 722.
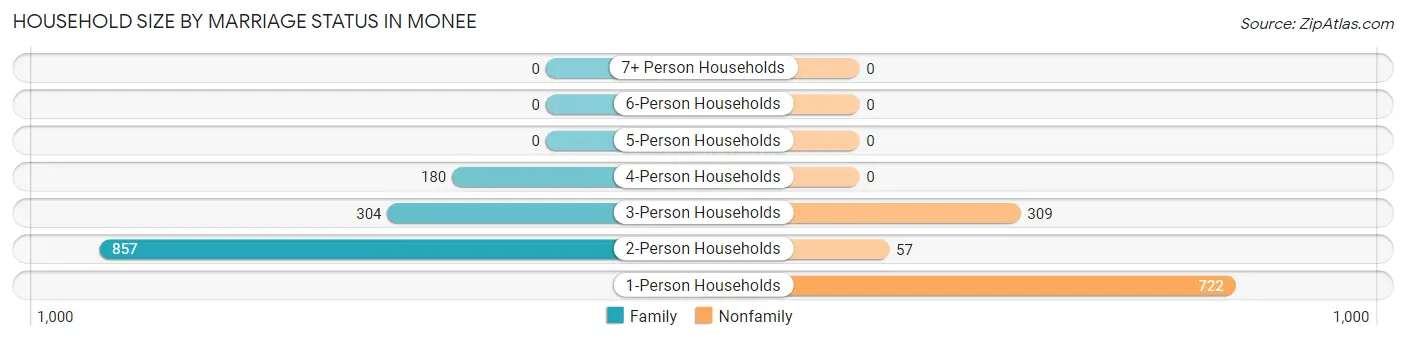
| Household Size | Family Households | Nonfamily Households |
| 1-Person Households | - | 722 (29.7%) |
| 2-Person Households | 857 (35.3%) | 57 (2.4%) |
| 3-Person Households | 304 (12.5%) | 309 (12.7%) |
| 4-Person Households | 180 (7.4%) | 0 (0.0%) |
| 5-Person Households | 0 (0.0%) | 0 (0.0%) |
| 6-Person Households | 0 (0.0%) | 0 (0.0%) |
| 7+ Person Households | 0 (0.0%) | 0 (0.0%) |
| Total | 1,341 (55.2%) | 1,088 (44.8%) |
Female Fertility in Monee
Fertility by Age in Monee
Average fertility rate in Monee is 169.0 births per 1,000 women. Women in the age bracket of 20 to 34 years have the highest fertility rate with 280.0 births per 1,000 women. Women in the age bracket of 20 to 34 years acount for 100.0% of all women with births.
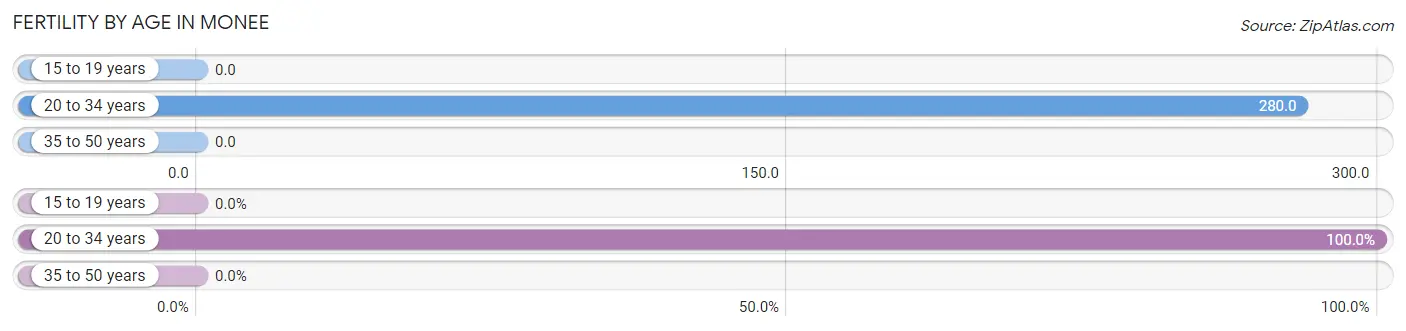
| Age Bracket | Women with Births | Births / 1,000 Women |
| 15 to 19 years | 0 (0.0%) | 0.0 |
| 20 to 34 years | 117 (100.0%) | 280.0 |
| 35 to 50 years | 0 (0.0%) | 0.0 |
| Total | 117 (100.0%) | 169.0 |
Fertility by Age by Marriage Status in Monee
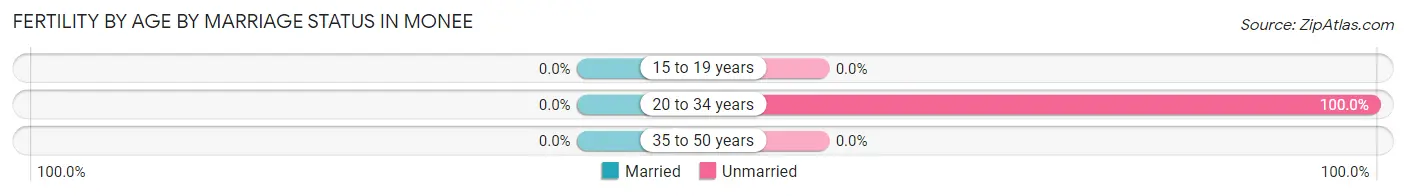
| Age Bracket | Married | Unmarried |
| 15 to 19 years | 0 (0.0%) | 0 (0.0%) |
| 20 to 34 years | 0 (0.0%) | 117 (100.0%) |
| 35 to 50 years | 0 (0.0%) | 0 (0.0%) |
| Total | 0 (0.0%) | 117 (100.0%) |
Fertility by Education in Monee
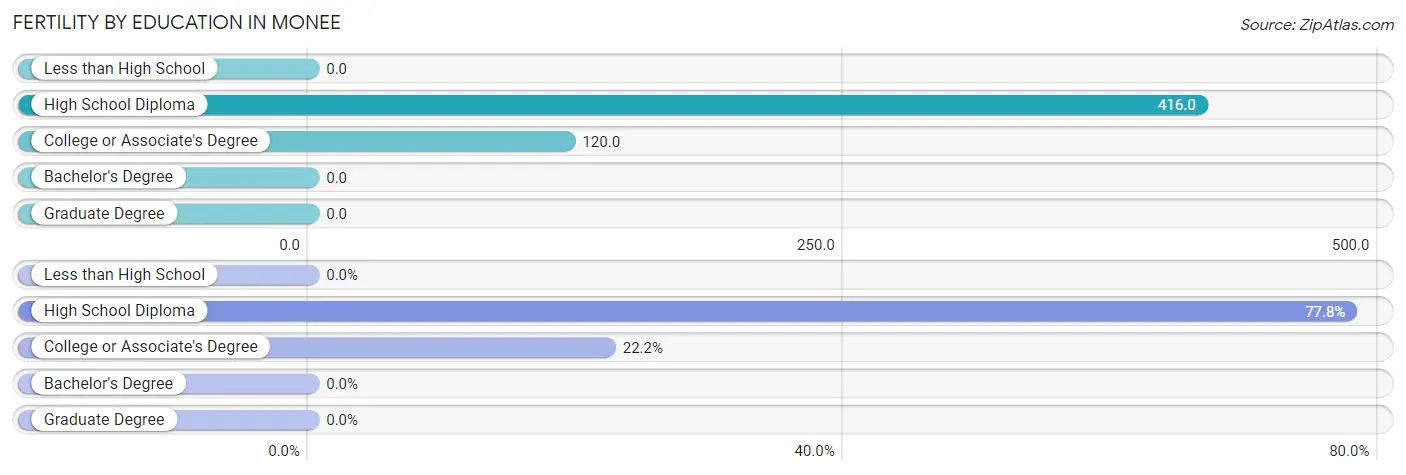
| Educational Attainment | Women with Births | Births / 1,000 Women |
| Less than High School | 0 (0.0%) | 0.0 |
| High School Diploma | 91 (77.8%) | 416.0 |
| College or Associate's Degree | 26 (22.2%) | 120.0 |
| Bachelor's Degree | 0 (0.0%) | 0.0 |
| Graduate Degree | 0 (0.0%) | 0.0 |
| Total | 117 (100.0%) | 169.0 |
Fertility by Education by Marriage Status in Monee
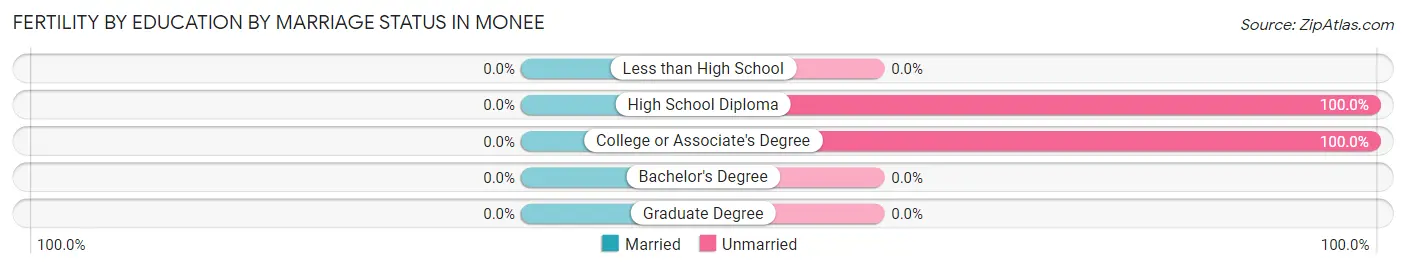
| Educational Attainment | Married | Unmarried |
| Less than High School | 0 (0.0%) | 0 (0.0%) |
| High School Diploma | 0 (0.0%) | 91 (100.0%) |
| College or Associate's Degree | 0 (0.0%) | 26 (100.0%) |
| Bachelor's Degree | 0 (0.0%) | 0 (0.0%) |
| Graduate Degree | 0 (0.0%) | 0 (0.0%) |
| Total | 0 (0.0%) | 117 (100.0%) |
Employment Characteristics in Monee
Employment by Class of Employer in Monee
Among the 3,091 employed individuals in Monee, private company employees (2,526 | 81.7%), local government employees (191 | 6.2%), and not-for-profit organizations (176 | 5.7%) make up the most common classes of employment.
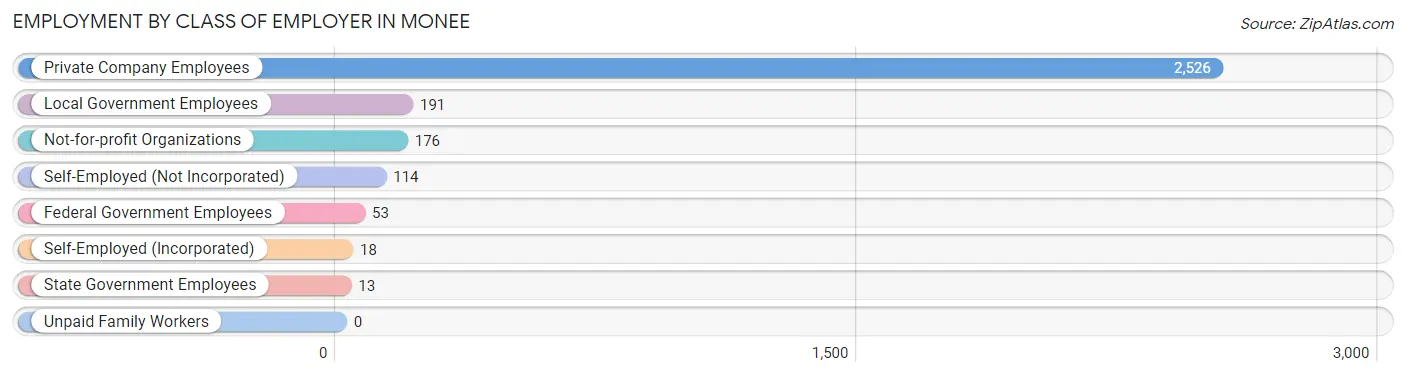
| Employer Class | # Employees | % Employees |
| Private Company Employees | 2,526 | 81.7% |
| Self-Employed (Incorporated) | 18 | 0.6% |
| Self-Employed (Not Incorporated) | 114 | 3.7% |
| Not-for-profit Organizations | 176 | 5.7% |
| Local Government Employees | 191 | 6.2% |
| State Government Employees | 13 | 0.4% |
| Federal Government Employees | 53 | 1.7% |
| Unpaid Family Workers | 0 | 0.0% |
| Total | 3,091 | 100.0% |
Employment Status by Age in Monee
According to the labor force statistics for Monee, out of the total population over 16 years of age (4,566), 69.2% or 3,160 individuals are in the labor force, with 1.6% or 51 of them unemployed. The age group with the highest labor force participation rate is 30 to 34 years, with 100.0% or 147 individuals in the labor force. Within the labor force, the 65 to 74 years age range has the highest percentage of unemployed individuals, with 18.5% or 12 of them being unemployed.
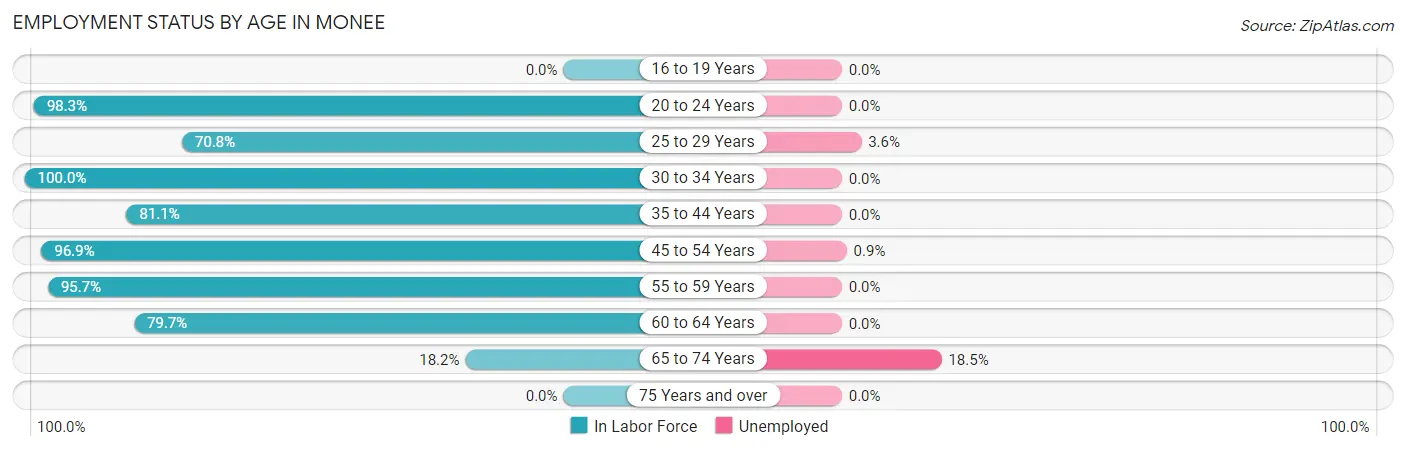
| Age Bracket | In Labor Force | Unemployed |
| 16 to 19 Years | 0 (0.0%) | 0 (0.0%) |
| 20 to 24 Years | 57 (98.3%) | 0 (0.0%) |
| 25 to 29 Years | 801 (70.8%) | 29 (3.6%) |
| 30 to 34 Years | 147 (100.0%) | 0 (0.0%) |
| 35 to 44 Years | 314 (81.1%) | 0 (0.0%) |
| 45 to 54 Years | 881 (96.9%) | 8 (0.9%) |
| 55 to 59 Years | 616 (95.7%) | 0 (0.0%) |
| 60 to 64 Years | 279 (79.7%) | 0 (0.0%) |
| 65 to 74 Years | 65 (18.2%) | 12 (18.5%) |
| 75 Years and over | 0 (0.0%) | 0 (0.0%) |
| Total | 3,160 (69.2%) | 51 (1.6%) |
Employment Status by Educational Attainment in Monee
According to labor force statistics for Monee, 85.1% of individuals (3,037) out of the total population between 25 and 64 years of age (3,569) are in the labor force, with 1.2% or 36 of them being unemployed. The group with the highest labor force participation rate are those with the educational attainment of college / associate degree, with 91.3% or 1,237 individuals in the labor force. Within the labor force, individuals with less than high school education have the highest percentage of unemployment, with 4.8% or 8 of them being unemployed.

| Educational Attainment | In Labor Force | Unemployed |
| Less than High School | 168 (84.4%) | 10 (4.8%) |
| High School Diploma | 956 (87.4%) | 0 (0.0%) |
| College / Associate Degree | 1,237 (91.3%) | 0 (0.0%) |
| Bachelor's Degree or higher | 677 (73.5%) | 40 (4.3%) |
| Total | 3,037 (85.1%) | 43 (1.2%) |
Employment Occupations by Sex in Monee
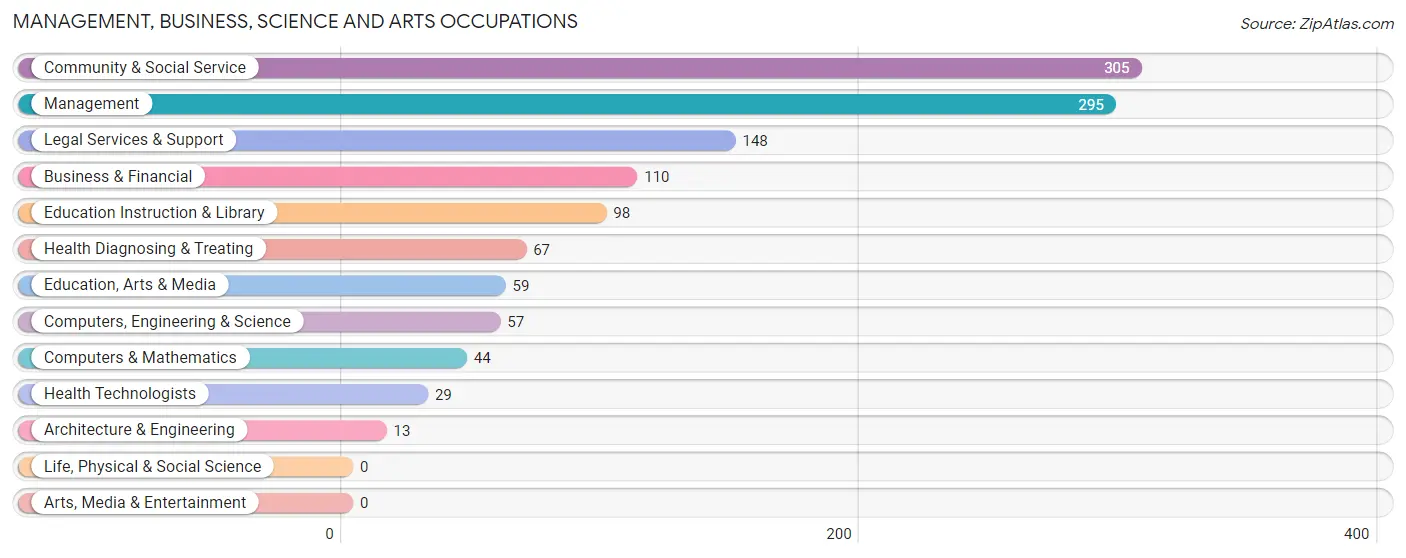
Management, Business, Science and Arts Occupations
The most common Management, Business, Science and Arts occupations in Monee are Community & Social Service (305 | 9.8%), Management (295 | 9.5%), Legal Services & Support (148 | 4.8%), Business & Financial (110 | 3.5%), and Education Instruction & Library (98 | 3.2%).
Management, Business, Science and Arts Occupations by Sex
Within the Management, Business, Science and Arts occupations in Monee, the most male-oriented occupations are Management (67.1%), Computers & Mathematics (61.4%), and Health Diagnosing & Treating (56.7%), while the most female-oriented occupations are Business & Financial (100.0%), Architecture & Engineering (100.0%), and Education, Arts & Media (100.0%).
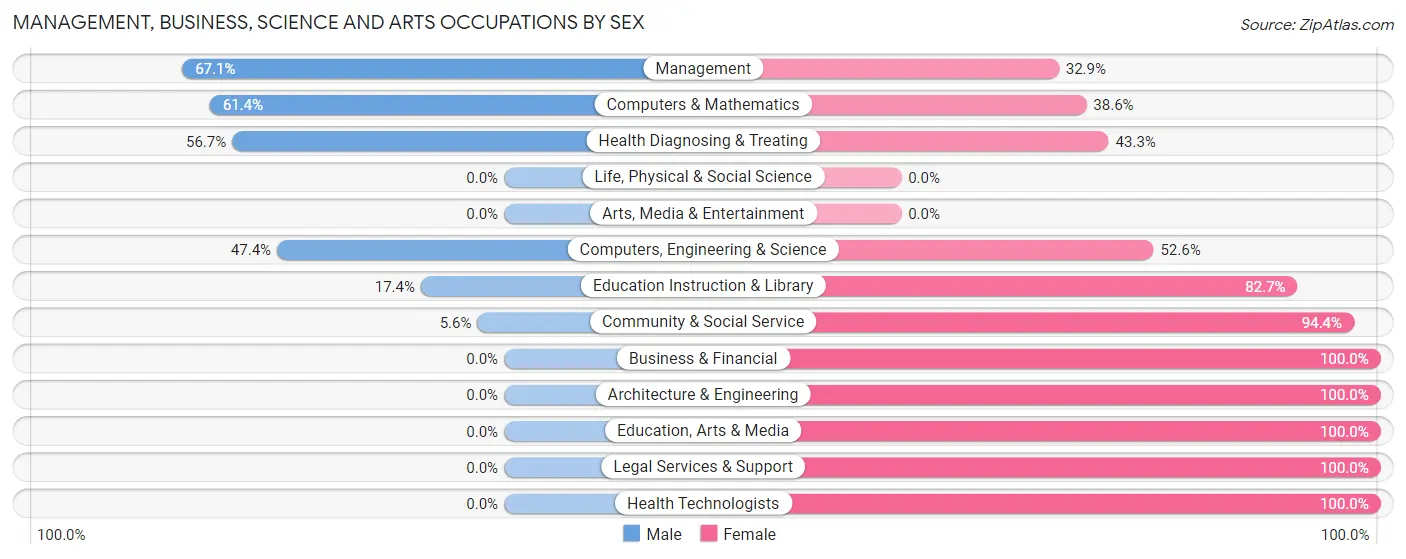
| Occupation | Male | Female |
| Management | 198 (67.1%) | 97 (32.9%) |
| Business & Financial | 0 (0.0%) | 110 (100.0%) |
| Computers, Engineering & Science | 27 (47.4%) | 30 (52.6%) |
| Computers & Mathematics | 27 (61.4%) | 17 (38.6%) |
| Architecture & Engineering | 0 (0.0%) | 13 (100.0%) |
| Life, Physical & Social Science | 0 (0.0%) | 0 (0.0%) |
| Community & Social Service | 17 (5.6%) | 288 (94.4%) |
| Education, Arts & Media | 0 (0.0%) | 59 (100.0%) |
| Legal Services & Support | 0 (0.0%) | 148 (100.0%) |
| Education Instruction & Library | 17 (17.3%) | 81 (82.7%) |
| Arts, Media & Entertainment | 0 (0.0%) | 0 (0.0%) |
| Health Diagnosing & Treating | 38 (56.7%) | 29 (43.3%) |
| Health Technologists | 0 (0.0%) | 29 (100.0%) |
| Total (Category) | 280 (33.6%) | 554 (66.4%) |
| Total (Overall) | 1,792 (57.6%) | 1,319 (42.4%) |
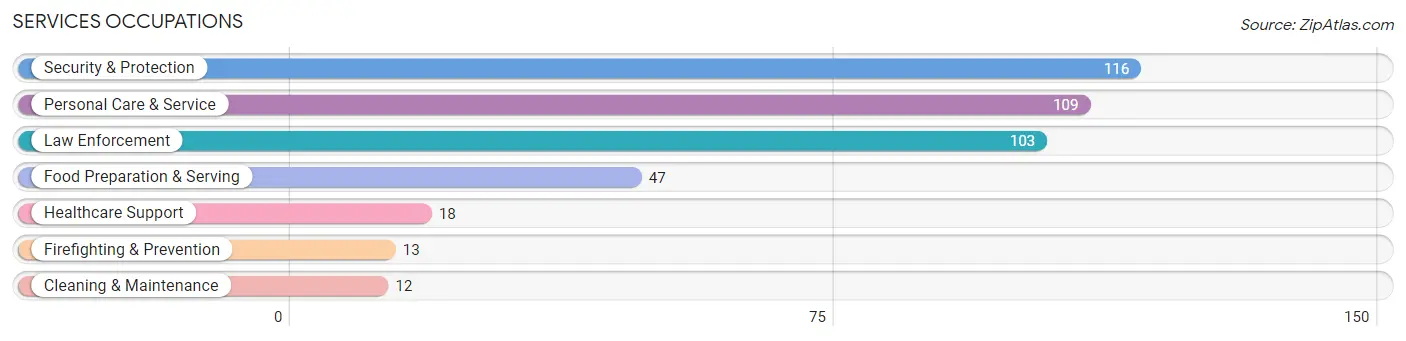
Services Occupations
The most common Services occupations in Monee are Security & Protection (116 | 3.7%), Personal Care & Service (109 | 3.5%), Law Enforcement (103 | 3.3%), Food Preparation & Serving (47 | 1.5%), and Healthcare Support (18 | 0.6%).
Services Occupations by Sex
Within the Services occupations in Monee, the most male-oriented occupations are Firefighting & Prevention (100.0%), Cleaning & Maintenance (100.0%), and Security & Protection (29.3%), while the most female-oriented occupations are Healthcare Support (100.0%), Food Preparation & Serving (100.0%), and Personal Care & Service (100.0%).
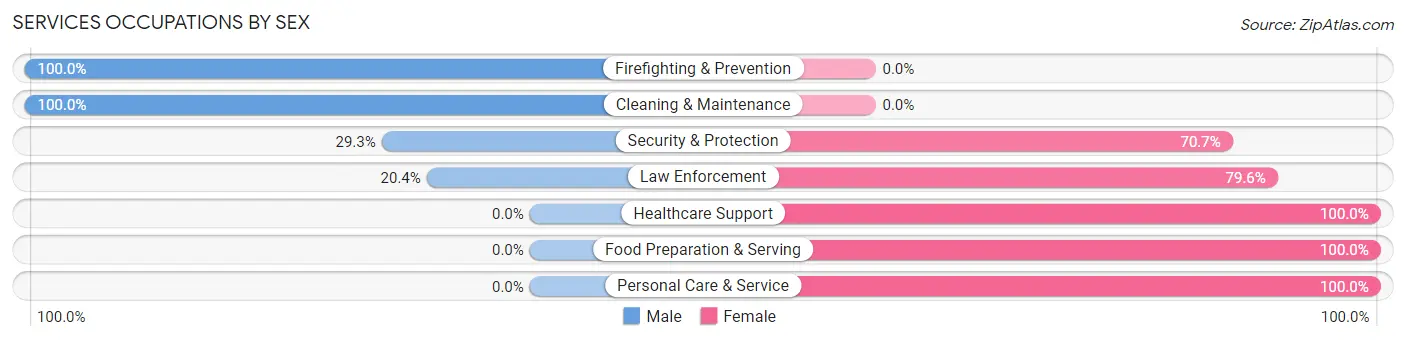
| Occupation | Male | Female |
| Healthcare Support | 0 (0.0%) | 18 (100.0%) |
| Security & Protection | 34 (29.3%) | 82 (70.7%) |
| Firefighting & Prevention | 13 (100.0%) | 0 (0.0%) |
| Law Enforcement | 21 (20.4%) | 82 (79.6%) |
| Food Preparation & Serving | 0 (0.0%) | 47 (100.0%) |
| Cleaning & Maintenance | 12 (100.0%) | 0 (0.0%) |
| Personal Care & Service | 0 (0.0%) | 109 (100.0%) |
| Total (Category) | 46 (15.2%) | 256 (84.8%) |
| Total (Overall) | 1,792 (57.6%) | 1,319 (42.4%) |
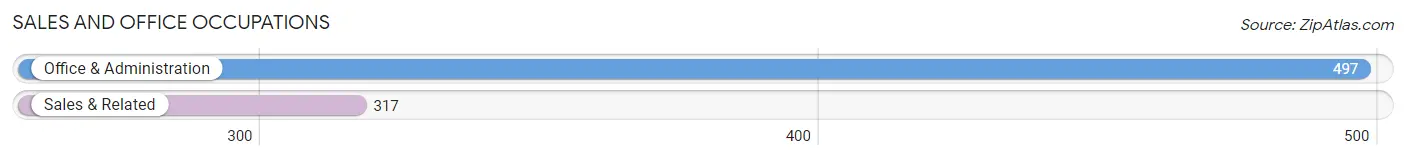
Sales and Office Occupations
The most common Sales and Office occupations in Monee are Office & Administration (497 | 16.0%), and Sales & Related (317 | 10.2%).
Sales and Office Occupations by Sex
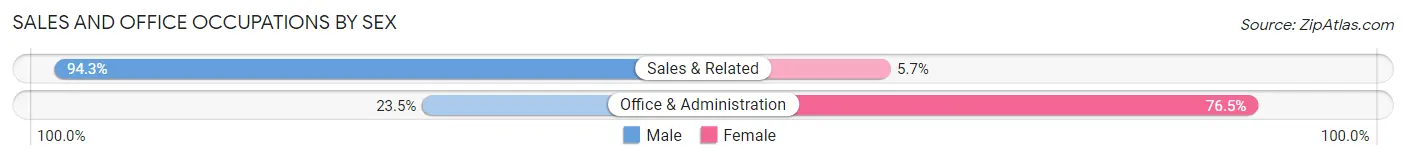
| Occupation | Male | Female |
| Sales & Related | 299 (94.3%) | 18 (5.7%) |
| Office & Administration | 117 (23.5%) | 380 (76.5%) |
| Total (Category) | 416 (51.1%) | 398 (48.9%) |
| Total (Overall) | 1,792 (57.6%) | 1,319 (42.4%) |
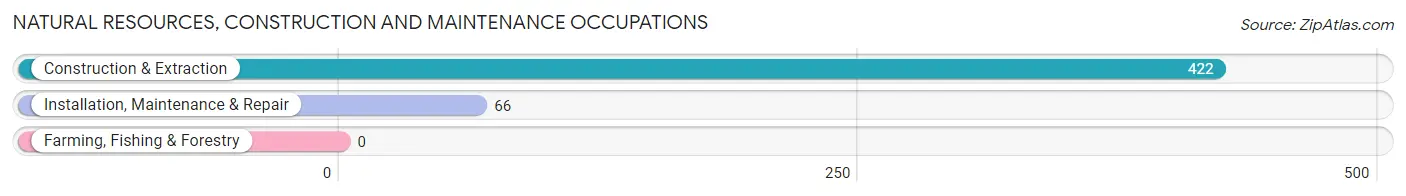
Natural Resources, Construction and Maintenance Occupations
The most common Natural Resources, Construction and Maintenance occupations in Monee are Construction & Extraction (422 | 13.6%), and Installation, Maintenance & Repair (66 | 2.1%).
Natural Resources, Construction and Maintenance Occupations by Sex
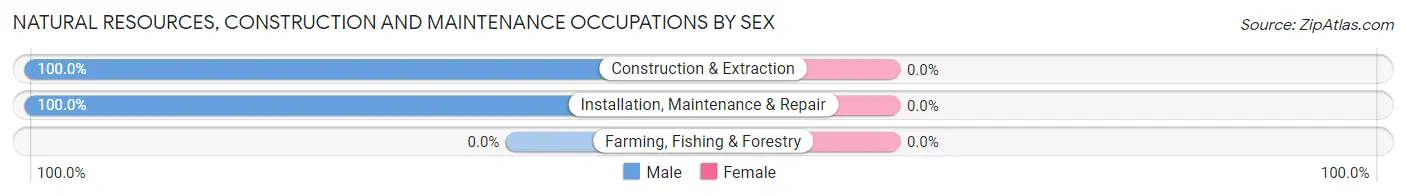
| Occupation | Male | Female |
| Farming, Fishing & Forestry | 0 (0.0%) | 0 (0.0%) |
| Construction & Extraction | 422 (100.0%) | 0 (0.0%) |
| Installation, Maintenance & Repair | 66 (100.0%) | 0 (0.0%) |
| Total (Category) | 488 (100.0%) | 0 (0.0%) |
| Total (Overall) | 1,792 (57.6%) | 1,319 (42.4%) |
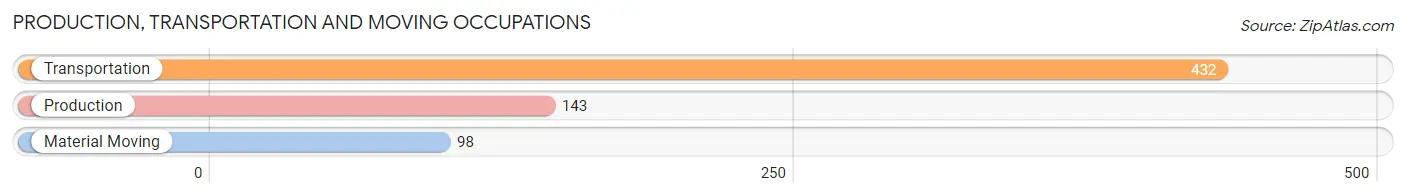
Production, Transportation and Moving Occupations
The most common Production, Transportation and Moving occupations in Monee are Transportation (432 | 13.9%), Production (143 | 4.6%), and Material Moving (98 | 3.2%).
Production, Transportation and Moving Occupations by Sex
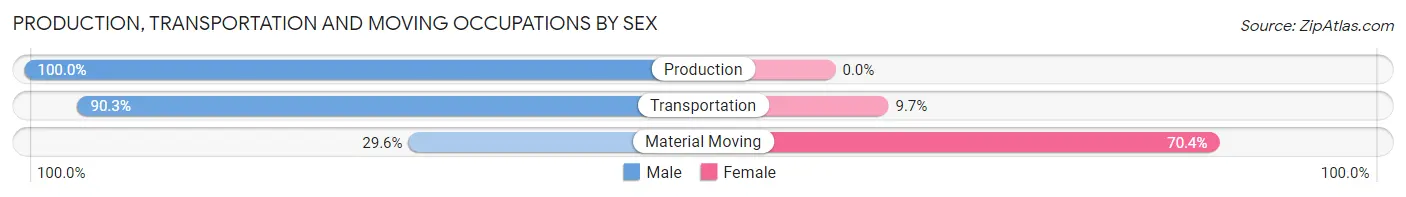
| Occupation | Male | Female |
| Production | 143 (100.0%) | 0 (0.0%) |
| Transportation | 390 (90.3%) | 42 (9.7%) |
| Material Moving | 29 (29.6%) | 69 (70.4%) |
| Total (Category) | 562 (83.5%) | 111 (16.5%) |
| Total (Overall) | 1,792 (57.6%) | 1,319 (42.4%) |
Employment Industries by Sex in Monee
Employment Industries in Monee
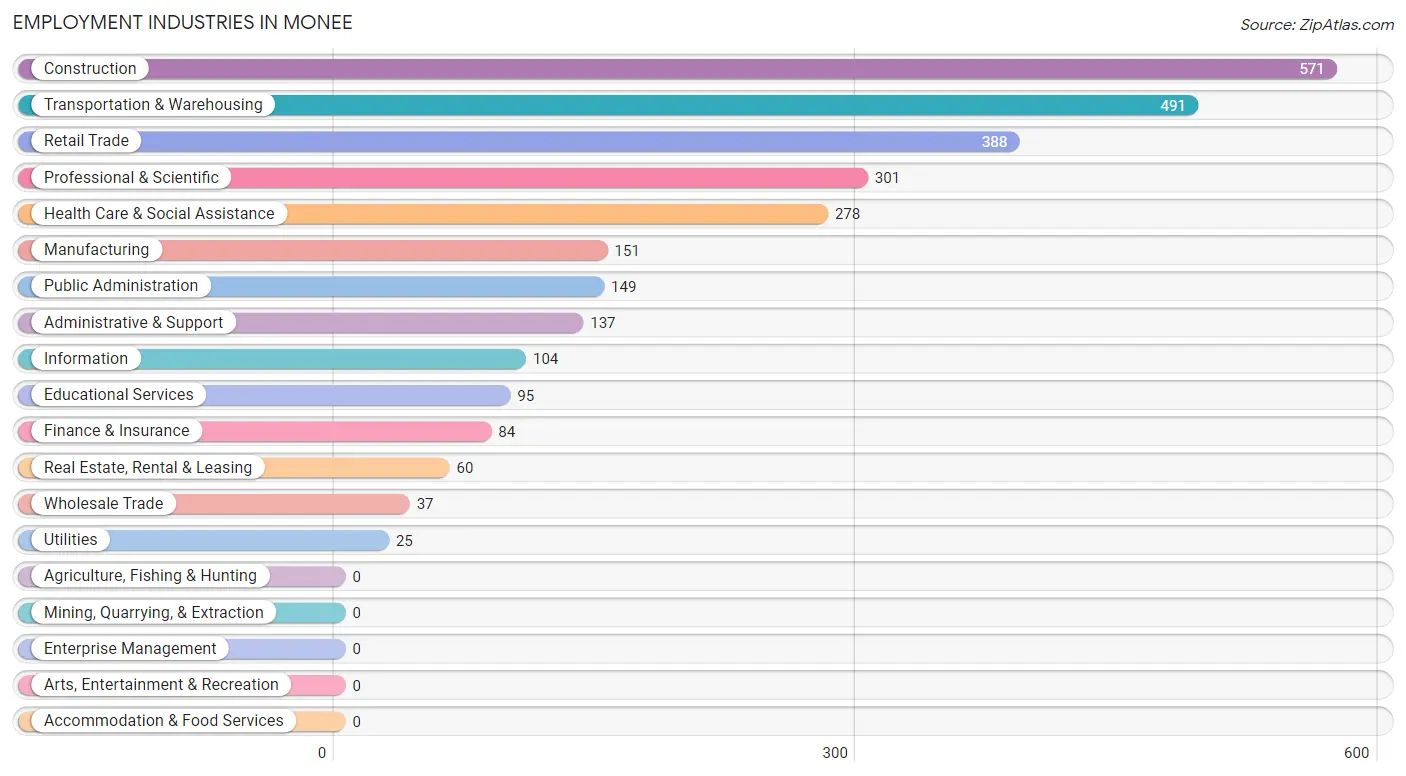
The major employment industries in Monee include Construction (571 | 18.3%), Transportation & Warehousing (491 | 15.8%), Retail Trade (388 | 12.5%), Professional & Scientific (301 | 9.7%), and Health Care & Social Assistance (278 | 8.9%).
Employment Industries by Sex in Monee
The Monee industries that see more men than women are Transportation & Warehousing (100.0%), Utilities (100.0%), and Manufacturing (80.1%), whereas the industries that tend to have a higher number of women are Finance & Insurance (100.0%), Educational Services (82.1%), and Health Care & Social Assistance (82.0%).
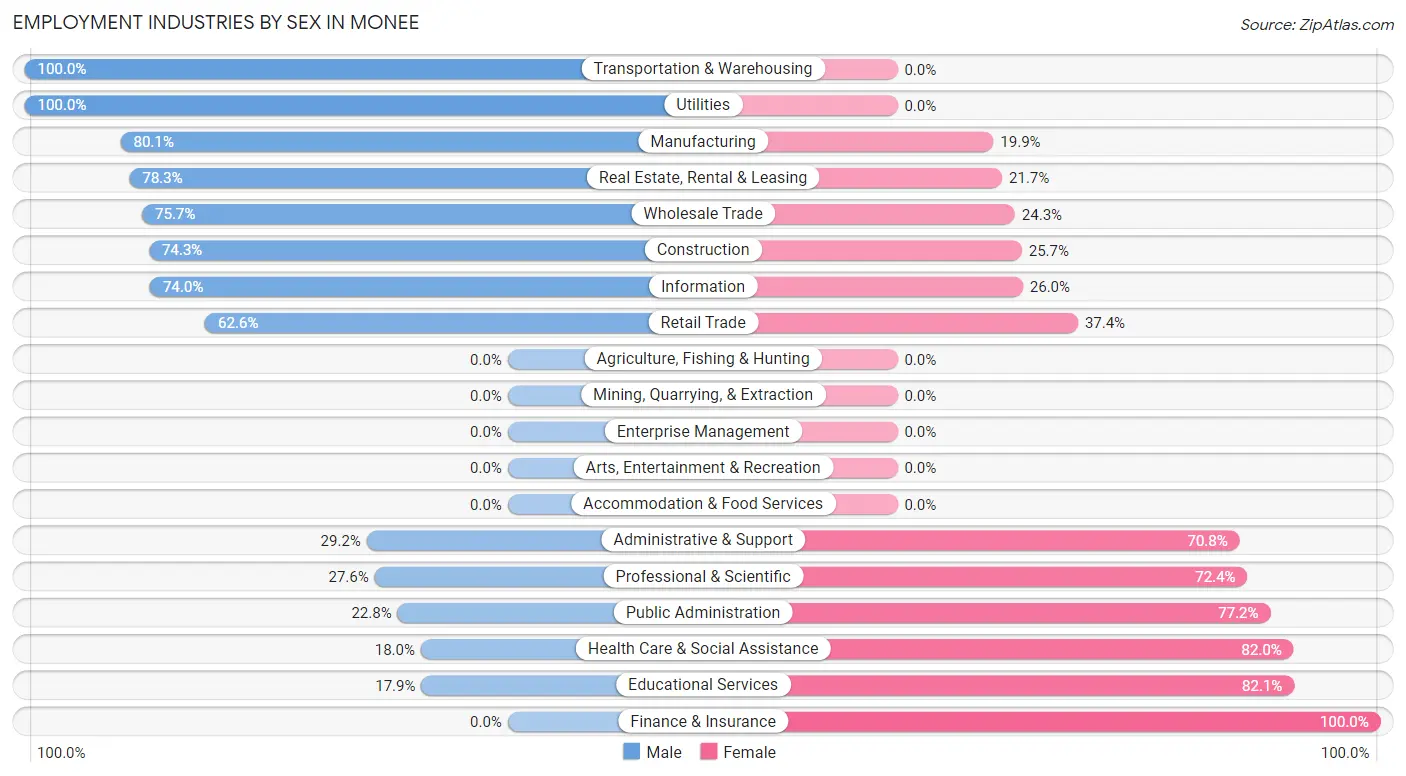
| Industry | Male | Female |
| Agriculture, Fishing & Hunting | 0 (0.0%) | 0 (0.0%) |
| Mining, Quarrying, & Extraction | 0 (0.0%) | 0 (0.0%) |
| Construction | 424 (74.3%) | 147 (25.7%) |
| Manufacturing | 121 (80.1%) | 30 (19.9%) |
| Wholesale Trade | 28 (75.7%) | 9 (24.3%) |
| Retail Trade | 243 (62.6%) | 145 (37.4%) |
| Transportation & Warehousing | 491 (100.0%) | 0 (0.0%) |
| Utilities | 25 (100.0%) | 0 (0.0%) |
| Information | 77 (74.0%) | 27 (26.0%) |
| Finance & Insurance | 0 (0.0%) | 84 (100.0%) |
| Real Estate, Rental & Leasing | 47 (78.3%) | 13 (21.7%) |
| Professional & Scientific | 83 (27.6%) | 218 (72.4%) |
| Enterprise Management | 0 (0.0%) | 0 (0.0%) |
| Administrative & Support | 40 (29.2%) | 97 (70.8%) |
| Educational Services | 17 (17.9%) | 78 (82.1%) |
| Health Care & Social Assistance | 50 (18.0%) | 228 (82.0%) |
| Arts, Entertainment & Recreation | 0 (0.0%) | 0 (0.0%) |
| Accommodation & Food Services | 0 (0.0%) | 0 (0.0%) |
| Public Administration | 34 (22.8%) | 115 (77.2%) |
| Total | 1,792 (57.6%) | 1,319 (42.4%) |
Education in Monee
School Enrollment in Monee
The most common levels of schooling among the 655 students in Monee are college / undergraduate (437 | 66.7%), elementary school (110 | 16.8%), and high school (73 | 11.2%).
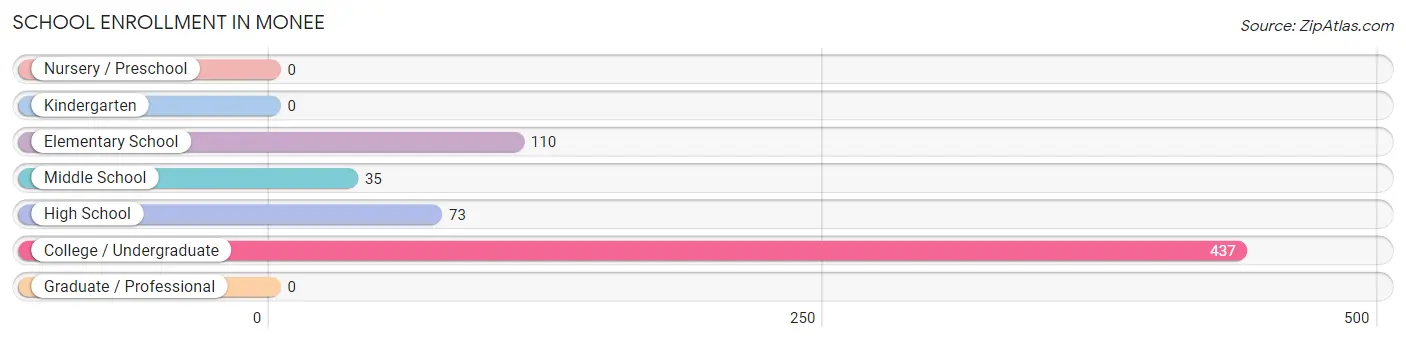
| School Level | # Students | % Students |
| Nursery / Preschool | 0 | 0.0% |
| Kindergarten | 0 | 0.0% |
| Elementary School | 110 | 16.8% |
| Middle School | 35 | 5.3% |
| High School | 73 | 11.2% |
| College / Undergraduate | 437 | 66.7% |
| Graduate / Professional | 0 | 0.0% |
| Total | 655 | 100.0% |
School Enrollment by Age by Funding Source in Monee
Out of a total of 655 students who are enrolled in schools in Monee, 133 (20.3%) attend a private institution, while the remaining 522 (79.7%) are enrolled in public schools. The age group of 18 to 19 year olds has the highest likelihood of being enrolled in private schools, with 27 (100.0% in the age bracket) enrolled. Conversely, the age group of 10 to 14 year olds has the lowest likelihood of being enrolled in a private school, with 58 (100.0% in the age bracket) attending a public institution.
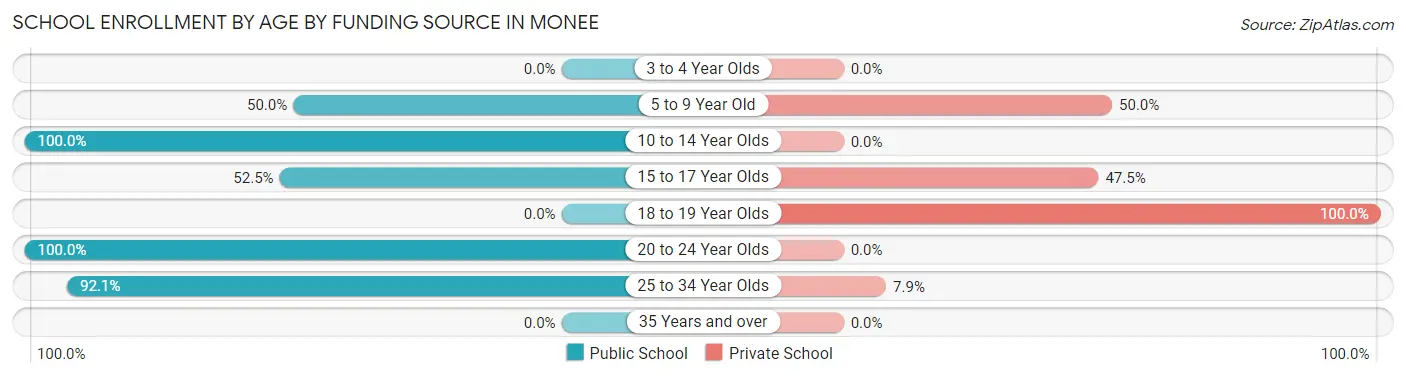
| Age Bracket | Public School | Private School |
| 3 to 4 Year Olds | 0 (0.0%) | 0 (0.0%) |
| 5 to 9 Year Old | 50 (50.0%) | 50 (50.0%) |
| 10 to 14 Year Olds | 58 (100.0%) | 0 (0.0%) |
| 15 to 17 Year Olds | 31 (52.5%) | 28 (47.5%) |
| 18 to 19 Year Olds | 0 (0.0%) | 27 (100.0%) |
| 20 to 24 Year Olds | 57 (100.0%) | 0 (0.0%) |
| 25 to 34 Year Olds | 326 (92.1%) | 28 (7.9%) |
| 35 Years and over | 0 (0.0%) | 0 (0.0%) |
| Total | 522 (79.7%) | 133 (20.3%) |
Educational Attainment by Field of Study in Monee
Education (409 | 39.7%), business (181 | 17.6%), literature & languages (109 | 10.6%), social sciences (83 | 8.1%), and arts & humanities (77 | 7.5%) are the most common fields of study among 1,030 individuals in Monee who have obtained a bachelor's degree or higher.
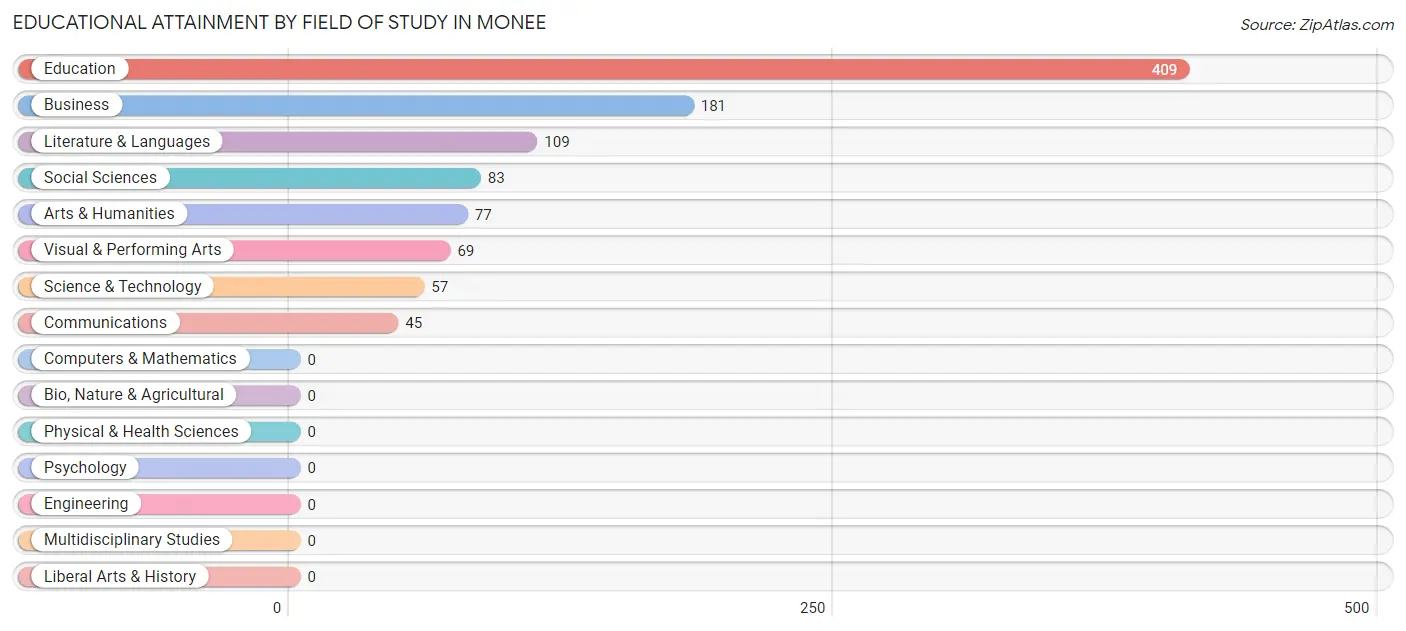
| Field of Study | # Graduates | % Graduates |
| Computers & Mathematics | 0 | 0.0% |
| Bio, Nature & Agricultural | 0 | 0.0% |
| Physical & Health Sciences | 0 | 0.0% |
| Psychology | 0 | 0.0% |
| Social Sciences | 83 | 8.1% |
| Engineering | 0 | 0.0% |
| Multidisciplinary Studies | 0 | 0.0% |
| Science & Technology | 57 | 5.5% |
| Business | 181 | 17.6% |
| Education | 409 | 39.7% |
| Literature & Languages | 109 | 10.6% |
| Liberal Arts & History | 0 | 0.0% |
| Visual & Performing Arts | 69 | 6.7% |
| Communications | 45 | 4.4% |
| Arts & Humanities | 77 | 7.5% |
| Total | 1,030 | 100.0% |
Transportation & Commute in Monee
Vehicle Availability by Sex in Monee
The most prevalent vehicle ownership categories in Monee are males with 2 vehicles (644, accounting for 36.3%) and females with 2 vehicles (520, making up 48.8%).
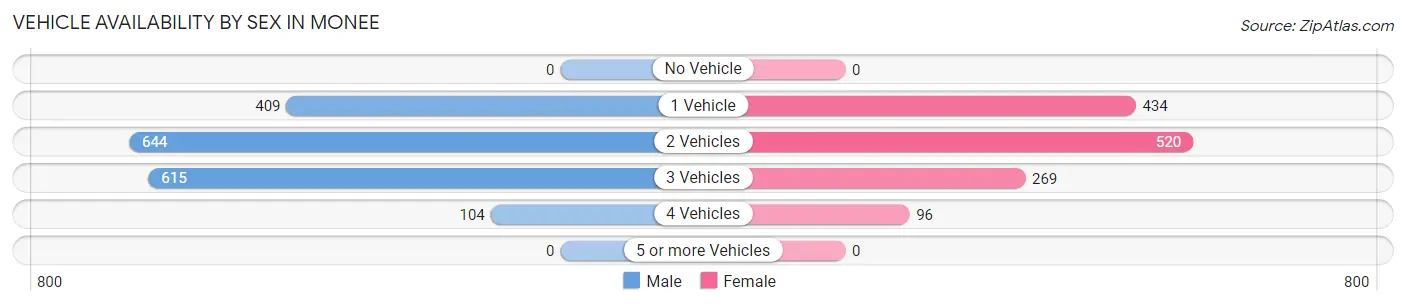
| Vehicles Available | Male | Female |
| No Vehicle | 0 (0.0%) | 0 (0.0%) |
| 1 Vehicle | 409 (23.1%) | 434 (32.9%) |
| 2 Vehicles | 644 (36.3%) | 520 (39.4%) |
| 3 Vehicles | 615 (34.7%) | 269 (20.4%) |
| 4 Vehicles | 104 (5.9%) | 96 (7.3%) |
| 5 or more Vehicles | 0 (0.0%) | 0 (0.0%) |
| Total | 1,772 (100.0%) | 1,319 (100.0%) |
Commute Time in Monee
The most frequently occuring commute durations in Monee are 25 to 29 minutes (553 commuters, 20.4%), 45 to 59 minutes (501 commuters, 18.5%), and 90 or more minutes (359 commuters, 13.3%).
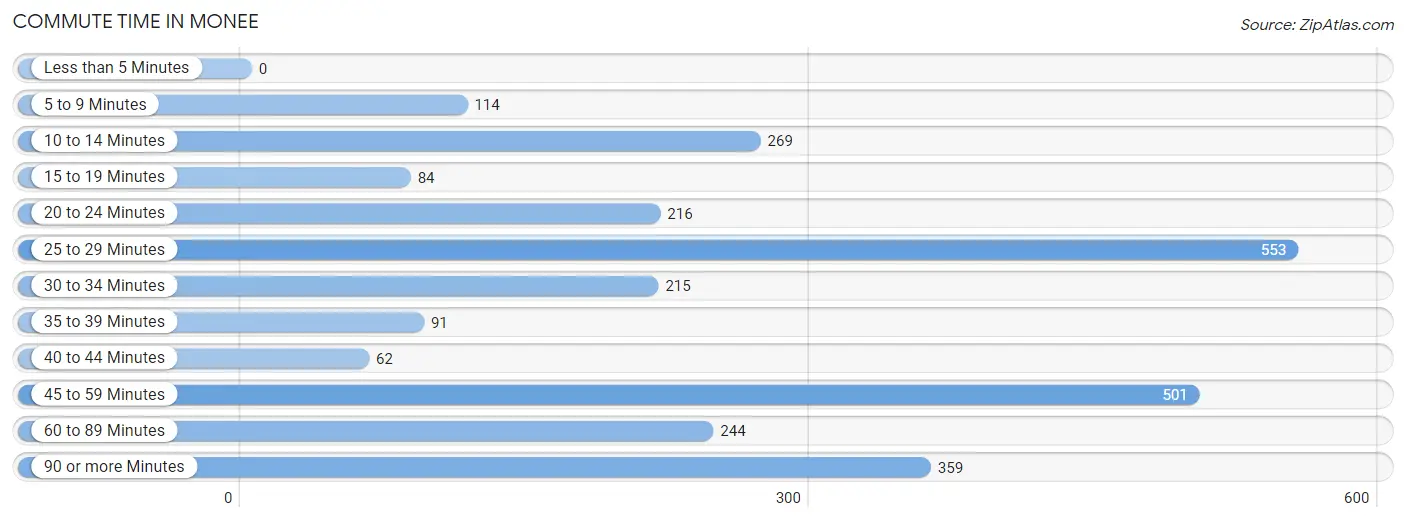
| Commute Time | # Commuters | % Commuters |
| Less than 5 Minutes | 0 | 0.0% |
| 5 to 9 Minutes | 114 | 4.2% |
| 10 to 14 Minutes | 269 | 9.9% |
| 15 to 19 Minutes | 84 | 3.1% |
| 20 to 24 Minutes | 216 | 8.0% |
| 25 to 29 Minutes | 553 | 20.4% |
| 30 to 34 Minutes | 215 | 7.9% |
| 35 to 39 Minutes | 91 | 3.4% |
| 40 to 44 Minutes | 62 | 2.3% |
| 45 to 59 Minutes | 501 | 18.5% |
| 60 to 89 Minutes | 244 | 9.0% |
| 90 or more Minutes | 359 | 13.3% |
Commute Time by Sex in Monee
The most common commute times in Monee are 25 to 29 minutes (529 commuters, 32.0%) for males and 45 to 59 minutes (296 commuters, 28.0%) for females.
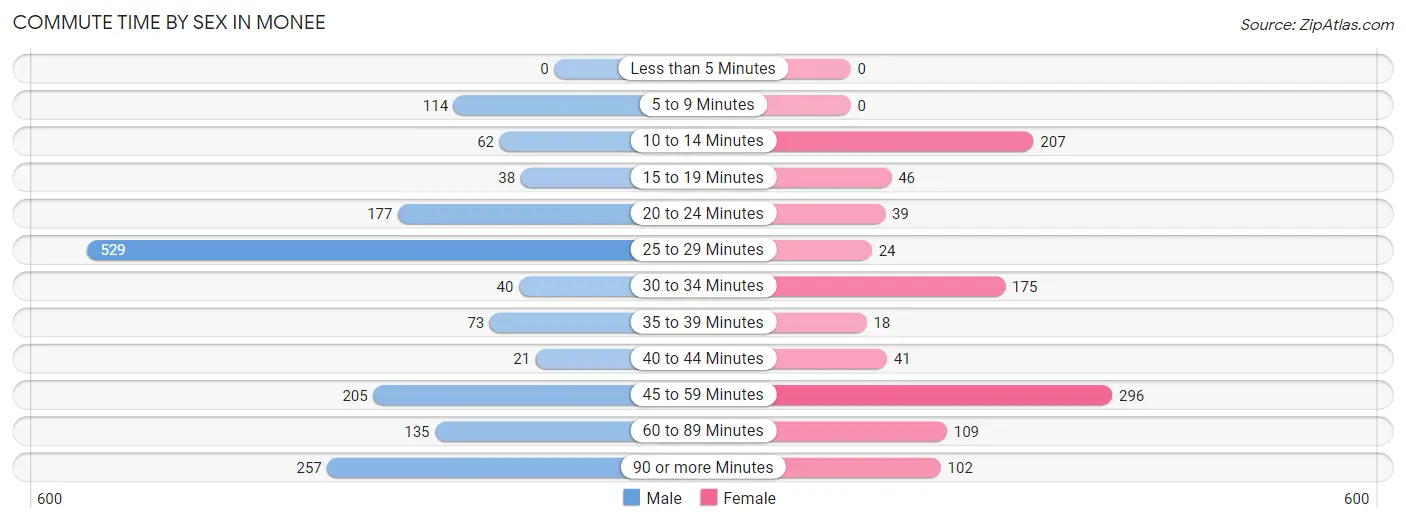
| Commute Time | Male | Female |
| Less than 5 Minutes | 0 (0.0%) | 0 (0.0%) |
| 5 to 9 Minutes | 114 (6.9%) | 0 (0.0%) |
| 10 to 14 Minutes | 62 (3.8%) | 207 (19.6%) |
| 15 to 19 Minutes | 38 (2.3%) | 46 (4.3%) |
| 20 to 24 Minutes | 177 (10.7%) | 39 (3.7%) |
| 25 to 29 Minutes | 529 (32.0%) | 24 (2.3%) |
| 30 to 34 Minutes | 40 (2.4%) | 175 (16.6%) |
| 35 to 39 Minutes | 73 (4.4%) | 18 (1.7%) |
| 40 to 44 Minutes | 21 (1.3%) | 41 (3.9%) |
| 45 to 59 Minutes | 205 (12.4%) | 296 (28.0%) |
| 60 to 89 Minutes | 135 (8.2%) | 109 (10.3%) |
| 90 or more Minutes | 257 (15.6%) | 102 (9.7%) |
Time of Departure to Work by Sex in Monee
The most frequent times of departure to work in Monee are 7:30 AM to 7:59 AM (367, 22.2%) for males and 7:30 AM to 7:59 AM (206, 19.5%) for females.
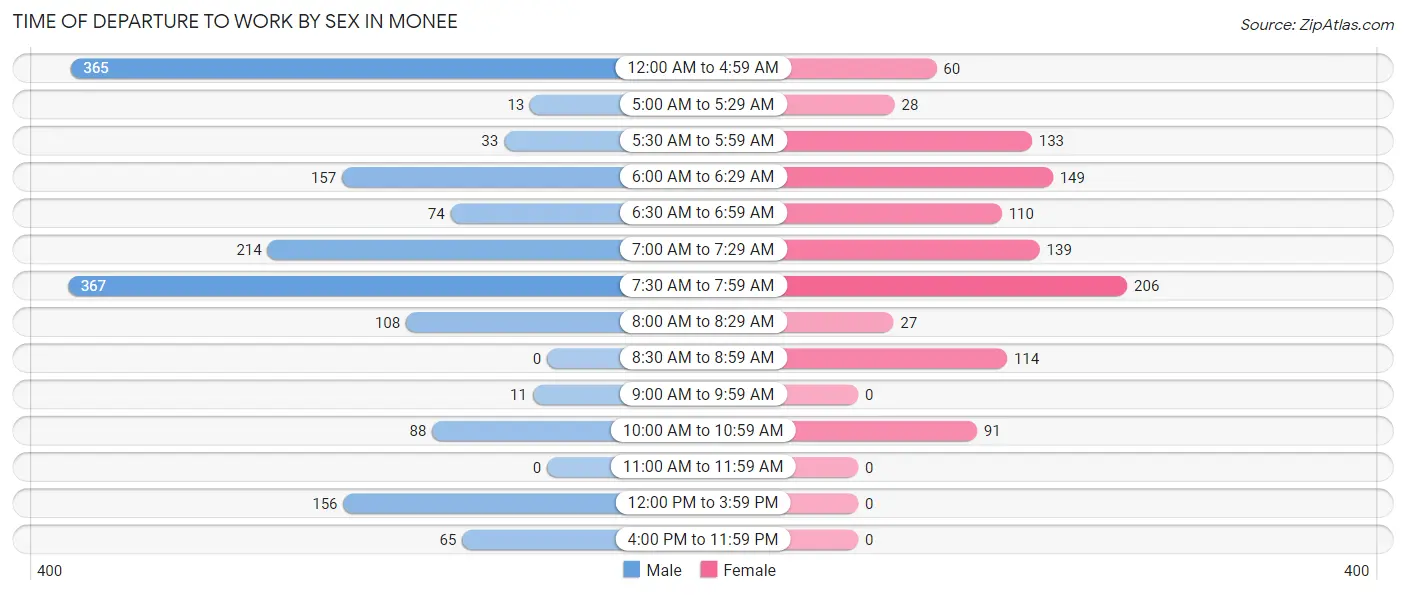
| Time of Departure | Male | Female |
| 12:00 AM to 4:59 AM | 365 (22.1%) | 60 (5.7%) |
| 5:00 AM to 5:29 AM | 13 (0.8%) | 28 (2.6%) |
| 5:30 AM to 5:59 AM | 33 (2.0%) | 133 (12.6%) |
| 6:00 AM to 6:29 AM | 157 (9.5%) | 149 (14.1%) |
| 6:30 AM to 6:59 AM | 74 (4.5%) | 110 (10.4%) |
| 7:00 AM to 7:29 AM | 214 (13.0%) | 139 (13.2%) |
| 7:30 AM to 7:59 AM | 367 (22.2%) | 206 (19.5%) |
| 8:00 AM to 8:29 AM | 108 (6.5%) | 27 (2.5%) |
| 8:30 AM to 8:59 AM | 0 (0.0%) | 114 (10.8%) |
| 9:00 AM to 9:59 AM | 11 (0.7%) | 0 (0.0%) |
| 10:00 AM to 10:59 AM | 88 (5.3%) | 91 (8.6%) |
| 11:00 AM to 11:59 AM | 0 (0.0%) | 0 (0.0%) |
| 12:00 PM to 3:59 PM | 156 (9.5%) | 0 (0.0%) |
| 4:00 PM to 11:59 PM | 65 (3.9%) | 0 (0.0%) |
| Total | 1,651 (100.0%) | 1,057 (100.0%) |
Housing Occupancy in Monee
Occupancy by Ownership in Monee
Of the total 2,429 dwellings in Monee, owner-occupied units account for 2,224 (91.6%), while renter-occupied units make up 205 (8.4%).
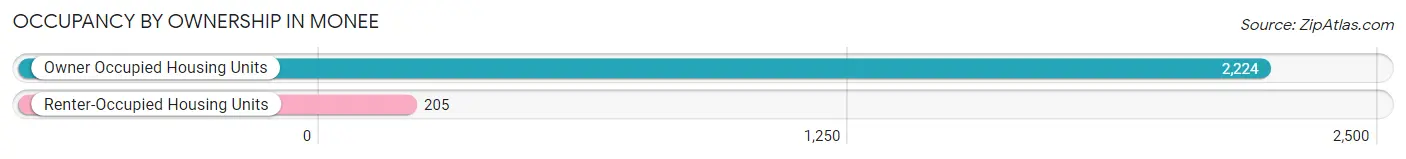
| Occupancy | # Housing Units | % Housing Units |
| Owner Occupied Housing Units | 2,224 | 91.6% |
| Renter-Occupied Housing Units | 205 | 8.4% |
| Total Occupied Housing Units | 2,429 | 100.0% |
Occupancy by Household Size in Monee
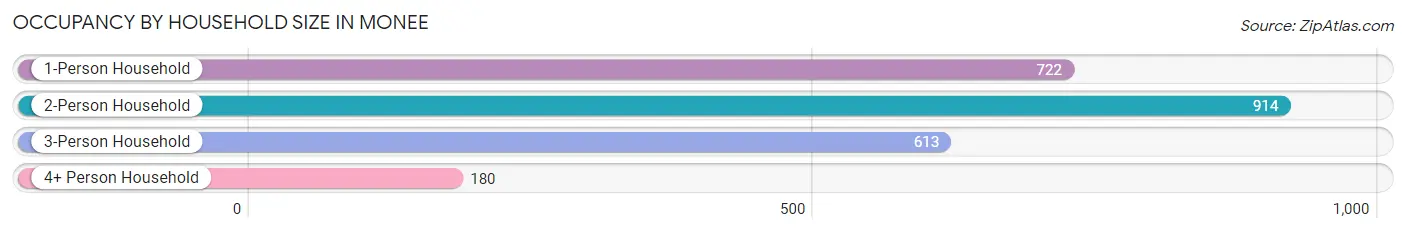
| Household Size | # Housing Units | % Housing Units |
| 1-Person Household | 722 | 29.7% |
| 2-Person Household | 914 | 37.6% |
| 3-Person Household | 613 | 25.2% |
| 4+ Person Household | 180 | 7.4% |
| Total Housing Units | 2,429 | 100.0% |
Occupancy by Ownership by Household Size in Monee
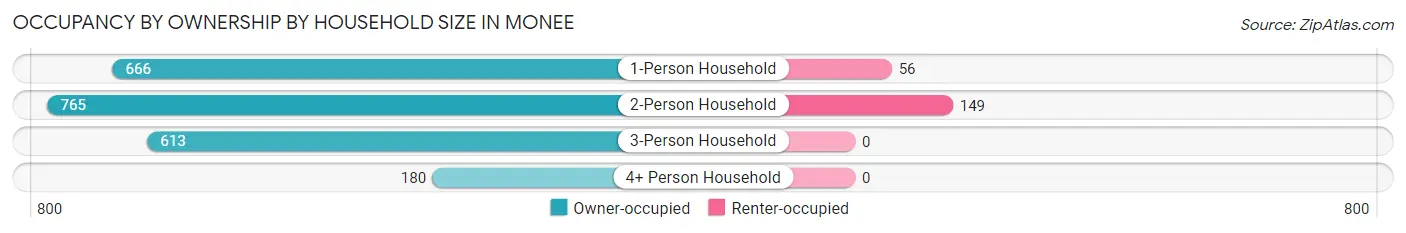
| Household Size | Owner-occupied | Renter-occupied |
| 1-Person Household | 666 (92.2%) | 56 (7.8%) |
| 2-Person Household | 765 (83.7%) | 149 (16.3%) |
| 3-Person Household | 613 (100.0%) | 0 (0.0%) |
| 4+ Person Household | 180 (100.0%) | 0 (0.0%) |
| Total Housing Units | 2,224 (91.6%) | 205 (8.4%) |
Occupancy by Educational Attainment in Monee
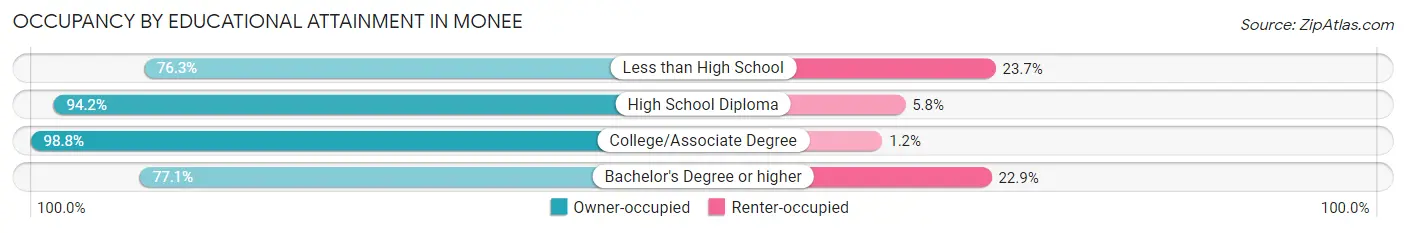
| Household Size | Owner-occupied | Renter-occupied |
| Less than High School | 129 (76.3%) | 40 (23.7%) |
| High School Diploma | 655 (94.2%) | 40 (5.8%) |
| College/Associate Degree | 1,062 (98.8%) | 13 (1.2%) |
| Bachelor's Degree or higher | 378 (77.1%) | 112 (22.9%) |
Occupancy by Age of Householder in Monee
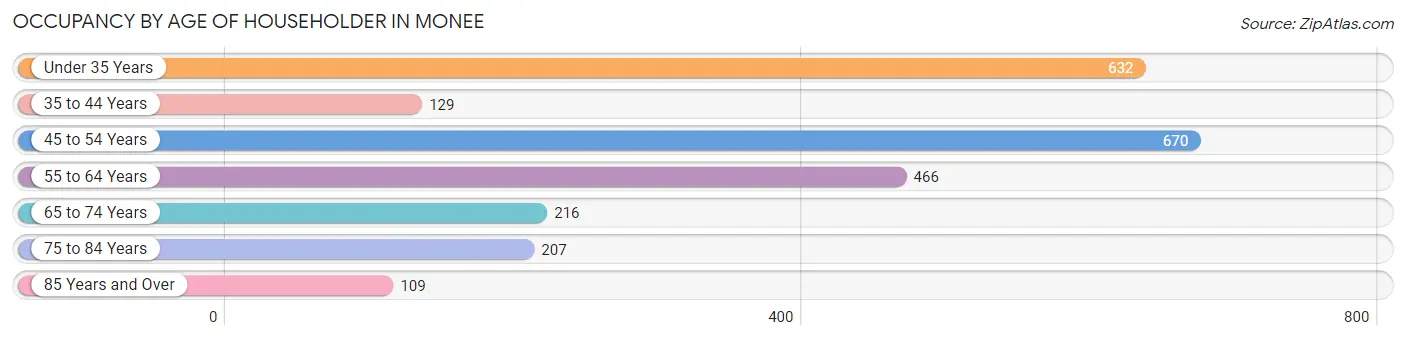
| Age Bracket | # Households | % Households |
| Under 35 Years | 632 | 26.0% |
| 35 to 44 Years | 129 | 5.3% |
| 45 to 54 Years | 670 | 27.6% |
| 55 to 64 Years | 466 | 19.2% |
| 65 to 74 Years | 216 | 8.9% |
| 75 to 84 Years | 207 | 8.5% |
| 85 Years and Over | 109 | 4.5% |
| Total | 2,429 | 100.0% |
Housing Finances in Monee
Median Income by Occupancy in Monee
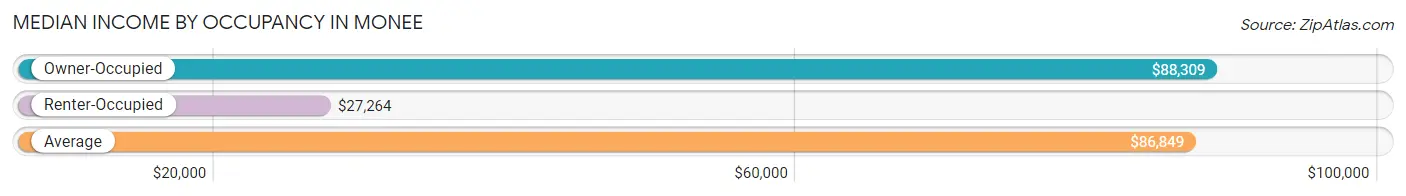
| Occupancy Type | # Households | Median Income |
| Owner-Occupied | 2,224 (91.6%) | $88,309 |
| Renter-Occupied | 205 (8.4%) | $27,264 |
| Average | 2,429 (100.0%) | $86,849 |
Occupancy by Householder Income Bracket in Monee
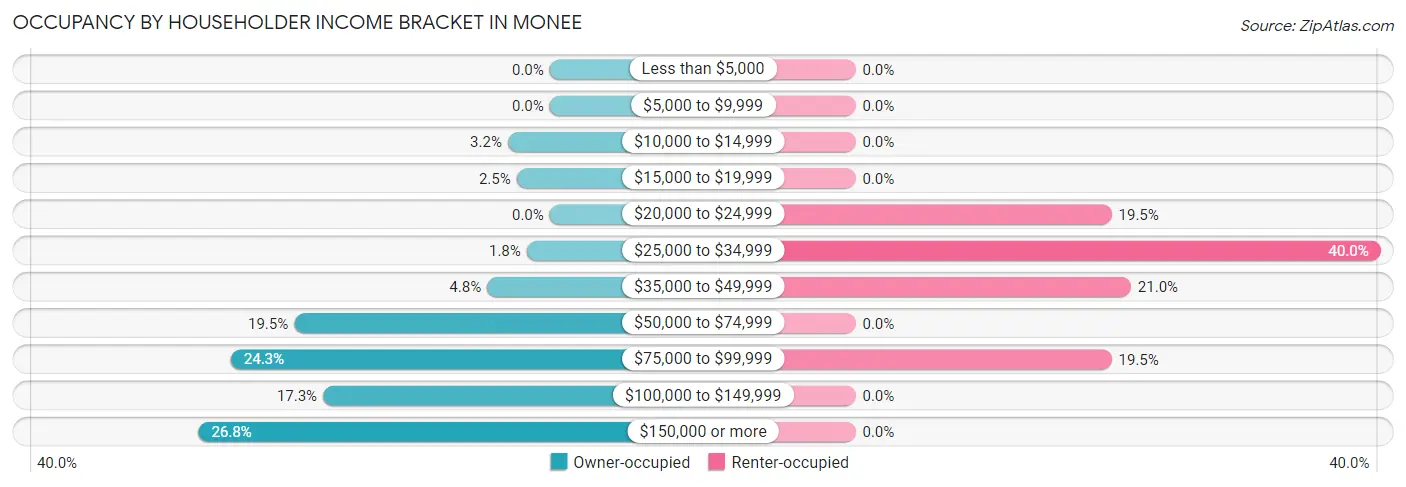
| Income Bracket | Owner-occupied | Renter-occupied |
| Less than $5,000 | 0 (0.0%) | 0 (0.0%) |
| $5,000 to $9,999 | 0 (0.0%) | 0 (0.0%) |
| $10,000 to $14,999 | 71 (3.2%) | 0 (0.0%) |
| $15,000 to $19,999 | 56 (2.5%) | 0 (0.0%) |
| $20,000 to $24,999 | 0 (0.0%) | 40 (19.5%) |
| $25,000 to $34,999 | 39 (1.8%) | 82 (40.0%) |
| $35,000 to $49,999 | 106 (4.8%) | 43 (21.0%) |
| $50,000 to $74,999 | 433 (19.5%) | 0 (0.0%) |
| $75,000 to $99,999 | 540 (24.3%) | 40 (19.5%) |
| $100,000 to $149,999 | 384 (17.3%) | 0 (0.0%) |
| $150,000 or more | 595 (26.8%) | 0 (0.0%) |
| Total | 2,224 (100.0%) | 205 (100.0%) |
Monthly Housing Cost Tiers in Monee
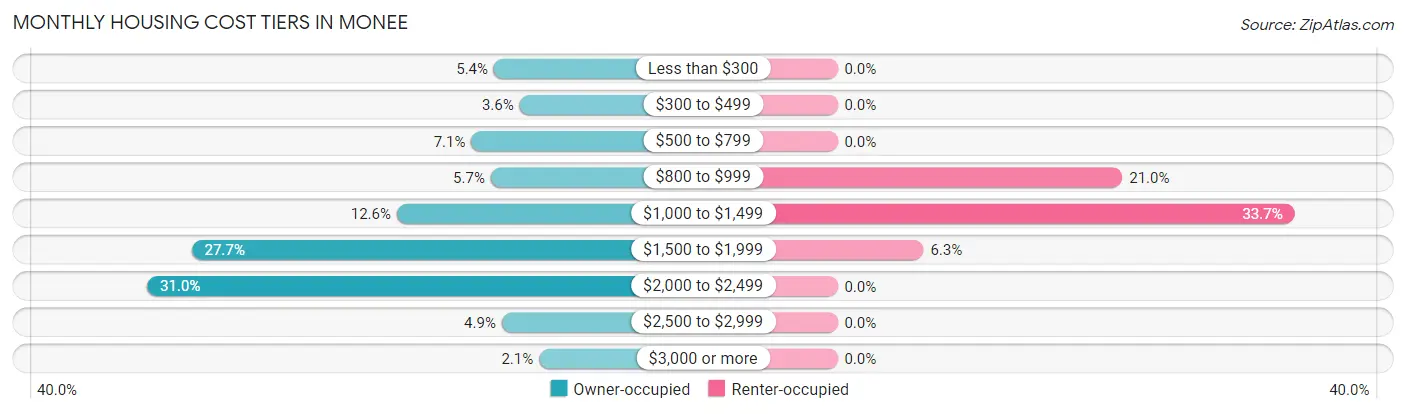
| Monthly Cost | Owner-occupied | Renter-occupied |
| Less than $300 | 121 (5.4%) | 0 (0.0%) |
| $300 to $499 | 79 (3.5%) | 0 (0.0%) |
| $500 to $799 | 158 (7.1%) | 0 (0.0%) |
| $800 to $999 | 126 (5.7%) | 43 (21.0%) |
| $1,000 to $1,499 | 280 (12.6%) | 69 (33.7%) |
| $1,500 to $1,999 | 616 (27.7%) | 13 (6.3%) |
| $2,000 to $2,499 | 689 (31.0%) | 0 (0.0%) |
| $2,500 to $2,999 | 108 (4.9%) | 0 (0.0%) |
| $3,000 or more | 47 (2.1%) | 0 (0.0%) |
| Total | 2,224 (100.0%) | 205 (100.0%) |
Physical Housing Characteristics in Monee
Housing Structures in Monee
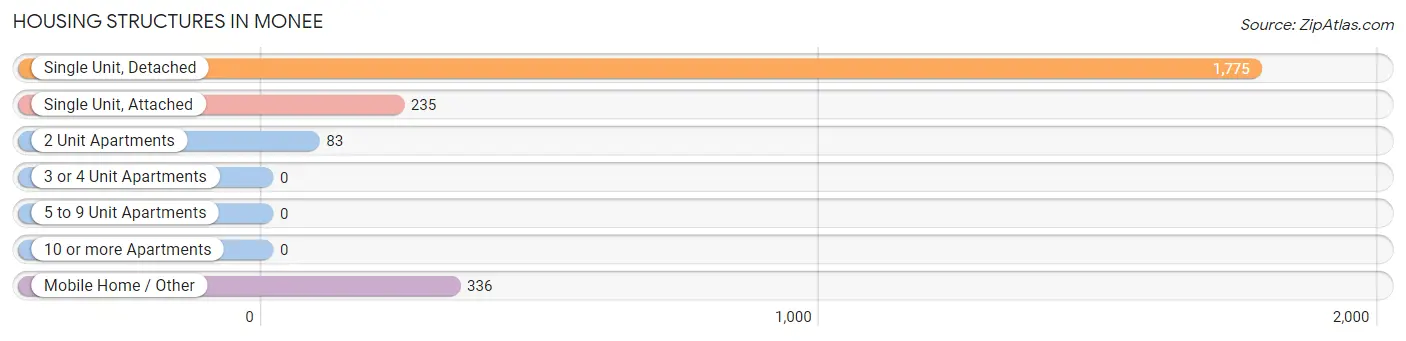
| Structure Type | # Housing Units | % Housing Units |
| Single Unit, Detached | 1,775 | 73.1% |
| Single Unit, Attached | 235 | 9.7% |
| 2 Unit Apartments | 83 | 3.4% |
| 3 or 4 Unit Apartments | 0 | 0.0% |
| 5 to 9 Unit Apartments | 0 | 0.0% |
| 10 or more Apartments | 0 | 0.0% |
| Mobile Home / Other | 336 | 13.8% |
| Total | 2,429 | 100.0% |
Housing Structures by Occupancy in Monee
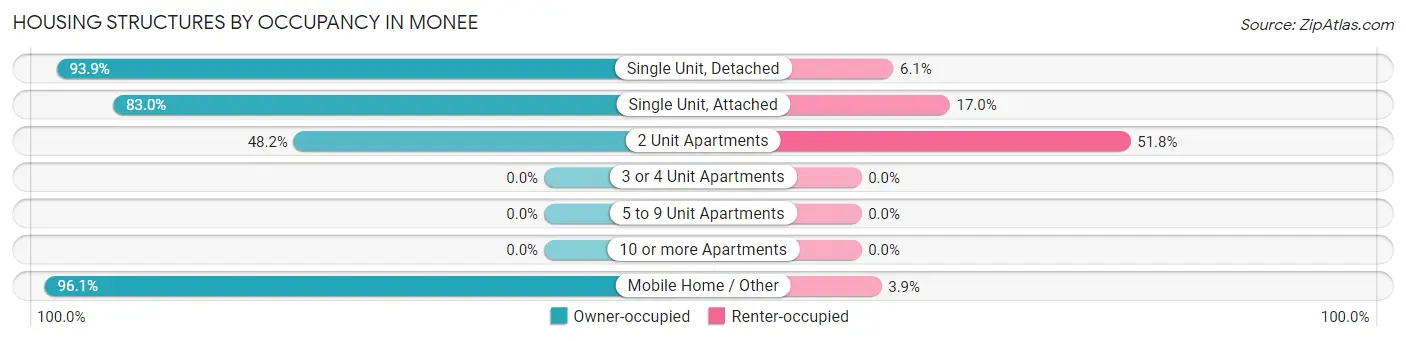
| Structure Type | Owner-occupied | Renter-occupied |
| Single Unit, Detached | 1,666 (93.9%) | 109 (6.1%) |
| Single Unit, Attached | 195 (83.0%) | 40 (17.0%) |
| 2 Unit Apartments | 40 (48.2%) | 43 (51.8%) |
| 3 or 4 Unit Apartments | 0 (0.0%) | 0 (0.0%) |
| 5 to 9 Unit Apartments | 0 (0.0%) | 0 (0.0%) |
| 10 or more Apartments | 0 (0.0%) | 0 (0.0%) |
| Mobile Home / Other | 323 (96.1%) | 13 (3.9%) |
| Total | 2,224 (91.6%) | 205 (8.4%) |
Housing Structures by Number of Rooms in Monee
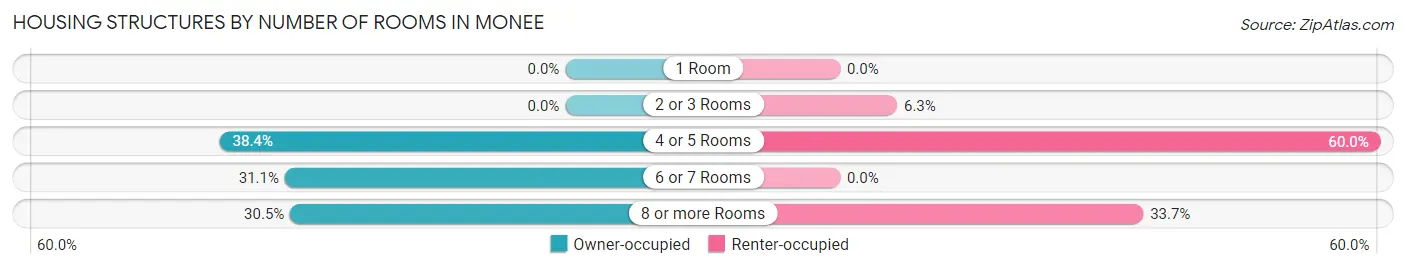
| Number of Rooms | Owner-occupied | Renter-occupied |
| 1 Room | 0 (0.0%) | 0 (0.0%) |
| 2 or 3 Rooms | 0 (0.0%) | 13 (6.3%) |
| 4 or 5 Rooms | 853 (38.4%) | 123 (60.0%) |
| 6 or 7 Rooms | 692 (31.1%) | 0 (0.0%) |
| 8 or more Rooms | 679 (30.5%) | 69 (33.7%) |
| Total | 2,224 (100.0%) | 205 (100.0%) |
Housing Structure by Heating Type in Monee
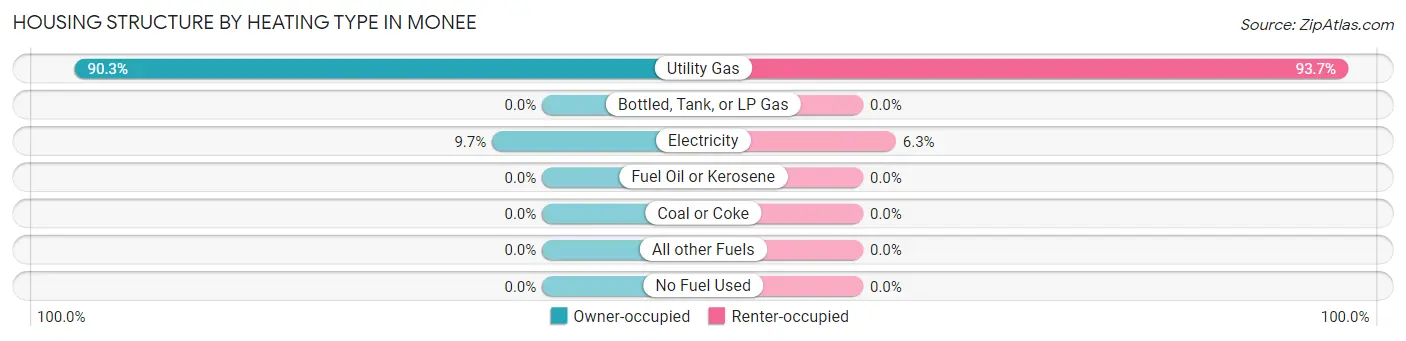
| Heating Type | Owner-occupied | Renter-occupied |
| Utility Gas | 2,009 (90.3%) | 192 (93.7%) |
| Bottled, Tank, or LP Gas | 0 (0.0%) | 0 (0.0%) |
| Electricity | 215 (9.7%) | 13 (6.3%) |
| Fuel Oil or Kerosene | 0 (0.0%) | 0 (0.0%) |
| Coal or Coke | 0 (0.0%) | 0 (0.0%) |
| All other Fuels | 0 (0.0%) | 0 (0.0%) |
| No Fuel Used | 0 (0.0%) | 0 (0.0%) |
| Total | 2,224 (100.0%) | 205 (100.0%) |
Household Vehicle Usage in Monee
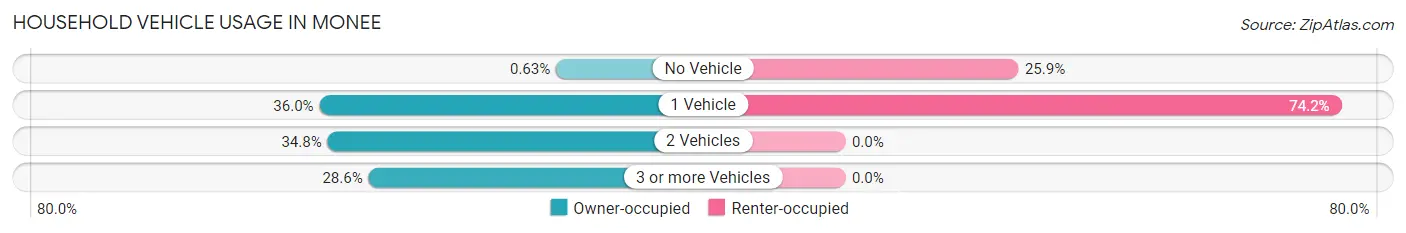
| Vehicles per Household | Owner-occupied | Renter-occupied |
| No Vehicle | 14 (0.6%) | 53 (25.9%) |
| 1 Vehicle | 800 (36.0%) | 152 (74.2%) |
| 2 Vehicles | 773 (34.8%) | 0 (0.0%) |
| 3 or more Vehicles | 637 (28.6%) | 0 (0.0%) |
| Total | 2,224 (100.0%) | 205 (100.0%) |
Real Estate & Mortgages in Monee
Real Estate and Mortgage Overview in Monee
| Characteristic | Without Mortgage | With Mortgage |
| Housing Units | 687 | 1,537 |
| Median Property Value | $136,800 | $226,700 |
| Median Household Income | $57,800 | $517 |
| Monthly Housing Costs | $806 | $47 |
| Real Estate Taxes | - | - |
Property Value by Mortgage Status in Monee
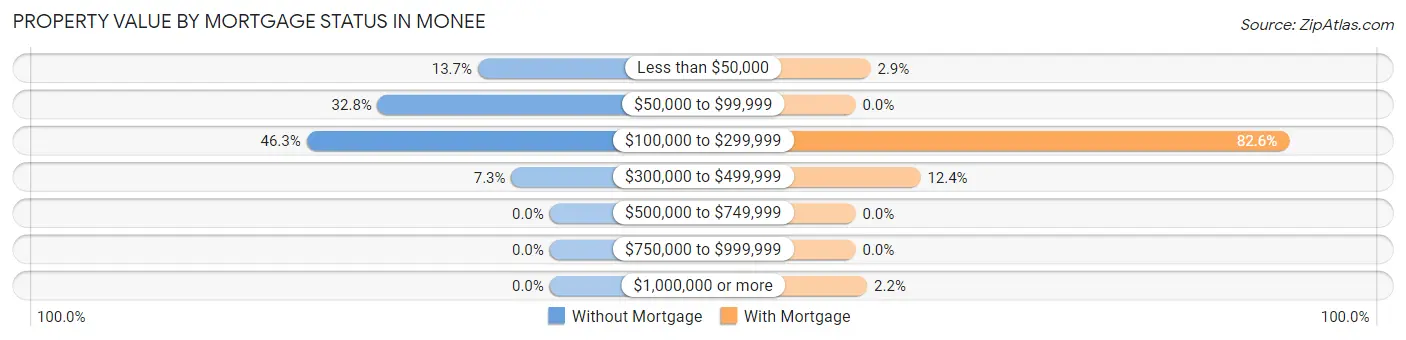
| Property Value | Without Mortgage | With Mortgage |
| Less than $50,000 | 94 (13.7%) | 44 (2.9%) |
| $50,000 to $99,999 | 225 (32.8%) | 0 (0.0%) |
| $100,000 to $299,999 | 318 (46.3%) | 1,269 (82.6%) |
| $300,000 to $499,999 | 50 (7.3%) | 190 (12.4%) |
| $500,000 to $749,999 | 0 (0.0%) | 0 (0.0%) |
| $750,000 to $999,999 | 0 (0.0%) | 0 (0.0%) |
| $1,000,000 or more | 0 (0.0%) | 34 (2.2%) |
| Total | 687 (100.0%) | 1,537 (100.0%) |
Household Income by Mortgage Status in Monee
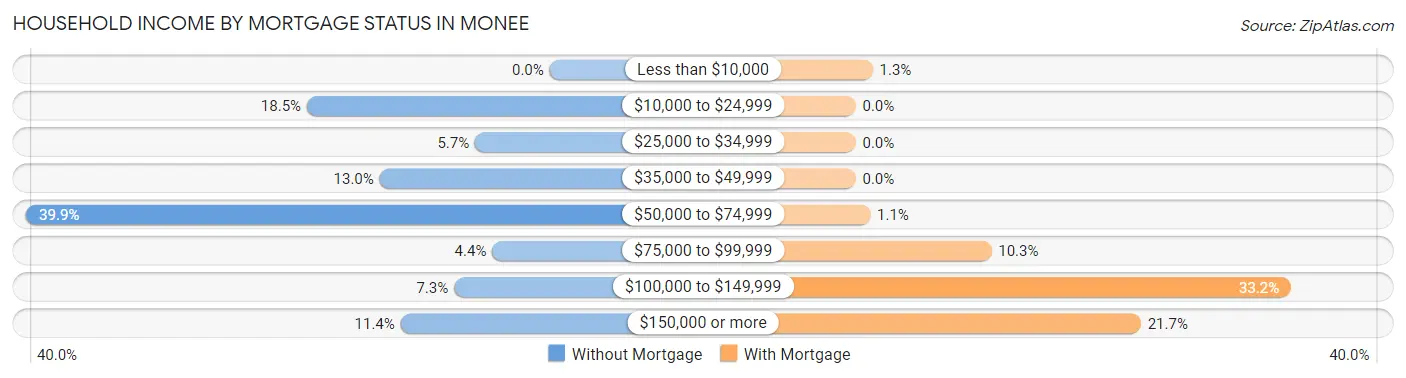
| Household Income | Without Mortgage | With Mortgage |
| Less than $10,000 | 0 (0.0%) | 20 (1.3%) |
| $10,000 to $24,999 | 127 (18.5%) | 0 (0.0%) |
| $25,000 to $34,999 | 39 (5.7%) | 0 (0.0%) |
| $35,000 to $49,999 | 89 (13.0%) | 0 (0.0%) |
| $50,000 to $74,999 | 274 (39.9%) | 17 (1.1%) |
| $75,000 to $99,999 | 30 (4.4%) | 159 (10.3%) |
| $100,000 to $149,999 | 50 (7.3%) | 510 (33.2%) |
| $150,000 or more | 78 (11.4%) | 334 (21.7%) |
| Total | 687 (100.0%) | 1,537 (100.0%) |
Property Value to Household Income Ratio in Monee
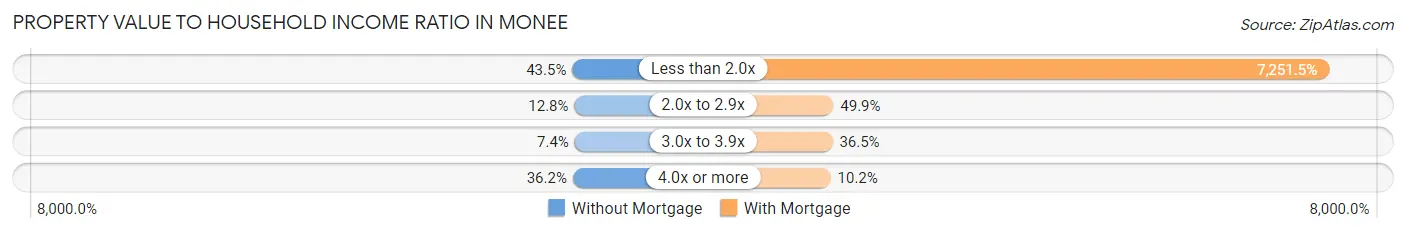
| Value-to-Income Ratio | Without Mortgage | With Mortgage |
| Less than 2.0x | 299 (43.5%) | 111,456 (7,251.5%) |
| 2.0x to 2.9x | 88 (12.8%) | 767 (49.9%) |
| 3.0x to 3.9x | 51 (7.4%) | 561 (36.5%) |
| 4.0x or more | 249 (36.2%) | 156 (10.2%) |
| Total | 687 (100.0%) | 1,537 (100.0%) |
Real Estate Taxes by Mortgage Status in Monee
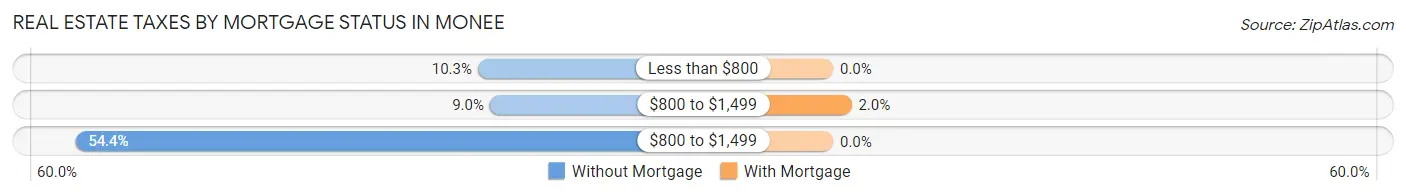
| Property Taxes | Without Mortgage | With Mortgage |
| Less than $800 | 71 (10.3%) | 0 (0.0%) |
| $800 to $1,499 | 62 (9.0%) | 31 (2.0%) |
| $800 to $1,499 | 374 (54.4%) | 0 (0.0%) |
| Total | 687 (100.0%) | 1,537 (100.0%) |
Health & Disability in Monee
Health Insurance Coverage by Age in Monee
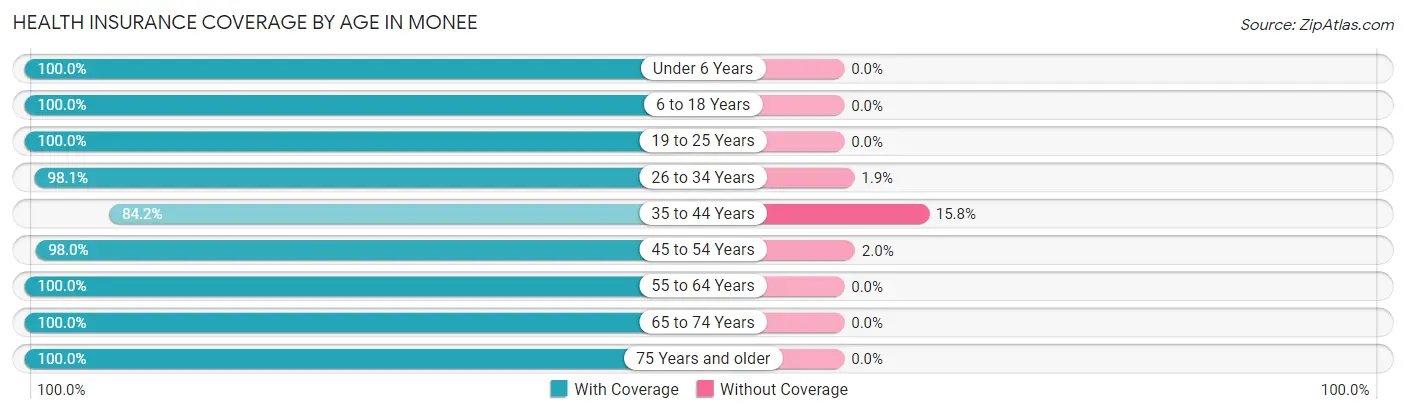
| Age Bracket | With Coverage | Without Coverage |
| Under 6 Years | 390 (100.0%) | 0 (0.0%) |
| 6 to 18 Years | 240 (100.0%) | 0 (0.0%) |
| 19 to 25 Years | 586 (100.0%) | 0 (0.0%) |
| 26 to 34 Years | 783 (98.1%) | 15 (1.9%) |
| 35 to 44 Years | 326 (84.2%) | 61 (15.8%) |
| 45 to 54 Years | 891 (98.0%) | 18 (2.0%) |
| 55 to 64 Years | 994 (100.0%) | 0 (0.0%) |
| 65 to 74 Years | 357 (100.0%) | 0 (0.0%) |
| 75 Years and older | 454 (100.0%) | 0 (0.0%) |
| Total | 5,021 (98.2%) | 94 (1.8%) |
Health Insurance Coverage by Citizenship Status in Monee
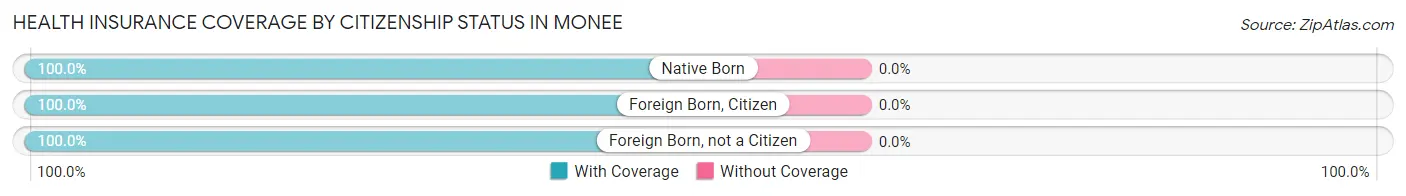
| Citizenship Status | With Coverage | Without Coverage |
| Native Born | 390 (100.0%) | 0 (0.0%) |
| Foreign Born, Citizen | 240 (100.0%) | 0 (0.0%) |
| Foreign Born, not a Citizen | 586 (100.0%) | 0 (0.0%) |
Health Insurance Coverage by Household Income in Monee
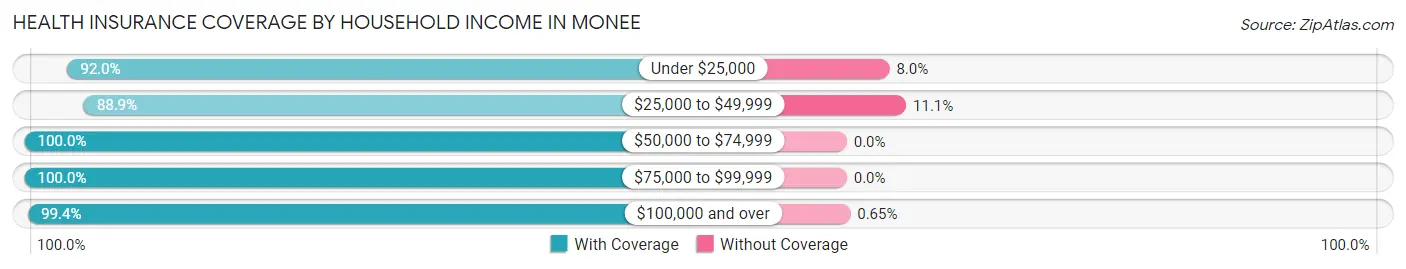
| Household Income | With Coverage | Without Coverage |
| Under $25,000 | 207 (92.0%) | 18 (8.0%) |
| $25,000 to $49,999 | 488 (88.9%) | 61 (11.1%) |
| $50,000 to $74,999 | 681 (100.0%) | 0 (0.0%) |
| $75,000 to $99,999 | 1,337 (100.0%) | 0 (0.0%) |
| $100,000 and over | 2,308 (99.4%) | 15 (0.6%) |
Public vs Private Health Insurance Coverage by Age in Monee
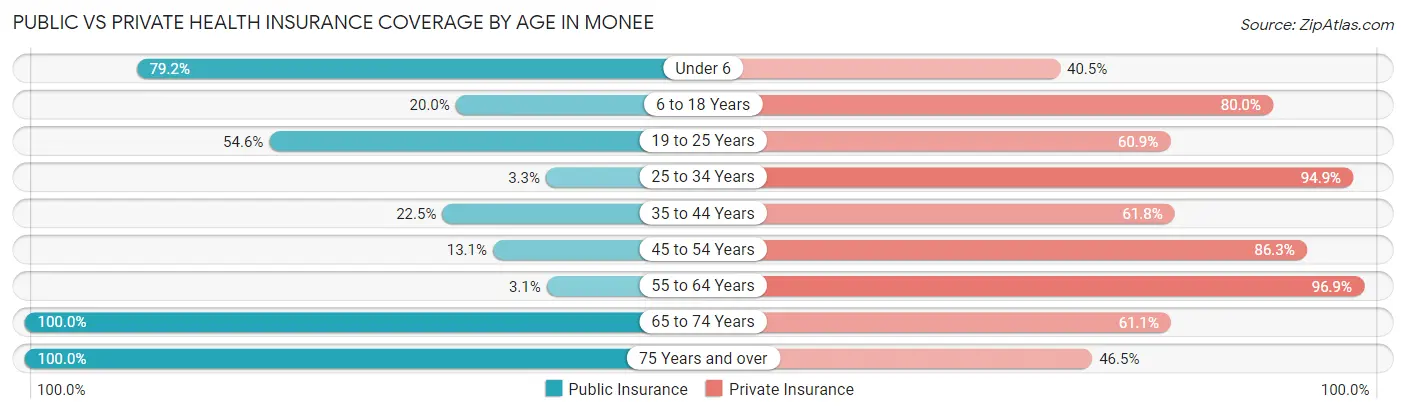
| Age Bracket | Public Insurance | Private Insurance |
| Under 6 | 309 (79.2%) | 158 (40.5%) |
| 6 to 18 Years | 48 (20.0%) | 192 (80.0%) |
| 19 to 25 Years | 320 (54.6%) | 357 (60.9%) |
| 25 to 34 Years | 26 (3.3%) | 757 (94.9%) |
| 35 to 44 Years | 87 (22.5%) | 239 (61.8%) |
| 45 to 54 Years | 119 (13.1%) | 784 (86.3%) |
| 55 to 64 Years | 31 (3.1%) | 963 (96.9%) |
| 65 to 74 Years | 357 (100.0%) | 218 (61.1%) |
| 75 Years and over | 454 (100.0%) | 211 (46.5%) |
| Total | 1,751 (34.2%) | 3,879 (75.8%) |
Disability Status by Sex by Age in Monee
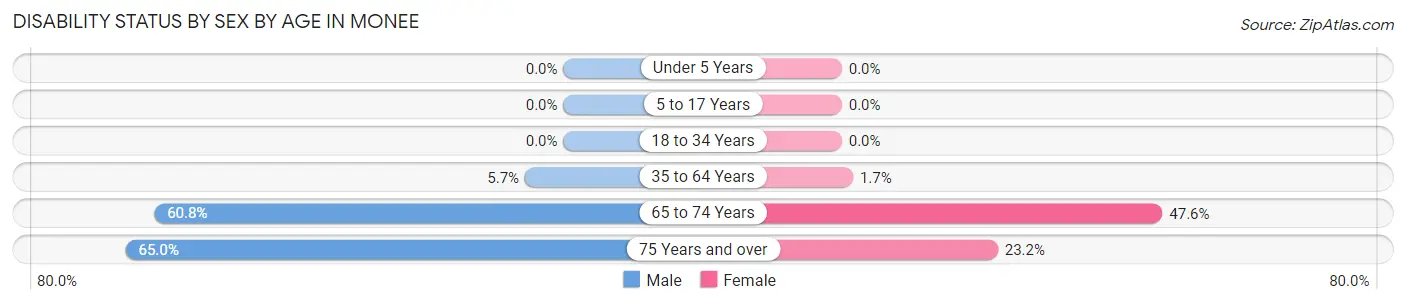
| Age Bracket | Male | Female |
| Under 5 Years | 0 (0.0%) | 0 (0.0%) |
| 5 to 17 Years | 0 (0.0%) | 0 (0.0%) |
| 18 to 34 Years | 0 (0.0%) | 0 (0.0%) |
| 35 to 64 Years | 69 (5.7%) | 18 (1.7%) |
| 65 to 74 Years | 65 (60.8%) | 119 (47.6%) |
| 75 Years and over | 65 (65.0%) | 82 (23.2%) |
Disability Class by Sex by Age in Monee
Disability Class: Hearing Difficulty
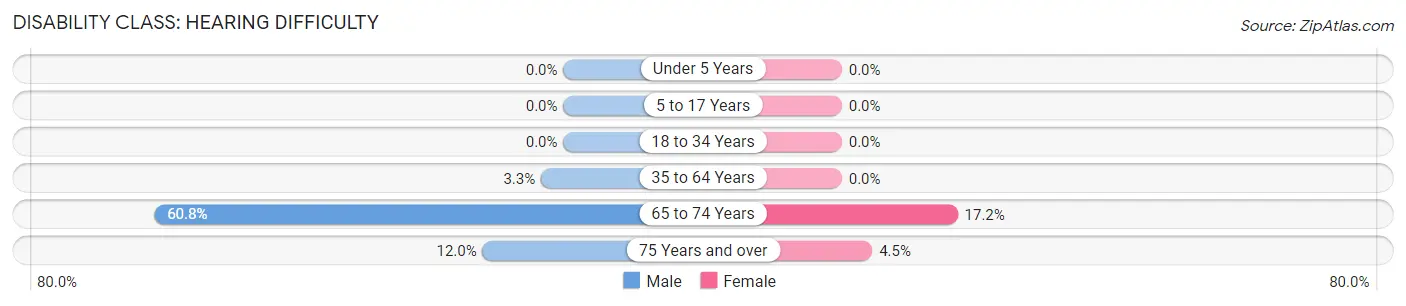
| Age Bracket | Male | Female |
| Under 5 Years | 0 (0.0%) | 0 (0.0%) |
| 5 to 17 Years | 0 (0.0%) | 0 (0.0%) |
| 18 to 34 Years | 0 (0.0%) | 0 (0.0%) |
| 35 to 64 Years | 40 (3.3%) | 0 (0.0%) |
| 65 to 74 Years | 65 (60.8%) | 43 (17.2%) |
| 75 Years and over | 12 (12.0%) | 16 (4.5%) |
Disability Class: Vision Difficulty
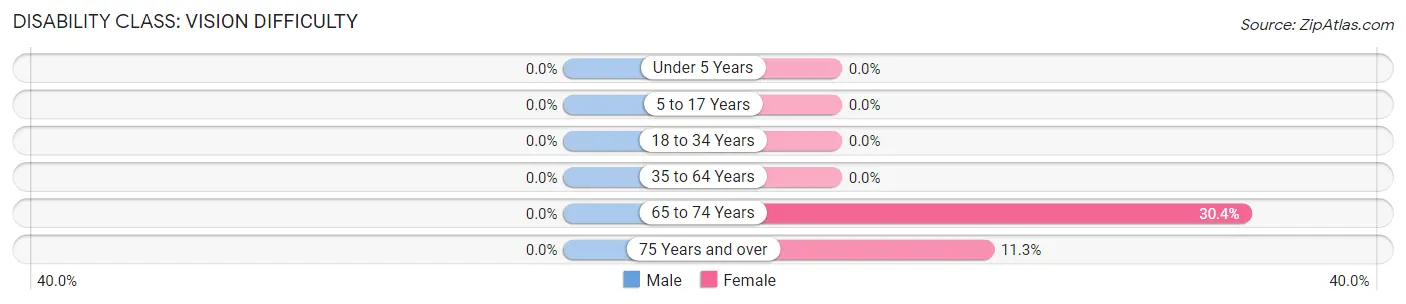
| Age Bracket | Male | Female |
| Under 5 Years | 0 (0.0%) | 0 (0.0%) |
| 5 to 17 Years | 0 (0.0%) | 0 (0.0%) |
| 18 to 34 Years | 0 (0.0%) | 0 (0.0%) |
| 35 to 64 Years | 0 (0.0%) | 0 (0.0%) |
| 65 to 74 Years | 0 (0.0%) | 76 (30.4%) |
| 75 Years and over | 0 (0.0%) | 40 (11.3%) |
Disability Class: Cognitive Difficulty
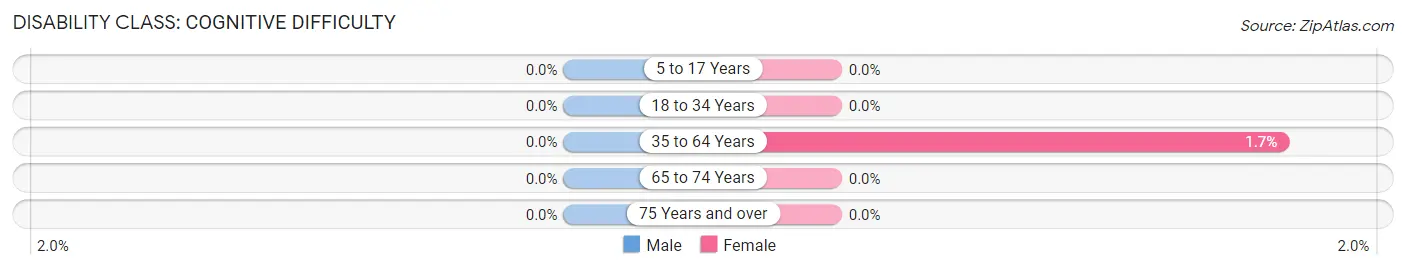
| Age Bracket | Male | Female |
| 5 to 17 Years | 0 (0.0%) | 0 (0.0%) |
| 18 to 34 Years | 0 (0.0%) | 0 (0.0%) |
| 35 to 64 Years | 0 (0.0%) | 18 (1.7%) |
| 65 to 74 Years | 0 (0.0%) | 0 (0.0%) |
| 75 Years and over | 0 (0.0%) | 0 (0.0%) |
Disability Class: Ambulatory Difficulty
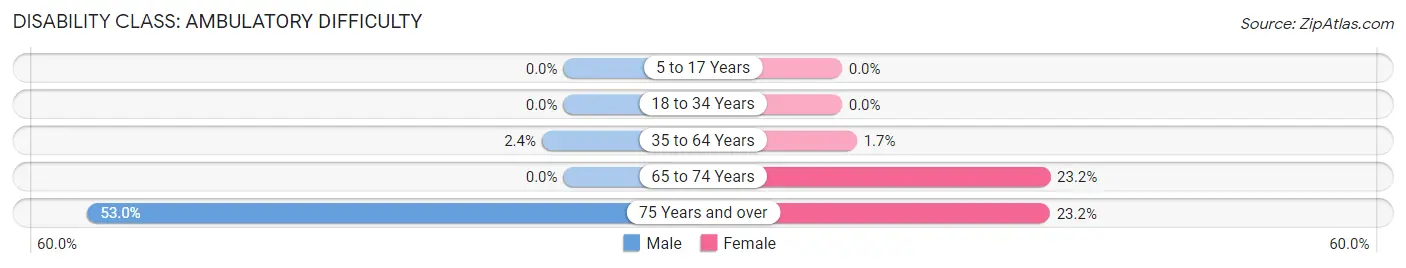
| Age Bracket | Male | Female |
| 5 to 17 Years | 0 (0.0%) | 0 (0.0%) |
| 18 to 34 Years | 0 (0.0%) | 0 (0.0%) |
| 35 to 64 Years | 29 (2.4%) | 18 (1.7%) |
| 65 to 74 Years | 0 (0.0%) | 58 (23.2%) |
| 75 Years and over | 53 (53.0%) | 82 (23.2%) |
Disability Class: Self-Care Difficulty
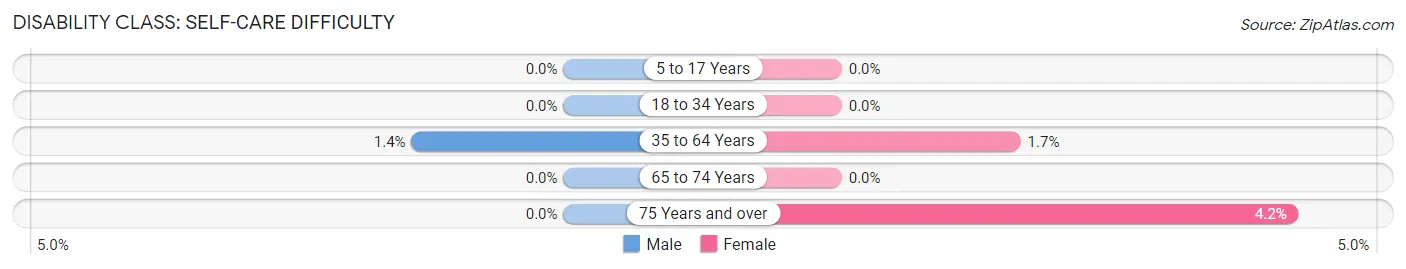
| Age Bracket | Male | Female |
| 5 to 17 Years | 0 (0.0%) | 0 (0.0%) |
| 18 to 34 Years | 0 (0.0%) | 0 (0.0%) |
| 35 to 64 Years | 17 (1.4%) | 18 (1.7%) |
| 65 to 74 Years | 0 (0.0%) | 0 (0.0%) |
| 75 Years and over | 0 (0.0%) | 15 (4.2%) |
Technology Access in Monee
Computing Device Access in Monee
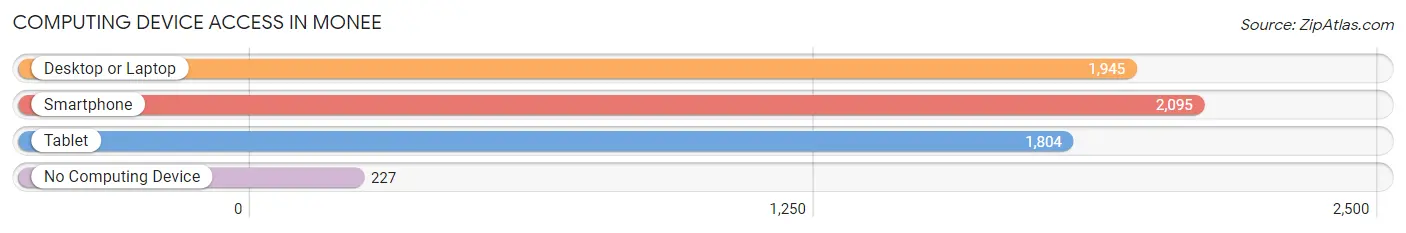
| Device Type | # Households | % Households |
| Desktop or Laptop | 1,945 | 80.1% |
| Smartphone | 2,095 | 86.3% |
| Tablet | 1,804 | 74.3% |
| No Computing Device | 227 | 9.3% |
| Total | 2,429 | 100.0% |
Internet Access in Monee
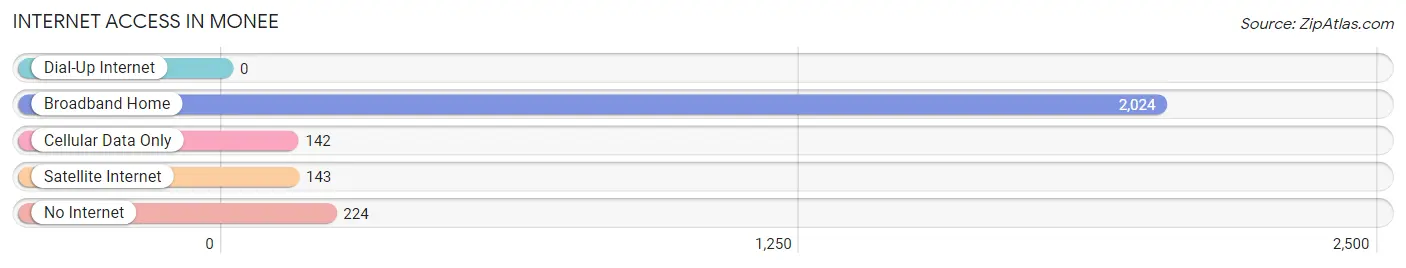
| Internet Type | # Households | % Households |
| Dial-Up Internet | 0 | 0.0% |
| Broadband Home | 2,024 | 83.3% |
| Cellular Data Only | 142 | 5.9% |
| Satellite Internet | 143 | 5.9% |
| No Internet | 224 | 9.2% |
| Total | 2,429 | 100.0% |
Monee Summary
Monee, Illinois is a small village located in Will County, approximately 40 miles south of Chicago. The village is situated in the northeastern corner of Will County, and is bordered by the towns of Crete, University Park, and Park Forest. The population of Monee was 5,845 in the 2010 census, and the village covers an area of 4.2 square miles.
History
Monee was first settled in 1834 by a group of settlers from New York. The village was originally known as “Monee Station”, and was named after the Monee family who owned the land. The village was officially incorporated in 1867, and the first post office was established in 1868.
In the late 19th century, Monee was a thriving agricultural community, with many farms and orchards. The village was also home to several businesses, including a blacksmith shop, a general store, and a hotel.
In the early 20th century, Monee began to experience a period of growth and development. The village was connected to the Chicago and Eastern Illinois Railroad in 1906, and the first school was built in 1908. The village also saw the construction of several churches, a bank, and a library.
Geography
Monee is located in northeastern Will County, approximately 40 miles south of Chicago. The village is situated on the banks of the Kankakee River, and is bordered by the towns of Crete, University Park, and Park Forest.
The village covers an area of 4.2 square miles, and is located at an elevation of 645 feet. The climate in Monee is classified as humid continental, with hot summers and cold winters. The average annual temperature is 52 degrees Fahrenheit, and the average annual precipitation is 37 inches.
Economy
Monee’s economy is largely based on agriculture and manufacturing. The village is home to several farms and orchards, as well as several manufacturing plants. The village is also home to several retail stores, restaurants, and other businesses.
Demographics
As of the 2010 census, the population of Monee was 5,845. The racial makeup of the village was 87.3% White, 8.2% African American, 0.7% Native American, 0.7% Asian, 0.1% Pacific Islander, 1.2% from other races, and 1.9% from two or more races. Hispanic or Latino of any race were 4.2% of the population.
The median household income in Monee was $63,917, and the median family income was $71,917. The per capita income was $25,917. About 5.2% of families and 6.7% of the population were below the poverty line.
Common Questions
What is Per Capita Income in Monee?
Per Capita income in Monee is $60,890.
What is the Median Family Income in Monee?
Median Family Income in Monee is $115,129.
What is the Median Household income in Monee?
Median Household Income in Monee is $86,849.
What is Income or Wage Gap in Monee?
Income or Wage Gap in Monee is 46.8%.
Women in Monee earn 53.2 cents for every dollar earned by a man.
What is Inequality or Gini Index in Monee?
Inequality or Gini Index in Monee is 0.42.
What is the Total Population of Monee?
Total Population of Monee is 5,120.
What is the Total Male Population of Monee?
Total Male Population of Monee is 2,568.
What is the Total Female Population of Monee?
Total Female Population of Monee is 2,552.
What is the Ratio of Males per 100 Females in Monee?
There are 100.63 Males per 100 Females in Monee.
What is the Ratio of Females per 100 Males in Monee?
There are 99.38 Females per 100 Males in Monee.
What is the Median Population Age in Monee?
Median Population Age in Monee is 48.4 Years.
What is the Average Family Size in Monee
Average Family Size in Monee is 2.5 People.
What is the Average Household Size in Monee
Average Household Size in Monee is 2.1 People.
How Large is the Labor Force in Monee?
There are 3,160 People in the Labor Forcein in Monee.
What is the Percentage of People in the Labor Force in Monee?
69.2% of People are in the Labor Force in Monee.
What is the Unemployment Rate in Monee?
Unemployment Rate in Monee is 1.6%.