Hillsboro, IL Map & Demographics
Hillsboro Map
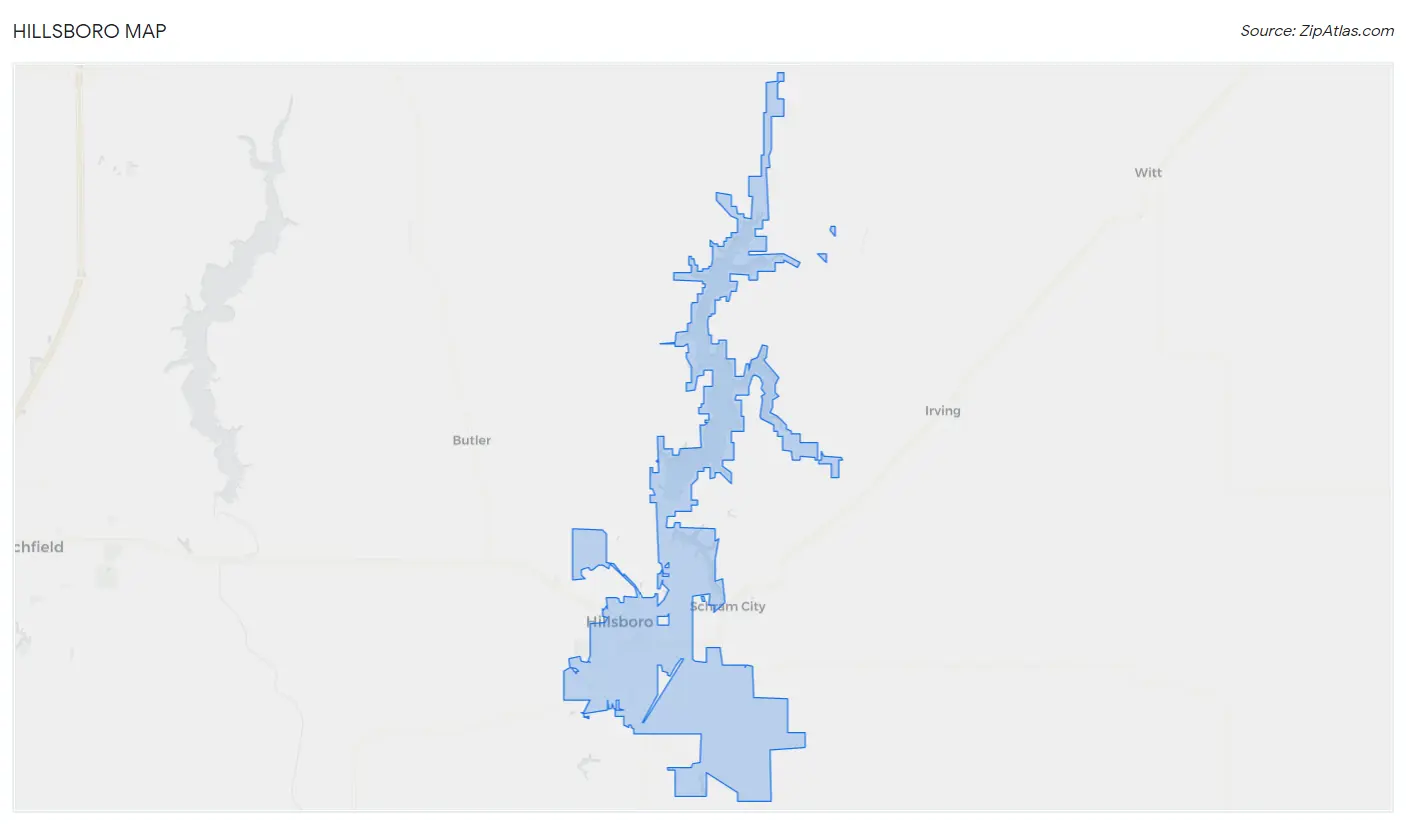
Hillsboro Overview
$22,296
PER CAPITA INCOME
$83,750
AVG FAMILY INCOME
$48,302
AVG HOUSEHOLD INCOME
18.1%
WAGE / INCOME GAP [ % ]
81.9¢/ $1
WAGE / INCOME GAP [ $ ]
0.45
INEQUALITY / GINI INDEX
5,673
TOTAL POPULATION
3,795
MALE POPULATION
1,878
FEMALE POPULATION
202.08
MALES / 100 FEMALES
49.49
FEMALES / 100 MALES
40.2
MEDIAN AGE
3.1
AVG FAMILY SIZE
2.3
AVG HOUSEHOLD SIZE
1,485
LABOR FORCE [ PEOPLE ]
30.0%
PERCENT IN LABOR FORCE
5.4%
UNEMPLOYMENT RATE
Hillsboro Zip Codes
Hillsboro Area Codes
Income in Hillsboro
Income Overview in Hillsboro
Per Capita Income in Hillsboro is $22,296, while median incomes of families and households are $83,750 and $48,302 respectively.
| Characteristic | Number | Measure |
| Per Capita Income | 5,673 | $22,296 |
| Median Family Income | 899 | $83,750 |
| Mean Family Income | 899 | $95,401 |
| Median Household Income | 1,656 | $48,302 |
| Mean Household Income | 1,656 | $69,469 |
| Income Deficit | 899 | $0 |
| Wage / Income Gap (%) | 5,673 | 18.05% |
| Wage / Income Gap ($) | 5,673 | 81.95¢ per $1 |
| Gini / Inequality Index | 5,673 | 0.45 |
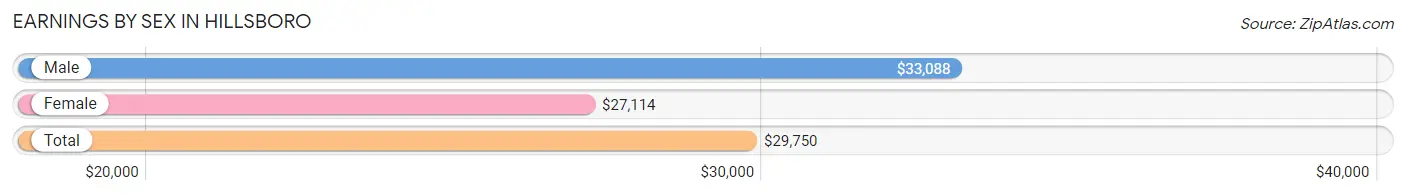
Earnings by Sex in Hillsboro
Average Earnings in Hillsboro are $29,750, $33,088 for men and $27,114 for women, a difference of 18.0%.
| Sex | Number | Average Earnings |
| Male | 1,314 (64.6%) | $33,088 |
| Female | 721 (35.4%) | $27,114 |
| Total | 2,035 (100.0%) | $29,750 |
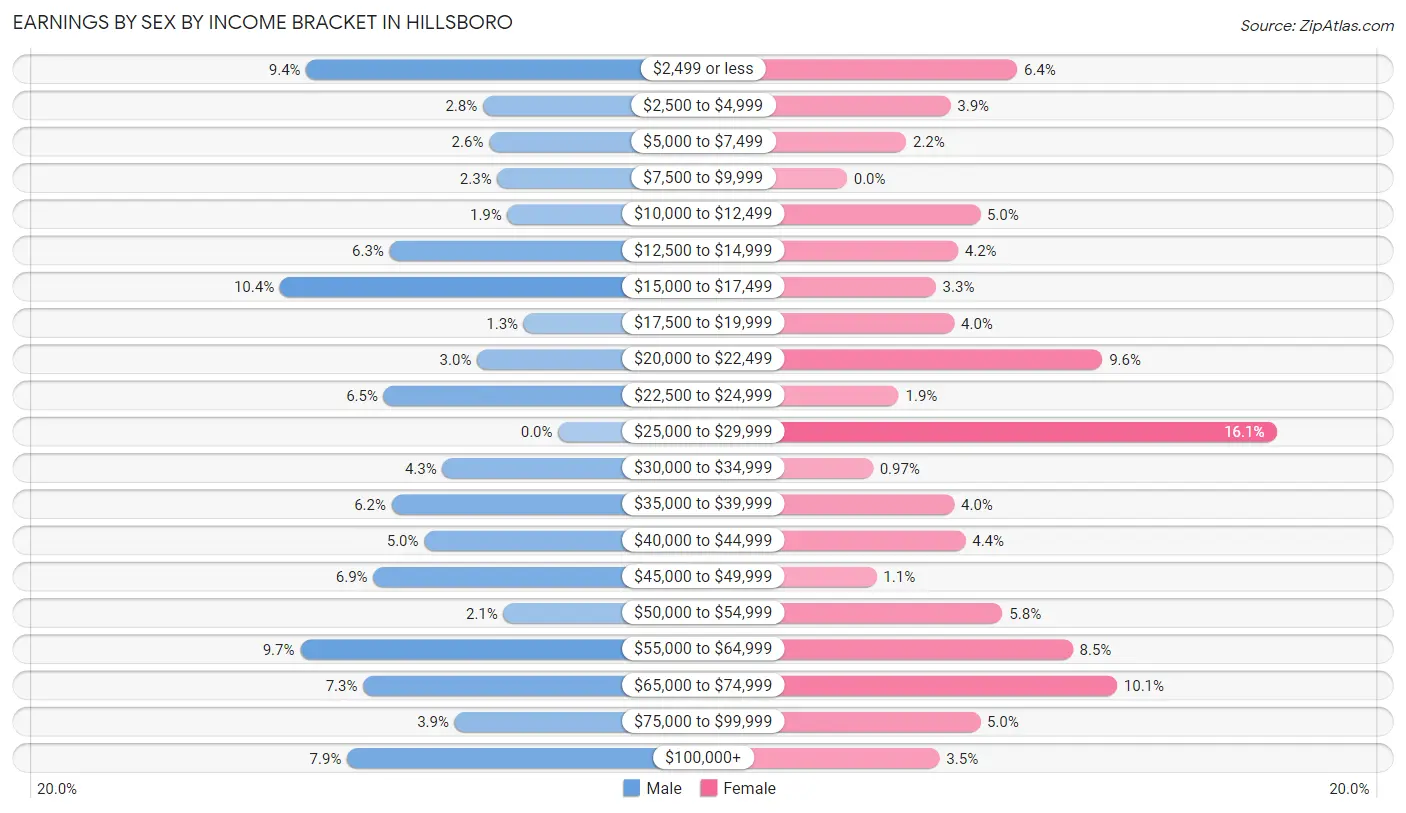
Earnings by Sex by Income Bracket in Hillsboro
The most common earnings brackets in Hillsboro are $15,000 to $17,499 for men (137 | 10.4%) and $25,000 to $29,999 for women (116 | 16.1%).
| Income | Male | Female |
| $2,499 or less | 124 (9.4%) | 46 (6.4%) |
| $2,500 to $4,999 | 37 (2.8%) | 28 (3.9%) |
| $5,000 to $7,499 | 34 (2.6%) | 16 (2.2%) |
| $7,500 to $9,999 | 30 (2.3%) | 0 (0.0%) |
| $10,000 to $12,499 | 25 (1.9%) | 36 (5.0%) |
| $12,500 to $14,999 | 83 (6.3%) | 30 (4.2%) |
| $15,000 to $17,499 | 137 (10.4%) | 24 (3.3%) |
| $17,500 to $19,999 | 17 (1.3%) | 29 (4.0%) |
| $20,000 to $22,499 | 40 (3.0%) | 69 (9.6%) |
| $22,500 to $24,999 | 86 (6.5%) | 14 (1.9%) |
| $25,000 to $29,999 | 0 (0.0%) | 116 (16.1%) |
| $30,000 to $34,999 | 57 (4.3%) | 7 (1.0%) |
| $35,000 to $39,999 | 82 (6.2%) | 29 (4.0%) |
| $40,000 to $44,999 | 66 (5.0%) | 32 (4.4%) |
| $45,000 to $49,999 | 91 (6.9%) | 8 (1.1%) |
| $50,000 to $54,999 | 27 (2.1%) | 42 (5.8%) |
| $55,000 to $64,999 | 127 (9.7%) | 61 (8.5%) |
| $65,000 to $74,999 | 96 (7.3%) | 73 (10.1%) |
| $75,000 to $99,999 | 51 (3.9%) | 36 (5.0%) |
| $100,000+ | 104 (7.9%) | 25 (3.5%) |
| Total | 1,314 (100.0%) | 721 (100.0%) |
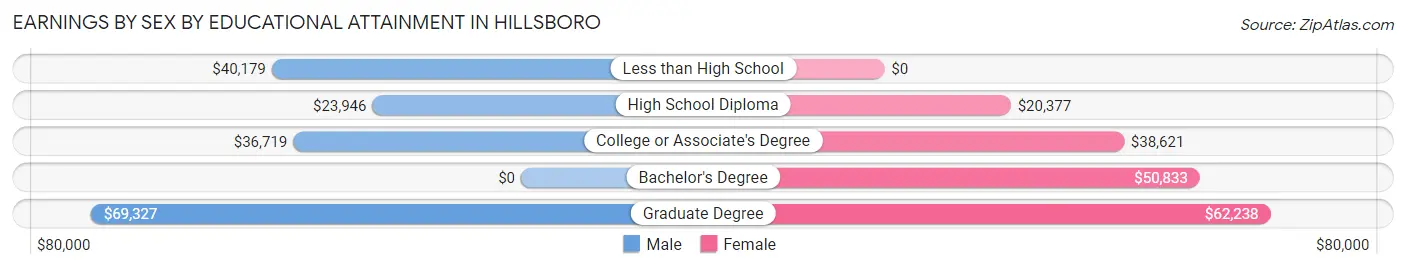
Earnings by Sex by Educational Attainment in Hillsboro
Average earnings in Hillsboro are $36,362 for men and $31,250 for women, a difference of 14.1%. Men with an educational attainment of graduate degree enjoy the highest average annual earnings of $69,327, while those with high school diploma education earn the least with $23,946. Women with an educational attainment of graduate degree earn the most with the average annual earnings of $62,238, while those with high school diploma education have the smallest earnings of $20,377.
| Educational Attainment | Male Income | Female Income |
| Less than High School | $40,179 | $0 |
| High School Diploma | $23,946 | $20,377 |
| College or Associate's Degree | $36,719 | $38,621 |
| Bachelor's Degree | - | - |
| Graduate Degree | $69,327 | $62,238 |
| Total | $36,362 | $31,250 |
Family Income in Hillsboro
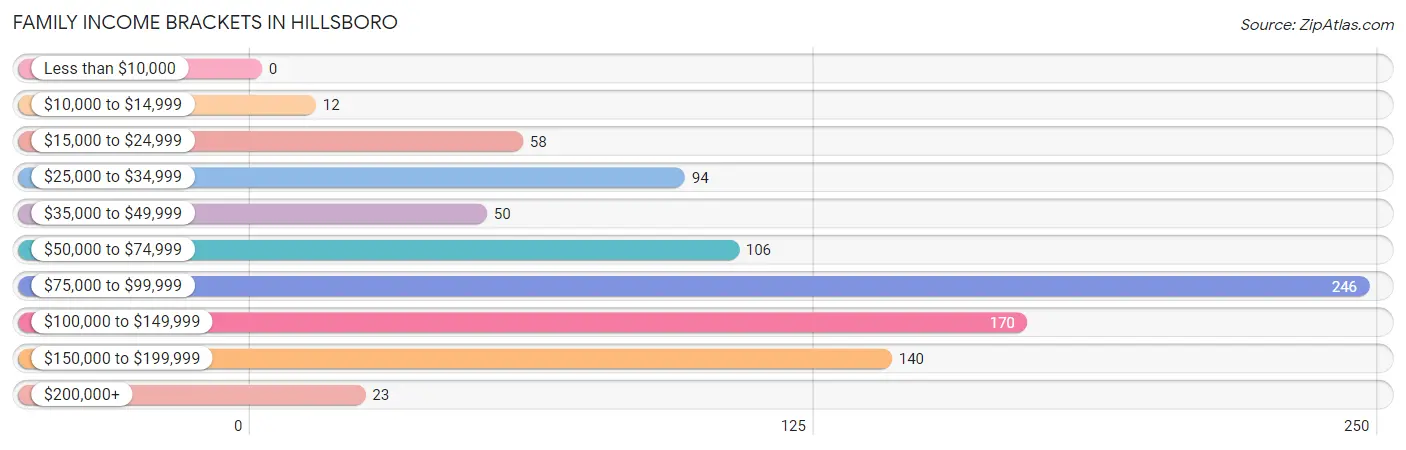
Family Income Brackets in Hillsboro
According to the Hillsboro family income data, there are 246 families falling into the $75,000 to $99,999 income range, which is the most common income bracket and makes up 27.4% of all families.
| Income Bracket | # Families | % Families |
| Less than $10,000 | 0 | 0.0% |
| $10,000 to $14,999 | 12 | 1.3% |
| $15,000 to $24,999 | 58 | 6.5% |
| $25,000 to $34,999 | 94 | 10.5% |
| $35,000 to $49,999 | 50 | 5.6% |
| $50,000 to $74,999 | 106 | 11.8% |
| $75,000 to $99,999 | 246 | 27.4% |
| $100,000 to $149,999 | 170 | 18.9% |
| $150,000 to $199,999 | 140 | 15.6% |
| $200,000+ | 23 | 2.6% |
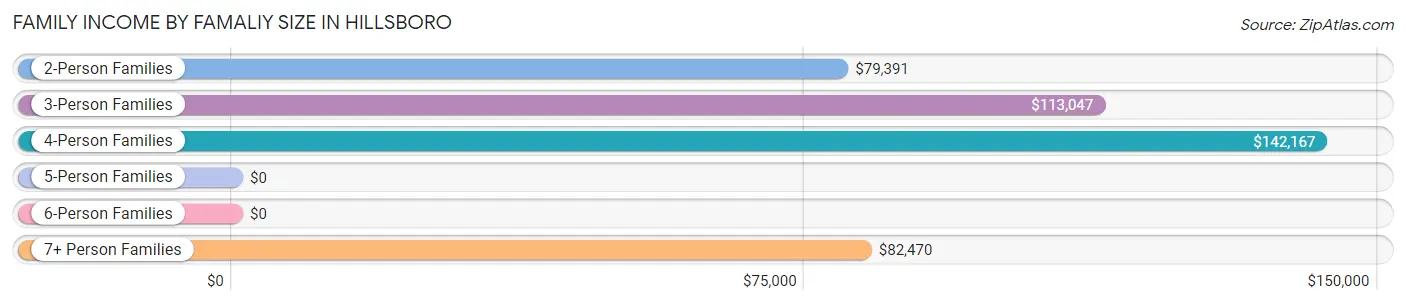
Family Income by Famaliy Size in Hillsboro
4-person families (74 | 8.2%) account for the highest median family income in Hillsboro with $142,167 per family, while 2-person families (551 | 61.3%) have the highest median income of $39,696 per family member.
| Income Bracket | # Families | Median Income |
| 2-Person Families | 551 (61.3%) | $79,391 |
| 3-Person Families | 71 (7.9%) | $113,047 |
| 4-Person Families | 74 (8.2%) | $142,167 |
| 5-Person Families | 109 (12.1%) | $0 |
| 6-Person Families | 13 (1.5%) | $0 |
| 7+ Person Families | 81 (9.0%) | $82,470 |
| Total | 899 (100.0%) | $83,750 |
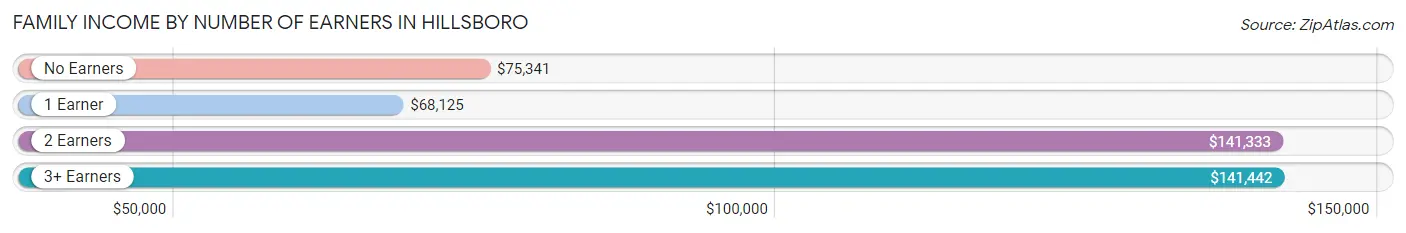
Family Income by Number of Earners in Hillsboro
The median family income in Hillsboro is $83,750, with families comprising 3+ earners (45) having the highest median family income of $141,442, while families with 1 earner (327) have the lowest median family income of $68,125, accounting for 5.0% and 36.4% of families, respectively.
| Number of Earners | # Families | Median Income |
| No Earners | 241 (26.8%) | $75,341 |
| 1 Earner | 327 (36.4%) | $68,125 |
| 2 Earners | 286 (31.8%) | $141,333 |
| 3+ Earners | 45 (5.0%) | $141,442 |
| Total | 899 (100.0%) | $83,750 |
Household Income in Hillsboro
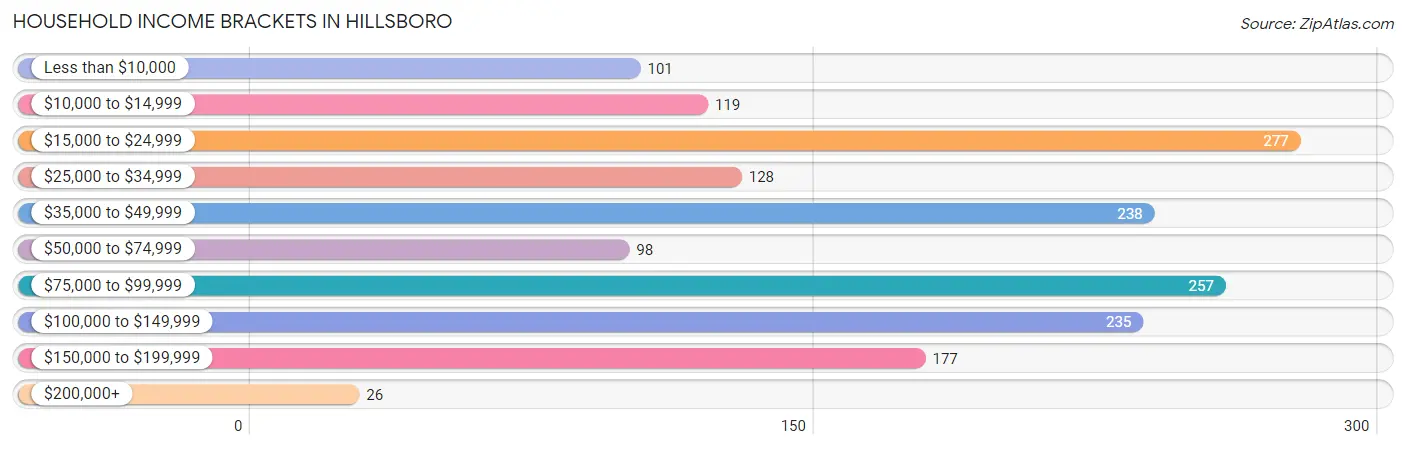
Household Income Brackets in Hillsboro
With 277 households falling in the category, the $15,000 to $24,999 income range is the most frequent in Hillsboro, accounting for 16.7% of all households. In contrast, only 26 households (1.6%) fall into the $200,000+ income bracket, making it the least populous group.
| Income Bracket | # Households | % Households |
| Less than $10,000 | 101 | 6.1% |
| $10,000 to $14,999 | 119 | 7.2% |
| $15,000 to $24,999 | 277 | 16.7% |
| $25,000 to $34,999 | 128 | 7.7% |
| $35,000 to $49,999 | 238 | 14.4% |
| $50,000 to $74,999 | 98 | 5.9% |
| $75,000 to $99,999 | 257 | 15.5% |
| $100,000 to $149,999 | 235 | 14.2% |
| $150,000 to $199,999 | 177 | 10.7% |
| $200,000+ | 26 | 1.6% |
Household Income by Householder Age in Hillsboro
The median household income in Hillsboro is $48,302, with the highest median household income of $77,788 found in the 45 to 64 years age bracket for the primary householder. A total of 589 households (35.6%) fall into this category. Meanwhile, the 15 to 24 years age bracket for the primary householder has the lowest median household income of $0, with 45 households (2.7%) in this group.
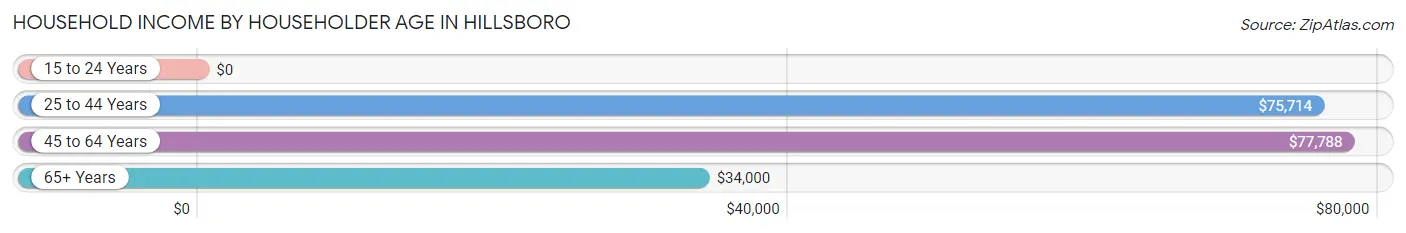
| Income Bracket | # Households | Median Income |
| 15 to 24 Years | 45 (2.7%) | $0 |
| 25 to 44 Years | 384 (23.2%) | $75,714 |
| 45 to 64 Years | 589 (35.6%) | $77,788 |
| 65+ Years | 638 (38.5%) | $34,000 |
| Total | 1,656 (100.0%) | $48,302 |
Poverty in Hillsboro
Income Below Poverty by Sex and Age in Hillsboro
With 17.2% poverty level for males and 12.9% for females among the residents of Hillsboro, 6 to 11 year old males and 6 to 11 year old females are the most vulnerable to poverty, with 49 males (41.5%) and 97 females (53.9%) in their respective age groups living below the poverty level.
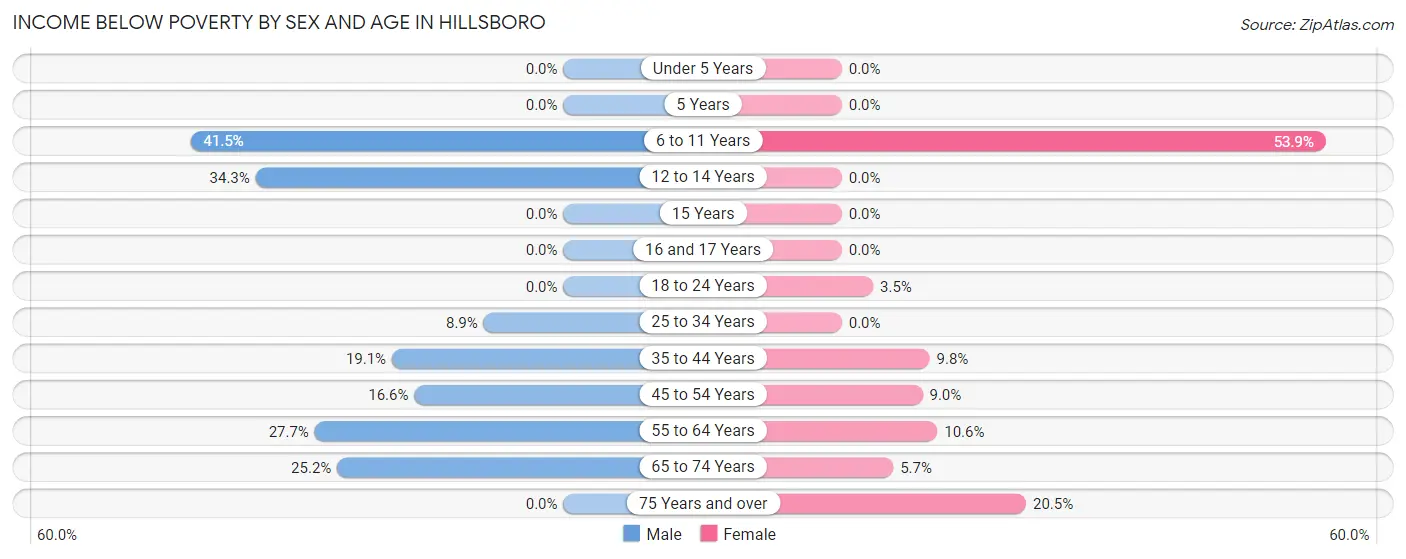
| Age Bracket | Male | Female |
| Under 5 Years | 0 (0.0%) | 0 (0.0%) |
| 5 Years | 0 (0.0%) | 0 (0.0%) |
| 6 to 11 Years | 49 (41.5%) | 97 (53.9%) |
| 12 to 14 Years | 49 (34.3%) | 0 (0.0%) |
| 15 Years | 0 (0.0%) | 0 (0.0%) |
| 16 and 17 Years | 0 (0.0%) | 0 (0.0%) |
| 18 to 24 Years | 0 (0.0%) | 3 (3.5%) |
| 25 to 34 Years | 15 (8.9%) | 0 (0.0%) |
| 35 to 44 Years | 46 (19.1%) | 18 (9.8%) |
| 45 to 54 Years | 42 (16.6%) | 16 (9.0%) |
| 55 to 64 Years | 67 (27.7%) | 40 (10.6%) |
| 65 to 74 Years | 66 (25.2%) | 13 (5.7%) |
| 75 Years and over | 0 (0.0%) | 47 (20.5%) |
| Total | 334 (17.2%) | 234 (12.9%) |
Income Above Poverty by Sex and Age in Hillsboro
According to the poverty statistics in Hillsboro, males aged under 5 years and females aged under 5 years are the age groups that are most secure financially, with 100.0% of males and 100.0% of females in these age groups living above the poverty line.
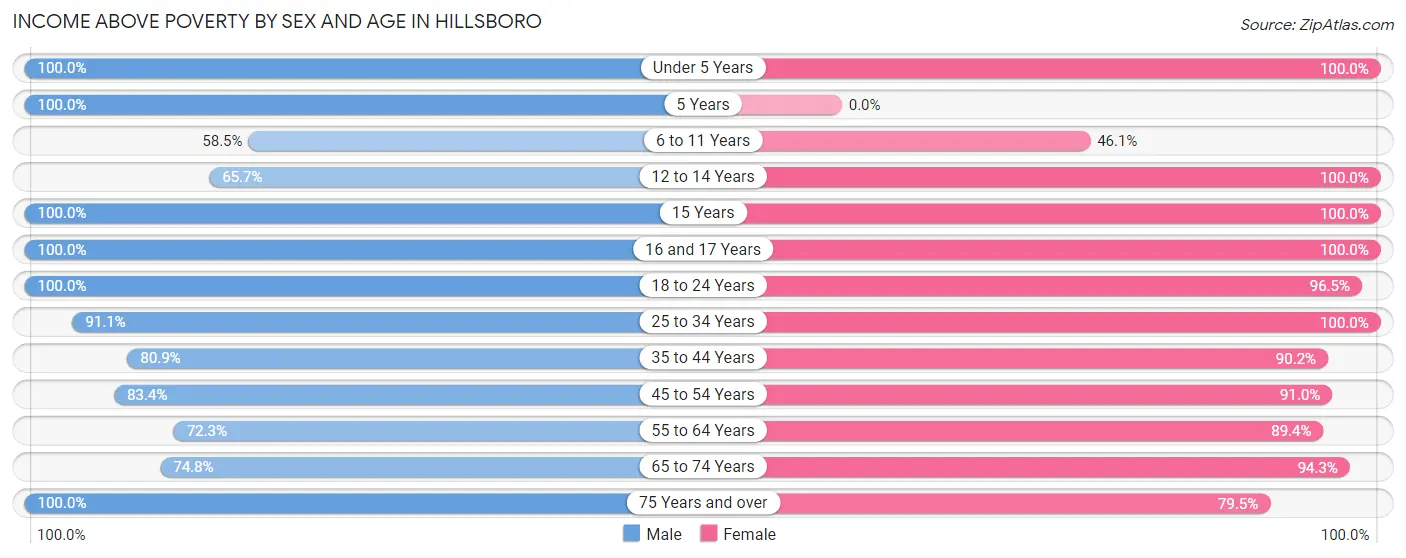
| Age Bracket | Male | Female |
| Under 5 Years | 72 (100.0%) | 56 (100.0%) |
| 5 Years | 46 (100.0%) | 0 (0.0%) |
| 6 to 11 Years | 69 (58.5%) | 83 (46.1%) |
| 12 to 14 Years | 94 (65.7%) | 50 (100.0%) |
| 15 Years | 17 (100.0%) | 41 (100.0%) |
| 16 and 17 Years | 156 (100.0%) | 100 (100.0%) |
| 18 to 24 Years | 99 (100.0%) | 83 (96.5%) |
| 25 to 34 Years | 154 (91.1%) | 109 (100.0%) |
| 35 to 44 Years | 195 (80.9%) | 166 (90.2%) |
| 45 to 54 Years | 211 (83.4%) | 162 (91.0%) |
| 55 to 64 Years | 175 (72.3%) | 336 (89.4%) |
| 65 to 74 Years | 196 (74.8%) | 214 (94.3%) |
| 75 Years and over | 120 (100.0%) | 182 (79.5%) |
| Total | 1,604 (82.8%) | 1,582 (87.1%) |
Income Below Poverty Among Married-Couple Families in Hillsboro
The poverty statistics for married-couple families in Hillsboro show that 1.8% or 12 of the total 680 families live below the poverty line. Families with no children have the highest poverty rate of 2.9%, comprising of 12 families. On the other hand, families with 1 or 2 children have the lowest poverty rate of 0.0%, which includes 0 families.
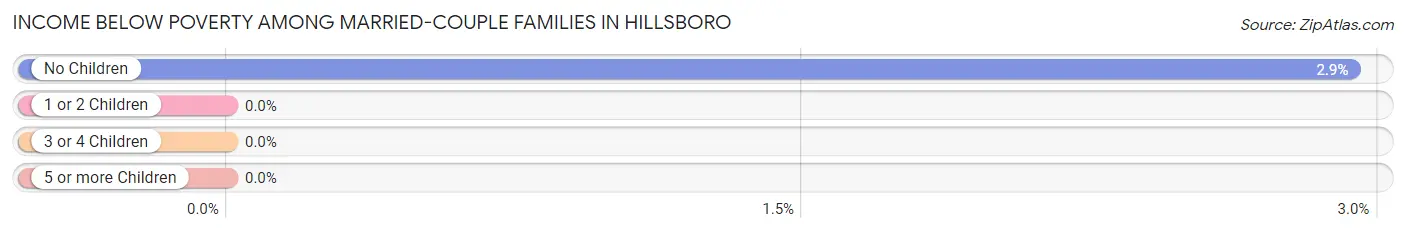
| Children | Above Poverty | Below Poverty |
| No Children | 397 (97.1%) | 12 (2.9%) |
| 1 or 2 Children | 125 (100.0%) | 0 (0.0%) |
| 3 or 4 Children | 123 (100.0%) | 0 (0.0%) |
| 5 or more Children | 23 (100.0%) | 0 (0.0%) |
| Total | 668 (98.2%) | 12 (1.8%) |
Income Below Poverty Among Single-Parent Households in Hillsboro
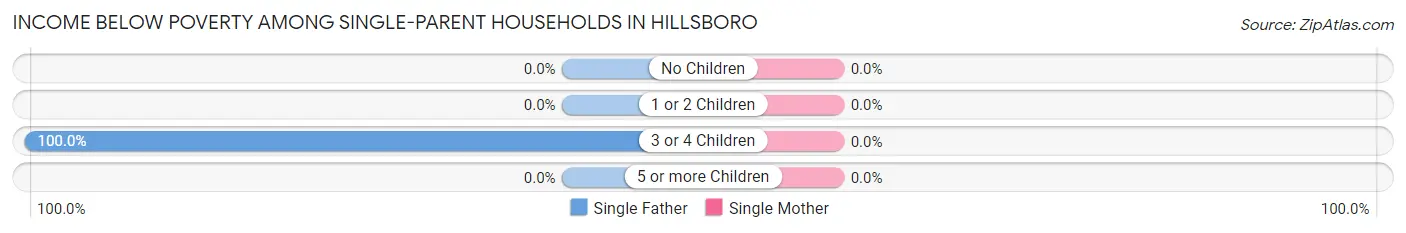
| Children | Single Father | Single Mother |
| No Children | 0 (0.0%) | 0 (0.0%) |
| 1 or 2 Children | 0 (0.0%) | 0 (0.0%) |
| 3 or 4 Children | 40 (100.0%) | 0 (0.0%) |
| 5 or more Children | 0 (0.0%) | 0 (0.0%) |
| Total | 40 (38.5%) | 0 (0.0%) |
Income Below Poverty Among Married-Couple vs Single-Parent Households in Hillsboro
The poverty data for Hillsboro shows that 12 of the married-couple family households (1.8%) and 40 of the single-parent households (18.3%) are living below the poverty level. Within the married-couple family households, those with no children have the highest poverty rate, with 12 households (2.9%) falling below the poverty line. Among the single-parent households, those with 3 or 4 children have the highest poverty rate, with 40 household (62.5%) living below poverty.
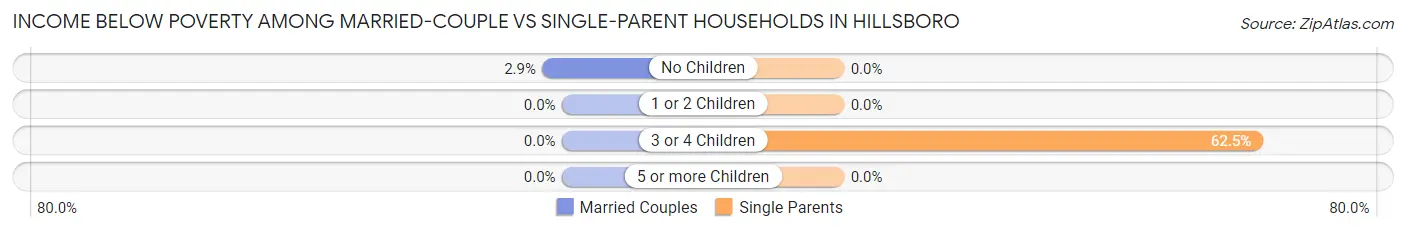
| Children | Married-Couple Families | Single-Parent Households |
| No Children | 12 (2.9%) | 0 (0.0%) |
| 1 or 2 Children | 0 (0.0%) | 0 (0.0%) |
| 3 or 4 Children | 0 (0.0%) | 40 (62.5%) |
| 5 or more Children | 0 (0.0%) | 0 (0.0%) |
| Total | 12 (1.8%) | 40 (18.3%) |
Race in Hillsboro
The most populous races in Hillsboro are White / Caucasian (4,742 | 83.6%), Black / African American (664 | 11.7%), and Hispanic or Latino (302 | 5.3%).
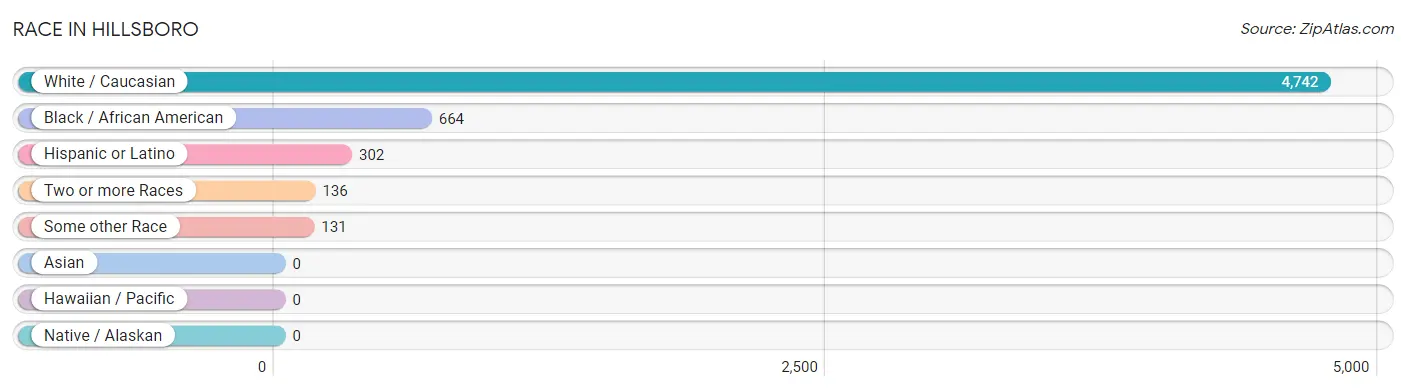
| Race | # Population | % Population |
| Asian | 0 | 0.0% |
| Black / African American | 664 | 11.7% |
| Hawaiian / Pacific | 0 | 0.0% |
| Hispanic or Latino | 302 | 5.3% |
| Native / Alaskan | 0 | 0.0% |
| White / Caucasian | 4,742 | 83.6% |
| Two or more Races | 136 | 2.4% |
| Some other Race | 131 | 2.3% |
| Total | 5,673 | 100.0% |
Ancestry in Hillsboro
The most populous ancestries reported in Hillsboro are German (1,627 | 28.7%), English (659 | 11.6%), Irish (566 | 10.0%), American (549 | 9.7%), and Italian (276 | 4.9%), together accounting for 64.8% of all Hillsboro residents.
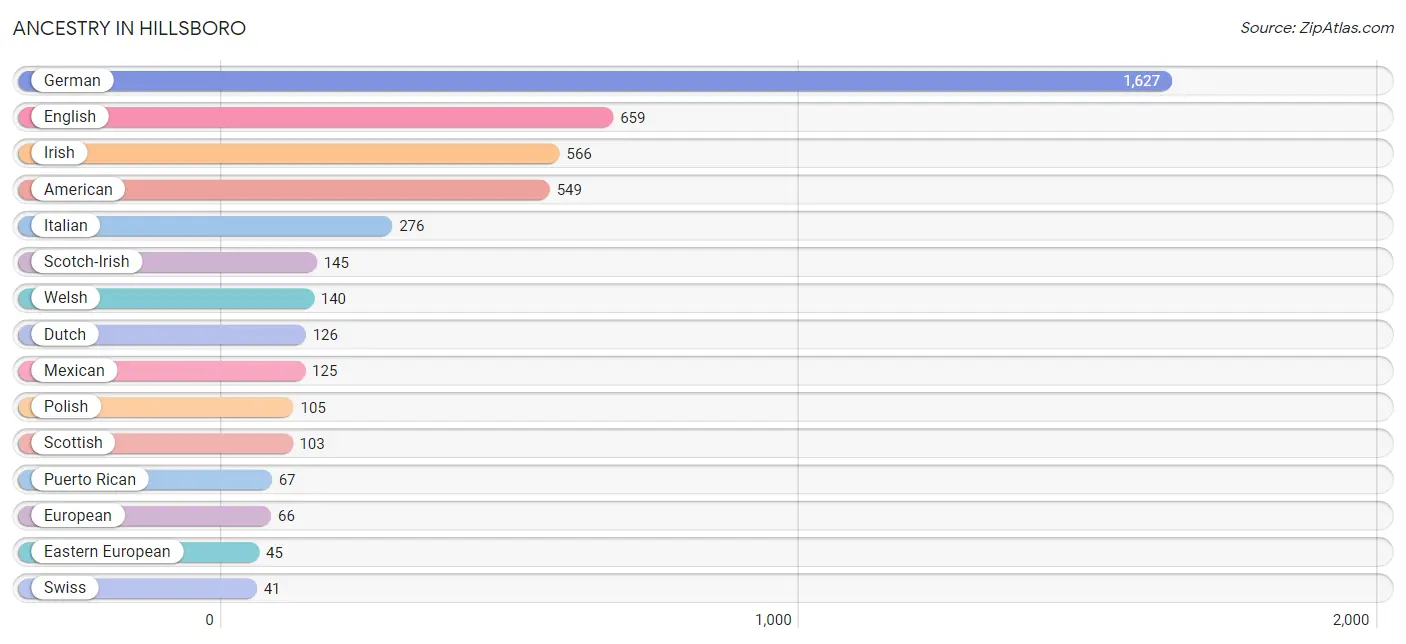
| Ancestry | # Population | % Population |
| African | 23 | 0.4% |
| American | 549 | 9.7% |
| British | 16 | 0.3% |
| Central American | 26 | 0.5% |
| Cherokee | 14 | 0.3% |
| Czech | 18 | 0.3% |
| Czechoslovakian | 12 | 0.2% |
| Dutch | 126 | 2.2% |
| Eastern European | 45 | 0.8% |
| English | 659 | 11.6% |
| European | 66 | 1.2% |
| French | 8 | 0.1% |
| German | 1,627 | 28.7% |
| Greek | 18 | 0.3% |
| Honduran | 26 | 0.5% |
| Irish | 566 | 10.0% |
| Italian | 276 | 4.9% |
| Mexican | 125 | 2.2% |
| Norwegian | 21 | 0.4% |
| Pennsylvania German | 5 | 0.1% |
| Polish | 105 | 1.8% |
| Puerto Rican | 67 | 1.2% |
| Russian | 28 | 0.5% |
| Scotch-Irish | 145 | 2.6% |
| Scottish | 103 | 1.8% |
| Slovak | 37 | 0.6% |
| Slovene | 8 | 0.1% |
| Subsaharan African | 23 | 0.4% |
| Swiss | 41 | 0.7% |
| Welsh | 140 | 2.5% |
| Yugoslavian | 3 | 0.1% | View All 31 Rows |
Immigrants in Hillsboro
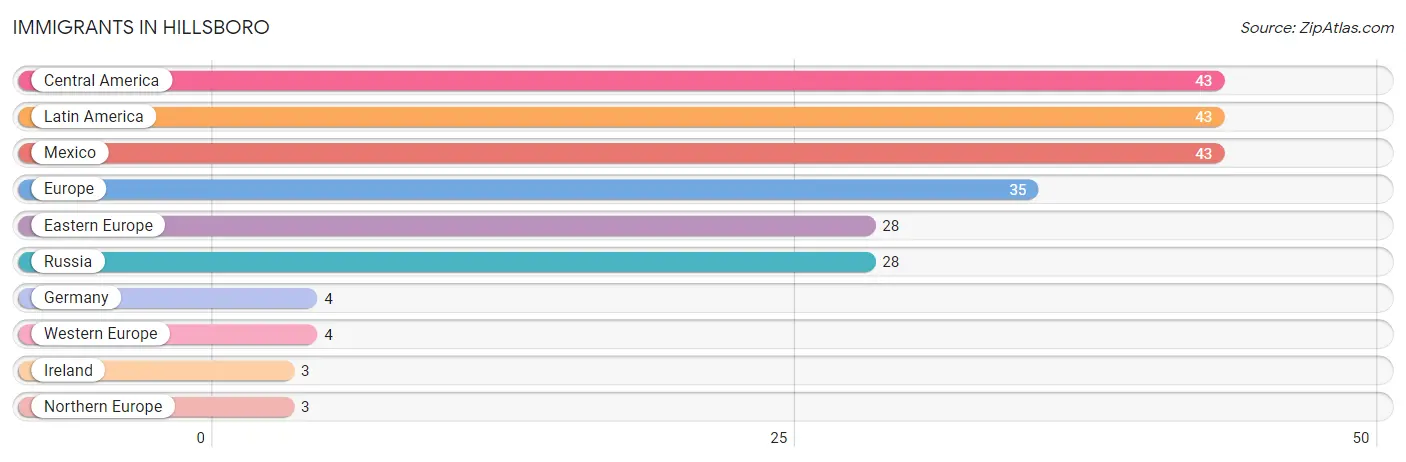
The most numerous immigrant groups reported in Hillsboro came from Central America (43 | 0.8%), Latin America (43 | 0.8%), Mexico (43 | 0.8%), Europe (35 | 0.6%), and Eastern Europe (28 | 0.5%), together accounting for 3.4% of all Hillsboro residents.
| Immigration Origin | # Population | % Population |
| Central America | 43 | 0.8% |
| Eastern Europe | 28 | 0.5% |
| Europe | 35 | 0.6% |
| Germany | 4 | 0.1% |
| Ireland | 3 | 0.1% |
| Latin America | 43 | 0.8% |
| Mexico | 43 | 0.8% |
| Northern Europe | 3 | 0.1% |
| Russia | 28 | 0.5% |
| Western Europe | 4 | 0.1% | View All 10 Rows |
Sex and Age in Hillsboro
Sex and Age in Hillsboro
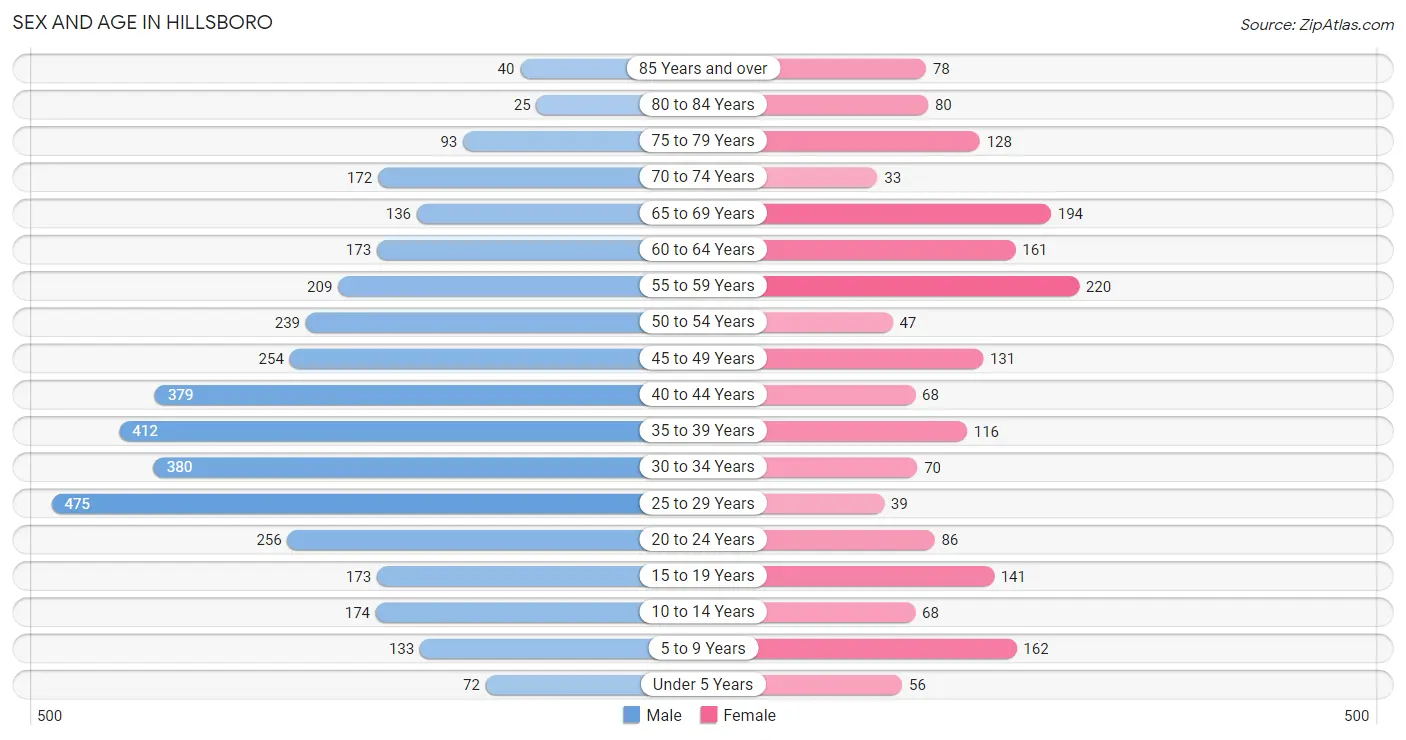
The most populous age groups in Hillsboro are 25 to 29 Years (475 | 12.5%) for men and 55 to 59 Years (220 | 11.7%) for women.
| Age Bracket | Male | Female |
| Under 5 Years | 72 (1.9%) | 56 (3.0%) |
| 5 to 9 Years | 133 (3.5%) | 162 (8.6%) |
| 10 to 14 Years | 174 (4.6%) | 68 (3.6%) |
| 15 to 19 Years | 173 (4.6%) | 141 (7.5%) |
| 20 to 24 Years | 256 (6.8%) | 86 (4.6%) |
| 25 to 29 Years | 475 (12.5%) | 39 (2.1%) |
| 30 to 34 Years | 380 (10.0%) | 70 (3.7%) |
| 35 to 39 Years | 412 (10.9%) | 116 (6.2%) |
| 40 to 44 Years | 379 (10.0%) | 68 (3.6%) |
| 45 to 49 Years | 254 (6.7%) | 131 (7.0%) |
| 50 to 54 Years | 239 (6.3%) | 47 (2.5%) |
| 55 to 59 Years | 209 (5.5%) | 220 (11.7%) |
| 60 to 64 Years | 173 (4.6%) | 161 (8.6%) |
| 65 to 69 Years | 136 (3.6%) | 194 (10.3%) |
| 70 to 74 Years | 172 (4.5%) | 33 (1.8%) |
| 75 to 79 Years | 93 (2.5%) | 128 (6.8%) |
| 80 to 84 Years | 25 (0.7%) | 80 (4.3%) |
| 85 Years and over | 40 (1.1%) | 78 (4.2%) |
| Total | 3,795 (100.0%) | 1,878 (100.0%) |
Families and Households in Hillsboro
Median Family Size in Hillsboro
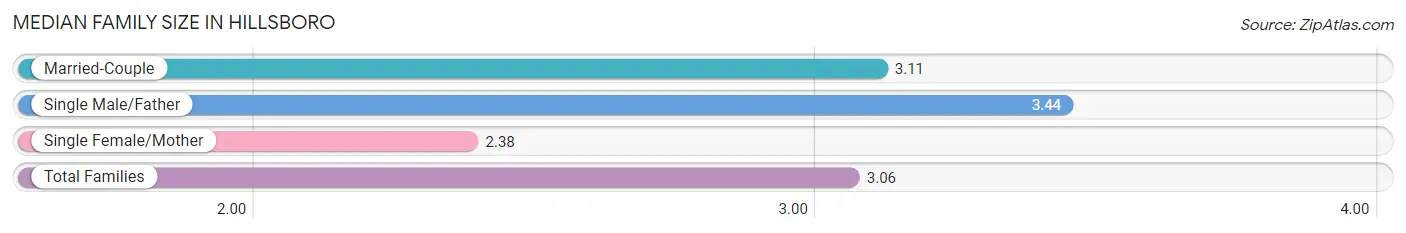
The median family size in Hillsboro is 3.06 persons per family, with single male/father families (104 | 11.6%) accounting for the largest median family size of 3.44 persons per family. On the other hand, single female/mother families (115 | 12.8%) represent the smallest median family size with 2.38 persons per family.
| Family Type | # Families | Family Size |
| Married-Couple | 680 (75.6%) | 3.11 |
| Single Male/Father | 104 (11.6%) | 3.44 |
| Single Female/Mother | 115 (12.8%) | 2.38 |
| Total Families | 899 (100.0%) | 3.06 |
Median Household Size in Hillsboro
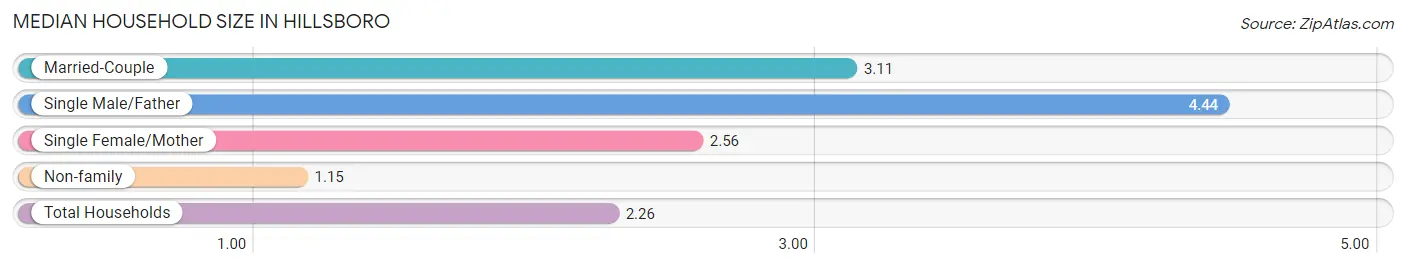
The median household size in Hillsboro is 2.26 persons per household, with single male/father households (104 | 6.3%) accounting for the largest median household size of 4.44 persons per household. non-family households (757 | 45.7%) represent the smallest median household size with 1.15 persons per household.
| Household Type | # Households | Household Size |
| Married-Couple | 680 (41.1%) | 3.11 |
| Single Male/Father | 104 (6.3%) | 4.44 |
| Single Female/Mother | 115 (6.9%) | 2.56 |
| Non-family | 757 (45.7%) | 1.15 |
| Total Households | 1,656 (100.0%) | 2.26 |
Household Size by Marriage Status in Hillsboro
Out of a total of 1,656 households in Hillsboro, 899 (54.3%) are family households, while 757 (45.7%) are nonfamily households. The most numerous type of family households are 2-person households, comprising 478, and the most common type of nonfamily households are 1-person households, comprising 620.
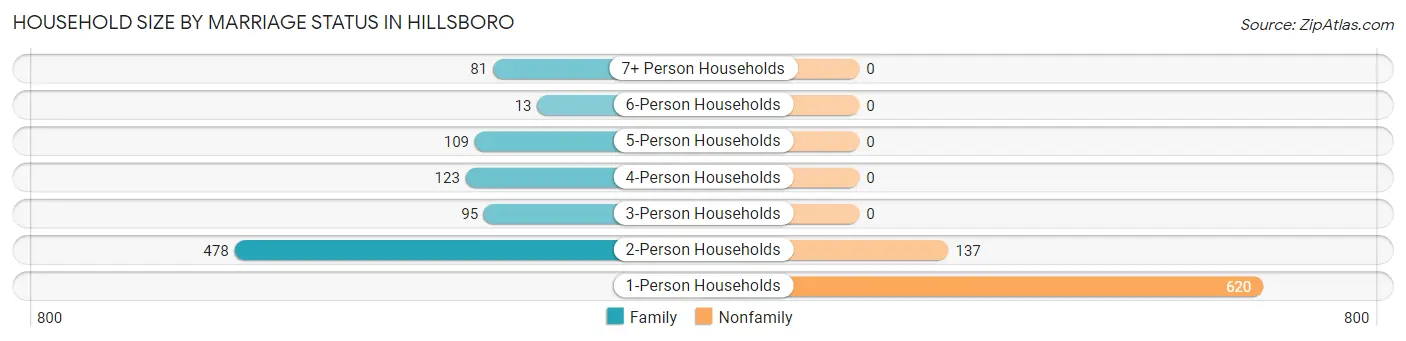
| Household Size | Family Households | Nonfamily Households |
| 1-Person Households | - | 620 (37.4%) |
| 2-Person Households | 478 (28.9%) | 137 (8.3%) |
| 3-Person Households | 95 (5.7%) | 0 (0.0%) |
| 4-Person Households | 123 (7.4%) | 0 (0.0%) |
| 5-Person Households | 109 (6.6%) | 0 (0.0%) |
| 6-Person Households | 13 (0.8%) | 0 (0.0%) |
| 7+ Person Households | 81 (4.9%) | 0 (0.0%) |
| Total | 899 (54.3%) | 757 (45.7%) |
Female Fertility in Hillsboro
Fertility by Age in Hillsboro
Average fertility rate in Hillsboro is 22.0 births per 1,000 women. Women in the age bracket of 20 to 34 years have the highest fertility rate with 77.0 births per 1,000 women. Women in the age bracket of 20 to 34 years acount for 100.0% of all women with births.
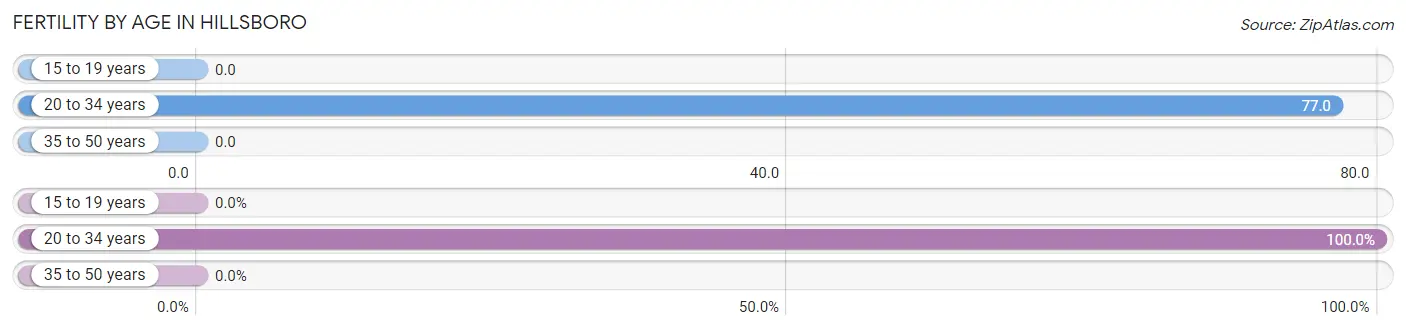
| Age Bracket | Women with Births | Births / 1,000 Women |
| 15 to 19 years | 0 (0.0%) | 0.0 |
| 20 to 34 years | 15 (100.0%) | 77.0 |
| 35 to 50 years | 0 (0.0%) | 0.0 |
| Total | 15 (100.0%) | 22.0 |
Fertility by Age by Marriage Status in Hillsboro
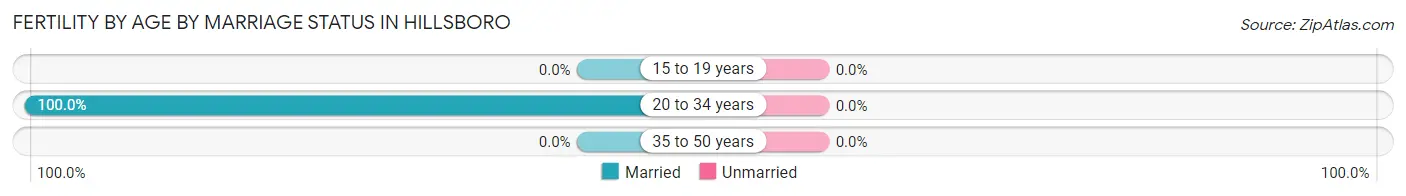
| Age Bracket | Married | Unmarried |
| 15 to 19 years | 0 (0.0%) | 0 (0.0%) |
| 20 to 34 years | 15 (100.0%) | 0 (0.0%) |
| 35 to 50 years | 0 (0.0%) | 0 (0.0%) |
| Total | 15 (100.0%) | 0 (0.0%) |
Fertility by Education in Hillsboro
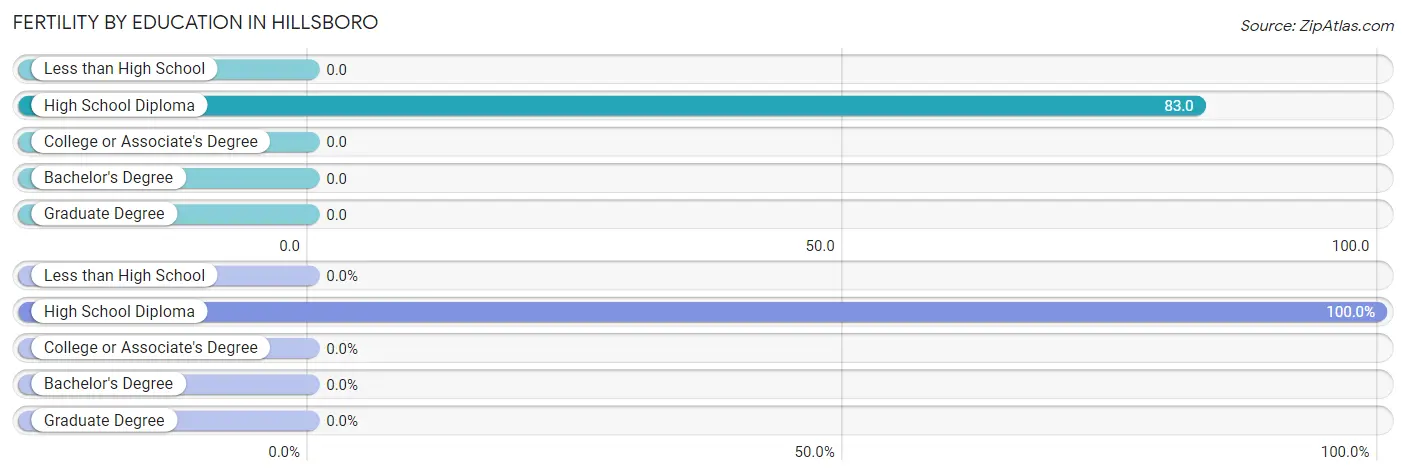
| Educational Attainment | Women with Births | Births / 1,000 Women |
| Less than High School | 0 (0.0%) | 0.0 |
| High School Diploma | 15 (100.0%) | 83.0 |
| College or Associate's Degree | 0 (0.0%) | 0.0 |
| Bachelor's Degree | 0 (0.0%) | 0.0 |
| Graduate Degree | 0 (0.0%) | 0.0 |
| Total | 15 (100.0%) | 22.0 |
Fertility by Education by Marriage Status in Hillsboro
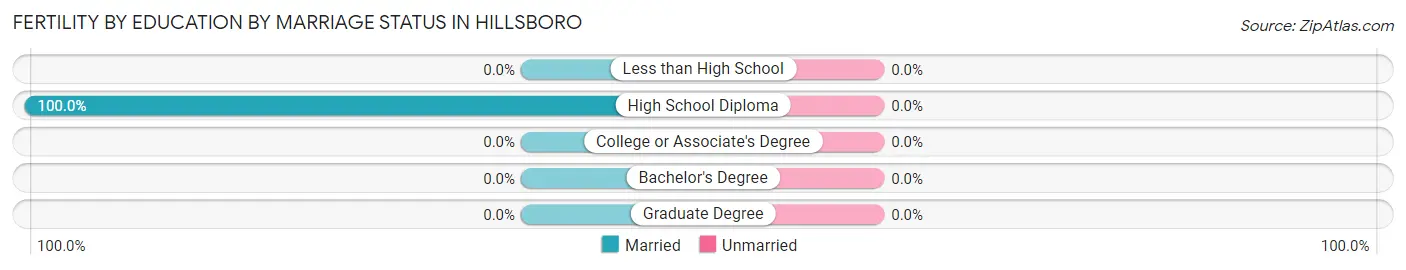
| Educational Attainment | Married | Unmarried |
| Less than High School | 0 (0.0%) | 0 (0.0%) |
| High School Diploma | 15 (100.0%) | 0 (0.0%) |
| College or Associate's Degree | 0 (0.0%) | 0 (0.0%) |
| Bachelor's Degree | 0 (0.0%) | 0 (0.0%) |
| Graduate Degree | 0 (0.0%) | 0 (0.0%) |
| Total | 15 (100.0%) | 0 (0.0%) |
Employment Characteristics in Hillsboro
Employment by Class of Employer in Hillsboro
Among the 1,345 employed individuals in Hillsboro, private company employees (788 | 58.6%), local government employees (183 | 13.6%), and not-for-profit organizations (125 | 9.3%) make up the most common classes of employment.
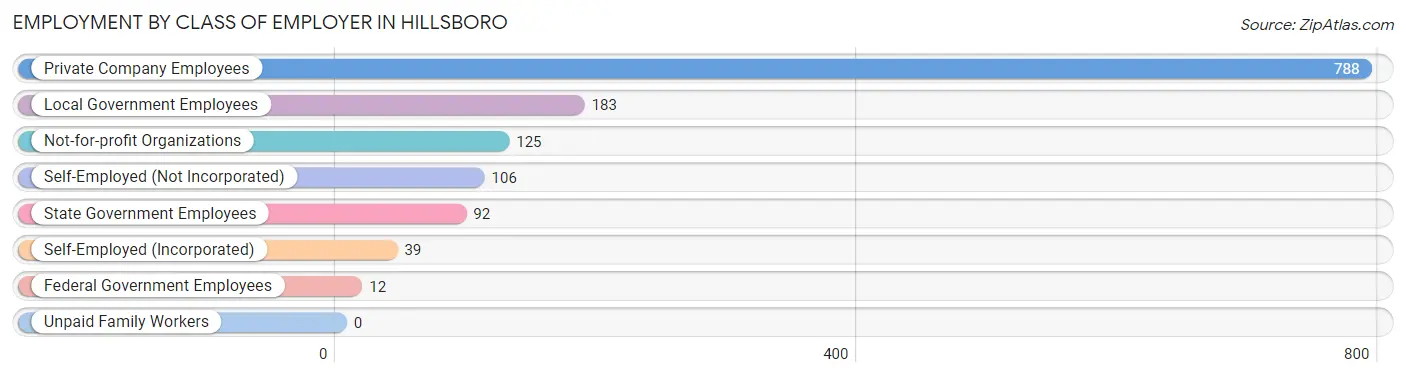
| Employer Class | # Employees | % Employees |
| Private Company Employees | 788 | 58.6% |
| Self-Employed (Incorporated) | 39 | 2.9% |
| Self-Employed (Not Incorporated) | 106 | 7.9% |
| Not-for-profit Organizations | 125 | 9.3% |
| Local Government Employees | 183 | 13.6% |
| State Government Employees | 92 | 6.8% |
| Federal Government Employees | 12 | 0.9% |
| Unpaid Family Workers | 0 | 0.0% |
| Total | 1,345 | 100.0% |
Employment Status by Age in Hillsboro
According to the labor force statistics for Hillsboro, out of the total population over 16 years of age (4,950), 30.0% or 1,485 individuals are in the labor force, with 5.4% or 80 of them unemployed. The age group with the highest labor force participation rate is 20 to 24 years, with 49.7% or 170 individuals in the labor force. Within the labor force, the 25 to 29 years age range has the highest percentage of unemployed individuals, with 33.1% or 40 of them being unemployed.
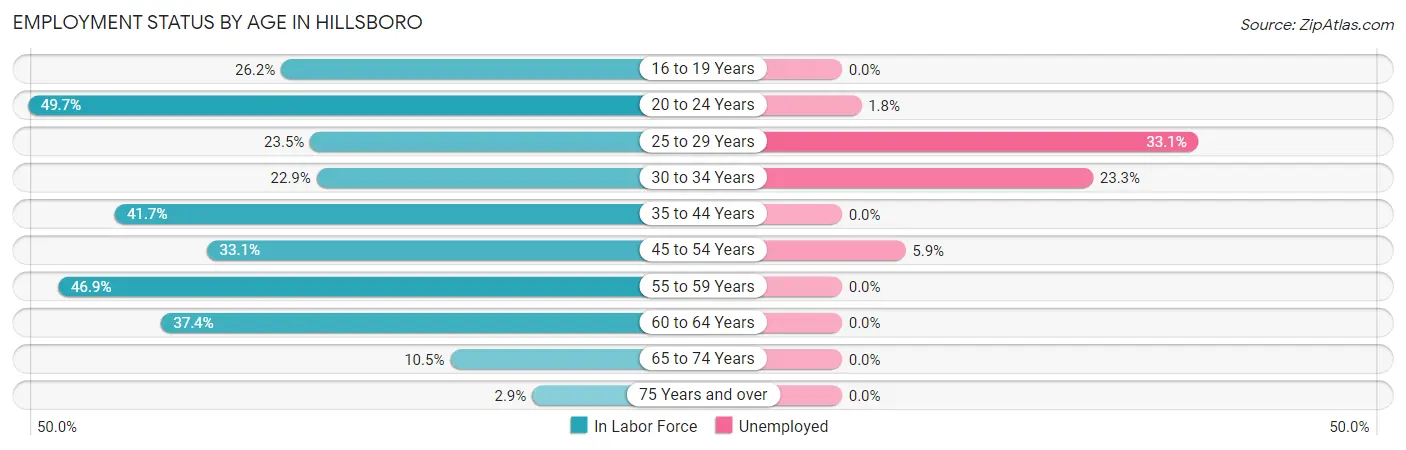
| Age Bracket | In Labor Force | Unemployed |
| 16 to 19 Years | 67 (26.2%) | 0 (0.0%) |
| 20 to 24 Years | 170 (49.7%) | 3 (1.8%) |
| 25 to 29 Years | 121 (23.5%) | 40 (33.1%) |
| 30 to 34 Years | 103 (22.9%) | 24 (23.3%) |
| 35 to 44 Years | 407 (41.7%) | 0 (0.0%) |
| 45 to 54 Years | 222 (33.1%) | 13 (5.9%) |
| 55 to 59 Years | 201 (46.9%) | 0 (0.0%) |
| 60 to 64 Years | 125 (37.4%) | 0 (0.0%) |
| 65 to 74 Years | 56 (10.5%) | 0 (0.0%) |
| 75 Years and over | 13 (2.9%) | 0 (0.0%) |
| Total | 1,485 (30.0%) | 80 (5.4%) |
Employment Status by Educational Attainment in Hillsboro
According to labor force statistics for Hillsboro, 35.0% of individuals (1,181) out of the total population between 25 and 64 years of age (3,373) are in the labor force, with 6.5% or 77 of them being unemployed. The group with the highest labor force participation rate are those with the educational attainment of bachelor's degree or higher, with 81.1% or 383 individuals in the labor force. Within the labor force, individuals with high school diploma education have the highest percentage of unemployment, with 20.5% or 77 of them being unemployed.
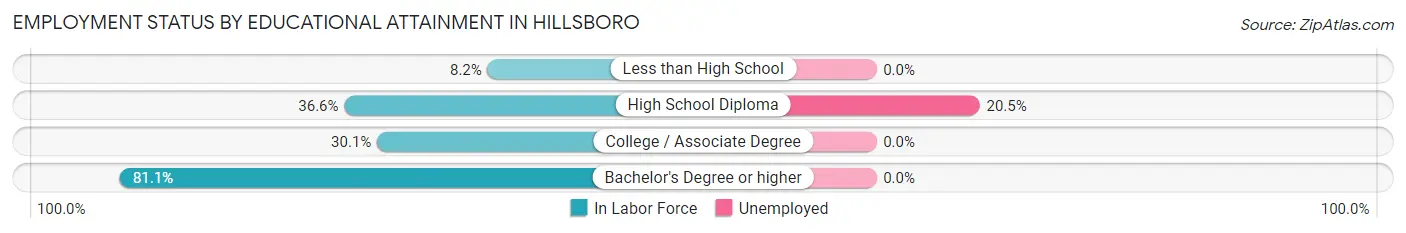
| Educational Attainment | In Labor Force | Unemployed |
| Less than High School | 54 (8.2%) | 0 (0.0%) |
| High School Diploma | 375 (36.6%) | 210 (20.5%) |
| College / Associate Degree | 367 (30.1%) | 0 (0.0%) |
| Bachelor's Degree or higher | 383 (81.1%) | 0 (0.0%) |
| Total | 1,181 (35.0%) | 219 (6.5%) |
Employment Occupations by Sex in Hillsboro
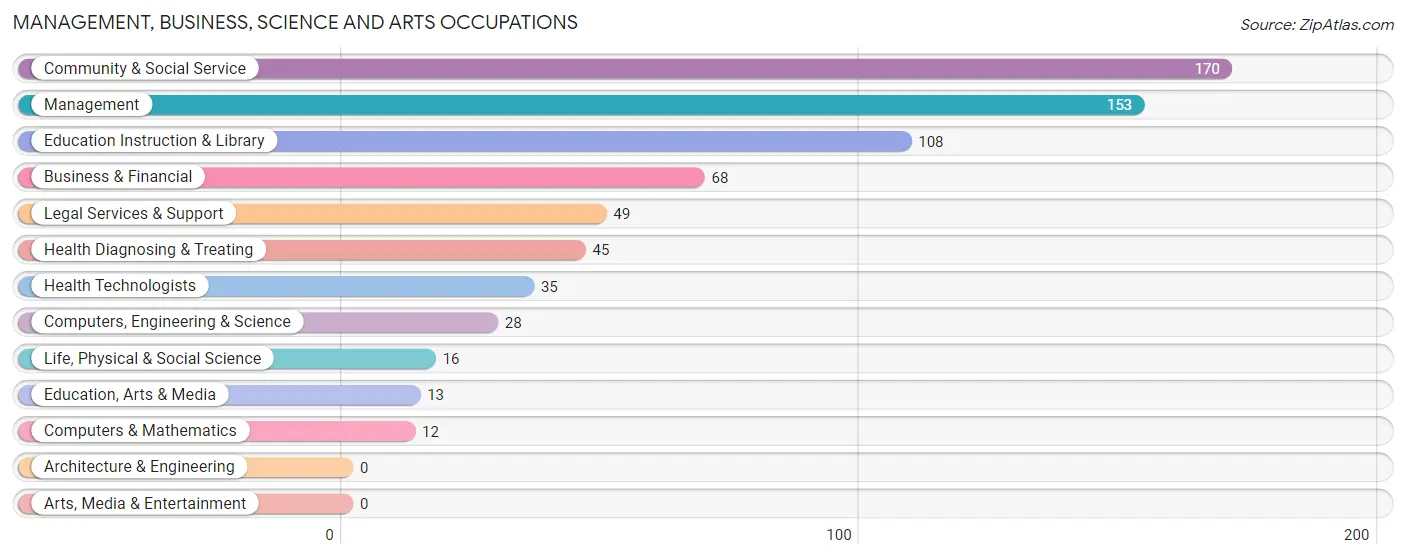
Management, Business, Science and Arts Occupations
The most common Management, Business, Science and Arts occupations in Hillsboro are Community & Social Service (170 | 12.1%), Management (153 | 10.9%), Education Instruction & Library (108 | 7.7%), Business & Financial (68 | 4.8%), and Legal Services & Support (49 | 3.5%).
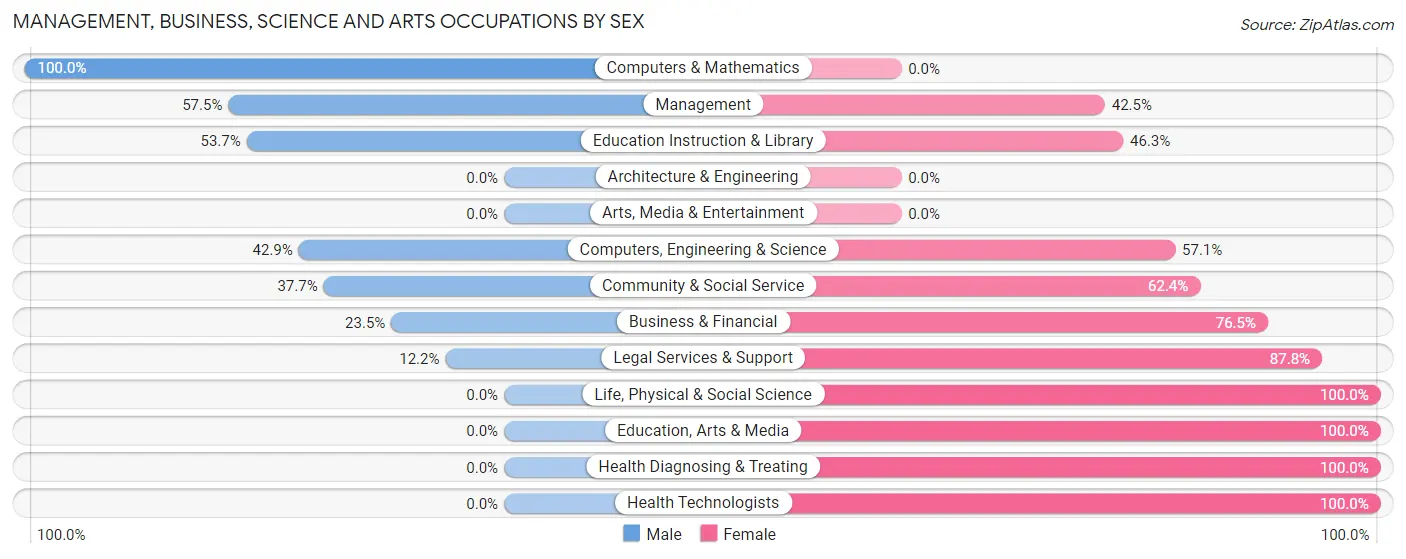
Management, Business, Science and Arts Occupations by Sex
Within the Management, Business, Science and Arts occupations in Hillsboro, the most male-oriented occupations are Computers & Mathematics (100.0%), Management (57.5%), and Education Instruction & Library (53.7%), while the most female-oriented occupations are Life, Physical & Social Science (100.0%), Education, Arts & Media (100.0%), and Health Diagnosing & Treating (100.0%).
| Occupation | Male | Female |
| Management | 88 (57.5%) | 65 (42.5%) |
| Business & Financial | 16 (23.5%) | 52 (76.5%) |
| Computers, Engineering & Science | 12 (42.9%) | 16 (57.1%) |
| Computers & Mathematics | 12 (100.0%) | 0 (0.0%) |
| Architecture & Engineering | 0 (0.0%) | 0 (0.0%) |
| Life, Physical & Social Science | 0 (0.0%) | 16 (100.0%) |
| Community & Social Service | 64 (37.7%) | 106 (62.4%) |
| Education, Arts & Media | 0 (0.0%) | 13 (100.0%) |
| Legal Services & Support | 6 (12.2%) | 43 (87.8%) |
| Education Instruction & Library | 58 (53.7%) | 50 (46.3%) |
| Arts, Media & Entertainment | 0 (0.0%) | 0 (0.0%) |
| Health Diagnosing & Treating | 0 (0.0%) | 45 (100.0%) |
| Health Technologists | 0 (0.0%) | 35 (100.0%) |
| Total (Category) | 180 (38.8%) | 284 (61.2%) |
| Total (Overall) | 783 (55.7%) | 622 (44.3%) |
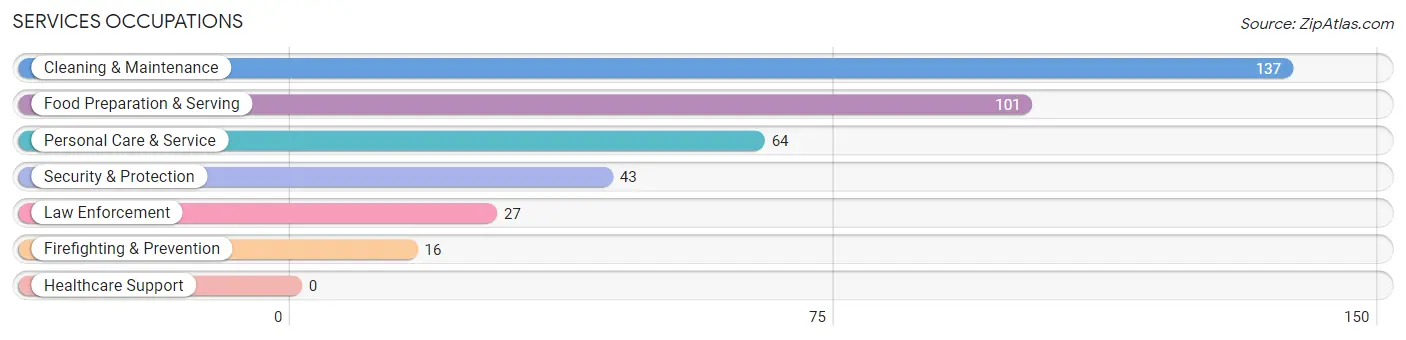
Services Occupations
The most common Services occupations in Hillsboro are Cleaning & Maintenance (137 | 9.8%), Food Preparation & Serving (101 | 7.2%), Personal Care & Service (64 | 4.6%), Security & Protection (43 | 3.1%), and Law Enforcement (27 | 1.9%).
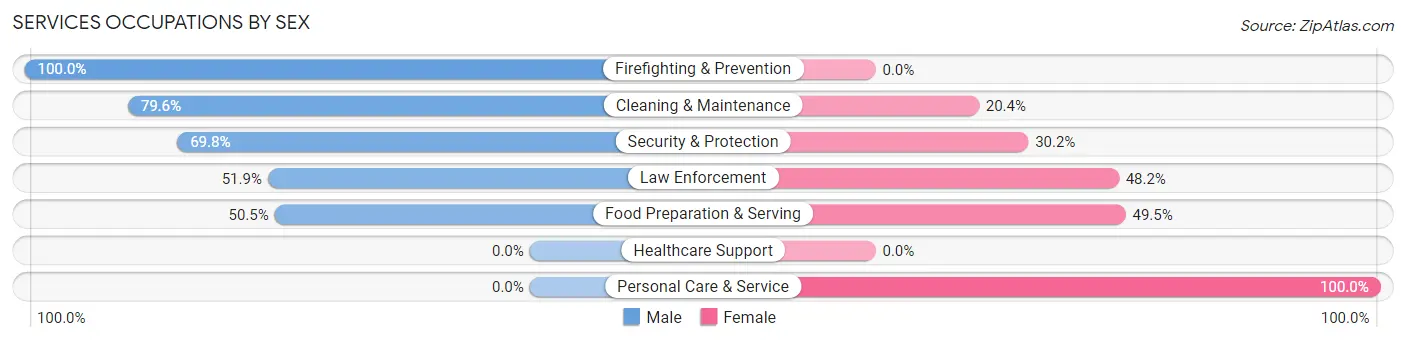
Services Occupations by Sex
Within the Services occupations in Hillsboro, the most male-oriented occupations are Firefighting & Prevention (100.0%), Cleaning & Maintenance (79.6%), and Security & Protection (69.8%), while the most female-oriented occupations are Personal Care & Service (100.0%), Food Preparation & Serving (49.5%), and Law Enforcement (48.1%).
| Occupation | Male | Female |
| Healthcare Support | 0 (0.0%) | 0 (0.0%) |
| Security & Protection | 30 (69.8%) | 13 (30.2%) |
| Firefighting & Prevention | 16 (100.0%) | 0 (0.0%) |
| Law Enforcement | 14 (51.8%) | 13 (48.1%) |
| Food Preparation & Serving | 51 (50.5%) | 50 (49.5%) |
| Cleaning & Maintenance | 109 (79.6%) | 28 (20.4%) |
| Personal Care & Service | 0 (0.0%) | 64 (100.0%) |
| Total (Category) | 190 (55.1%) | 155 (44.9%) |
| Total (Overall) | 783 (55.7%) | 622 (44.3%) |
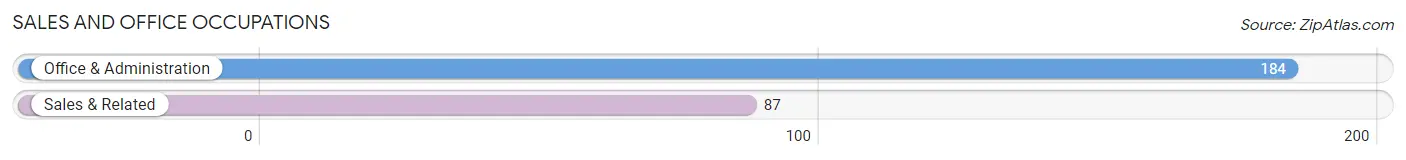
Sales and Office Occupations
The most common Sales and Office occupations in Hillsboro are Office & Administration (184 | 13.1%), and Sales & Related (87 | 6.2%).
Sales and Office Occupations by Sex
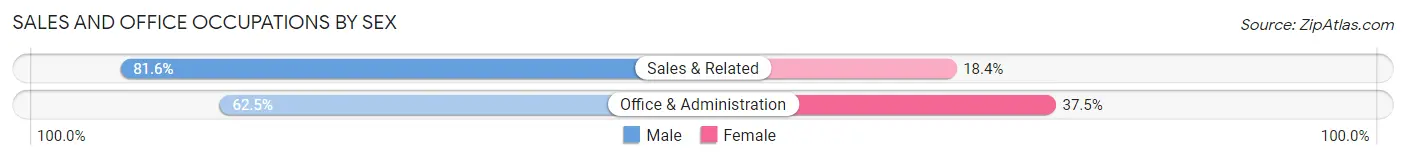
| Occupation | Male | Female |
| Sales & Related | 71 (81.6%) | 16 (18.4%) |
| Office & Administration | 115 (62.5%) | 69 (37.5%) |
| Total (Category) | 186 (68.6%) | 85 (31.4%) |
| Total (Overall) | 783 (55.7%) | 622 (44.3%) |
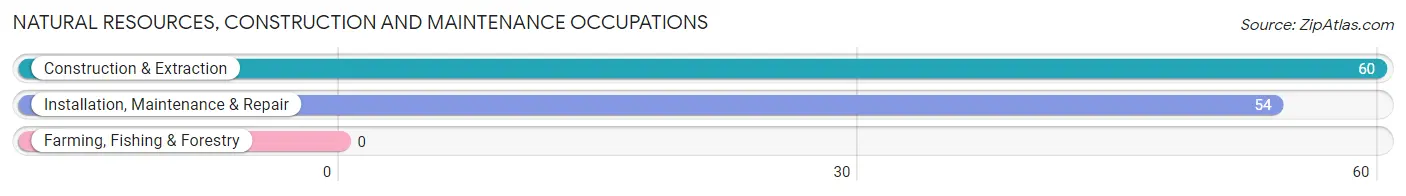
Natural Resources, Construction and Maintenance Occupations
The most common Natural Resources, Construction and Maintenance occupations in Hillsboro are Construction & Extraction (60 | 4.3%), and Installation, Maintenance & Repair (54 | 3.8%).
Natural Resources, Construction and Maintenance Occupations by Sex
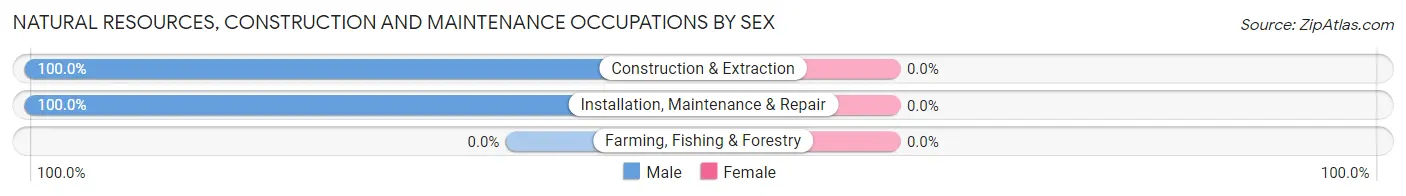
| Occupation | Male | Female |
| Farming, Fishing & Forestry | 0 (0.0%) | 0 (0.0%) |
| Construction & Extraction | 60 (100.0%) | 0 (0.0%) |
| Installation, Maintenance & Repair | 54 (100.0%) | 0 (0.0%) |
| Total (Category) | 114 (100.0%) | 0 (0.0%) |
| Total (Overall) | 783 (55.7%) | 622 (44.3%) |
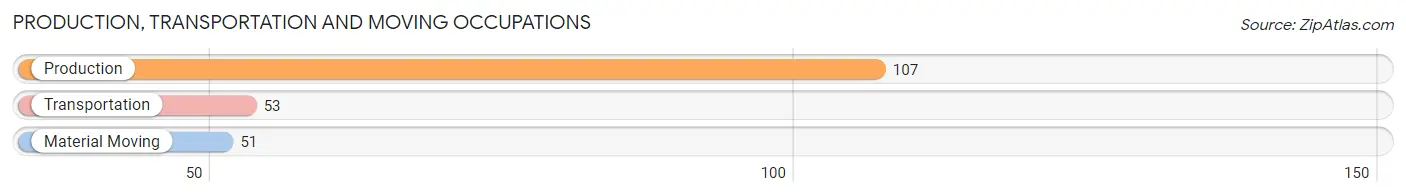
Production, Transportation and Moving Occupations
The most common Production, Transportation and Moving occupations in Hillsboro are Production (107 | 7.6%), Transportation (53 | 3.8%), and Material Moving (51 | 3.6%).
Production, Transportation and Moving Occupations by Sex
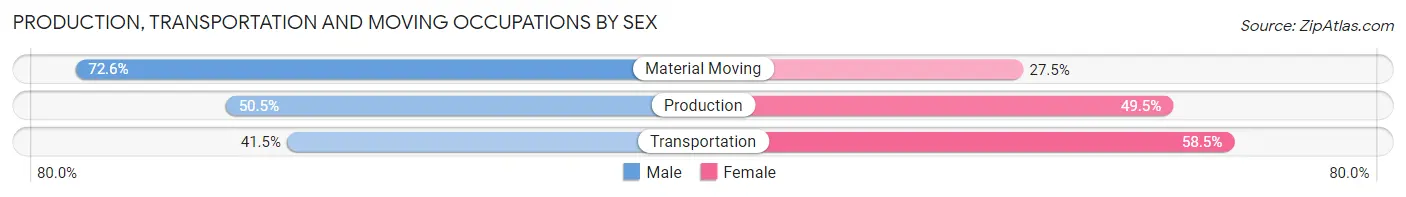
| Occupation | Male | Female |
| Production | 54 (50.5%) | 53 (49.5%) |
| Transportation | 22 (41.5%) | 31 (58.5%) |
| Material Moving | 37 (72.6%) | 14 (27.5%) |
| Total (Category) | 113 (53.5%) | 98 (46.5%) |
| Total (Overall) | 783 (55.7%) | 622 (44.3%) |
Employment Industries by Sex in Hillsboro
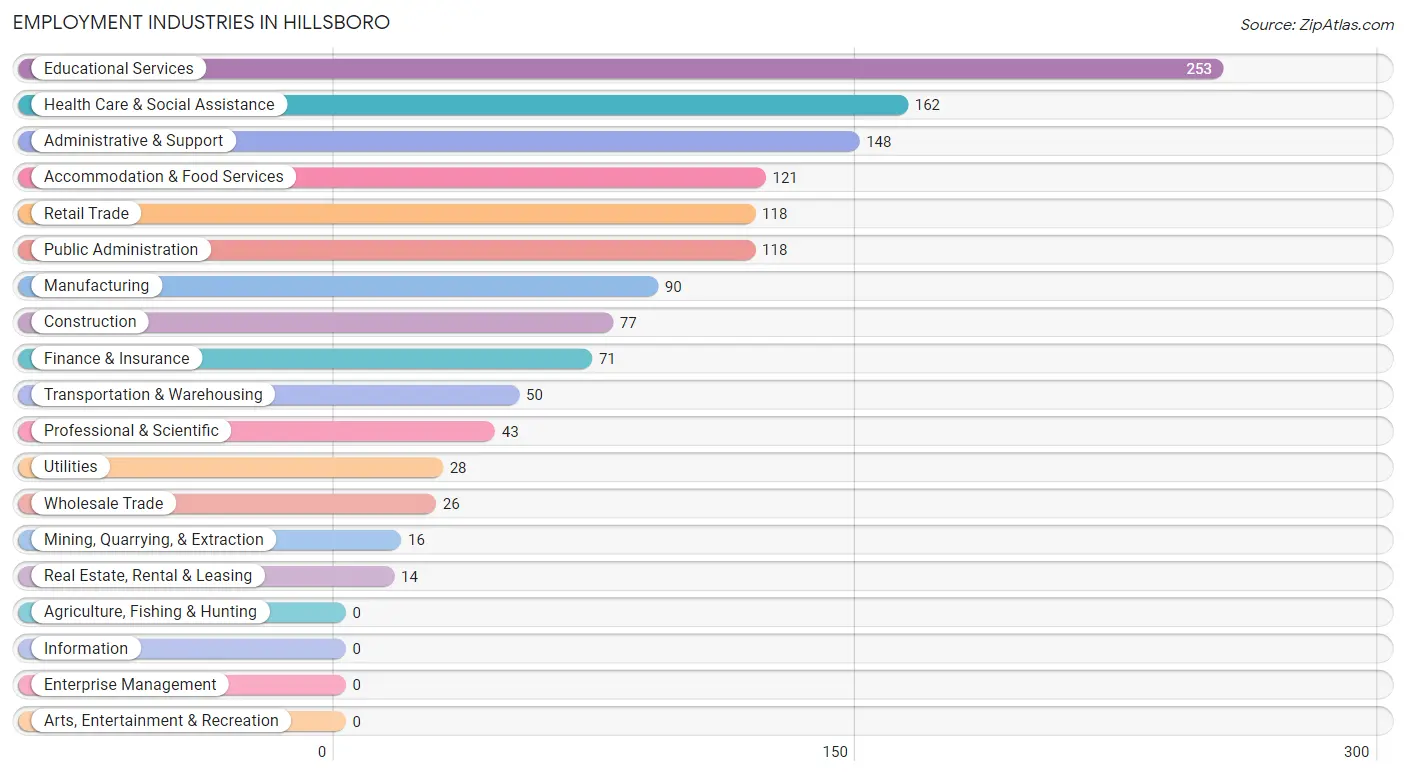
Employment Industries in Hillsboro
The major employment industries in Hillsboro include Educational Services (253 | 18.0%), Health Care & Social Assistance (162 | 11.5%), Administrative & Support (148 | 10.5%), Accommodation & Food Services (121 | 8.6%), and Retail Trade (118 | 8.4%).
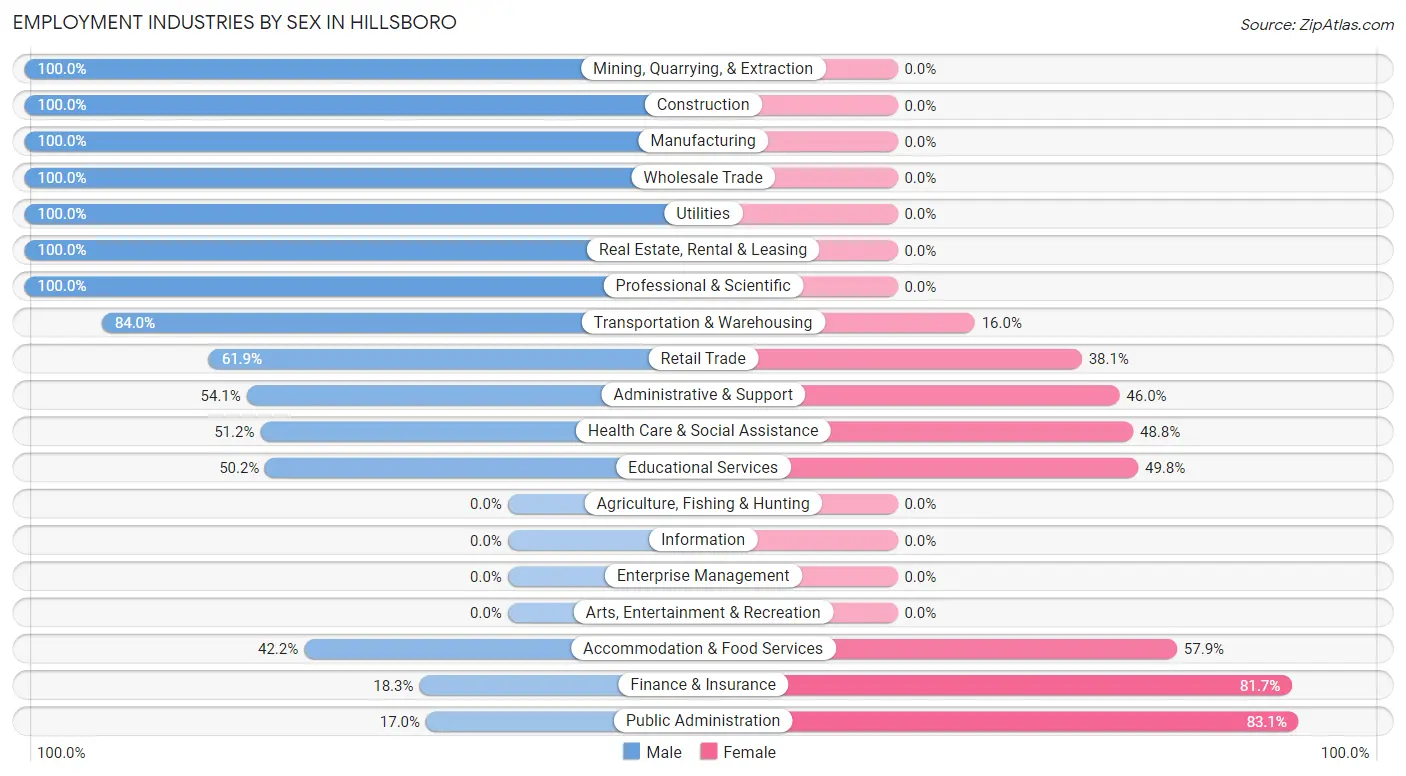
Employment Industries by Sex in Hillsboro
The Hillsboro industries that see more men than women are Mining, Quarrying, & Extraction (100.0%), Construction (100.0%), and Manufacturing (100.0%), whereas the industries that tend to have a higher number of women are Public Administration (83.1%), Finance & Insurance (81.7%), and Accommodation & Food Services (57.9%).
| Industry | Male | Female |
| Agriculture, Fishing & Hunting | 0 (0.0%) | 0 (0.0%) |
| Mining, Quarrying, & Extraction | 16 (100.0%) | 0 (0.0%) |
| Construction | 77 (100.0%) | 0 (0.0%) |
| Manufacturing | 90 (100.0%) | 0 (0.0%) |
| Wholesale Trade | 26 (100.0%) | 0 (0.0%) |
| Retail Trade | 73 (61.9%) | 45 (38.1%) |
| Transportation & Warehousing | 42 (84.0%) | 8 (16.0%) |
| Utilities | 28 (100.0%) | 0 (0.0%) |
| Information | 0 (0.0%) | 0 (0.0%) |
| Finance & Insurance | 13 (18.3%) | 58 (81.7%) |
| Real Estate, Rental & Leasing | 14 (100.0%) | 0 (0.0%) |
| Professional & Scientific | 43 (100.0%) | 0 (0.0%) |
| Enterprise Management | 0 (0.0%) | 0 (0.0%) |
| Administrative & Support | 80 (54.0%) | 68 (46.0%) |
| Educational Services | 127 (50.2%) | 126 (49.8%) |
| Health Care & Social Assistance | 83 (51.2%) | 79 (48.8%) |
| Arts, Entertainment & Recreation | 0 (0.0%) | 0 (0.0%) |
| Accommodation & Food Services | 51 (42.1%) | 70 (57.9%) |
| Public Administration | 20 (17.0%) | 98 (83.1%) |
| Total | 783 (55.7%) | 622 (44.3%) |
Education in Hillsboro
School Enrollment in Hillsboro
The most common levels of schooling among the 983 students in Hillsboro are high school (394 | 40.1%), elementary school (215 | 21.9%), and middle school (141 | 14.3%).
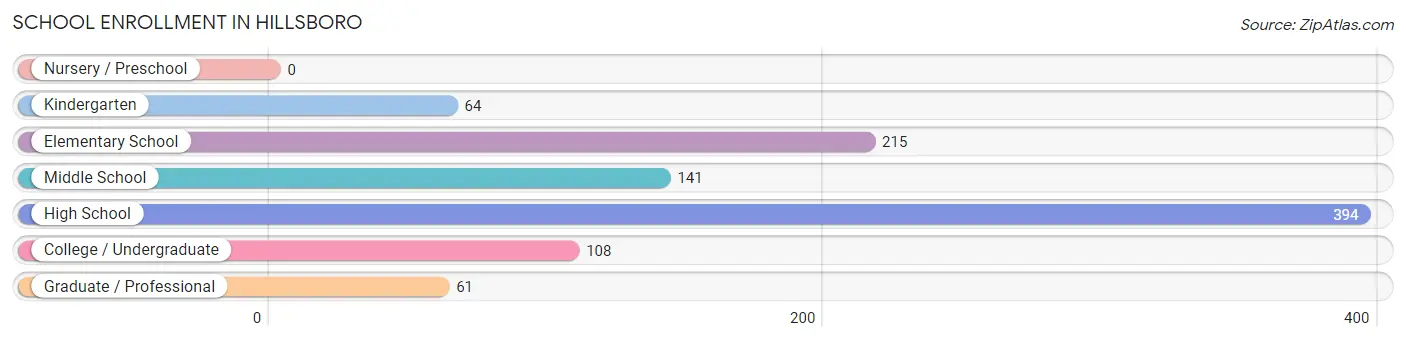
| School Level | # Students | % Students |
| Nursery / Preschool | 0 | 0.0% |
| Kindergarten | 64 | 6.5% |
| Elementary School | 215 | 21.9% |
| Middle School | 141 | 14.3% |
| High School | 394 | 40.1% |
| College / Undergraduate | 108 | 11.0% |
| Graduate / Professional | 61 | 6.2% |
| Total | 983 | 100.0% |
School Enrollment by Age by Funding Source in Hillsboro
Out of a total of 983 students who are enrolled in schools in Hillsboro, 17 (1.7%) attend a private institution, while the remaining 966 (98.3%) are enrolled in public schools. The age group of 35 years and over has the highest likelihood of being enrolled in private schools, with 17 (20.7% in the age bracket) enrolled. Conversely, the age group of 5 to 9 year old has the lowest likelihood of being enrolled in a private school, with 246 (100.0% in the age bracket) attending a public institution.
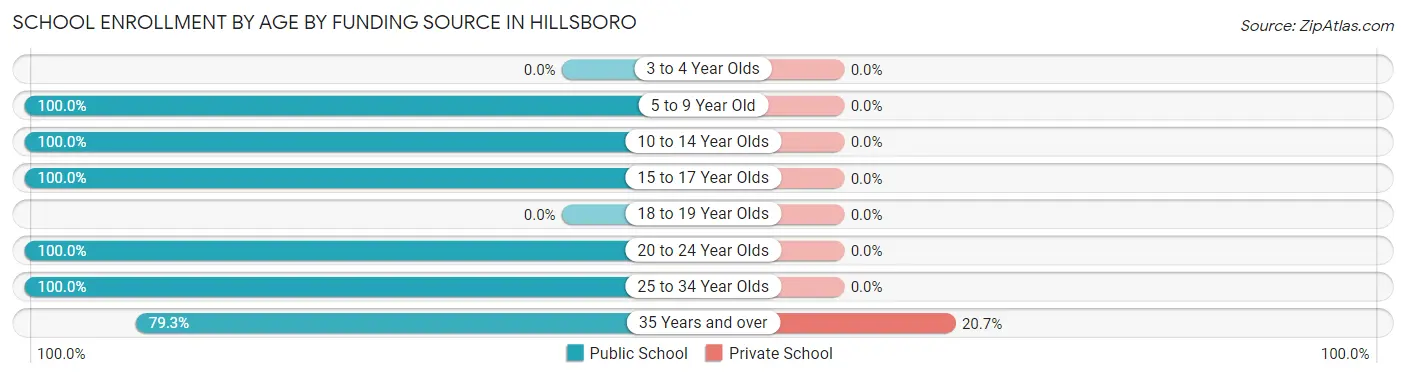
| Age Bracket | Public School | Private School |
| 3 to 4 Year Olds | 0 (0.0%) | 0 (0.0%) |
| 5 to 9 Year Old | 246 (100.0%) | 0 (0.0%) |
| 10 to 14 Year Olds | 242 (100.0%) | 0 (0.0%) |
| 15 to 17 Year Olds | 314 (100.0%) | 0 (0.0%) |
| 18 to 19 Year Olds | 0 (0.0%) | 0 (0.0%) |
| 20 to 24 Year Olds | 3 (100.0%) | 0 (0.0%) |
| 25 to 34 Year Olds | 96 (100.0%) | 0 (0.0%) |
| 35 Years and over | 65 (79.3%) | 17 (20.7%) |
| Total | 966 (98.3%) | 17 (1.7%) |
Educational Attainment by Field of Study in Hillsboro
Education (258 | 34.0%), business (161 | 21.2%), social sciences (72 | 9.5%), science & technology (58 | 7.6%), and psychology (44 | 5.8%) are the most common fields of study among 760 individuals in Hillsboro who have obtained a bachelor's degree or higher.
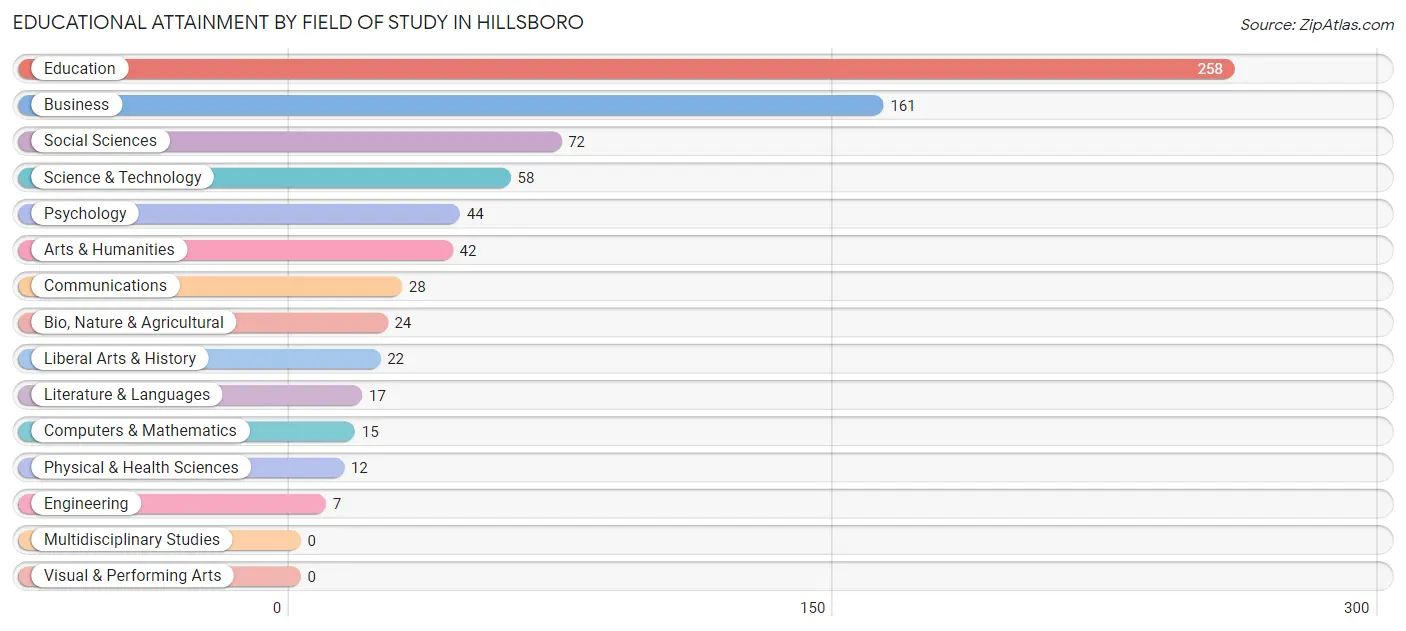
| Field of Study | # Graduates | % Graduates |
| Computers & Mathematics | 15 | 2.0% |
| Bio, Nature & Agricultural | 24 | 3.2% |
| Physical & Health Sciences | 12 | 1.6% |
| Psychology | 44 | 5.8% |
| Social Sciences | 72 | 9.5% |
| Engineering | 7 | 0.9% |
| Multidisciplinary Studies | 0 | 0.0% |
| Science & Technology | 58 | 7.6% |
| Business | 161 | 21.2% |
| Education | 258 | 34.0% |
| Literature & Languages | 17 | 2.2% |
| Liberal Arts & History | 22 | 2.9% |
| Visual & Performing Arts | 0 | 0.0% |
| Communications | 28 | 3.7% |
| Arts & Humanities | 42 | 5.5% |
| Total | 760 | 100.0% |
Transportation & Commute in Hillsboro
Vehicle Availability by Sex in Hillsboro
The most prevalent vehicle ownership categories in Hillsboro are males with 2 vehicles (299, accounting for 40.6%) and females with 2 vehicles (186, making up 49.3%).
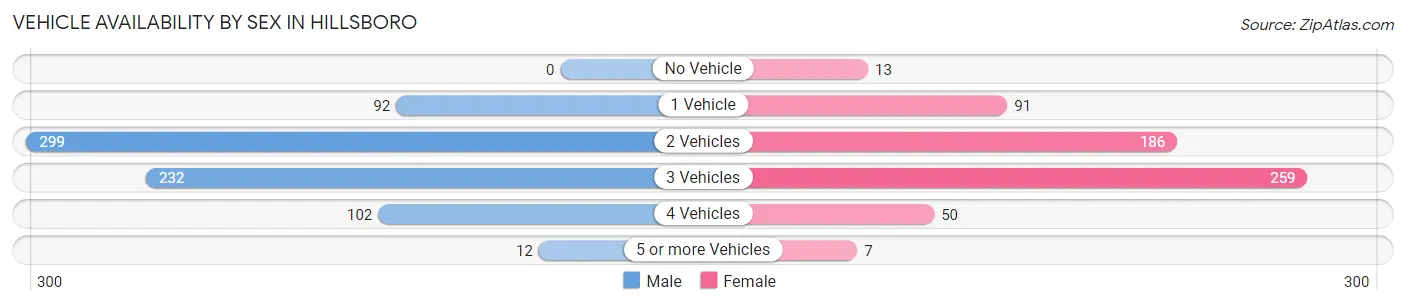
| Vehicles Available | Male | Female |
| No Vehicle | 0 (0.0%) | 13 (2.1%) |
| 1 Vehicle | 92 (12.5%) | 91 (15.0%) |
| 2 Vehicles | 299 (40.6%) | 186 (30.7%) |
| 3 Vehicles | 232 (31.5%) | 259 (42.7%) |
| 4 Vehicles | 102 (13.8%) | 50 (8.3%) |
| 5 or more Vehicles | 12 (1.6%) | 7 (1.2%) |
| Total | 737 (100.0%) | 606 (100.0%) |
Commute Time in Hillsboro
The most frequently occuring commute durations in Hillsboro are 5 to 9 minutes (341 commuters, 26.1%), less than 5 minutes (254 commuters, 19.4%), and 60 to 89 minutes (211 commuters, 16.1%).
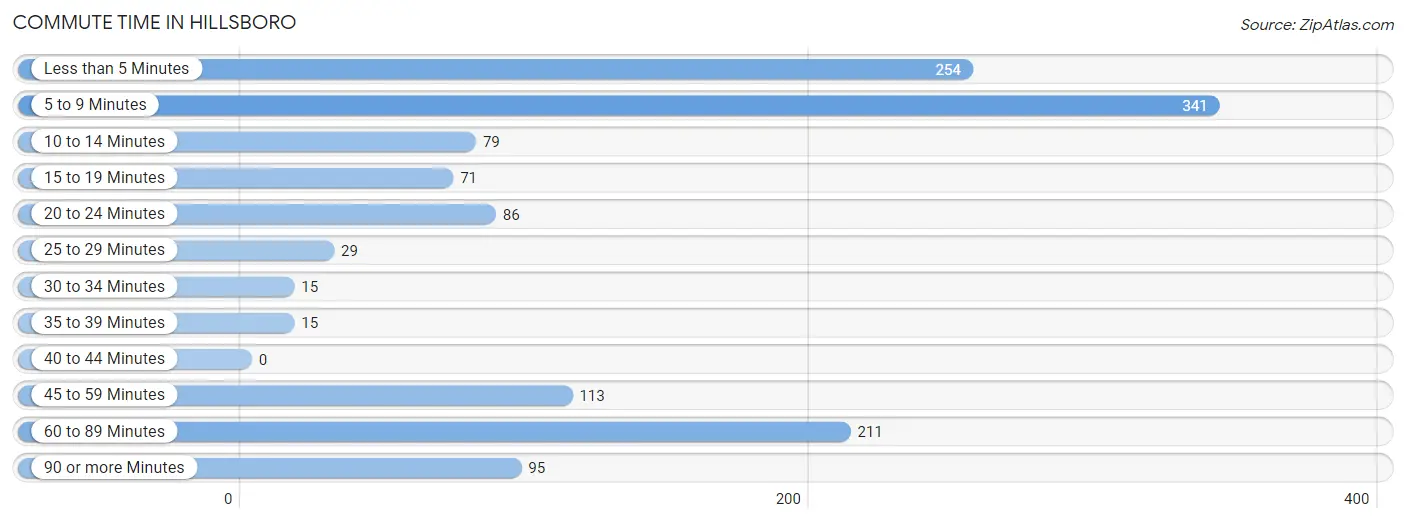
| Commute Time | # Commuters | % Commuters |
| Less than 5 Minutes | 254 | 19.4% |
| 5 to 9 Minutes | 341 | 26.1% |
| 10 to 14 Minutes | 79 | 6.0% |
| 15 to 19 Minutes | 71 | 5.4% |
| 20 to 24 Minutes | 86 | 6.6% |
| 25 to 29 Minutes | 29 | 2.2% |
| 30 to 34 Minutes | 15 | 1.1% |
| 35 to 39 Minutes | 15 | 1.1% |
| 40 to 44 Minutes | 0 | 0.0% |
| 45 to 59 Minutes | 113 | 8.6% |
| 60 to 89 Minutes | 211 | 16.1% |
| 90 or more Minutes | 95 | 7.3% |
Commute Time by Sex in Hillsboro
The most common commute times in Hillsboro are less than 5 minutes (175 commuters, 24.1%) for males and 5 to 9 minutes (243 commuters, 41.6%) for females.
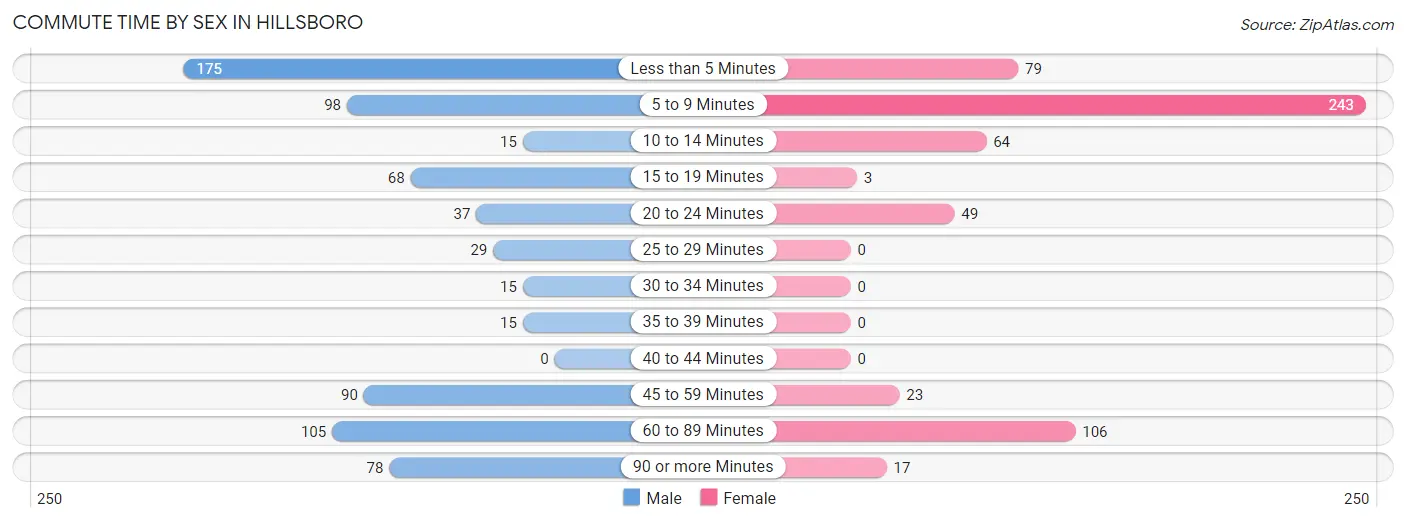
| Commute Time | Male | Female |
| Less than 5 Minutes | 175 (24.1%) | 79 (13.5%) |
| 5 to 9 Minutes | 98 (13.5%) | 243 (41.6%) |
| 10 to 14 Minutes | 15 (2.1%) | 64 (11.0%) |
| 15 to 19 Minutes | 68 (9.4%) | 3 (0.5%) |
| 20 to 24 Minutes | 37 (5.1%) | 49 (8.4%) |
| 25 to 29 Minutes | 29 (4.0%) | 0 (0.0%) |
| 30 to 34 Minutes | 15 (2.1%) | 0 (0.0%) |
| 35 to 39 Minutes | 15 (2.1%) | 0 (0.0%) |
| 40 to 44 Minutes | 0 (0.0%) | 0 (0.0%) |
| 45 to 59 Minutes | 90 (12.4%) | 23 (3.9%) |
| 60 to 89 Minutes | 105 (14.5%) | 106 (18.1%) |
| 90 or more Minutes | 78 (10.8%) | 17 (2.9%) |
Time of Departure to Work by Sex in Hillsboro
The most frequent times of departure to work in Hillsboro are 12:00 AM to 4:59 AM (143, 19.7%) for males and 7:30 AM to 7:59 AM (166, 28.4%) for females.
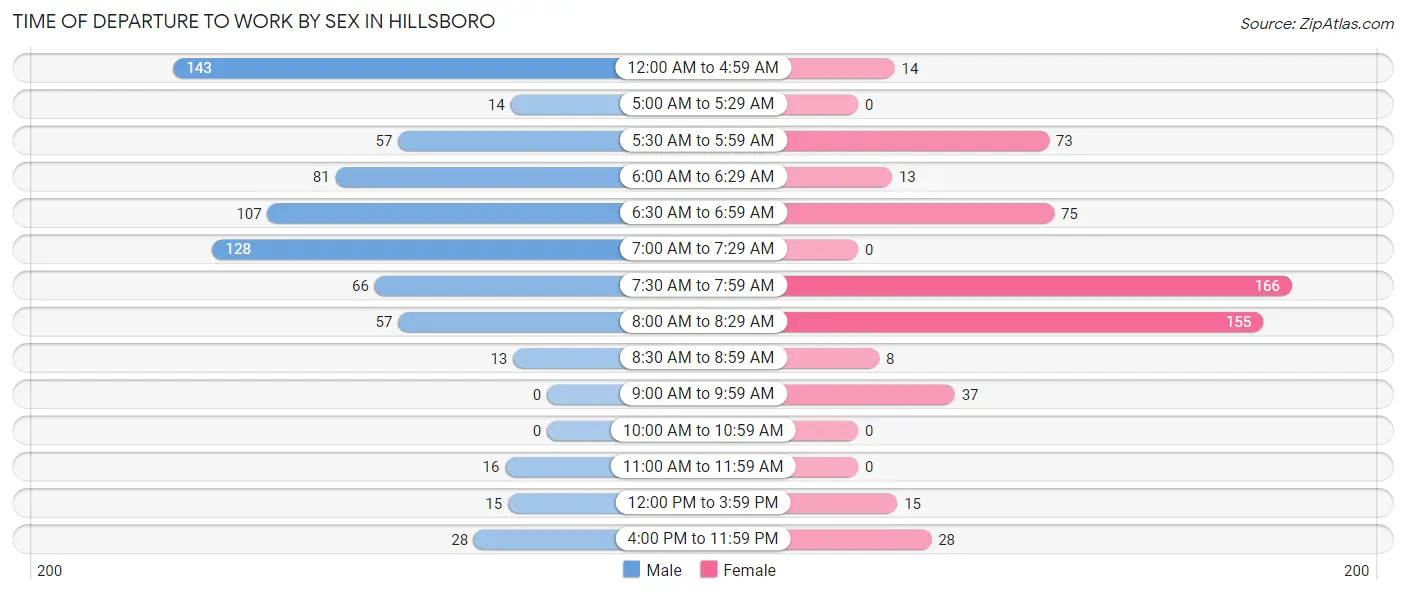
| Time of Departure | Male | Female |
| 12:00 AM to 4:59 AM | 143 (19.7%) | 14 (2.4%) |
| 5:00 AM to 5:29 AM | 14 (1.9%) | 0 (0.0%) |
| 5:30 AM to 5:59 AM | 57 (7.9%) | 73 (12.5%) |
| 6:00 AM to 6:29 AM | 81 (11.2%) | 13 (2.2%) |
| 6:30 AM to 6:59 AM | 107 (14.8%) | 75 (12.8%) |
| 7:00 AM to 7:29 AM | 128 (17.7%) | 0 (0.0%) |
| 7:30 AM to 7:59 AM | 66 (9.1%) | 166 (28.4%) |
| 8:00 AM to 8:29 AM | 57 (7.9%) | 155 (26.5%) |
| 8:30 AM to 8:59 AM | 13 (1.8%) | 8 (1.4%) |
| 9:00 AM to 9:59 AM | 0 (0.0%) | 37 (6.3%) |
| 10:00 AM to 10:59 AM | 0 (0.0%) | 0 (0.0%) |
| 11:00 AM to 11:59 AM | 16 (2.2%) | 0 (0.0%) |
| 12:00 PM to 3:59 PM | 15 (2.1%) | 15 (2.6%) |
| 4:00 PM to 11:59 PM | 28 (3.9%) | 28 (4.8%) |
| Total | 725 (100.0%) | 584 (100.0%) |
Housing Occupancy in Hillsboro
Occupancy by Ownership in Hillsboro
Of the total 1,656 dwellings in Hillsboro, owner-occupied units account for 1,209 (73.0%), while renter-occupied units make up 447 (27.0%).
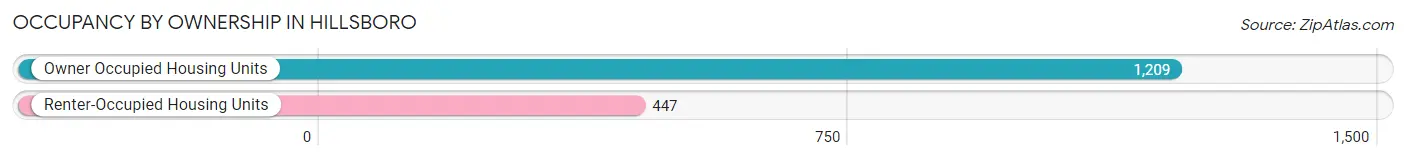
| Occupancy | # Housing Units | % Housing Units |
| Owner Occupied Housing Units | 1,209 | 73.0% |
| Renter-Occupied Housing Units | 447 | 27.0% |
| Total Occupied Housing Units | 1,656 | 100.0% |
Occupancy by Household Size in Hillsboro
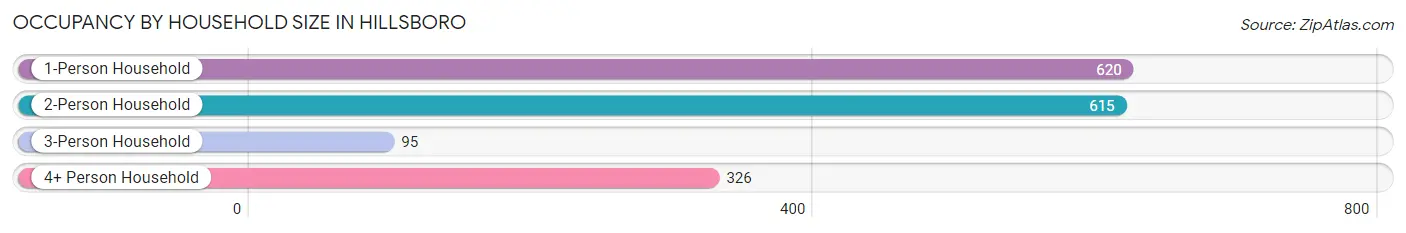
| Household Size | # Housing Units | % Housing Units |
| 1-Person Household | 620 | 37.4% |
| 2-Person Household | 615 | 37.1% |
| 3-Person Household | 95 | 5.7% |
| 4+ Person Household | 326 | 19.7% |
| Total Housing Units | 1,656 | 100.0% |
Occupancy by Ownership by Household Size in Hillsboro
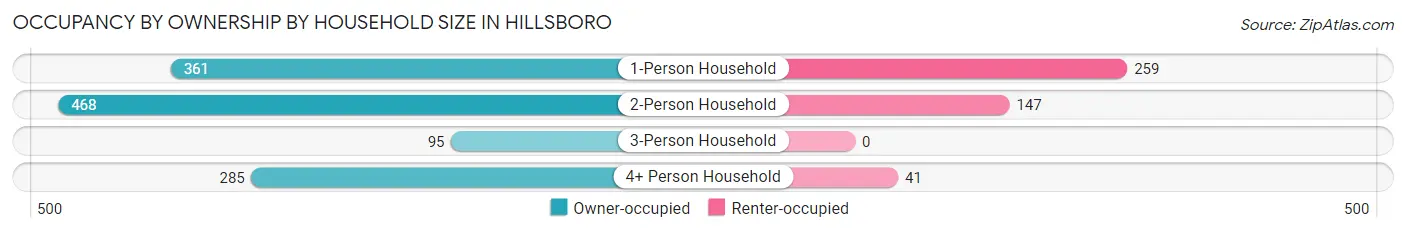
| Household Size | Owner-occupied | Renter-occupied |
| 1-Person Household | 361 (58.2%) | 259 (41.8%) |
| 2-Person Household | 468 (76.1%) | 147 (23.9%) |
| 3-Person Household | 95 (100.0%) | 0 (0.0%) |
| 4+ Person Household | 285 (87.4%) | 41 (12.6%) |
| Total Housing Units | 1,209 (73.0%) | 447 (27.0%) |
Occupancy by Educational Attainment in Hillsboro
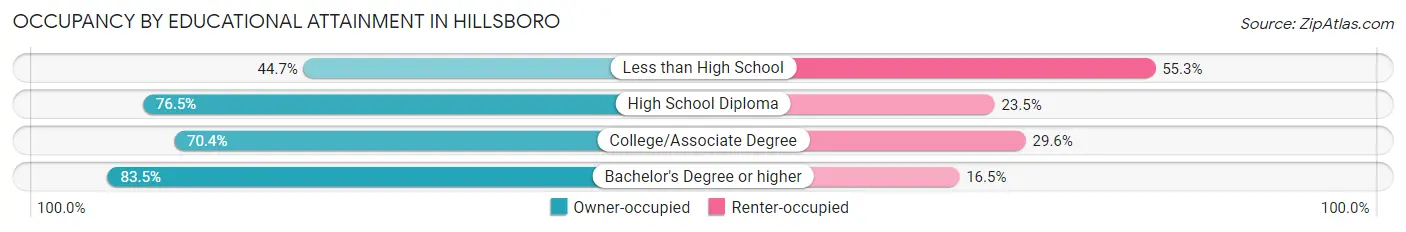
| Household Size | Owner-occupied | Renter-occupied |
| Less than High School | 67 (44.7%) | 83 (55.3%) |
| High School Diploma | 336 (76.5%) | 103 (23.5%) |
| College/Associate Degree | 456 (70.4%) | 192 (29.6%) |
| Bachelor's Degree or higher | 350 (83.5%) | 69 (16.5%) |
Occupancy by Age of Householder in Hillsboro
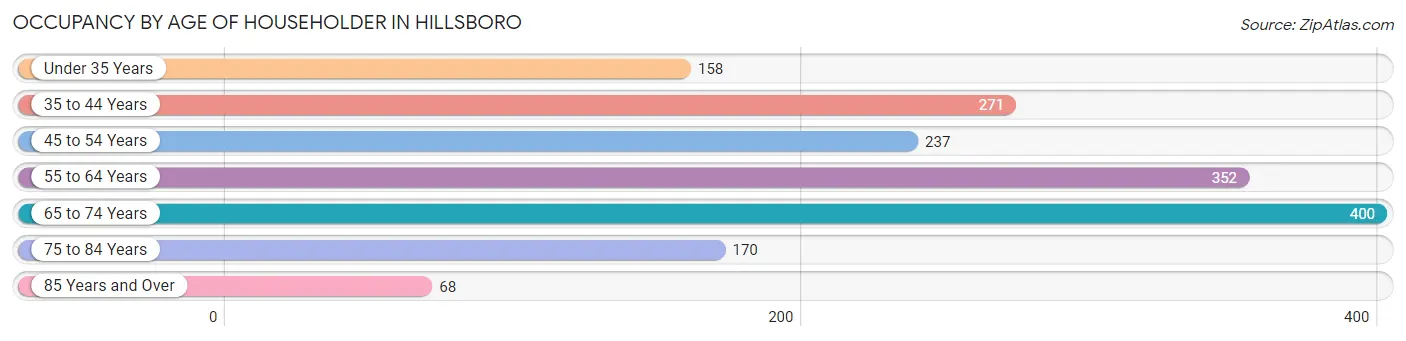
| Age Bracket | # Households | % Households |
| Under 35 Years | 158 | 9.5% |
| 35 to 44 Years | 271 | 16.4% |
| 45 to 54 Years | 237 | 14.3% |
| 55 to 64 Years | 352 | 21.3% |
| 65 to 74 Years | 400 | 24.1% |
| 75 to 84 Years | 170 | 10.3% |
| 85 Years and Over | 68 | 4.1% |
| Total | 1,656 | 100.0% |
Housing Finances in Hillsboro
Median Income by Occupancy in Hillsboro
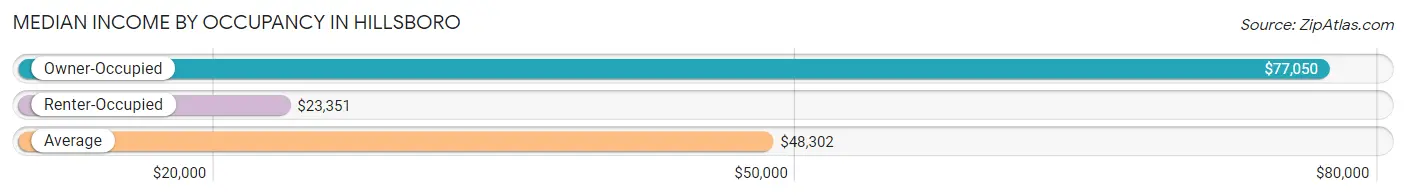
| Occupancy Type | # Households | Median Income |
| Owner-Occupied | 1,209 (73.0%) | $77,050 |
| Renter-Occupied | 447 (27.0%) | $23,351 |
| Average | 1,656 (100.0%) | $48,302 |
Occupancy by Householder Income Bracket in Hillsboro
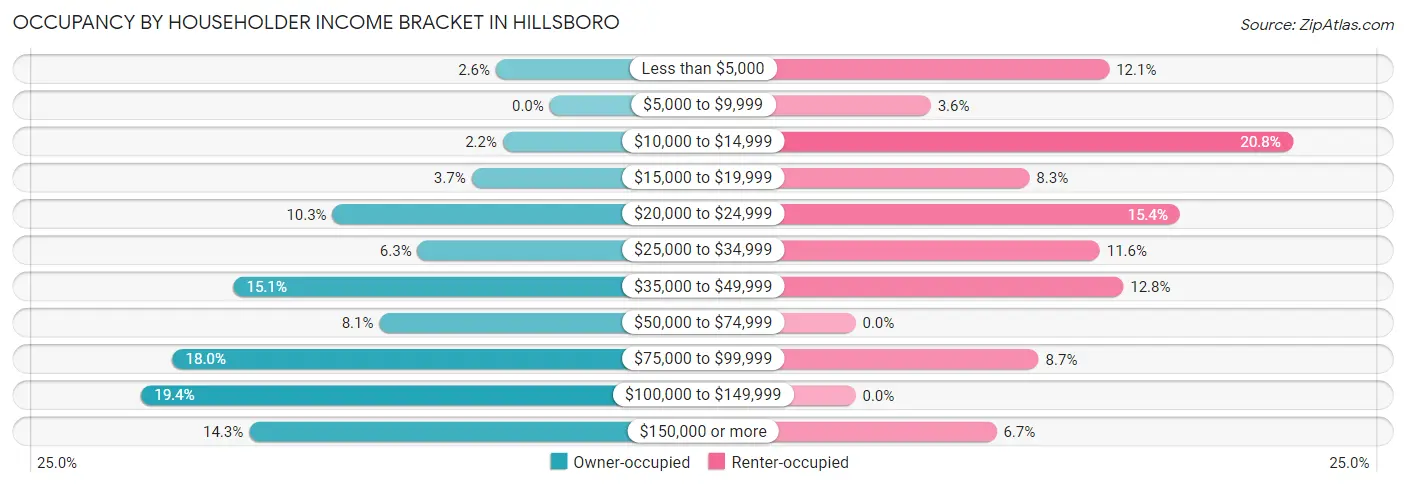
| Income Bracket | Owner-occupied | Renter-occupied |
| Less than $5,000 | 31 (2.6%) | 54 (12.1%) |
| $5,000 to $9,999 | 0 (0.0%) | 16 (3.6%) |
| $10,000 to $14,999 | 27 (2.2%) | 93 (20.8%) |
| $15,000 to $19,999 | 45 (3.7%) | 37 (8.3%) |
| $20,000 to $24,999 | 125 (10.3%) | 69 (15.4%) |
| $25,000 to $34,999 | 76 (6.3%) | 52 (11.6%) |
| $35,000 to $49,999 | 182 (15.0%) | 57 (12.8%) |
| $50,000 to $74,999 | 98 (8.1%) | 0 (0.0%) |
| $75,000 to $99,999 | 217 (17.9%) | 39 (8.7%) |
| $100,000 to $149,999 | 235 (19.4%) | 0 (0.0%) |
| $150,000 or more | 173 (14.3%) | 30 (6.7%) |
| Total | 1,209 (100.0%) | 447 (100.0%) |
Monthly Housing Cost Tiers in Hillsboro
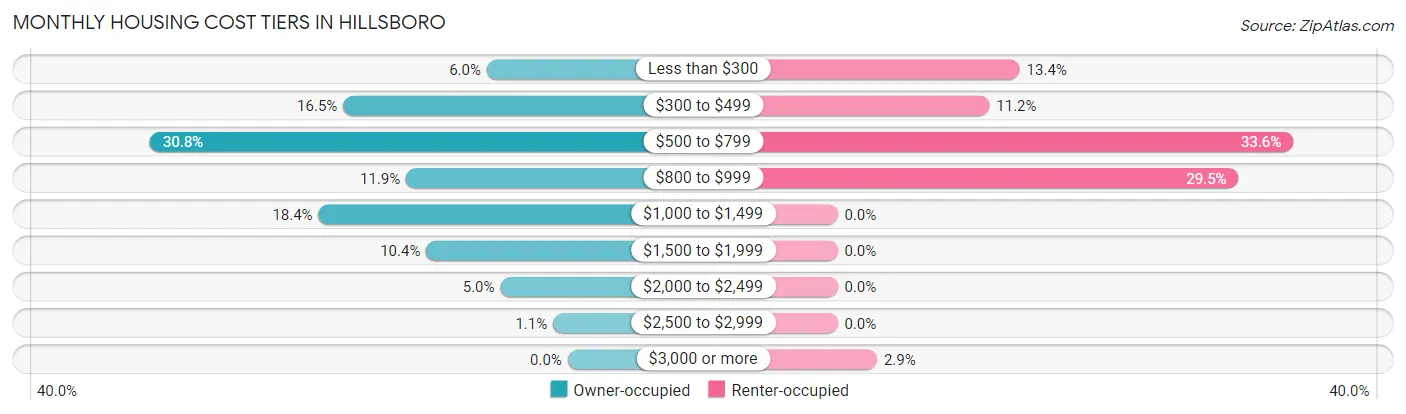
| Monthly Cost | Owner-occupied | Renter-occupied |
| Less than $300 | 72 (6.0%) | 60 (13.4%) |
| $300 to $499 | 200 (16.5%) | 50 (11.2%) |
| $500 to $799 | 372 (30.8%) | 150 (33.6%) |
| $800 to $999 | 144 (11.9%) | 132 (29.5%) |
| $1,000 to $1,499 | 222 (18.4%) | 0 (0.0%) |
| $1,500 to $1,999 | 126 (10.4%) | 0 (0.0%) |
| $2,000 to $2,499 | 60 (5.0%) | 0 (0.0%) |
| $2,500 to $2,999 | 13 (1.1%) | 0 (0.0%) |
| $3,000 or more | 0 (0.0%) | 13 (2.9%) |
| Total | 1,209 (100.0%) | 447 (100.0%) |
Physical Housing Characteristics in Hillsboro
Housing Structures in Hillsboro
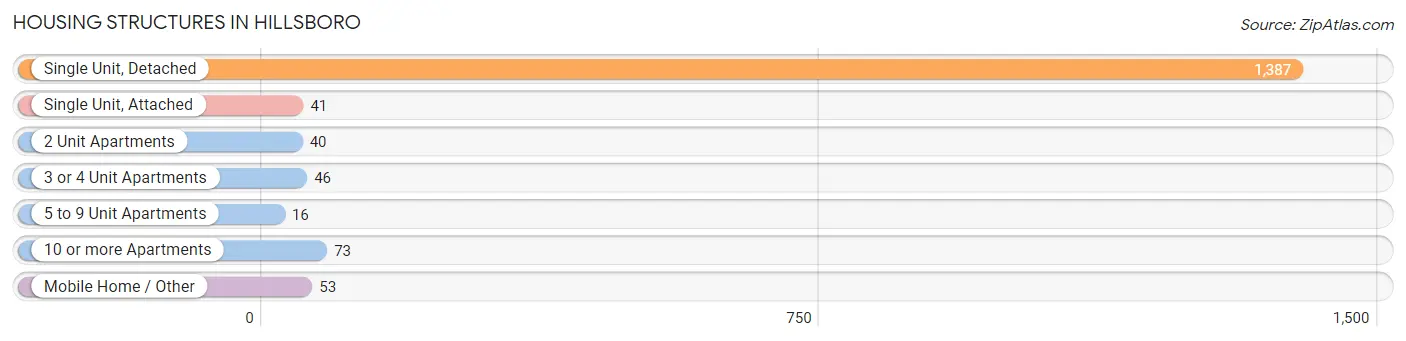
| Structure Type | # Housing Units | % Housing Units |
| Single Unit, Detached | 1,387 | 83.8% |
| Single Unit, Attached | 41 | 2.5% |
| 2 Unit Apartments | 40 | 2.4% |
| 3 or 4 Unit Apartments | 46 | 2.8% |
| 5 to 9 Unit Apartments | 16 | 1.0% |
| 10 or more Apartments | 73 | 4.4% |
| Mobile Home / Other | 53 | 3.2% |
| Total | 1,656 | 100.0% |
Housing Structures by Occupancy in Hillsboro
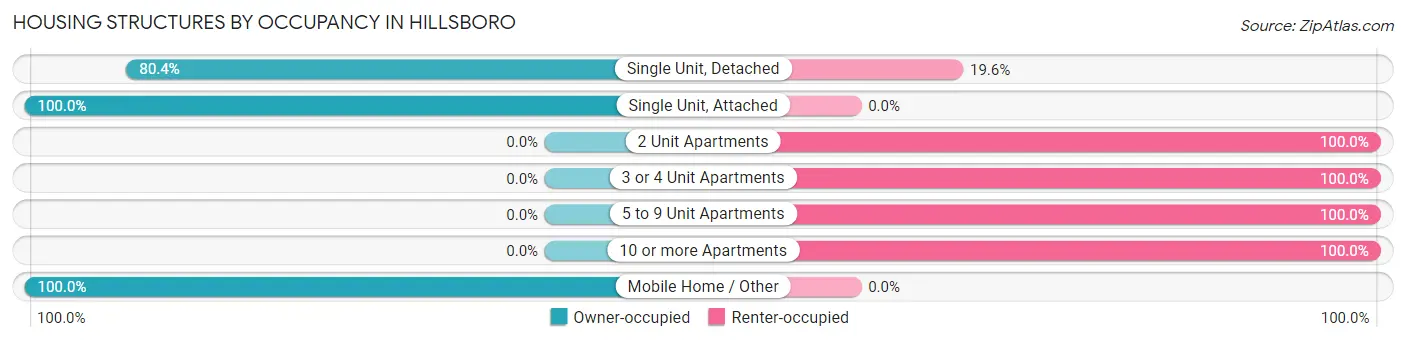
| Structure Type | Owner-occupied | Renter-occupied |
| Single Unit, Detached | 1,115 (80.4%) | 272 (19.6%) |
| Single Unit, Attached | 41 (100.0%) | 0 (0.0%) |
| 2 Unit Apartments | 0 (0.0%) | 40 (100.0%) |
| 3 or 4 Unit Apartments | 0 (0.0%) | 46 (100.0%) |
| 5 to 9 Unit Apartments | 0 (0.0%) | 16 (100.0%) |
| 10 or more Apartments | 0 (0.0%) | 73 (100.0%) |
| Mobile Home / Other | 53 (100.0%) | 0 (0.0%) |
| Total | 1,209 (73.0%) | 447 (27.0%) |
Housing Structures by Number of Rooms in Hillsboro
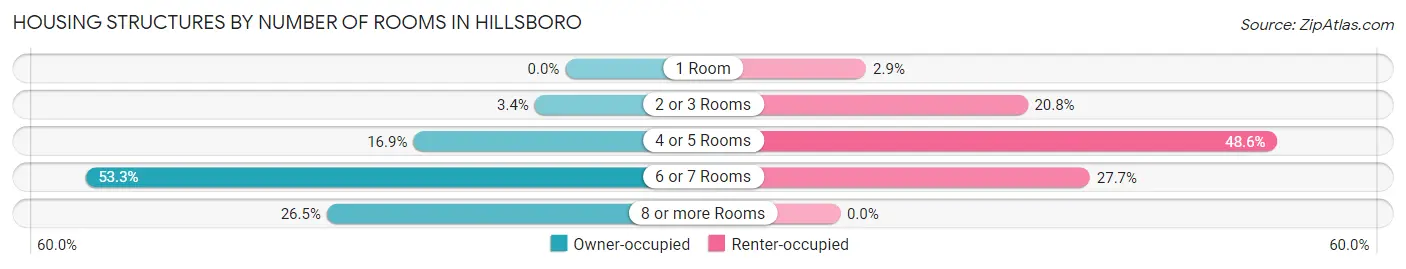
| Number of Rooms | Owner-occupied | Renter-occupied |
| 1 Room | 0 (0.0%) | 13 (2.9%) |
| 2 or 3 Rooms | 41 (3.4%) | 93 (20.8%) |
| 4 or 5 Rooms | 204 (16.9%) | 217 (48.5%) |
| 6 or 7 Rooms | 644 (53.3%) | 124 (27.7%) |
| 8 or more Rooms | 320 (26.5%) | 0 (0.0%) |
| Total | 1,209 (100.0%) | 447 (100.0%) |
Housing Structure by Heating Type in Hillsboro
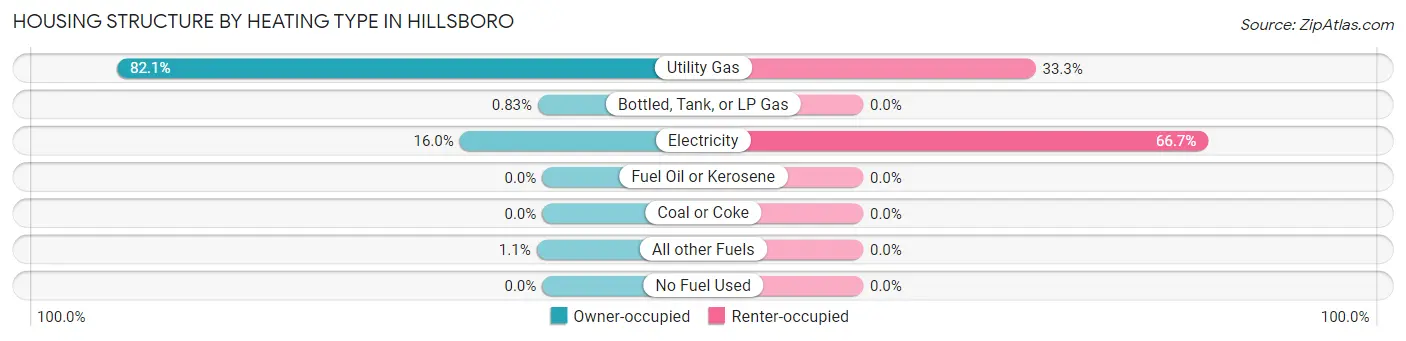
| Heating Type | Owner-occupied | Renter-occupied |
| Utility Gas | 993 (82.1%) | 149 (33.3%) |
| Bottled, Tank, or LP Gas | 10 (0.8%) | 0 (0.0%) |
| Electricity | 193 (16.0%) | 298 (66.7%) |
| Fuel Oil or Kerosene | 0 (0.0%) | 0 (0.0%) |
| Coal or Coke | 0 (0.0%) | 0 (0.0%) |
| All other Fuels | 13 (1.1%) | 0 (0.0%) |
| No Fuel Used | 0 (0.0%) | 0 (0.0%) |
| Total | 1,209 (100.0%) | 447 (100.0%) |
Household Vehicle Usage in Hillsboro
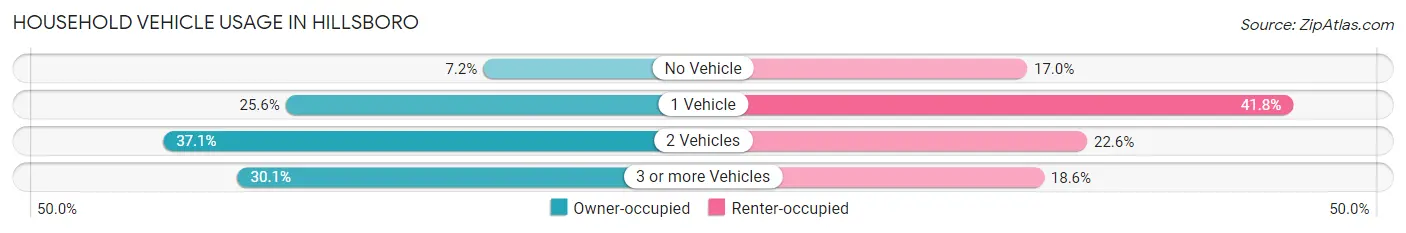
| Vehicles per Household | Owner-occupied | Renter-occupied |
| No Vehicle | 87 (7.2%) | 76 (17.0%) |
| 1 Vehicle | 310 (25.6%) | 187 (41.8%) |
| 2 Vehicles | 448 (37.1%) | 101 (22.6%) |
| 3 or more Vehicles | 364 (30.1%) | 83 (18.6%) |
| Total | 1,209 (100.0%) | 447 (100.0%) |
Real Estate & Mortgages in Hillsboro
Real Estate and Mortgage Overview in Hillsboro
| Characteristic | Without Mortgage | With Mortgage |
| Housing Units | 478 | 731 |
| Median Property Value | $111,700 | $104,900 |
| Median Household Income | $63,519 | $116 |
| Monthly Housing Costs | $505 | $0 |
| Real Estate Taxes | $2,926 | $15 |
Property Value by Mortgage Status in Hillsboro
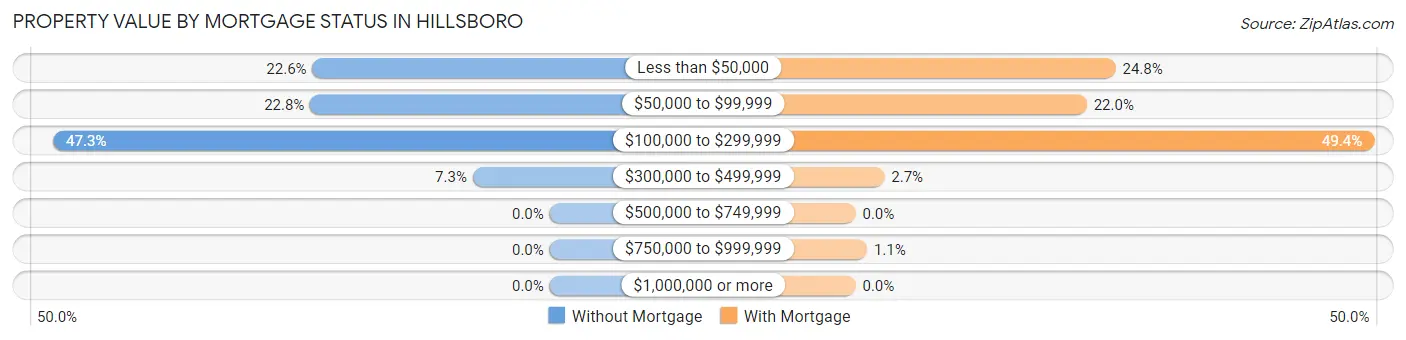
| Property Value | Without Mortgage | With Mortgage |
| Less than $50,000 | 108 (22.6%) | 181 (24.8%) |
| $50,000 to $99,999 | 109 (22.8%) | 161 (22.0%) |
| $100,000 to $299,999 | 226 (47.3%) | 361 (49.4%) |
| $300,000 to $499,999 | 35 (7.3%) | 20 (2.7%) |
| $500,000 to $749,999 | 0 (0.0%) | 0 (0.0%) |
| $750,000 to $999,999 | 0 (0.0%) | 8 (1.1%) |
| $1,000,000 or more | 0 (0.0%) | 0 (0.0%) |
| Total | 478 (100.0%) | 731 (100.0%) |
Household Income by Mortgage Status in Hillsboro
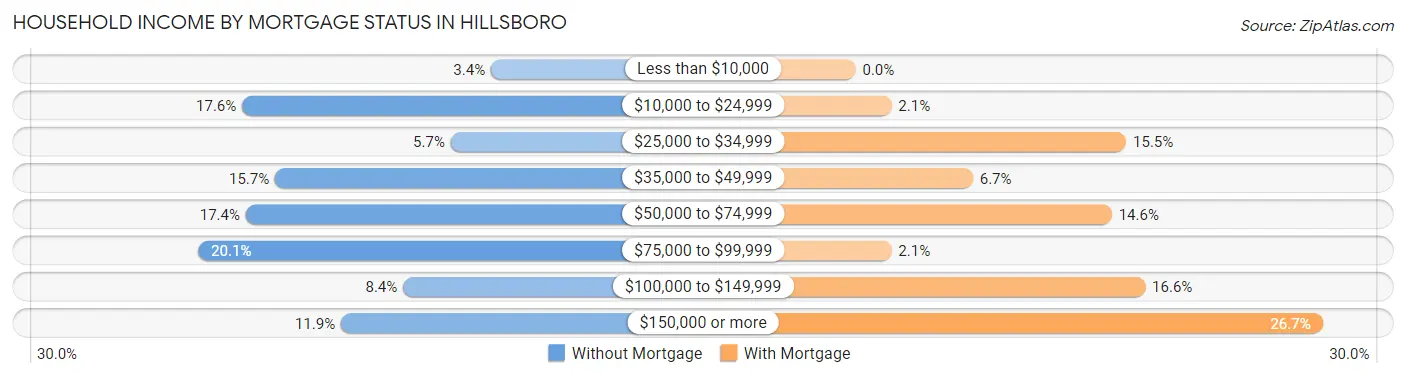
| Household Income | Without Mortgage | With Mortgage |
| Less than $10,000 | 16 (3.4%) | 0 (0.0%) |
| $10,000 to $24,999 | 84 (17.6%) | 15 (2.1%) |
| $25,000 to $34,999 | 27 (5.7%) | 113 (15.5%) |
| $35,000 to $49,999 | 75 (15.7%) | 49 (6.7%) |
| $50,000 to $74,999 | 83 (17.4%) | 107 (14.6%) |
| $75,000 to $99,999 | 96 (20.1%) | 15 (2.1%) |
| $100,000 to $149,999 | 40 (8.4%) | 121 (16.6%) |
| $150,000 or more | 57 (11.9%) | 195 (26.7%) |
| Total | 478 (100.0%) | 731 (100.0%) |
Property Value to Household Income Ratio in Hillsboro
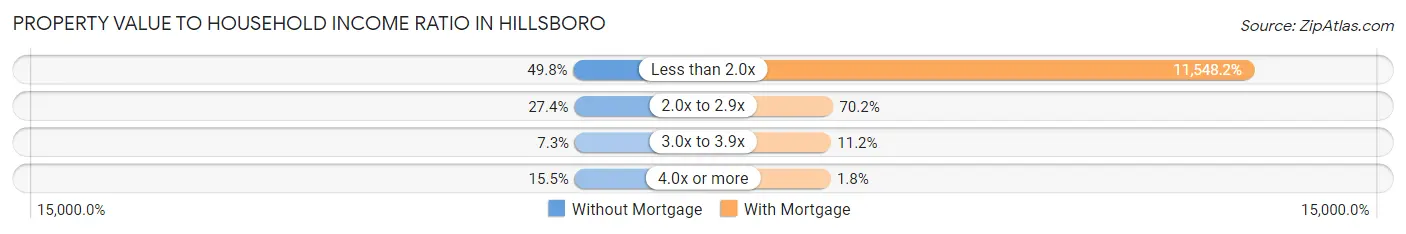
| Value-to-Income Ratio | Without Mortgage | With Mortgage |
| Less than 2.0x | 238 (49.8%) | 84,417 (11,548.1%) |
| 2.0x to 2.9x | 131 (27.4%) | 513 (70.2%) |
| 3.0x to 3.9x | 35 (7.3%) | 82 (11.2%) |
| 4.0x or more | 74 (15.5%) | 13 (1.8%) |
| Total | 478 (100.0%) | 731 (100.0%) |
Real Estate Taxes by Mortgage Status in Hillsboro
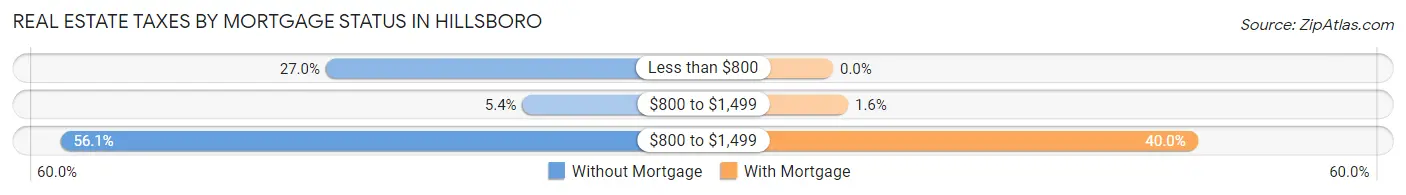
| Property Taxes | Without Mortgage | With Mortgage |
| Less than $800 | 129 (27.0%) | 0 (0.0%) |
| $800 to $1,499 | 26 (5.4%) | 12 (1.6%) |
| $800 to $1,499 | 268 (56.1%) | 292 (40.0%) |
| Total | 478 (100.0%) | 731 (100.0%) |
Health & Disability in Hillsboro
Health Insurance Coverage by Age in Hillsboro
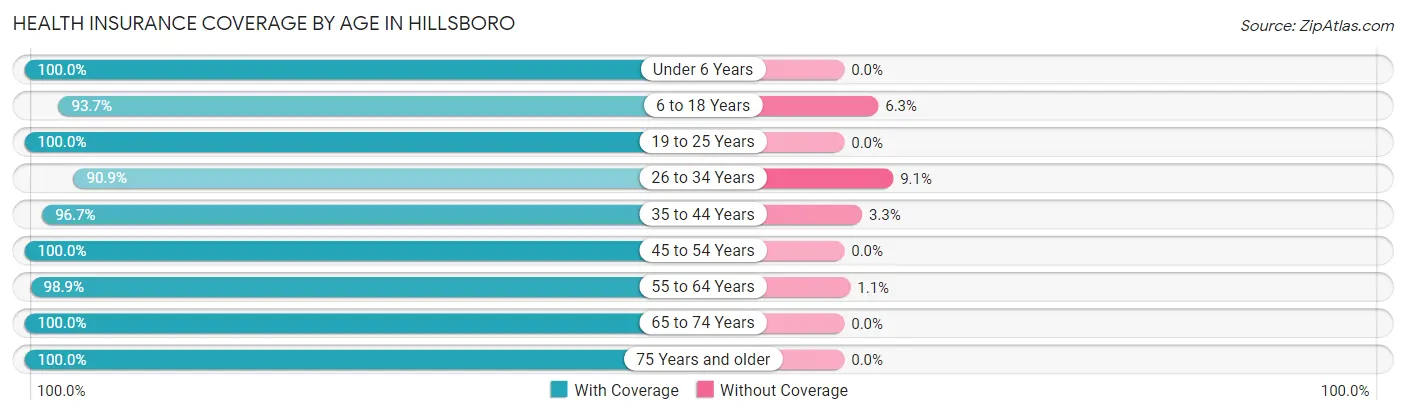
| Age Bracket | With Coverage | Without Coverage |
| Under 6 Years | 174 (100.0%) | 0 (0.0%) |
| 6 to 18 Years | 754 (93.7%) | 51 (6.3%) |
| 19 to 25 Years | 211 (100.0%) | 0 (0.0%) |
| 26 to 34 Years | 229 (90.9%) | 23 (9.1%) |
| 35 to 44 Years | 411 (96.7%) | 14 (3.3%) |
| 45 to 54 Years | 431 (100.0%) | 0 (0.0%) |
| 55 to 64 Years | 611 (98.9%) | 7 (1.1%) |
| 65 to 74 Years | 489 (100.0%) | 0 (0.0%) |
| 75 Years and older | 349 (100.0%) | 0 (0.0%) |
| Total | 3,659 (97.5%) | 95 (2.5%) |
Health Insurance Coverage by Citizenship Status in Hillsboro
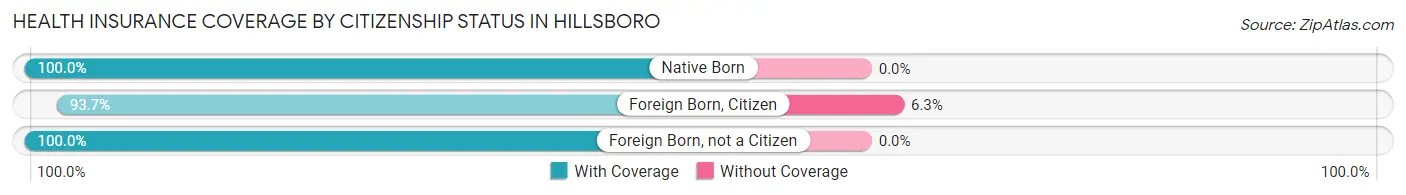
| Citizenship Status | With Coverage | Without Coverage |
| Native Born | 174 (100.0%) | 0 (0.0%) |
| Foreign Born, Citizen | 754 (93.7%) | 51 (6.3%) |
| Foreign Born, not a Citizen | 211 (100.0%) | 0 (0.0%) |
Health Insurance Coverage by Household Income in Hillsboro
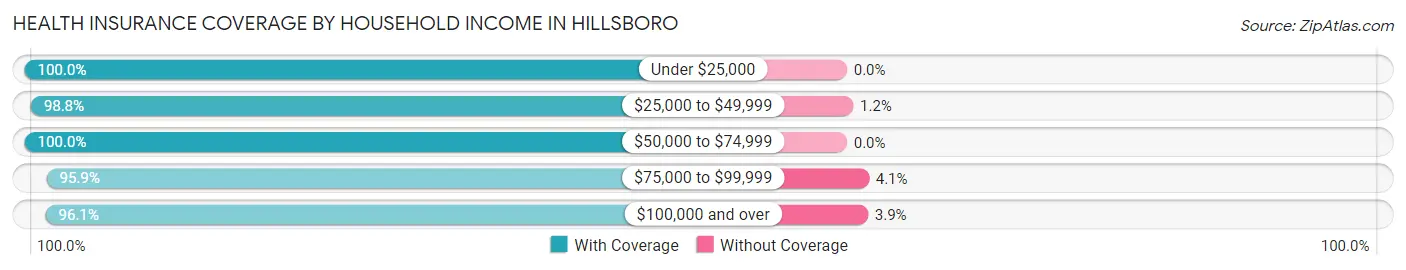
| Household Income | With Coverage | Without Coverage |
| Under $25,000 | 759 (100.0%) | 0 (0.0%) |
| $25,000 to $49,999 | 585 (98.8%) | 7 (1.2%) |
| $50,000 to $74,999 | 198 (100.0%) | 0 (0.0%) |
| $75,000 to $99,999 | 862 (95.9%) | 37 (4.1%) |
| $100,000 and over | 1,244 (96.1%) | 51 (3.9%) |
Public vs Private Health Insurance Coverage by Age in Hillsboro
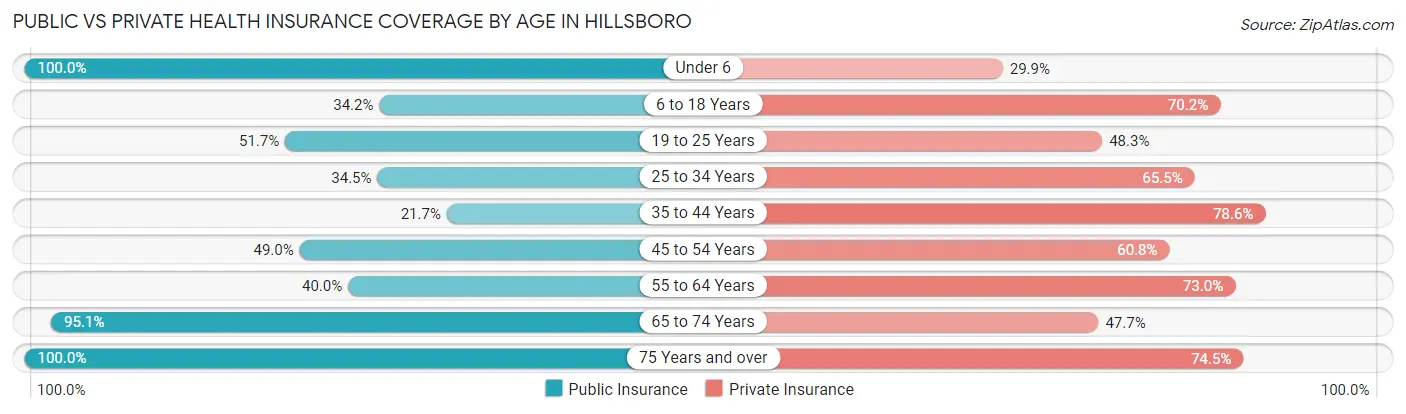
| Age Bracket | Public Insurance | Private Insurance |
| Under 6 | 174 (100.0%) | 52 (29.9%) |
| 6 to 18 Years | 275 (34.2%) | 565 (70.2%) |
| 19 to 25 Years | 109 (51.7%) | 102 (48.3%) |
| 25 to 34 Years | 87 (34.5%) | 165 (65.5%) |
| 35 to 44 Years | 92 (21.6%) | 334 (78.6%) |
| 45 to 54 Years | 211 (49.0%) | 262 (60.8%) |
| 55 to 64 Years | 247 (40.0%) | 451 (73.0%) |
| 65 to 74 Years | 465 (95.1%) | 233 (47.6%) |
| 75 Years and over | 349 (100.0%) | 260 (74.5%) |
| Total | 2,009 (53.5%) | 2,424 (64.6%) |
Disability Status by Sex by Age in Hillsboro
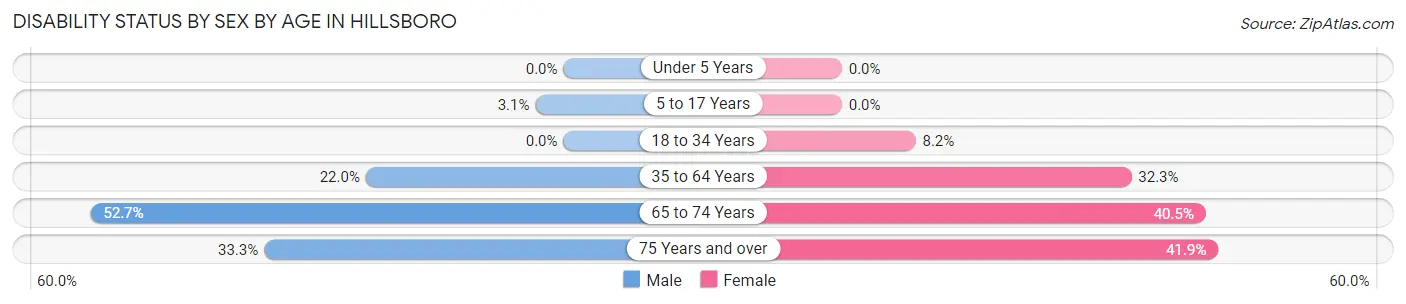
| Age Bracket | Male | Female |
| Under 5 Years | 0 (0.0%) | 0 (0.0%) |
| 5 to 17 Years | 15 (3.1%) | 0 (0.0%) |
| 18 to 34 Years | 0 (0.0%) | 16 (8.2%) |
| 35 to 64 Years | 162 (22.0%) | 238 (32.3%) |
| 65 to 74 Years | 138 (52.7%) | 92 (40.5%) |
| 75 Years and over | 40 (33.3%) | 96 (41.9%) |
Disability Class by Sex by Age in Hillsboro
Disability Class: Hearing Difficulty
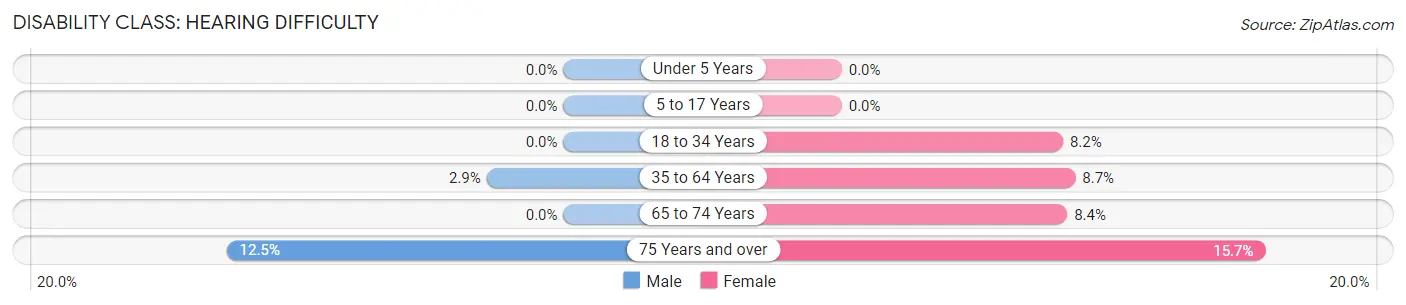
| Age Bracket | Male | Female |
| Under 5 Years | 0 (0.0%) | 0 (0.0%) |
| 5 to 17 Years | 0 (0.0%) | 0 (0.0%) |
| 18 to 34 Years | 0 (0.0%) | 16 (8.2%) |
| 35 to 64 Years | 21 (2.9%) | 64 (8.7%) |
| 65 to 74 Years | 0 (0.0%) | 19 (8.4%) |
| 75 Years and over | 15 (12.5%) | 36 (15.7%) |
Disability Class: Vision Difficulty
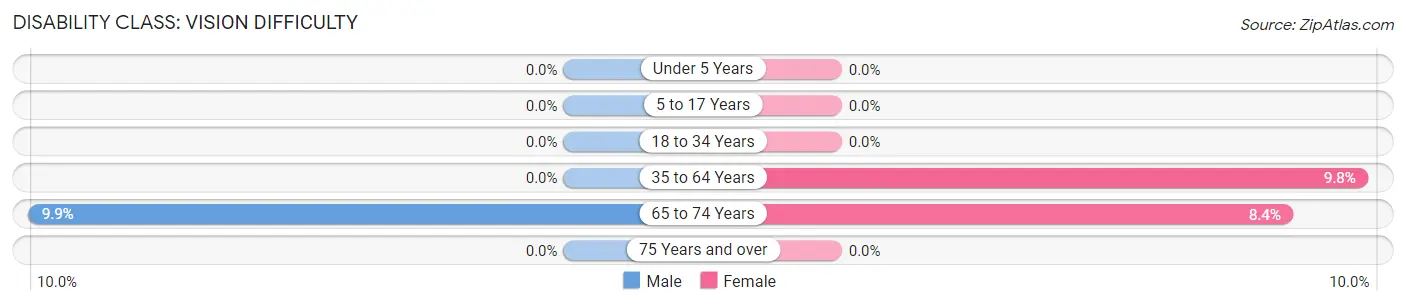
| Age Bracket | Male | Female |
| Under 5 Years | 0 (0.0%) | 0 (0.0%) |
| 5 to 17 Years | 0 (0.0%) | 0 (0.0%) |
| 18 to 34 Years | 0 (0.0%) | 0 (0.0%) |
| 35 to 64 Years | 0 (0.0%) | 72 (9.8%) |
| 65 to 74 Years | 26 (9.9%) | 19 (8.4%) |
| 75 Years and over | 0 (0.0%) | 0 (0.0%) |
Disability Class: Cognitive Difficulty
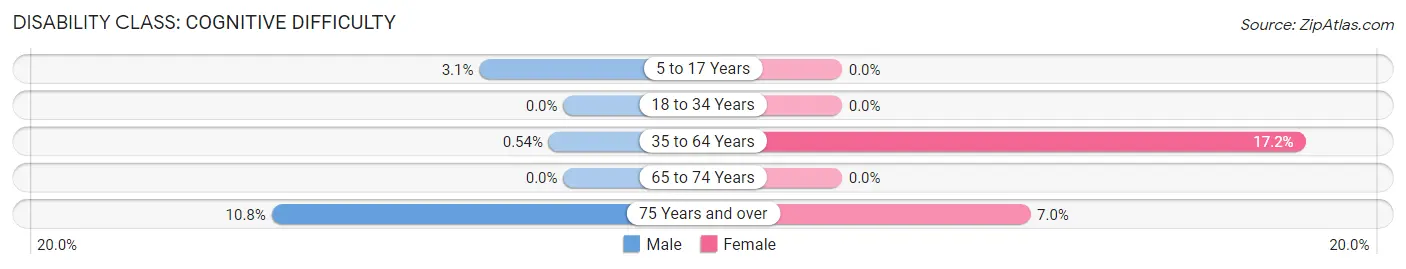
| Age Bracket | Male | Female |
| 5 to 17 Years | 15 (3.1%) | 0 (0.0%) |
| 18 to 34 Years | 0 (0.0%) | 0 (0.0%) |
| 35 to 64 Years | 4 (0.5%) | 127 (17.2%) |
| 65 to 74 Years | 0 (0.0%) | 0 (0.0%) |
| 75 Years and over | 13 (10.8%) | 16 (7.0%) |
Disability Class: Ambulatory Difficulty
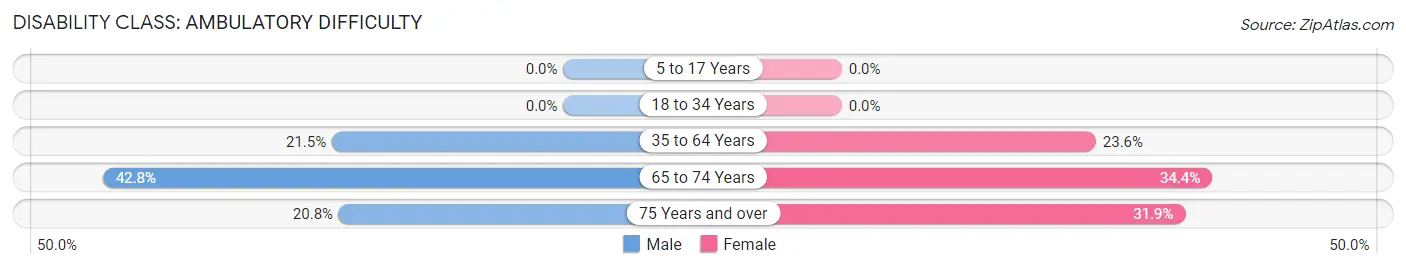
| Age Bracket | Male | Female |
| 5 to 17 Years | 0 (0.0%) | 0 (0.0%) |
| 18 to 34 Years | 0 (0.0%) | 0 (0.0%) |
| 35 to 64 Years | 158 (21.5%) | 174 (23.6%) |
| 65 to 74 Years | 112 (42.7%) | 78 (34.4%) |
| 75 Years and over | 25 (20.8%) | 73 (31.9%) |
Disability Class: Self-Care Difficulty
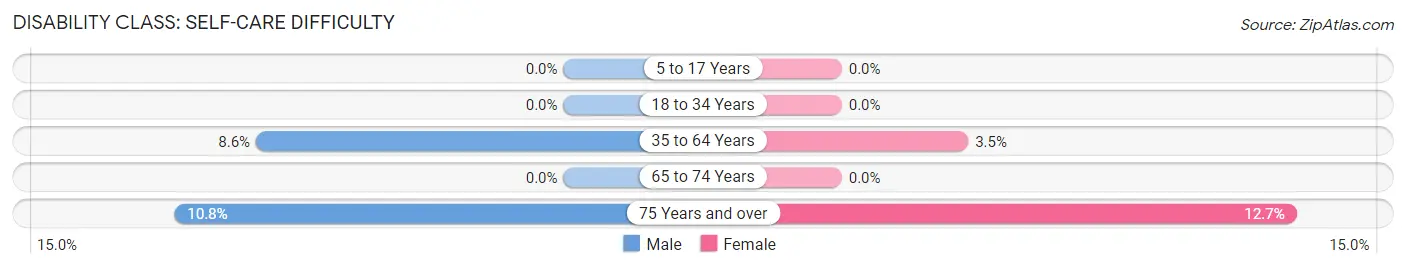
| Age Bracket | Male | Female |
| 5 to 17 Years | 0 (0.0%) | 0 (0.0%) |
| 18 to 34 Years | 0 (0.0%) | 0 (0.0%) |
| 35 to 64 Years | 63 (8.6%) | 26 (3.5%) |
| 65 to 74 Years | 0 (0.0%) | 0 (0.0%) |
| 75 Years and over | 13 (10.8%) | 29 (12.7%) |
Technology Access in Hillsboro
Computing Device Access in Hillsboro
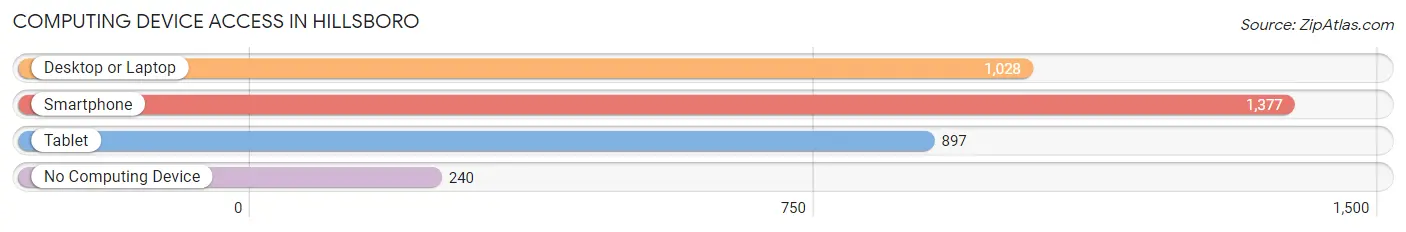
| Device Type | # Households | % Households |
| Desktop or Laptop | 1,028 | 62.1% |
| Smartphone | 1,377 | 83.2% |
| Tablet | 897 | 54.2% |
| No Computing Device | 240 | 14.5% |
| Total | 1,656 | 100.0% |
Internet Access in Hillsboro
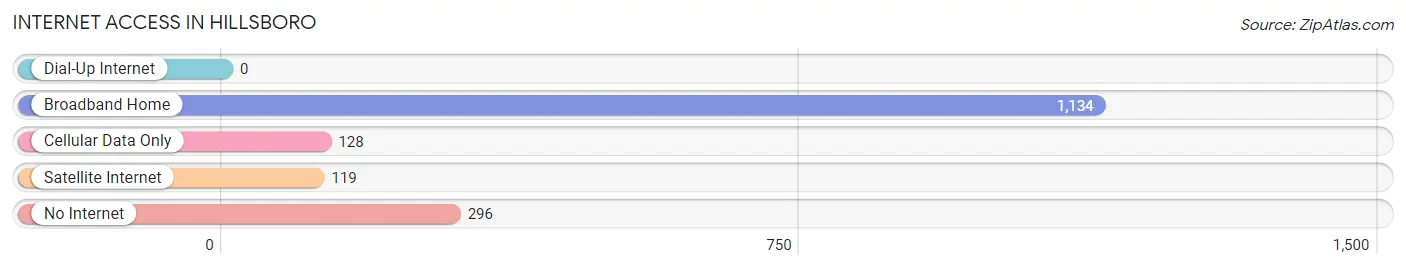
| Internet Type | # Households | % Households |
| Dial-Up Internet | 0 | 0.0% |
| Broadband Home | 1,134 | 68.5% |
| Cellular Data Only | 128 | 7.7% |
| Satellite Internet | 119 | 7.2% |
| No Internet | 296 | 17.9% |
| Total | 1,656 | 100.0% |
Hillsboro Summary
Hillsboro, Illinois is a small city located in Montgomery County, Illinois. It is the county seat of Montgomery County and is located about 50 miles northeast of St. Louis, Missouri. The city has a population of 6,817 as of the 2010 census.
History
Hillsboro was founded in 1821 by William and Mary Hill, who were among the first settlers in the area. The city was named after the Hills and was incorporated in 1855. The city was an important stop on the Underground Railroad, and many escaped slaves found refuge in the city.
In the late 19th century, Hillsboro was a major center for coal mining and the city was home to several coal mines. The city was also home to a number of manufacturing plants, including a glass factory, a brick factory, and a furniture factory.
Geography
Hillsboro is located in central Illinois, about 50 miles northeast of St. Louis, Missouri. The city is situated in the hills of the Ozark Mountains and is surrounded by rolling hills and farmland. The city is located along the Kaskaskia River and is home to several parks and recreational areas.
Economy
Hillsboro’s economy is largely based on agriculture and manufacturing. The city is home to several large farms, including a dairy farm, a hog farm, and a poultry farm. The city is also home to several manufacturing plants, including a glass factory, a brick factory, and a furniture factory.
The city is also home to several retail stores, restaurants, and other businesses. The city is home to a number of banks, insurance companies, and other financial institutions.
Demographics
As of the 2010 census, Hillsboro had a population of 6,817. The racial makeup of the city was 95.3% White, 0.7% African American, 0.3% Native American, 0.4% Asian, 0.1% Pacific Islander, 1.2% from other races, and 2.0% from two or more races. Hispanic or Latino of any race were 3.2% of the population.
The median income for a household in the city was $37,917, and the median income for a family was $45,917. The per capita income for the city was $19,917. About 11.2% of families and 14.2% of the population were below the poverty line, including 19.2% of those under age 18 and 8.2% of those age 65 or over.
Hillsboro is a small city with a rich history and a diverse economy. The city is home to several farms, manufacturing plants, and other businesses. The city is also home to a number of banks, insurance companies, and other financial institutions. The city has a diverse population and a median income that is slightly higher than the national average.
Common Questions
What is Per Capita Income in Hillsboro?
Per Capita income in Hillsboro is $22,296.
What is the Median Family Income in Hillsboro?
Median Family Income in Hillsboro is $83,750.
What is the Median Household income in Hillsboro?
Median Household Income in Hillsboro is $48,302.
What is Income or Wage Gap in Hillsboro?
Income or Wage Gap in Hillsboro is 18.1%.
Women in Hillsboro earn 81.9 cents for every dollar earned by a man.
What is Inequality or Gini Index in Hillsboro?
Inequality or Gini Index in Hillsboro is 0.45.
What is the Total Population of Hillsboro?
Total Population of Hillsboro is 5,673.
What is the Total Male Population of Hillsboro?
Total Male Population of Hillsboro is 3,795.
What is the Total Female Population of Hillsboro?
Total Female Population of Hillsboro is 1,878.
What is the Ratio of Males per 100 Females in Hillsboro?
There are 202.08 Males per 100 Females in Hillsboro.
What is the Ratio of Females per 100 Males in Hillsboro?
There are 49.49 Females per 100 Males in Hillsboro.
What is the Median Population Age in Hillsboro?
Median Population Age in Hillsboro is 40.2 Years.
What is the Average Family Size in Hillsboro
Average Family Size in Hillsboro is 3.1 People.
What is the Average Household Size in Hillsboro
Average Household Size in Hillsboro is 2.3 People.
How Large is the Labor Force in Hillsboro?
There are 1,485 People in the Labor Forcein in Hillsboro.
What is the Percentage of People in the Labor Force in Hillsboro?
30.0% of People are in the Labor Force in Hillsboro.
What is the Unemployment Rate in Hillsboro?
Unemployment Rate in Hillsboro is 5.4%.