Wilmette, IL Map & Demographics
Wilmette Map
Wilmette Overview
$103,076
PER CAPITA INCOME
$233,411
AVG FAMILY INCOME
$183,750
AVG HOUSEHOLD INCOME
54.8%
WAGE / INCOME GAP [ % ]
45.2¢/ $1
WAGE / INCOME GAP [ $ ]
0.51
INEQUALITY / GINI INDEX
27,801
TOTAL POPULATION
13,551
MALE POPULATION
14,250
FEMALE POPULATION
95.09
MALES / 100 FEMALES
105.16
FEMALES / 100 MALES
45.7
MEDIAN AGE
3.2
AVG FAMILY SIZE
2.7
AVG HOUSEHOLD SIZE
12,733
LABOR FORCE [ PEOPLE ]
60.9%
PERCENT IN LABOR FORCE
4.3%
UNEMPLOYMENT RATE
Wilmette Zip Codes
Income in Wilmette
Income Overview in Wilmette
Per Capita Income in Wilmette is $103,076, while median incomes of families and households are $233,411 and $183,750 respectively.
| Characteristic | Number | Measure |
| Per Capita Income | 27,801 | $103,076 |
| Median Family Income | 7,627 | $233,411 |
| Mean Family Income | 7,627 | $320,057 |
| Median Household Income | 10,398 | $183,750 |
| Mean Household Income | 10,398 | $273,718 |
| Income Deficit | 7,627 | $0 |
| Wage / Income Gap (%) | 27,801 | 54.78% |
| Wage / Income Gap ($) | 27,801 | 45.22¢ per $1 |
| Gini / Inequality Index | 27,801 | 0.51 |
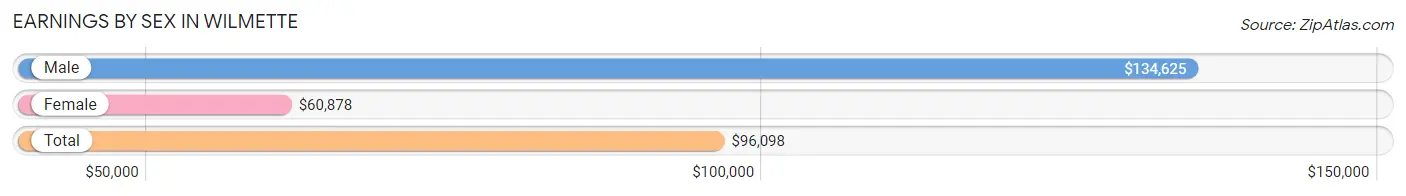
Earnings by Sex in Wilmette
Average Earnings in Wilmette are $96,098, $134,625 for men and $60,878 for women, a difference of 54.8%.
| Sex | Number | Average Earnings |
| Male | 7,306 (54.3%) | $134,625 |
| Female | 6,138 (45.7%) | $60,878 |
| Total | 13,444 (100.0%) | $96,098 |
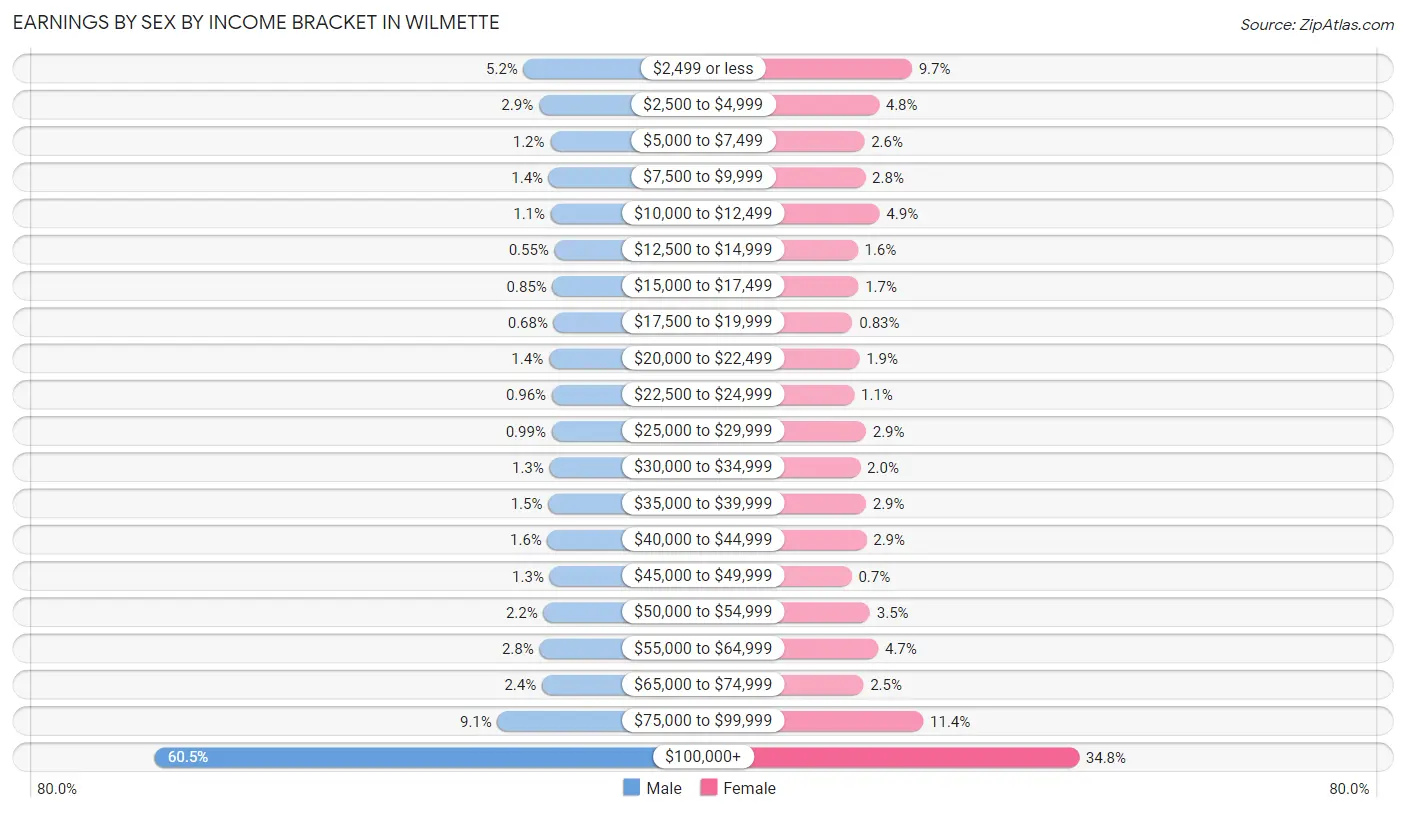
Earnings by Sex by Income Bracket in Wilmette
The most common earnings brackets in Wilmette are $100,000+ for men (4,417 | 60.5%) and $100,000+ for women (2,135 | 34.8%).
| Income | Male | Female |
| $2,499 or less | 380 (5.2%) | 597 (9.7%) |
| $2,500 to $4,999 | 212 (2.9%) | 294 (4.8%) |
| $5,000 to $7,499 | 88 (1.2%) | 160 (2.6%) |
| $7,500 to $9,999 | 103 (1.4%) | 169 (2.8%) |
| $10,000 to $12,499 | 82 (1.1%) | 300 (4.9%) |
| $12,500 to $14,999 | 40 (0.5%) | 99 (1.6%) |
| $15,000 to $17,499 | 62 (0.9%) | 105 (1.7%) |
| $17,500 to $19,999 | 50 (0.7%) | 51 (0.8%) |
| $20,000 to $22,499 | 102 (1.4%) | 114 (1.9%) |
| $22,500 to $24,999 | 70 (1.0%) | 67 (1.1%) |
| $25,000 to $29,999 | 72 (1.0%) | 175 (2.9%) |
| $30,000 to $34,999 | 96 (1.3%) | 123 (2.0%) |
| $35,000 to $39,999 | 110 (1.5%) | 175 (2.9%) |
| $40,000 to $44,999 | 117 (1.6%) | 179 (2.9%) |
| $45,000 to $49,999 | 94 (1.3%) | 43 (0.7%) |
| $50,000 to $54,999 | 162 (2.2%) | 212 (3.5%) |
| $55,000 to $64,999 | 206 (2.8%) | 287 (4.7%) |
| $65,000 to $74,999 | 178 (2.4%) | 151 (2.5%) |
| $75,000 to $99,999 | 665 (9.1%) | 702 (11.4%) |
| $100,000+ | 4,417 (60.5%) | 2,135 (34.8%) |
| Total | 7,306 (100.0%) | 6,138 (100.0%) |
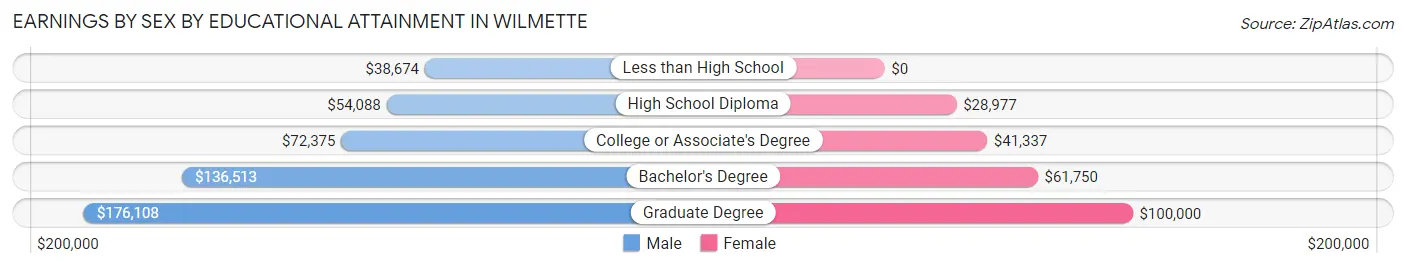
Earnings by Sex by Educational Attainment in Wilmette
Average earnings in Wilmette are $146,335 for men and $78,326 for women, a difference of 46.5%. Men with an educational attainment of graduate degree enjoy the highest average annual earnings of $176,108, while those with less than high school education earn the least with $38,674. Women with an educational attainment of graduate degree earn the most with the average annual earnings of $100,000, while those with high school diploma education have the smallest earnings of $28,977.
| Educational Attainment | Male Income | Female Income |
| Less than High School | $38,674 | $0 |
| High School Diploma | $54,088 | $28,977 |
| College or Associate's Degree | $72,375 | $41,337 |
| Bachelor's Degree | $136,513 | $61,750 |
| Graduate Degree | $176,108 | $100,000 |
| Total | $146,335 | $78,326 |
Family Income in Wilmette
Family Income Brackets in Wilmette
According to the Wilmette family income data, there are 4,347 families falling into the $200,000+ income range, which is the most common income bracket and makes up 57.0% of all families. Conversely, the $15,000 to $24,999 income bracket is the least frequent group with only 23 families (0.3%) belonging to this category.
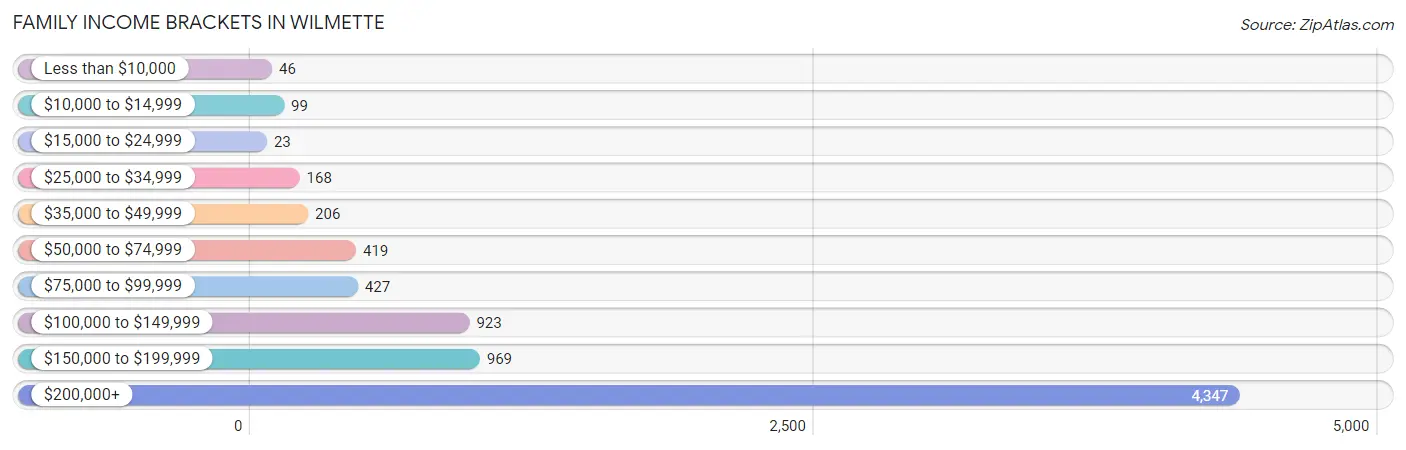
| Income Bracket | # Families | % Families |
| Less than $10,000 | 46 | 0.6% |
| $10,000 to $14,999 | 99 | 1.3% |
| $15,000 to $24,999 | 23 | 0.3% |
| $25,000 to $34,999 | 168 | 2.2% |
| $35,000 to $49,999 | 206 | 2.7% |
| $50,000 to $74,999 | 419 | 5.5% |
| $75,000 to $99,999 | 427 | 5.6% |
| $100,000 to $149,999 | 923 | 12.1% |
| $150,000 to $199,999 | 969 | 12.7% |
| $200,000+ | 4,347 | 57.0% |
Family Income by Famaliy Size in Wilmette
3-person families (1,533 | 20.1%) account for the highest median family income in Wilmette with $250,001 per family, while 2-person families (3,012 | 39.5%) have the highest median income of $86,103 per family member.
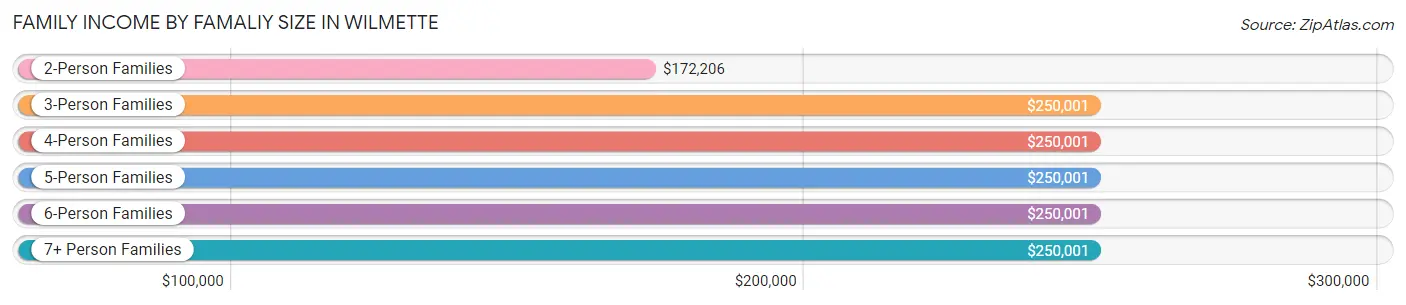
| Income Bracket | # Families | Median Income |
| 2-Person Families | 3,012 (39.5%) | $172,206 |
| 3-Person Families | 1,533 (20.1%) | $250,001 |
| 4-Person Families | 2,025 (26.6%) | $250,001 |
| 5-Person Families | 864 (11.3%) | $250,001 |
| 6-Person Families | 160 (2.1%) | $250,001 |
| 7+ Person Families | 33 (0.4%) | $250,001 |
| Total | 7,627 (100.0%) | $233,411 |
Family Income by Number of Earners in Wilmette
The median family income in Wilmette is $233,411, with families comprising 2 earners (3,521) having the highest median family income of $250,001, while families with no earners (929) have the lowest median family income of $90,101, accounting for 46.2% and 12.2% of families, respectively.
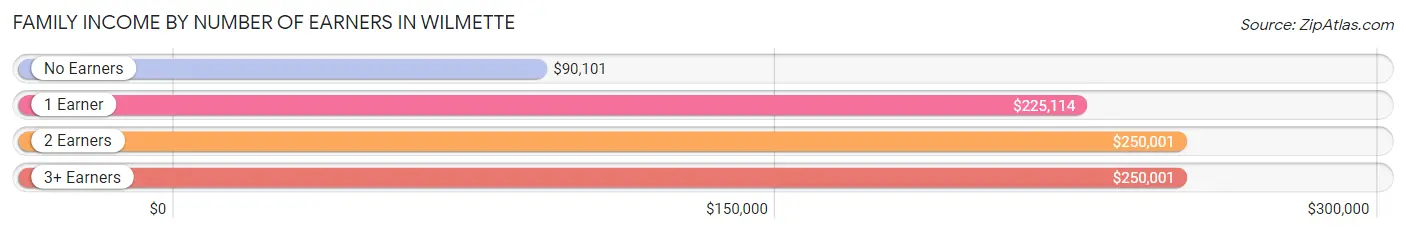
| Number of Earners | # Families | Median Income |
| No Earners | 929 (12.2%) | $90,101 |
| 1 Earner | 2,415 (31.7%) | $225,114 |
| 2 Earners | 3,521 (46.2%) | $250,001 |
| 3+ Earners | 762 (10.0%) | $250,001 |
| Total | 7,627 (100.0%) | $233,411 |
Household Income in Wilmette
Household Income Brackets in Wilmette
With 4,845 households falling in the category, the $200,000+ income range is the most frequent in Wilmette, accounting for 46.6% of all households. In contrast, only 156 households (1.5%) fall into the $10,000 to $14,999 income bracket, making it the least populous group.
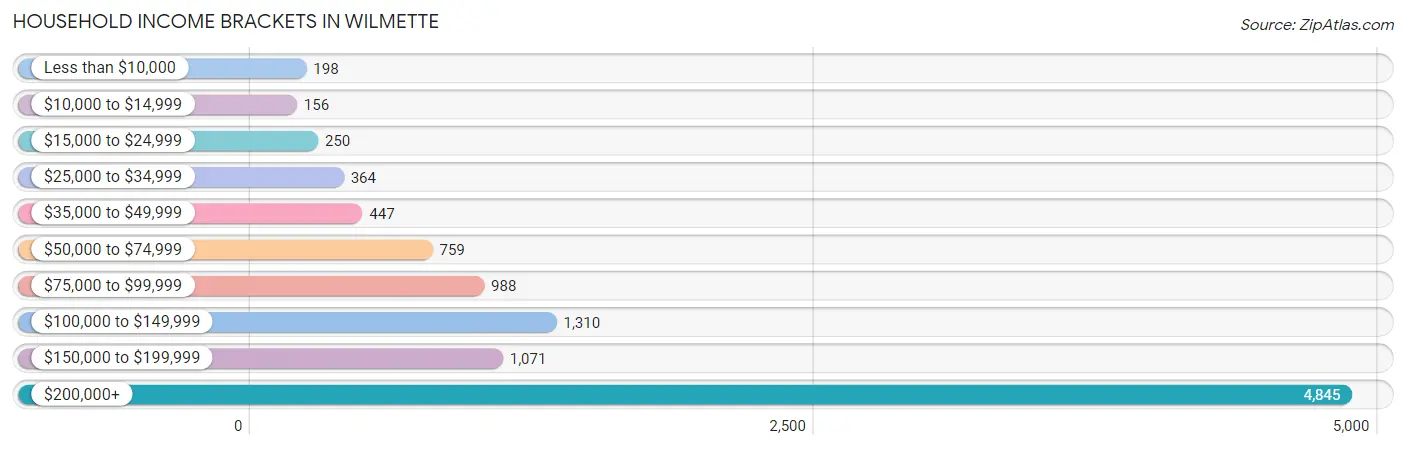
| Income Bracket | # Households | % Households |
| Less than $10,000 | 198 | 1.9% |
| $10,000 to $14,999 | 156 | 1.5% |
| $15,000 to $24,999 | 250 | 2.4% |
| $25,000 to $34,999 | 364 | 3.5% |
| $35,000 to $49,999 | 447 | 4.3% |
| $50,000 to $74,999 | 759 | 7.3% |
| $75,000 to $99,999 | 988 | 9.5% |
| $100,000 to $149,999 | 1,310 | 12.6% |
| $150,000 to $199,999 | 1,071 | 10.3% |
| $200,000+ | 4,845 | 46.6% |
Household Income by Householder Age in Wilmette
The median household income in Wilmette is $183,750, with the highest median household income of $250,001 found in the 25 to 44 years age bracket for the primary householder. A total of 1,909 households (18.4%) fall into this category. Meanwhile, the 15 to 24 years age bracket for the primary householder has the lowest median household income of $0, with 24 households (0.2%) in this group.
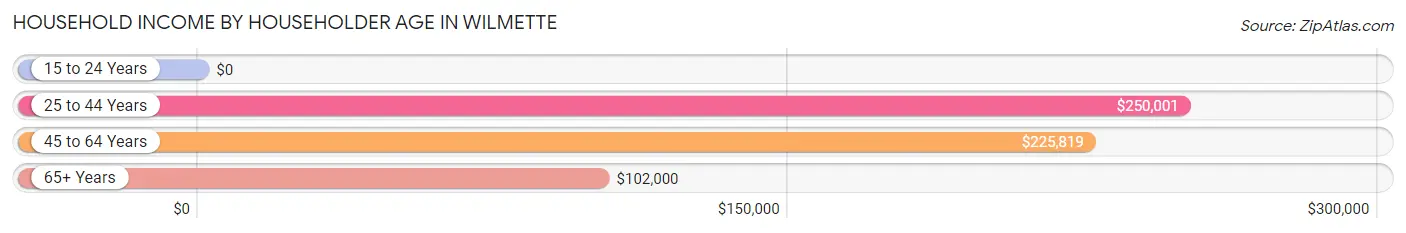
| Income Bracket | # Households | Median Income |
| 15 to 24 Years | 24 (0.2%) | $0 |
| 25 to 44 Years | 1,909 (18.4%) | $250,001 |
| 45 to 64 Years | 4,703 (45.2%) | $225,819 |
| 65+ Years | 3,762 (36.2%) | $102,000 |
| Total | 10,398 (100.0%) | $183,750 |
Poverty in Wilmette
Income Below Poverty by Sex and Age in Wilmette
With 3.0% poverty level for males and 2.8% for females among the residents of Wilmette, 25 to 34 year old males and 5 year old females are the most vulnerable to poverty, with 52 males (8.7%) and 9 females (7.2%) in their respective age groups living below the poverty level.
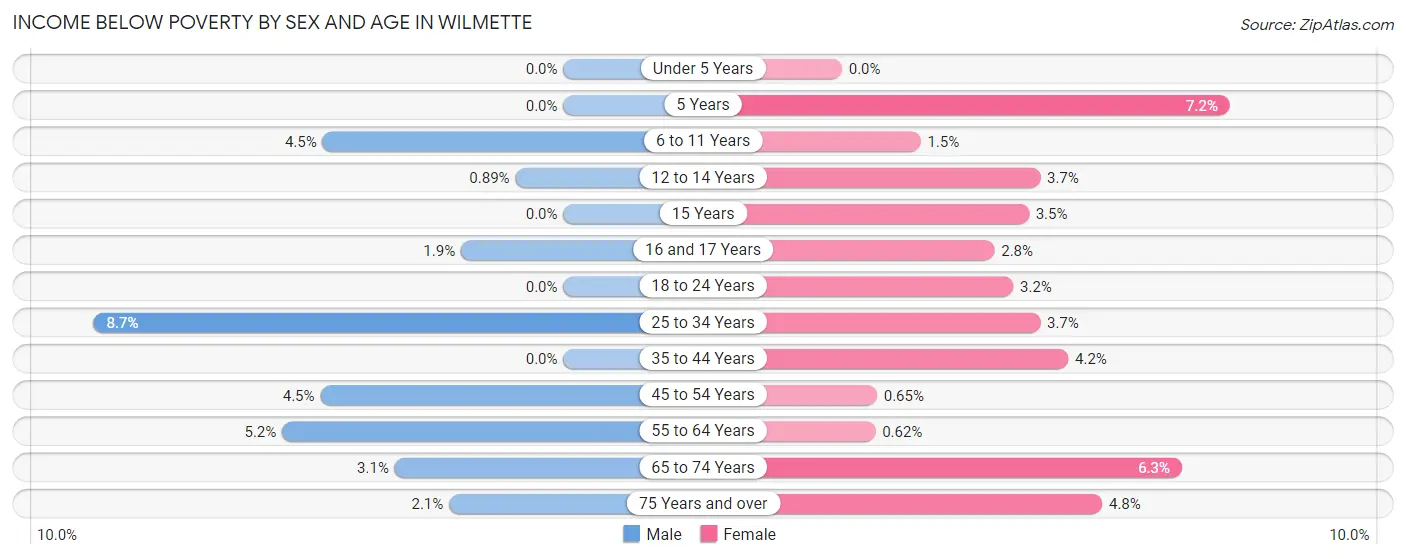
| Age Bracket | Male | Female |
| Under 5 Years | 0 (0.0%) | 0 (0.0%) |
| 5 Years | 0 (0.0%) | 9 (7.2%) |
| 6 to 11 Years | 63 (4.5%) | 20 (1.5%) |
| 12 to 14 Years | 7 (0.9%) | 27 (3.7%) |
| 15 Years | 0 (0.0%) | 10 (3.5%) |
| 16 and 17 Years | 13 (1.9%) | 17 (2.8%) |
| 18 to 24 Years | 0 (0.0%) | 18 (3.2%) |
| 25 to 34 Years | 52 (8.7%) | 22 (3.7%) |
| 35 to 44 Years | 0 (0.0%) | 72 (4.2%) |
| 45 to 54 Years | 101 (4.5%) | 16 (0.6%) |
| 55 to 64 Years | 105 (5.2%) | 11 (0.6%) |
| 65 to 74 Years | 44 (3.1%) | 98 (6.3%) |
| 75 Years and over | 24 (2.1%) | 76 (4.8%) |
| Total | 409 (3.0%) | 396 (2.8%) |
Income Above Poverty by Sex and Age in Wilmette
According to the poverty statistics in Wilmette, males aged under 5 years and females aged under 5 years are the age groups that are most secure financially, with 100.0% of males and 100.0% of females in these age groups living above the poverty line.
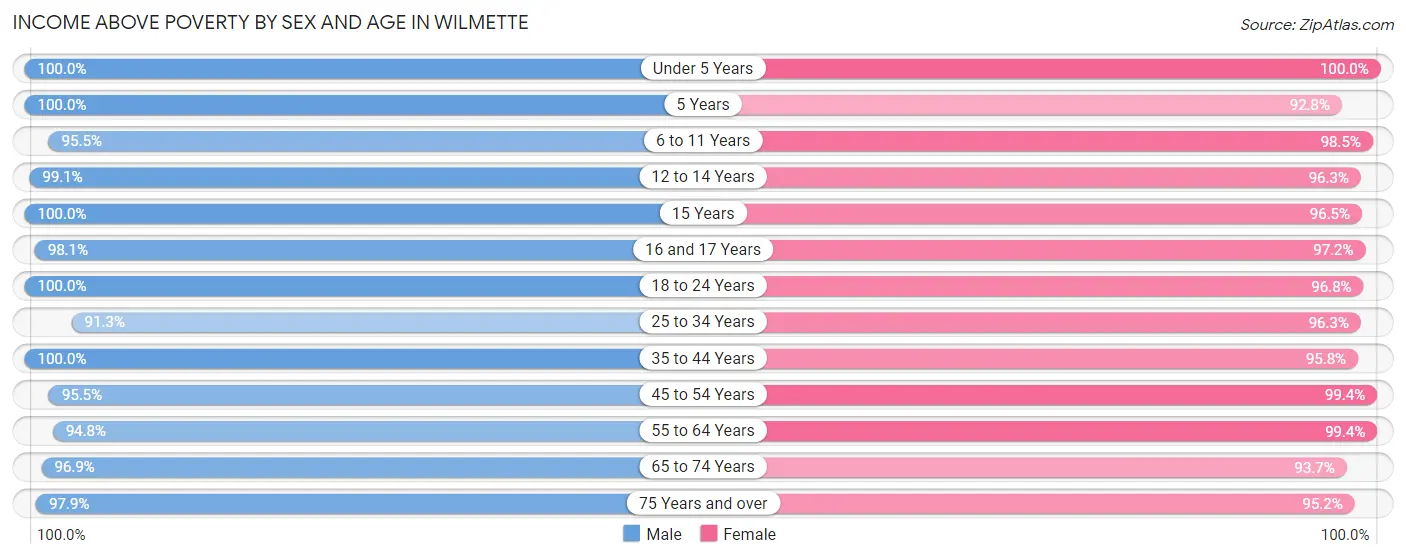
| Age Bracket | Male | Female |
| Under 5 Years | 901 (100.0%) | 833 (100.0%) |
| 5 Years | 156 (100.0%) | 116 (92.8%) |
| 6 to 11 Years | 1,347 (95.5%) | 1,347 (98.5%) |
| 12 to 14 Years | 781 (99.1%) | 707 (96.3%) |
| 15 Years | 281 (100.0%) | 278 (96.5%) |
| 16 and 17 Years | 673 (98.1%) | 584 (97.2%) |
| 18 to 24 Years | 502 (100.0%) | 548 (96.8%) |
| 25 to 34 Years | 544 (91.3%) | 576 (96.3%) |
| 35 to 44 Years | 1,419 (100.0%) | 1,644 (95.8%) |
| 45 to 54 Years | 2,137 (95.5%) | 2,429 (99.4%) |
| 55 to 64 Years | 1,908 (94.8%) | 1,777 (99.4%) |
| 65 to 74 Years | 1,362 (96.9%) | 1,454 (93.7%) |
| 75 Years and over | 1,106 (97.9%) | 1,497 (95.2%) |
| Total | 13,117 (97.0%) | 13,790 (97.2%) |
Income Below Poverty Among Married-Couple Families in Wilmette
The poverty statistics for married-couple families in Wilmette show that 1.5% or 99 of the total 6,826 families live below the poverty line. Families with no children have the highest poverty rate of 1.8%, comprising of 56 families. On the other hand, families with 3 or 4 children have the lowest poverty rate of 0.0%, which includes 0 families.
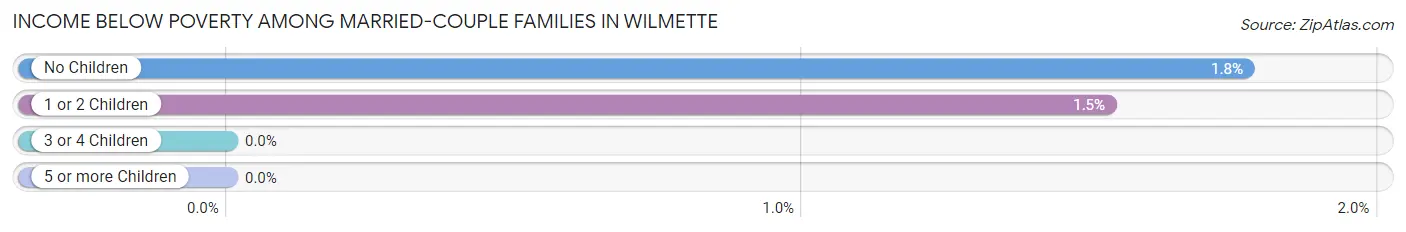
| Children | Above Poverty | Below Poverty |
| No Children | 3,113 (98.2%) | 56 (1.8%) |
| 1 or 2 Children | 2,769 (98.5%) | 43 (1.5%) |
| 3 or 4 Children | 825 (100.0%) | 0 (0.0%) |
| 5 or more Children | 20 (100.0%) | 0 (0.0%) |
| Total | 6,727 (98.6%) | 99 (1.5%) |
Income Below Poverty Among Single-Parent Households in Wilmette
According to the poverty data in Wilmette, 17.4% or 58 single-father households and 5.6% or 26 single-mother households are living below the poverty line. Among single-father households, those with no children have the highest poverty rate, with 48 households (28.2%) experiencing poverty. Likewise, among single-mother households, those with 1 or 2 children have the highest poverty rate, with 26 households (11.6%) falling below the poverty line.
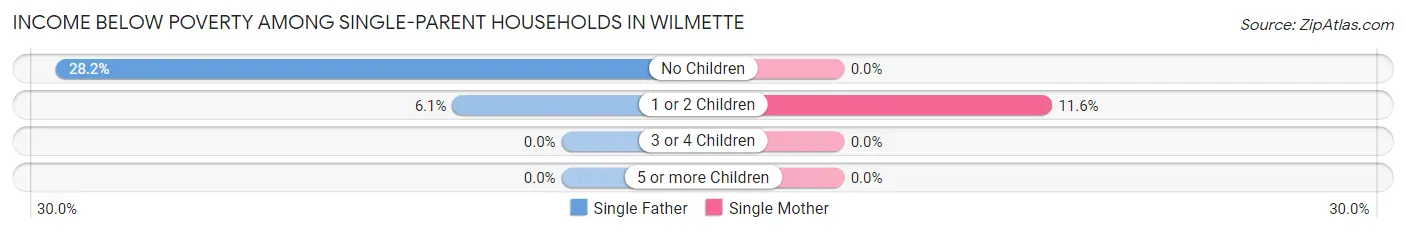
| Children | Single Father | Single Mother |
| No Children | 48 (28.2%) | 0 (0.0%) |
| 1 or 2 Children | 10 (6.1%) | 26 (11.6%) |
| 3 or 4 Children | 0 (0.0%) | 0 (0.0%) |
| 5 or more Children | 0 (0.0%) | 0 (0.0%) |
| Total | 58 (17.4%) | 26 (5.6%) |
Income Below Poverty Among Married-Couple vs Single-Parent Households in Wilmette
The poverty data for Wilmette shows that 99 of the married-couple family households (1.5%) and 84 of the single-parent households (10.5%) are living below the poverty level. Within the married-couple family households, those with no children have the highest poverty rate, with 56 households (1.8%) falling below the poverty line. Among the single-parent households, those with no children have the highest poverty rate, with 48 household (12.1%) living below poverty.
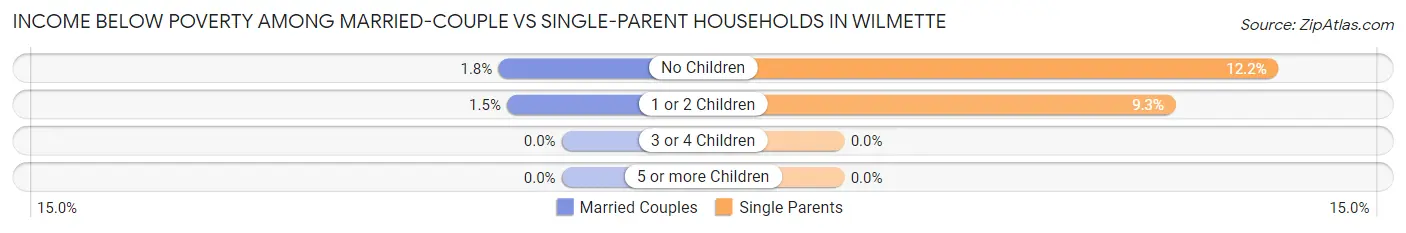
| Children | Married-Couple Families | Single-Parent Households |
| No Children | 56 (1.8%) | 48 (12.1%) |
| 1 or 2 Children | 43 (1.5%) | 36 (9.3%) |
| 3 or 4 Children | 0 (0.0%) | 0 (0.0%) |
| 5 or more Children | 0 (0.0%) | 0 (0.0%) |
| Total | 99 (1.5%) | 84 (10.5%) |
Race in Wilmette
The most populous races in Wilmette are White / Caucasian (22,742 | 81.8%), Asian (3,219 | 11.6%), and Two or more Races (1,270 | 4.6%).
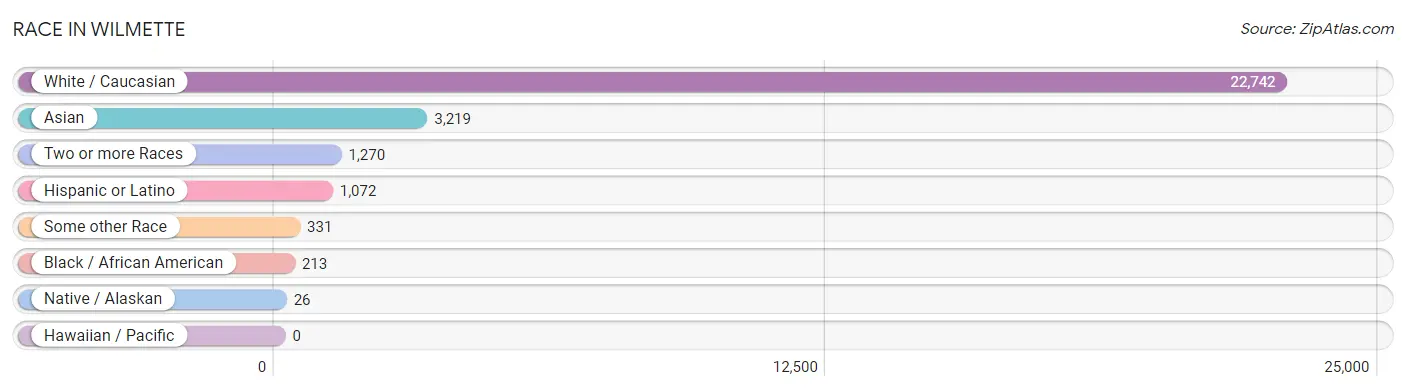
| Race | # Population | % Population |
| Asian | 3,219 | 11.6% |
| Black / African American | 213 | 0.8% |
| Hawaiian / Pacific | 0 | 0.0% |
| Hispanic or Latino | 1,072 | 3.9% |
| Native / Alaskan | 26 | 0.1% |
| White / Caucasian | 22,742 | 81.8% |
| Two or more Races | 1,270 | 4.6% |
| Some other Race | 331 | 1.2% |
| Total | 27,801 | 100.0% |
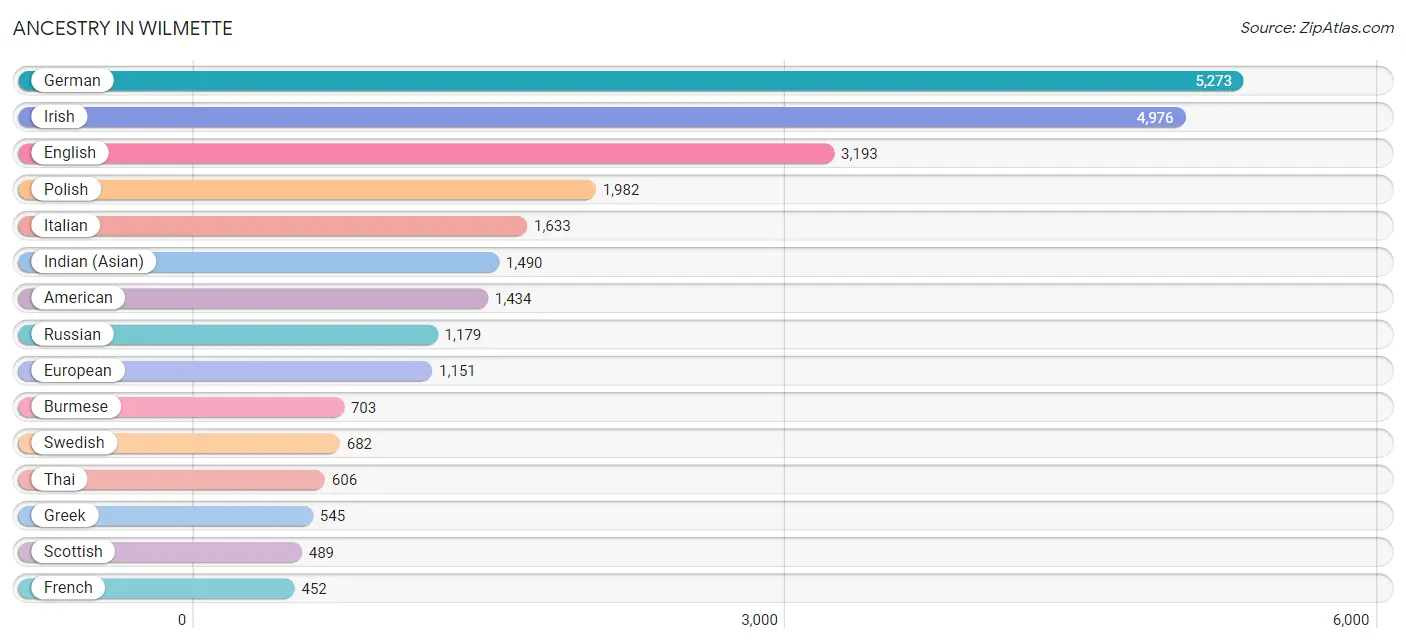
Ancestry in Wilmette
The most populous ancestries reported in Wilmette are German (5,273 | 19.0%), Irish (4,976 | 17.9%), English (3,193 | 11.5%), Polish (1,982 | 7.1%), and Italian (1,633 | 5.9%), together accounting for 61.4% of all Wilmette residents.
| Ancestry | # Population | % Population |
| Afghan | 21 | 0.1% |
| Albanian | 9 | 0.0% |
| American | 1,434 | 5.2% |
| Arab | 283 | 1.0% |
| Argentinean | 9 | 0.0% |
| Armenian | 120 | 0.4% |
| Assyrian / Chaldean / Syriac | 70 | 0.3% |
| Australian | 30 | 0.1% |
| Austrian | 127 | 0.5% |
| Belgian | 58 | 0.2% |
| Bhutanese | 147 | 0.5% |
| British | 238 | 0.9% |
| Bulgarian | 52 | 0.2% |
| Burmese | 703 | 2.5% |
| Canadian | 81 | 0.3% |
| Central American Indian | 25 | 0.1% |
| Chilean | 16 | 0.1% |
| Chippewa | 66 | 0.2% |
| Colombian | 156 | 0.6% |
| Croatian | 119 | 0.4% |
| Cuban | 137 | 0.5% |
| Czech | 286 | 1.0% |
| Czechoslovakian | 13 | 0.1% |
| Danish | 434 | 1.6% |
| Dutch | 379 | 1.4% |
| Eastern European | 296 | 1.1% |
| Ecuadorian | 52 | 0.2% |
| Egyptian | 15 | 0.1% |
| English | 3,193 | 11.5% |
| European | 1,151 | 4.1% |
| Filipino | 268 | 1.0% |
| Finnish | 77 | 0.3% |
| French | 452 | 1.6% |
| French Canadian | 73 | 0.3% |
| German | 5,273 | 19.0% |
| Greek | 545 | 2.0% |
| Haitian | 9 | 0.0% |
| Hungarian | 245 | 0.9% |
| Indian (Asian) | 1,490 | 5.4% |
| Iranian | 137 | 0.5% |
| Iraqi | 9 | 0.0% |
| Irish | 4,976 | 17.9% |
| Iroquois | 8 | 0.0% |
| Israeli | 47 | 0.2% |
| Italian | 1,633 | 5.9% |
| Korean | 304 | 1.1% |
| Latvian | 197 | 0.7% |
| Lebanese | 74 | 0.3% |
| Lithuanian | 159 | 0.6% |
| Luxembourger | 9 | 0.0% |
| Macedonian | 1 | 0.0% |
| Maltese | 39 | 0.1% |
| Mexican | 369 | 1.3% |
| Moroccan | 55 | 0.2% |
| Native Hawaiian | 17 | 0.1% |
| Northern European | 33 | 0.1% |
| Norwegian | 423 | 1.5% |
| Palestinian | 6 | 0.0% |
| Peruvian | 74 | 0.3% |
| Polish | 1,982 | 7.1% |
| Portuguese | 59 | 0.2% |
| Puerto Rican | 73 | 0.3% |
| Romanian | 73 | 0.3% |
| Russian | 1,179 | 4.2% |
| Scandinavian | 28 | 0.1% |
| Scotch-Irish | 134 | 0.5% |
| Scottish | 489 | 1.8% |
| Serbian | 115 | 0.4% |
| Slavic | 10 | 0.0% |
| Slovak | 100 | 0.4% |
| Slovene | 10 | 0.0% |
| South American | 307 | 1.1% |
| Spaniard | 61 | 0.2% |
| Sri Lankan | 51 | 0.2% |
| Subsaharan African | 1 | 0.0% |
| Swedish | 682 | 2.5% |
| Swiss | 68 | 0.2% |
| Syrian | 41 | 0.2% |
| Thai | 606 | 2.2% |
| Turkish | 88 | 0.3% |
| Ugandan | 1 | 0.0% |
| Ukrainian | 294 | 1.1% |
| Vietnamese | 22 | 0.1% |
| Welsh | 144 | 0.5% |
| West Indian | 25 | 0.1% |
| Yugoslavian | 77 | 0.3% | View All 86 Rows |
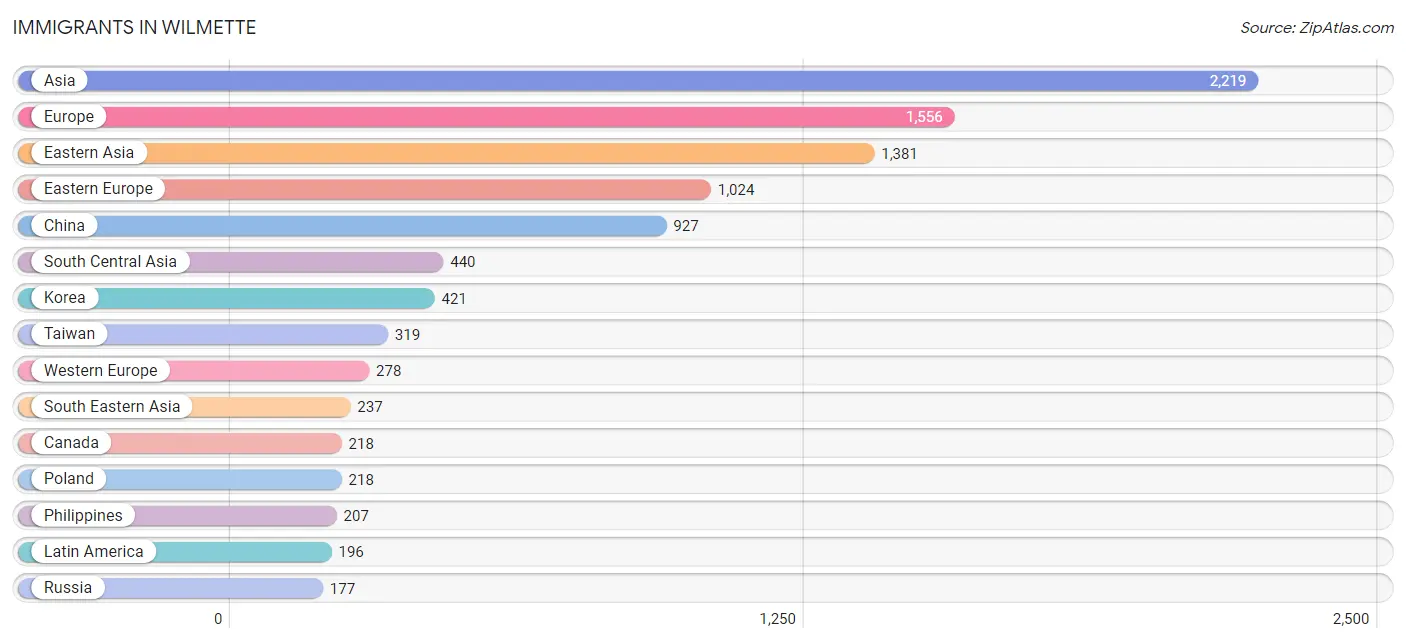
Immigrants in Wilmette
The most numerous immigrant groups reported in Wilmette came from Asia (2,219 | 8.0%), Europe (1,556 | 5.6%), Eastern Asia (1,381 | 5.0%), Eastern Europe (1,024 | 3.7%), and China (927 | 3.3%), together accounting for 25.6% of all Wilmette residents.
| Immigration Origin | # Population | % Population |
| Afghanistan | 14 | 0.1% |
| Africa | 28 | 0.1% |
| Albania | 10 | 0.0% |
| Argentina | 9 | 0.0% |
| Asia | 2,219 | 8.0% |
| Australia | 30 | 0.1% |
| Austria | 19 | 0.1% |
| Bangladesh | 52 | 0.2% |
| Belarus | 62 | 0.2% |
| Belgium | 36 | 0.1% |
| Bosnia and Herzegovina | 31 | 0.1% |
| Bulgaria | 52 | 0.2% |
| Canada | 218 | 0.8% |
| Caribbean | 39 | 0.1% |
| Central America | 74 | 0.3% |
| Chile | 16 | 0.1% |
| China | 927 | 3.3% |
| Colombia | 48 | 0.2% |
| Croatia | 18 | 0.1% |
| Cuba | 30 | 0.1% |
| Czechoslovakia | 43 | 0.2% |
| Denmark | 20 | 0.1% |
| Eastern Africa | 28 | 0.1% |
| Eastern Asia | 1,381 | 5.0% |
| Eastern Europe | 1,024 | 3.7% |
| Ecuador | 10 | 0.0% |
| England | 69 | 0.3% |
| Europe | 1,556 | 5.6% |
| France | 87 | 0.3% |
| Germany | 76 | 0.3% |
| Greece | 49 | 0.2% |
| Haiti | 9 | 0.0% |
| Hong Kong | 18 | 0.1% |
| India | 133 | 0.5% |
| Iran | 118 | 0.4% |
| Iraq | 17 | 0.1% |
| Ireland | 6 | 0.0% |
| Israel | 57 | 0.2% |
| Italy | 46 | 0.2% |
| Japan | 33 | 0.1% |
| Jordan | 6 | 0.0% |
| Kenya | 19 | 0.1% |
| Korea | 421 | 1.5% |
| Latin America | 196 | 0.7% |
| Latvia | 96 | 0.4% |
| Lebanon | 20 | 0.1% |
| Lithuania | 19 | 0.1% |
| Malaysia | 6 | 0.0% |
| Mexico | 74 | 0.3% |
| Moldova | 19 | 0.1% |
| Nepal | 13 | 0.1% |
| Netherlands | 50 | 0.2% |
| Northern Europe | 146 | 0.5% |
| Oceania | 30 | 0.1% |
| Pakistan | 110 | 0.4% |
| Philippines | 207 | 0.7% |
| Poland | 218 | 0.8% |
| Romania | 68 | 0.2% |
| Russia | 177 | 0.6% |
| Saudi Arabia | 28 | 0.1% |
| Scotland | 12 | 0.0% |
| Serbia | 8 | 0.0% |
| South America | 83 | 0.3% |
| South Central Asia | 440 | 1.6% |
| South Eastern Asia | 237 | 0.9% |
| Southern Europe | 108 | 0.4% |
| Spain | 13 | 0.1% |
| Switzerland | 10 | 0.0% |
| Taiwan | 319 | 1.1% |
| Turkey | 33 | 0.1% |
| Uganda | 1 | 0.0% |
| Ukraine | 161 | 0.6% |
| Vietnam | 24 | 0.1% |
| Western Asia | 161 | 0.6% |
| Western Europe | 278 | 1.0% | View All 75 Rows |
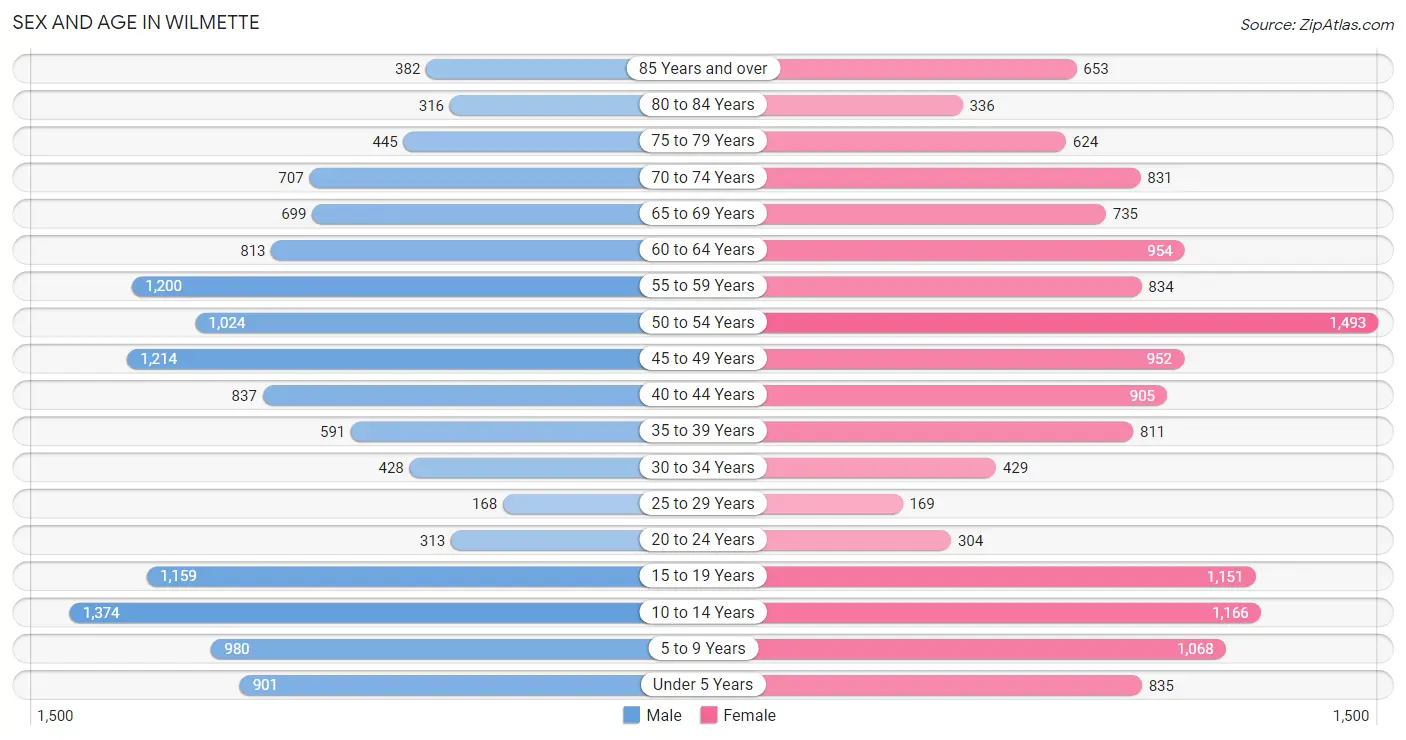
Sex and Age in Wilmette
Sex and Age in Wilmette
The most populous age groups in Wilmette are 10 to 14 Years (1,374 | 10.1%) for men and 50 to 54 Years (1,493 | 10.5%) for women.
| Age Bracket | Male | Female |
| Under 5 Years | 901 (6.7%) | 835 (5.9%) |
| 5 to 9 Years | 980 (7.2%) | 1,068 (7.5%) |
| 10 to 14 Years | 1,374 (10.1%) | 1,166 (8.2%) |
| 15 to 19 Years | 1,159 (8.6%) | 1,151 (8.1%) |
| 20 to 24 Years | 313 (2.3%) | 304 (2.1%) |
| 25 to 29 Years | 168 (1.2%) | 169 (1.2%) |
| 30 to 34 Years | 428 (3.2%) | 429 (3.0%) |
| 35 to 39 Years | 591 (4.4%) | 811 (5.7%) |
| 40 to 44 Years | 837 (6.2%) | 905 (6.4%) |
| 45 to 49 Years | 1,214 (9.0%) | 952 (6.7%) |
| 50 to 54 Years | 1,024 (7.6%) | 1,493 (10.5%) |
| 55 to 59 Years | 1,200 (8.9%) | 834 (5.9%) |
| 60 to 64 Years | 813 (6.0%) | 954 (6.7%) |
| 65 to 69 Years | 699 (5.2%) | 735 (5.2%) |
| 70 to 74 Years | 707 (5.2%) | 831 (5.8%) |
| 75 to 79 Years | 445 (3.3%) | 624 (4.4%) |
| 80 to 84 Years | 316 (2.3%) | 336 (2.4%) |
| 85 Years and over | 382 (2.8%) | 653 (4.6%) |
| Total | 13,551 (100.0%) | 14,250 (100.0%) |
Families and Households in Wilmette
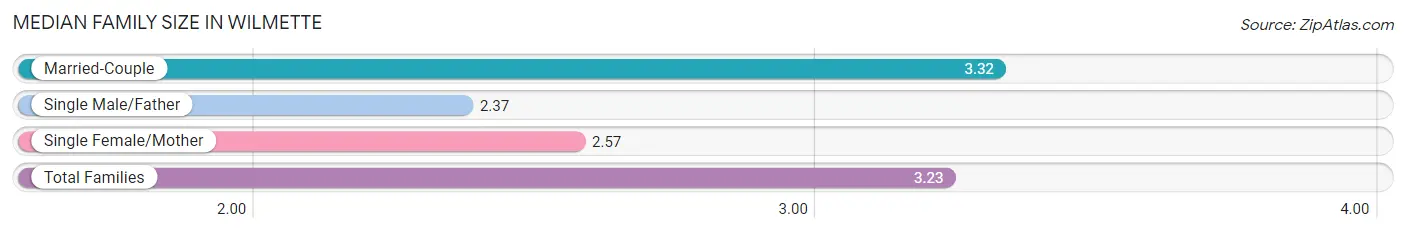
Median Family Size in Wilmette
The median family size in Wilmette is 3.23 persons per family, with married-couple families (6,826 | 89.5%) accounting for the largest median family size of 3.32 persons per family. On the other hand, single male/father families (334 | 4.4%) represent the smallest median family size with 2.37 persons per family.
| Family Type | # Families | Family Size |
| Married-Couple | 6,826 (89.5%) | 3.32 |
| Single Male/Father | 334 (4.4%) | 2.37 |
| Single Female/Mother | 467 (6.1%) | 2.57 |
| Total Families | 7,627 (100.0%) | 3.23 |
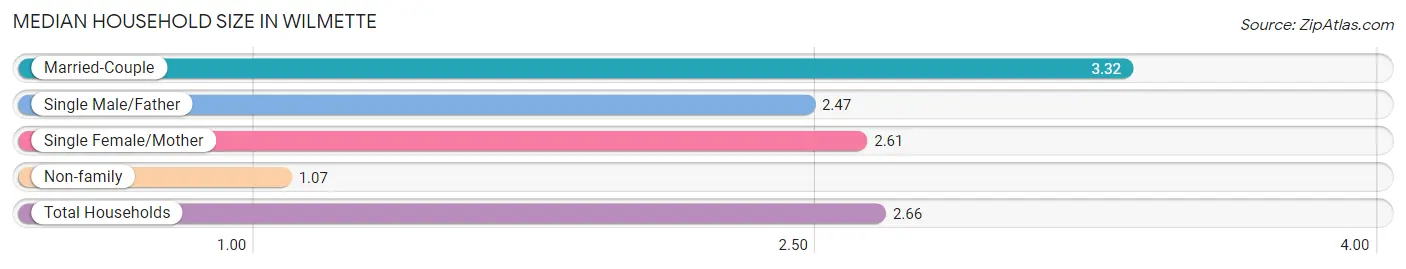
Median Household Size in Wilmette
The median household size in Wilmette is 2.66 persons per household, with married-couple households (6,826 | 65.6%) accounting for the largest median household size of 3.32 persons per household. non-family households (2,771 | 26.7%) represent the smallest median household size with 1.07 persons per household.
| Household Type | # Households | Household Size |
| Married-Couple | 6,826 (65.6%) | 3.32 |
| Single Male/Father | 334 (3.2%) | 2.47 |
| Single Female/Mother | 467 (4.5%) | 2.61 |
| Non-family | 2,771 (26.7%) | 1.07 |
| Total Households | 10,398 (100.0%) | 2.66 |
Household Size by Marriage Status in Wilmette
Out of a total of 10,398 households in Wilmette, 7,627 (73.4%) are family households, while 2,771 (26.7%) are nonfamily households. The most numerous type of family households are 2-person households, comprising 2,958, and the most common type of nonfamily households are 1-person households, comprising 2,617.
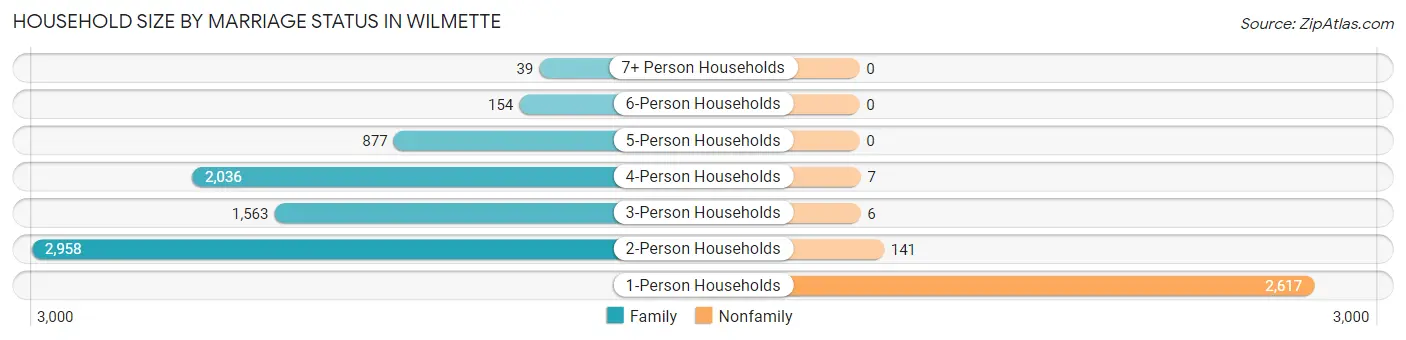
| Household Size | Family Households | Nonfamily Households |
| 1-Person Households | - | 2,617 (25.2%) |
| 2-Person Households | 2,958 (28.4%) | 141 (1.4%) |
| 3-Person Households | 1,563 (15.0%) | 6 (0.1%) |
| 4-Person Households | 2,036 (19.6%) | 7 (0.1%) |
| 5-Person Households | 877 (8.4%) | 0 (0.0%) |
| 6-Person Households | 154 (1.5%) | 0 (0.0%) |
| 7+ Person Households | 39 (0.4%) | 0 (0.0%) |
| Total | 7,627 (73.4%) | 2,771 (26.7%) |
Female Fertility in Wilmette
Fertility by Age in Wilmette
Average fertility rate in Wilmette is 61.0 births per 1,000 women. Women in the age bracket of 20 to 34 years have the highest fertility rate with 176.0 births per 1,000 women. Women in the age bracket of 20 to 34 years acount for 51.6% of all women with births.
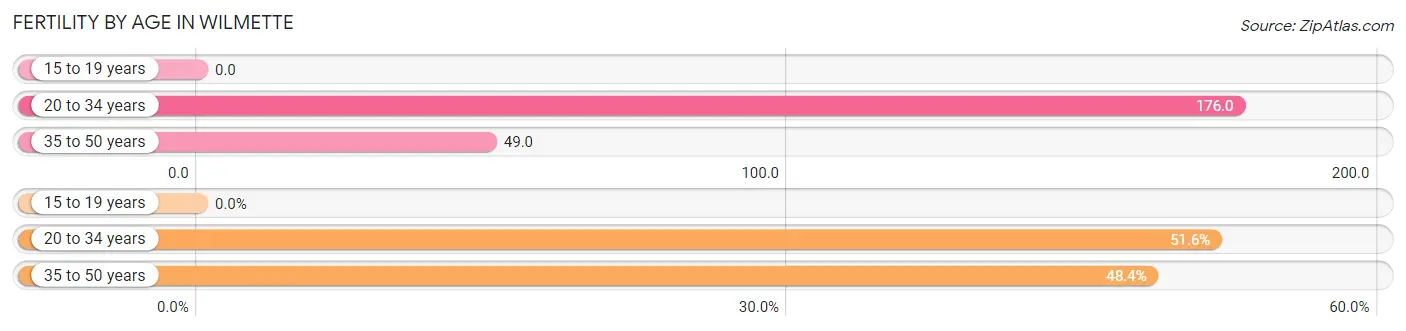
| Age Bracket | Women with Births | Births / 1,000 Women |
| 15 to 19 years | 0 (0.0%) | 0.0 |
| 20 to 34 years | 159 (51.6%) | 176.0 |
| 35 to 50 years | 149 (48.4%) | 49.0 |
| Total | 308 (100.0%) | 61.0 |
Fertility by Age by Marriage Status in Wilmette
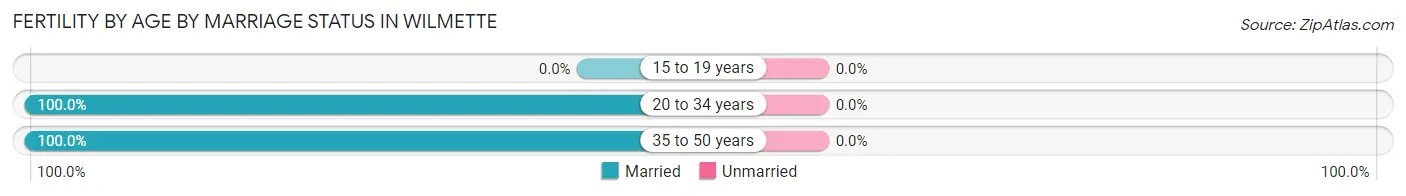
| Age Bracket | Married | Unmarried |
| 15 to 19 years | 0 (0.0%) | 0 (0.0%) |
| 20 to 34 years | 159 (100.0%) | 0 (0.0%) |
| 35 to 50 years | 149 (100.0%) | 0 (0.0%) |
| Total | 308 (100.0%) | 0 (0.0%) |
Fertility by Education in Wilmette
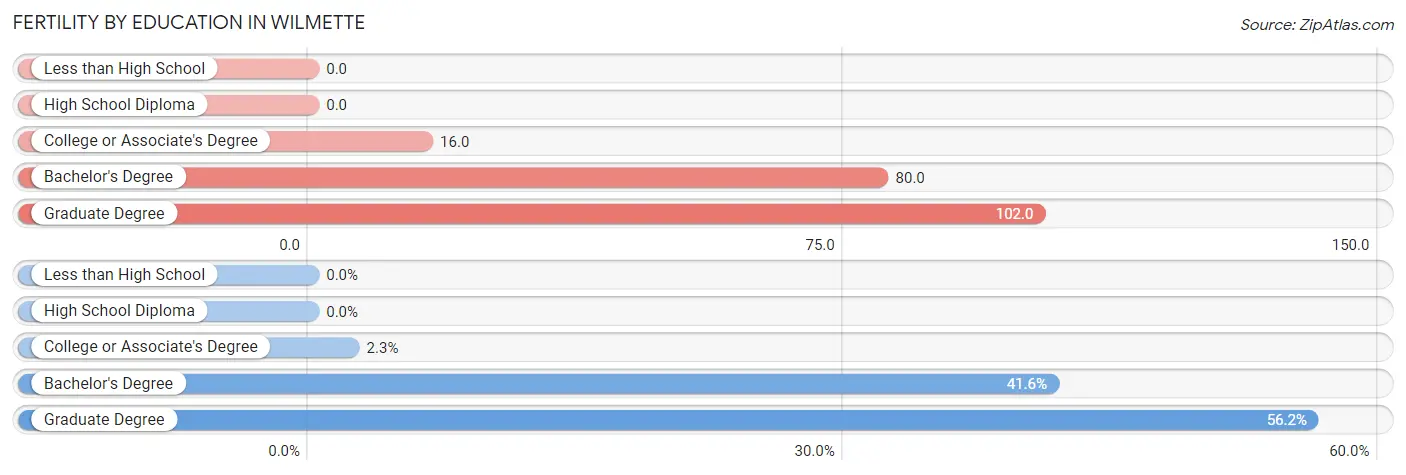
| Educational Attainment | Women with Births | Births / 1,000 Women |
| Less than High School | 0 (0.0%) | 0.0 |
| High School Diploma | 0 (0.0%) | 0.0 |
| College or Associate's Degree | 7 (2.3%) | 16.0 |
| Bachelor's Degree | 128 (41.6%) | 80.0 |
| Graduate Degree | 173 (56.2%) | 102.0 |
| Total | 308 (100.0%) | 61.0 |
Fertility by Education by Marriage Status in Wilmette
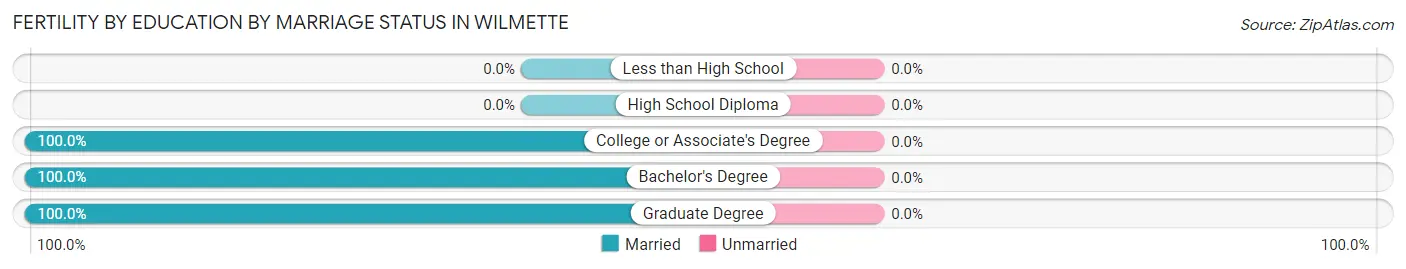
| Educational Attainment | Married | Unmarried |
| Less than High School | 0 (0.0%) | 0 (0.0%) |
| High School Diploma | 0 (0.0%) | 0 (0.0%) |
| College or Associate's Degree | 7 (100.0%) | 0 (0.0%) |
| Bachelor's Degree | 128 (100.0%) | 0 (0.0%) |
| Graduate Degree | 173 (100.0%) | 0 (0.0%) |
| Total | 308 (100.0%) | 0 (0.0%) |
Employment Characteristics in Wilmette
Employment by Class of Employer in Wilmette
Among the 11,970 employed individuals in Wilmette, private company employees (7,331 | 61.2%), not-for-profit organizations (1,386 | 11.6%), and self-employed (incorporated) (1,234 | 10.3%) make up the most common classes of employment.
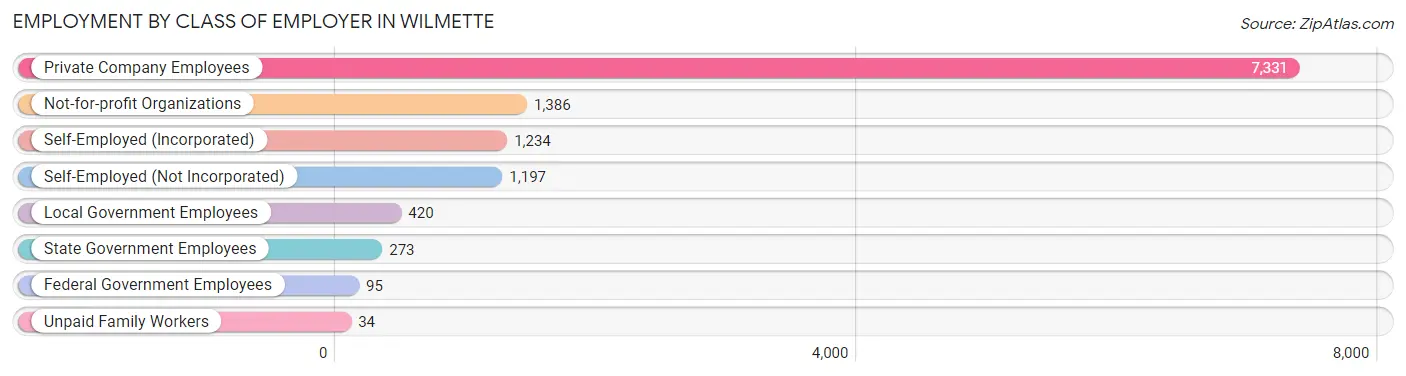
| Employer Class | # Employees | % Employees |
| Private Company Employees | 7,331 | 61.2% |
| Self-Employed (Incorporated) | 1,234 | 10.3% |
| Self-Employed (Not Incorporated) | 1,197 | 10.0% |
| Not-for-profit Organizations | 1,386 | 11.6% |
| Local Government Employees | 420 | 3.5% |
| State Government Employees | 273 | 2.3% |
| Federal Government Employees | 95 | 0.8% |
| Unpaid Family Workers | 34 | 0.3% |
| Total | 11,970 | 100.0% |
Employment Status by Age in Wilmette
According to the labor force statistics for Wilmette, out of the total population over 16 years of age (20,908), 60.9% or 12,733 individuals are in the labor force, with 4.3% or 548 of them unemployed. The age group with the highest labor force participation rate is 25 to 29 years, with 87.5% or 295 individuals in the labor force. Within the labor force, the 20 to 24 years age range has the highest percentage of unemployed individuals, with 19.1% or 75 of them being unemployed.
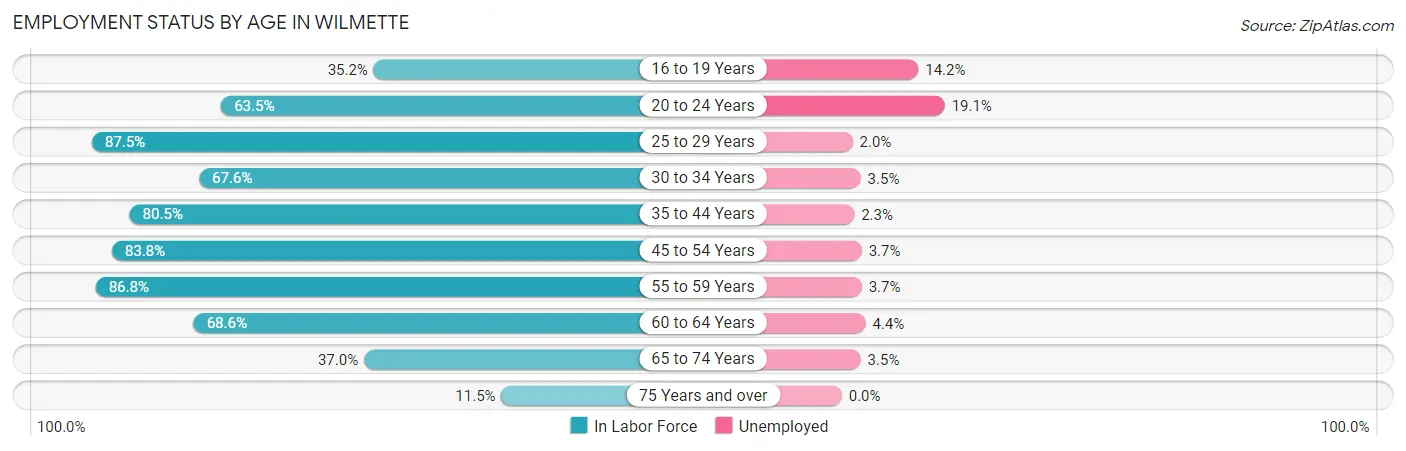
| Age Bracket | In Labor Force | Unemployed |
| 16 to 19 Years | 613 (35.2%) | 87 (14.2%) |
| 20 to 24 Years | 392 (63.5%) | 75 (19.1%) |
| 25 to 29 Years | 295 (87.5%) | 6 (2.0%) |
| 30 to 34 Years | 579 (67.6%) | 20 (3.5%) |
| 35 to 44 Years | 2,531 (80.5%) | 58 (2.3%) |
| 45 to 54 Years | 3,924 (83.8%) | 145 (3.7%) |
| 55 to 59 Years | 1,766 (86.8%) | 65 (3.7%) |
| 60 to 64 Years | 1,212 (68.6%) | 53 (4.4%) |
| 65 to 74 Years | 1,100 (37.0%) | 38 (3.5%) |
| 75 Years and over | 317 (11.5%) | 0 (0.0%) |
| Total | 12,733 (60.9%) | 548 (4.3%) |
Employment Status by Educational Attainment in Wilmette
According to labor force statistics for Wilmette, 80.4% of individuals (10,309) out of the total population between 25 and 64 years of age (12,822) are in the labor force, with 3.4% or 351 of them being unemployed. The group with the highest labor force participation rate are those with the educational attainment of bachelor's degree or higher, with 82.1% or 9,276 individuals in the labor force. Within the labor force, individuals with college / associate degree education have the highest percentage of unemployment, with 4.3% or 29 of them being unemployed.
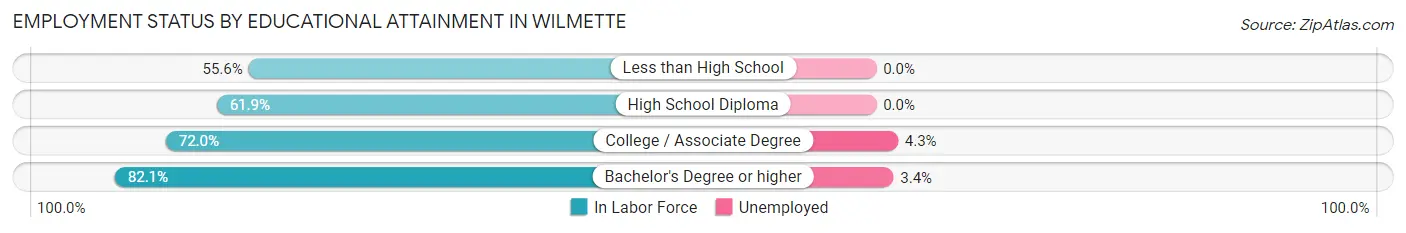
| Educational Attainment | In Labor Force | Unemployed |
| Less than High School | 70 (55.6%) | 0 (0.0%) |
| High School Diploma | 287 (61.9%) | 0 (0.0%) |
| College / Associate Degree | 672 (72.0%) | 40 (4.3%) |
| Bachelor's Degree or higher | 9,276 (82.1%) | 384 (3.4%) |
| Total | 10,309 (80.4%) | 436 (3.4%) |
Employment Occupations by Sex in Wilmette
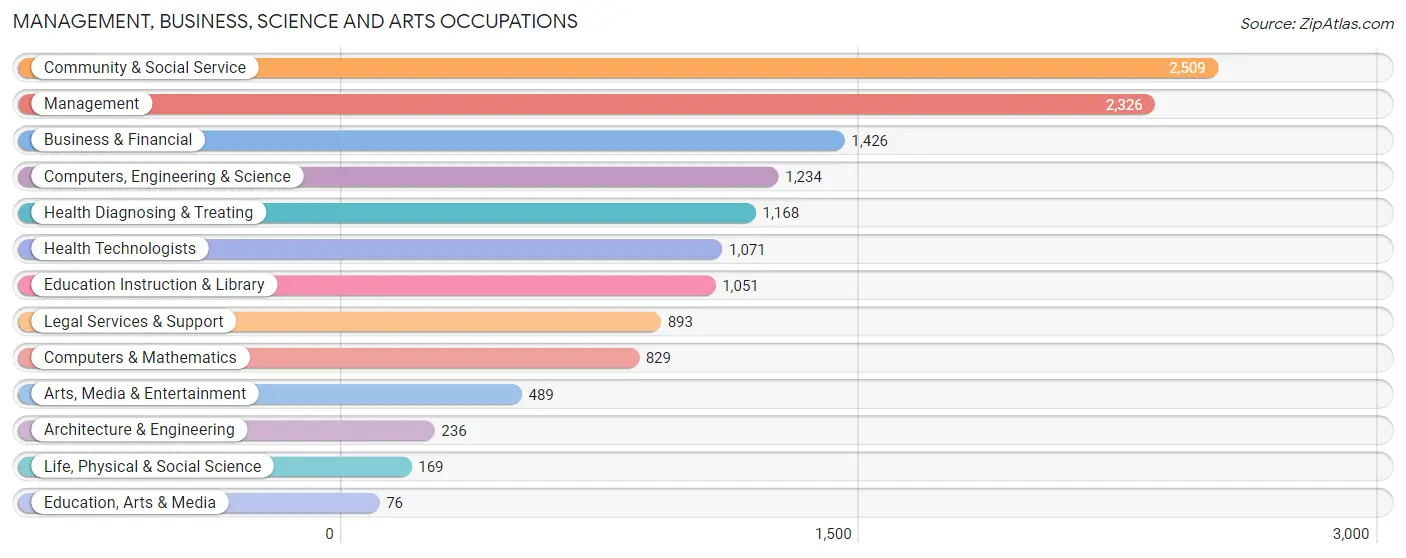
Management, Business, Science and Arts Occupations
The most common Management, Business, Science and Arts occupations in Wilmette are Community & Social Service (2,509 | 20.6%), Management (2,326 | 19.1%), Business & Financial (1,426 | 11.7%), Computers, Engineering & Science (1,234 | 10.1%), and Health Diagnosing & Treating (1,168 | 9.6%).
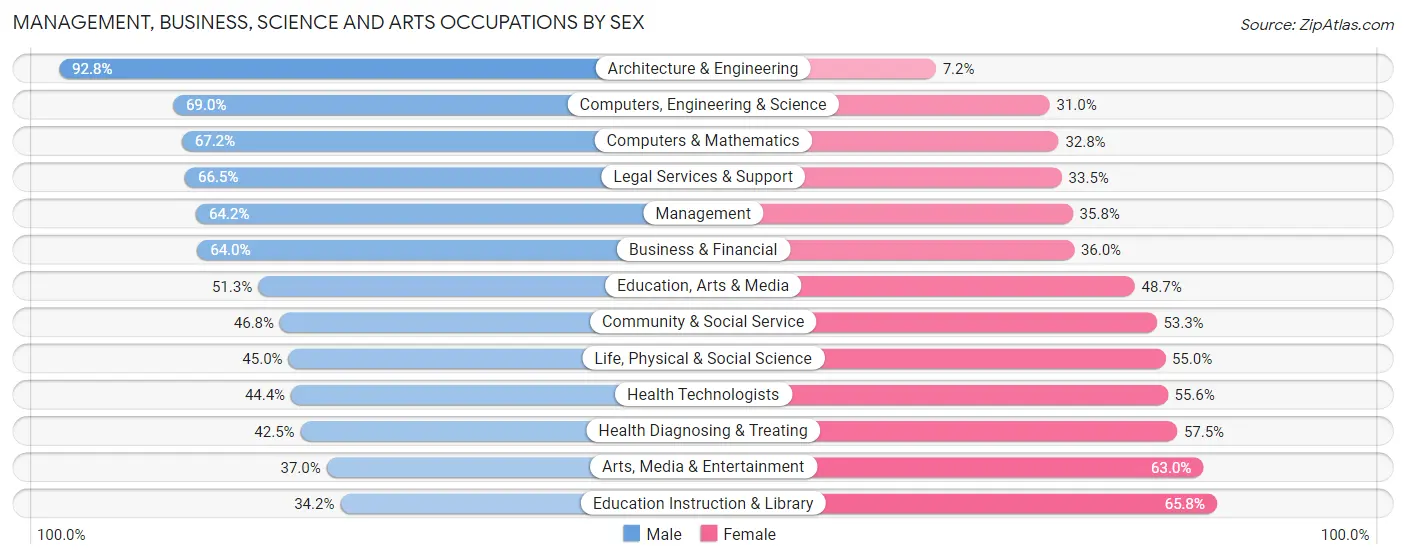
Management, Business, Science and Arts Occupations by Sex
Within the Management, Business, Science and Arts occupations in Wilmette, the most male-oriented occupations are Architecture & Engineering (92.8%), Computers, Engineering & Science (69.0%), and Computers & Mathematics (67.2%), while the most female-oriented occupations are Education Instruction & Library (65.8%), Arts, Media & Entertainment (63.0%), and Health Diagnosing & Treating (57.5%).
| Occupation | Male | Female |
| Management | 1,494 (64.2%) | 832 (35.8%) |
| Business & Financial | 912 (64.0%) | 514 (36.0%) |
| Computers, Engineering & Science | 852 (69.0%) | 382 (31.0%) |
| Computers & Mathematics | 557 (67.2%) | 272 (32.8%) |
| Architecture & Engineering | 219 (92.8%) | 17 (7.2%) |
| Life, Physical & Social Science | 76 (45.0%) | 93 (55.0%) |
| Community & Social Service | 1,173 (46.8%) | 1,336 (53.2%) |
| Education, Arts & Media | 39 (51.3%) | 37 (48.7%) |
| Legal Services & Support | 594 (66.5%) | 299 (33.5%) |
| Education Instruction & Library | 359 (34.2%) | 692 (65.8%) |
| Arts, Media & Entertainment | 181 (37.0%) | 308 (63.0%) |
| Health Diagnosing & Treating | 496 (42.5%) | 672 (57.5%) |
| Health Technologists | 476 (44.4%) | 595 (55.6%) |
| Total (Category) | 4,927 (56.9%) | 3,736 (43.1%) |
| Total (Overall) | 6,678 (54.8%) | 5,506 (45.2%) |
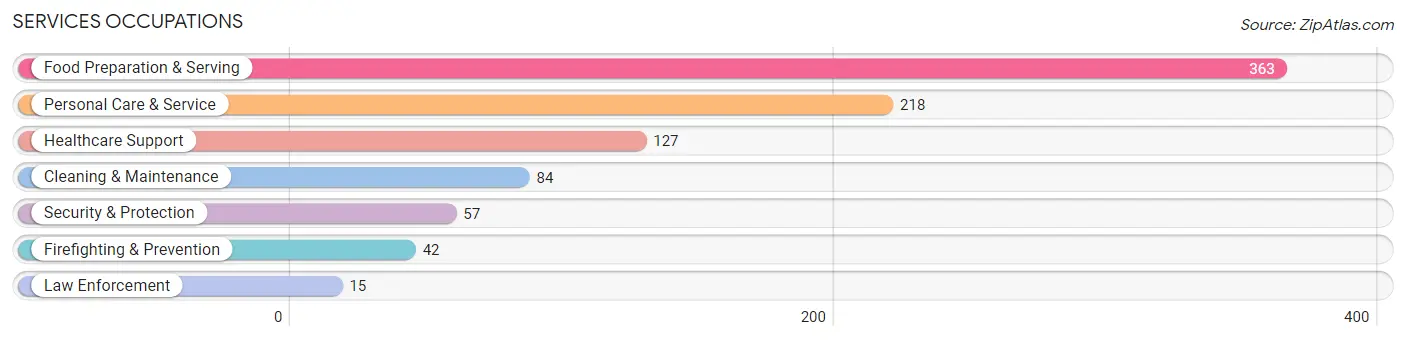
Services Occupations
The most common Services occupations in Wilmette are Food Preparation & Serving (363 | 3.0%), Personal Care & Service (218 | 1.8%), Healthcare Support (127 | 1.0%), Cleaning & Maintenance (84 | 0.7%), and Security & Protection (57 | 0.5%).
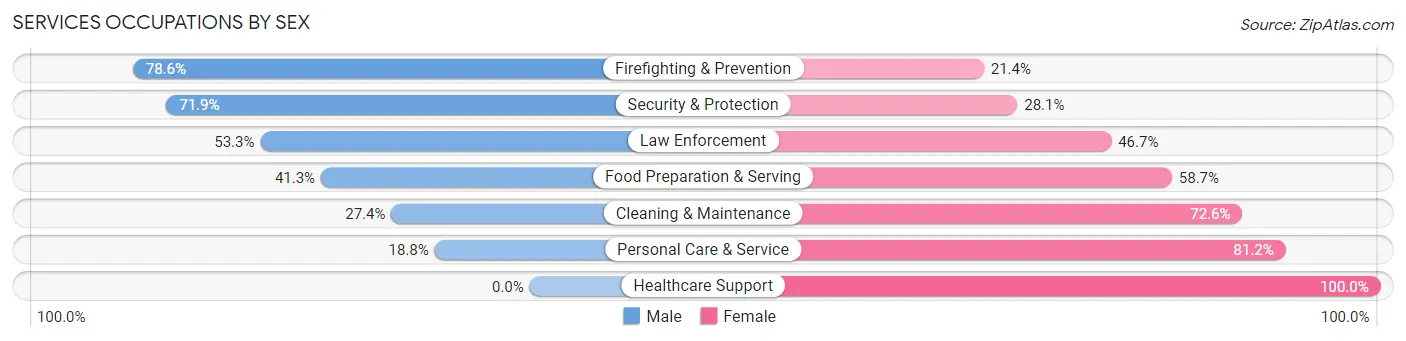
Services Occupations by Sex
Within the Services occupations in Wilmette, the most male-oriented occupations are Firefighting & Prevention (78.6%), Security & Protection (71.9%), and Law Enforcement (53.3%), while the most female-oriented occupations are Healthcare Support (100.0%), Personal Care & Service (81.2%), and Cleaning & Maintenance (72.6%).
| Occupation | Male | Female |
| Healthcare Support | 0 (0.0%) | 127 (100.0%) |
| Security & Protection | 41 (71.9%) | 16 (28.1%) |
| Firefighting & Prevention | 33 (78.6%) | 9 (21.4%) |
| Law Enforcement | 8 (53.3%) | 7 (46.7%) |
| Food Preparation & Serving | 150 (41.3%) | 213 (58.7%) |
| Cleaning & Maintenance | 23 (27.4%) | 61 (72.6%) |
| Personal Care & Service | 41 (18.8%) | 177 (81.2%) |
| Total (Category) | 255 (30.0%) | 594 (70.0%) |
| Total (Overall) | 6,678 (54.8%) | 5,506 (45.2%) |
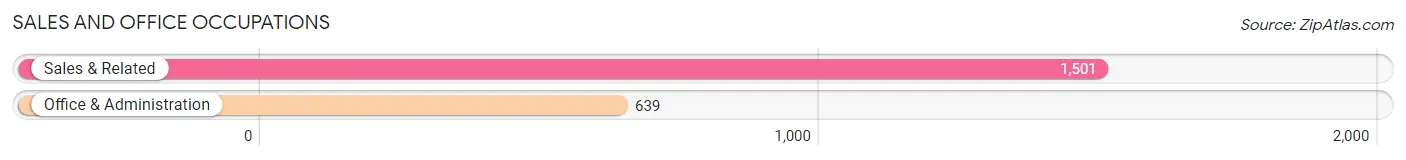
Sales and Office Occupations
The most common Sales and Office occupations in Wilmette are Sales & Related (1,501 | 12.3%), and Office & Administration (639 | 5.2%).
Sales and Office Occupations by Sex
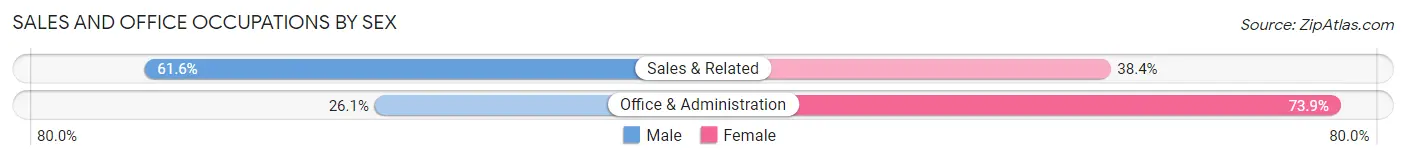
| Occupation | Male | Female |
| Sales & Related | 924 (61.6%) | 577 (38.4%) |
| Office & Administration | 167 (26.1%) | 472 (73.9%) |
| Total (Category) | 1,091 (51.0%) | 1,049 (49.0%) |
| Total (Overall) | 6,678 (54.8%) | 5,506 (45.2%) |
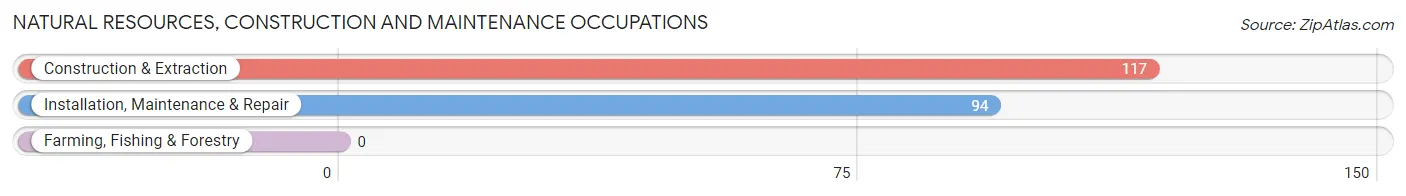
Natural Resources, Construction and Maintenance Occupations
The most common Natural Resources, Construction and Maintenance occupations in Wilmette are Construction & Extraction (117 | 1.0%), and Installation, Maintenance & Repair (94 | 0.8%).
Natural Resources, Construction and Maintenance Occupations by Sex
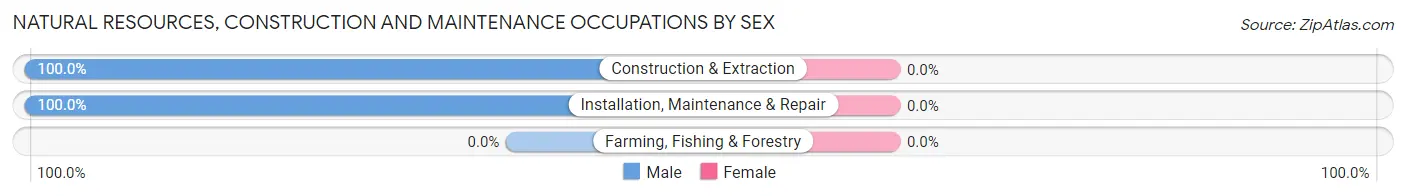
| Occupation | Male | Female |
| Farming, Fishing & Forestry | 0 (0.0%) | 0 (0.0%) |
| Construction & Extraction | 117 (100.0%) | 0 (0.0%) |
| Installation, Maintenance & Repair | 94 (100.0%) | 0 (0.0%) |
| Total (Category) | 211 (100.0%) | 0 (0.0%) |
| Total (Overall) | 6,678 (54.8%) | 5,506 (45.2%) |
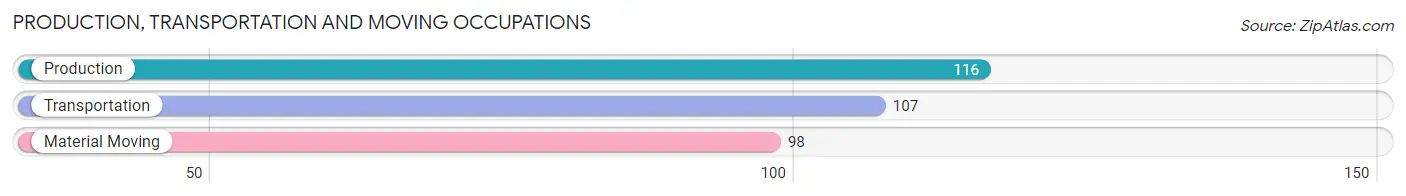
Production, Transportation and Moving Occupations
The most common Production, Transportation and Moving occupations in Wilmette are Production (116 | 0.9%), Transportation (107 | 0.9%), and Material Moving (98 | 0.8%).
Production, Transportation and Moving Occupations by Sex
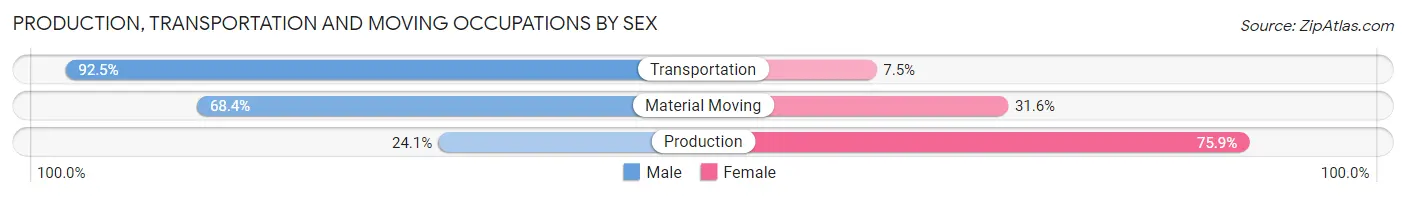
| Occupation | Male | Female |
| Production | 28 (24.1%) | 88 (75.9%) |
| Transportation | 99 (92.5%) | 8 (7.5%) |
| Material Moving | 67 (68.4%) | 31 (31.6%) |
| Total (Category) | 194 (60.4%) | 127 (39.6%) |
| Total (Overall) | 6,678 (54.8%) | 5,506 (45.2%) |
Employment Industries by Sex in Wilmette
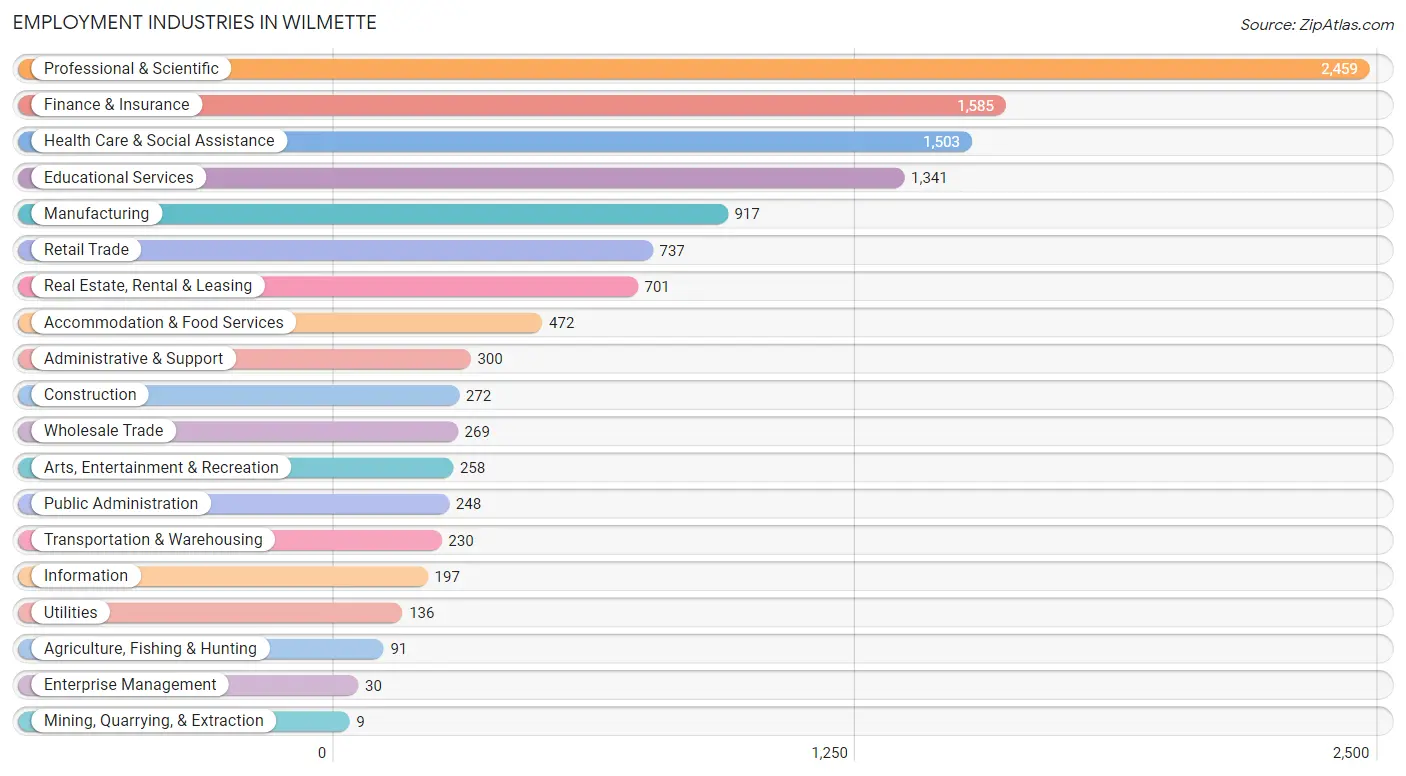
Employment Industries in Wilmette
The major employment industries in Wilmette include Professional & Scientific (2,459 | 20.2%), Finance & Insurance (1,585 | 13.0%), Health Care & Social Assistance (1,503 | 12.3%), Educational Services (1,341 | 11.0%), and Manufacturing (917 | 7.5%).
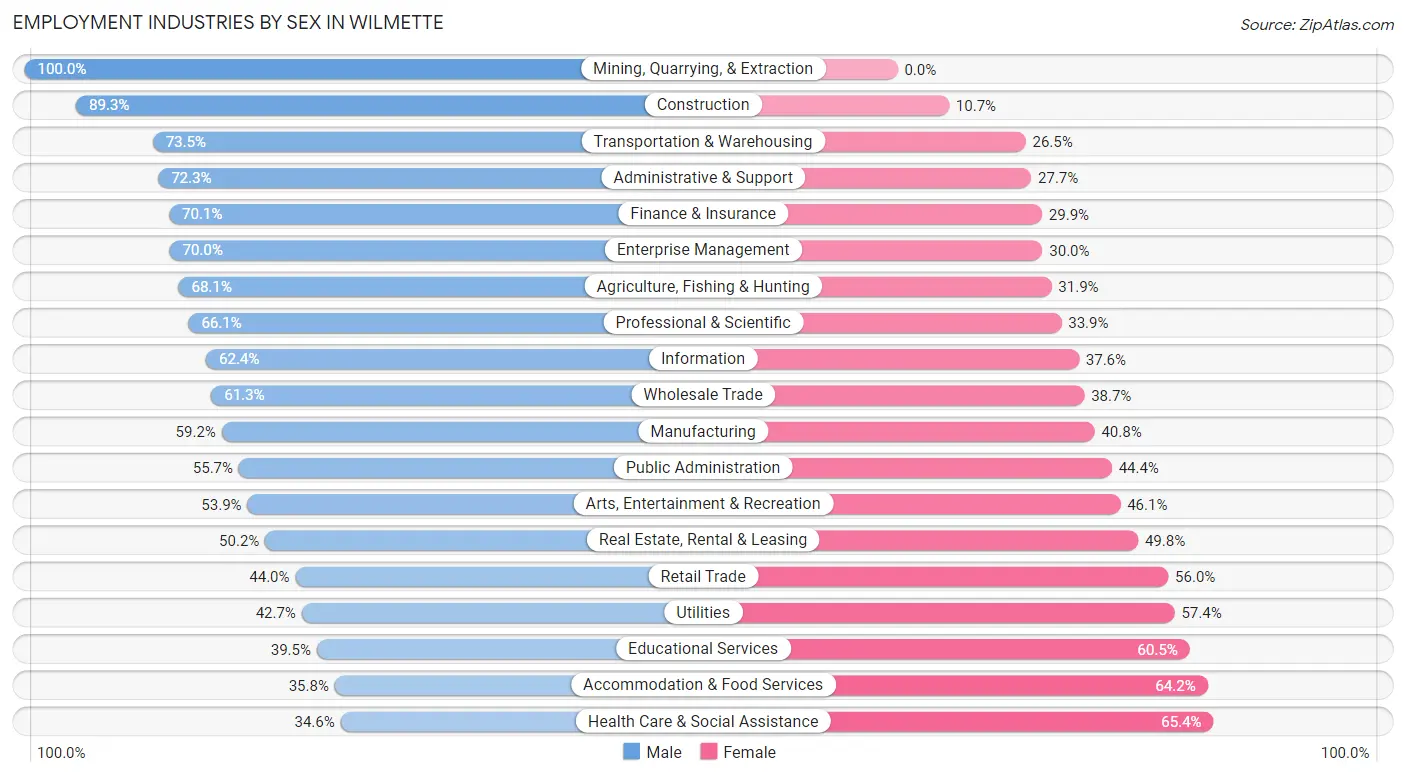
Employment Industries by Sex in Wilmette
The Wilmette industries that see more men than women are Mining, Quarrying, & Extraction (100.0%), Construction (89.3%), and Transportation & Warehousing (73.5%), whereas the industries that tend to have a higher number of women are Health Care & Social Assistance (65.4%), Accommodation & Food Services (64.2%), and Educational Services (60.5%).
| Industry | Male | Female |
| Agriculture, Fishing & Hunting | 62 (68.1%) | 29 (31.9%) |
| Mining, Quarrying, & Extraction | 9 (100.0%) | 0 (0.0%) |
| Construction | 243 (89.3%) | 29 (10.7%) |
| Manufacturing | 543 (59.2%) | 374 (40.8%) |
| Wholesale Trade | 165 (61.3%) | 104 (38.7%) |
| Retail Trade | 324 (44.0%) | 413 (56.0%) |
| Transportation & Warehousing | 169 (73.5%) | 61 (26.5%) |
| Utilities | 58 (42.6%) | 78 (57.4%) |
| Information | 123 (62.4%) | 74 (37.6%) |
| Finance & Insurance | 1,111 (70.1%) | 474 (29.9%) |
| Real Estate, Rental & Leasing | 352 (50.2%) | 349 (49.8%) |
| Professional & Scientific | 1,625 (66.1%) | 834 (33.9%) |
| Enterprise Management | 21 (70.0%) | 9 (30.0%) |
| Administrative & Support | 217 (72.3%) | 83 (27.7%) |
| Educational Services | 530 (39.5%) | 811 (60.5%) |
| Health Care & Social Assistance | 520 (34.6%) | 983 (65.4%) |
| Arts, Entertainment & Recreation | 139 (53.9%) | 119 (46.1%) |
| Accommodation & Food Services | 169 (35.8%) | 303 (64.2%) |
| Public Administration | 138 (55.6%) | 110 (44.4%) |
| Total | 6,678 (54.8%) | 5,506 (45.2%) |
Education in Wilmette
School Enrollment in Wilmette
The most common levels of schooling among the 8,153 students in Wilmette are high school (2,280 | 28.0%), middle school (2,067 | 25.4%), and elementary school (1,773 | 21.7%).
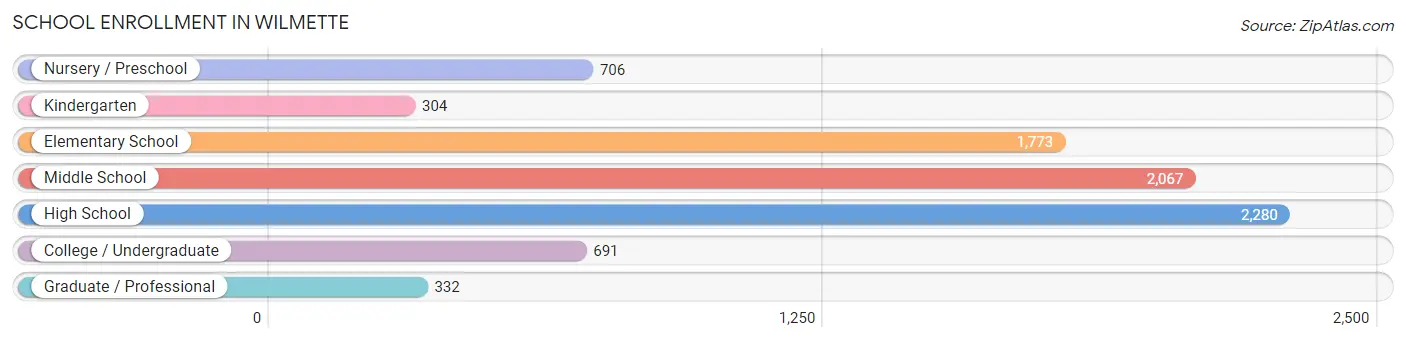
| School Level | # Students | % Students |
| Nursery / Preschool | 706 | 8.7% |
| Kindergarten | 304 | 3.7% |
| Elementary School | 1,773 | 21.7% |
| Middle School | 2,067 | 25.4% |
| High School | 2,280 | 28.0% |
| College / Undergraduate | 691 | 8.5% |
| Graduate / Professional | 332 | 4.1% |
| Total | 8,153 | 100.0% |
School Enrollment by Age by Funding Source in Wilmette
Out of a total of 8,153 students who are enrolled in schools in Wilmette, 1,981 (24.3%) attend a private institution, while the remaining 6,172 (75.7%) are enrolled in public schools. The age group of 3 to 4 year olds has the highest likelihood of being enrolled in private schools, with 538 (85.3% in the age bracket) enrolled. Conversely, the age group of 15 to 17 year olds has the lowest likelihood of being enrolled in a private school, with 1,618 (89.0% in the age bracket) attending a public institution.
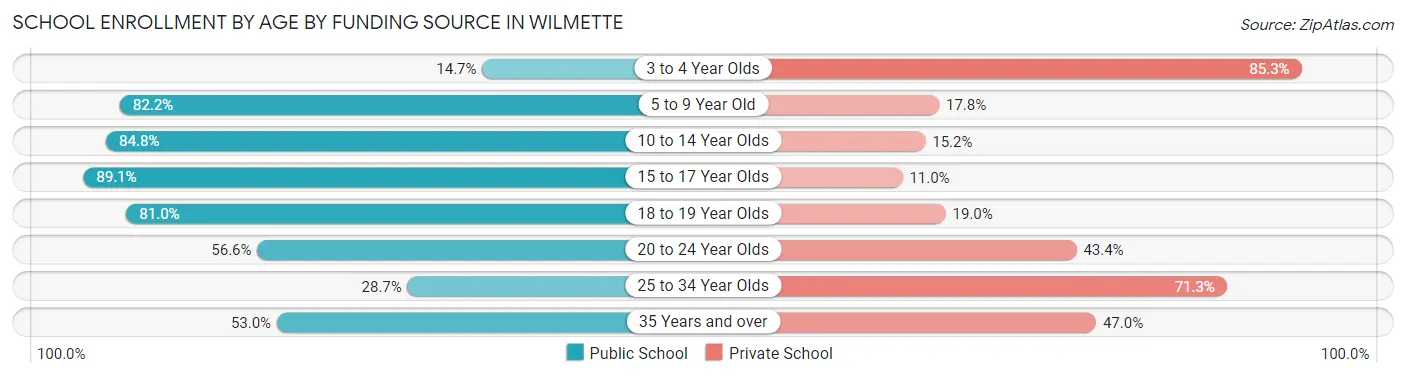
| Age Bracket | Public School | Private School |
| 3 to 4 Year Olds | 93 (14.7%) | 538 (85.3%) |
| 5 to 9 Year Old | 1,588 (82.2%) | 343 (17.8%) |
| 10 to 14 Year Olds | 2,058 (84.8%) | 369 (15.2%) |
| 15 to 17 Year Olds | 1,618 (89.0%) | 199 (11.0%) |
| 18 to 19 Year Olds | 363 (81.0%) | 85 (19.0%) |
| 20 to 24 Year Olds | 256 (56.6%) | 196 (43.4%) |
| 25 to 34 Year Olds | 47 (28.7%) | 117 (71.3%) |
| 35 Years and over | 150 (53.0%) | 133 (47.0%) |
| Total | 6,172 (75.7%) | 1,981 (24.3%) |
Educational Attainment by Field of Study in Wilmette
Business (3,134 | 18.7%), social sciences (2,430 | 14.5%), literature & languages (1,503 | 8.9%), liberal arts & history (1,235 | 7.3%), and visual & performing arts (1,221 | 7.3%) are the most common fields of study among 16,799 individuals in Wilmette who have obtained a bachelor's degree or higher.
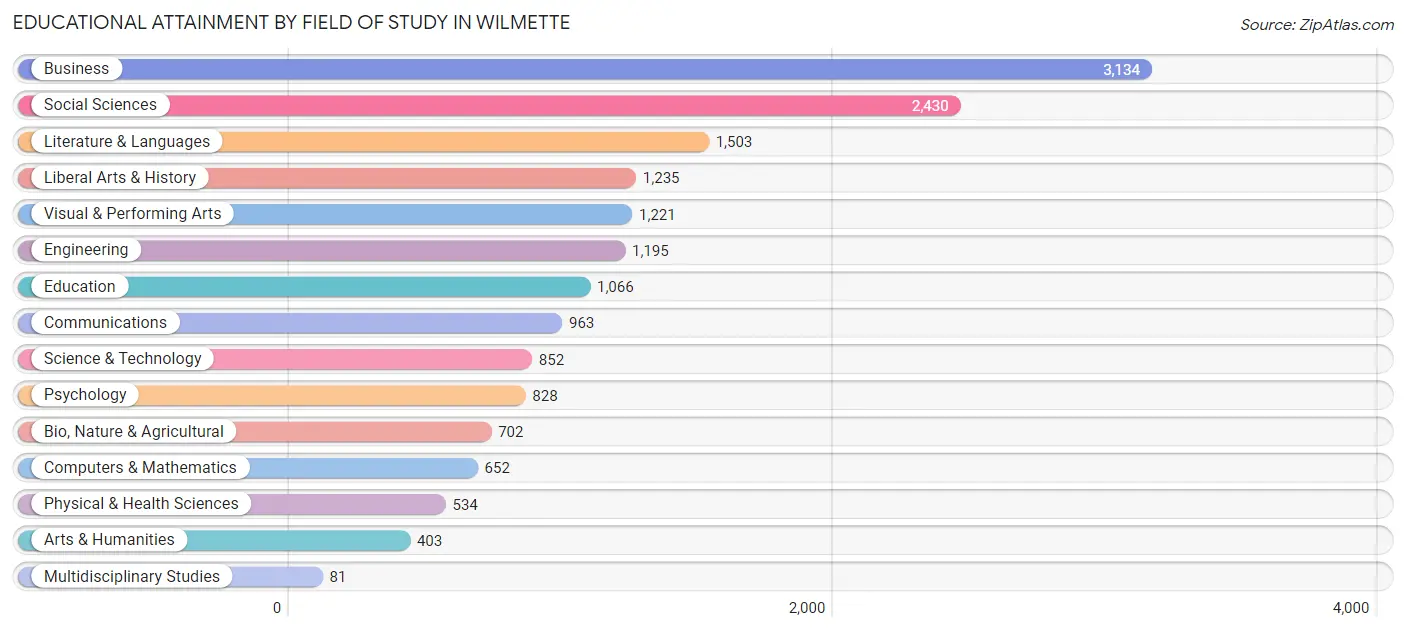
| Field of Study | # Graduates | % Graduates |
| Computers & Mathematics | 652 | 3.9% |
| Bio, Nature & Agricultural | 702 | 4.2% |
| Physical & Health Sciences | 534 | 3.2% |
| Psychology | 828 | 4.9% |
| Social Sciences | 2,430 | 14.5% |
| Engineering | 1,195 | 7.1% |
| Multidisciplinary Studies | 81 | 0.5% |
| Science & Technology | 852 | 5.1% |
| Business | 3,134 | 18.7% |
| Education | 1,066 | 6.4% |
| Literature & Languages | 1,503 | 8.9% |
| Liberal Arts & History | 1,235 | 7.3% |
| Visual & Performing Arts | 1,221 | 7.3% |
| Communications | 963 | 5.7% |
| Arts & Humanities | 403 | 2.4% |
| Total | 16,799 | 100.0% |
Transportation & Commute in Wilmette
Vehicle Availability by Sex in Wilmette
The most prevalent vehicle ownership categories in Wilmette are males with 2 vehicles (3,784, accounting for 57.6%) and females with 2 vehicles (2,855, making up 70.2%).
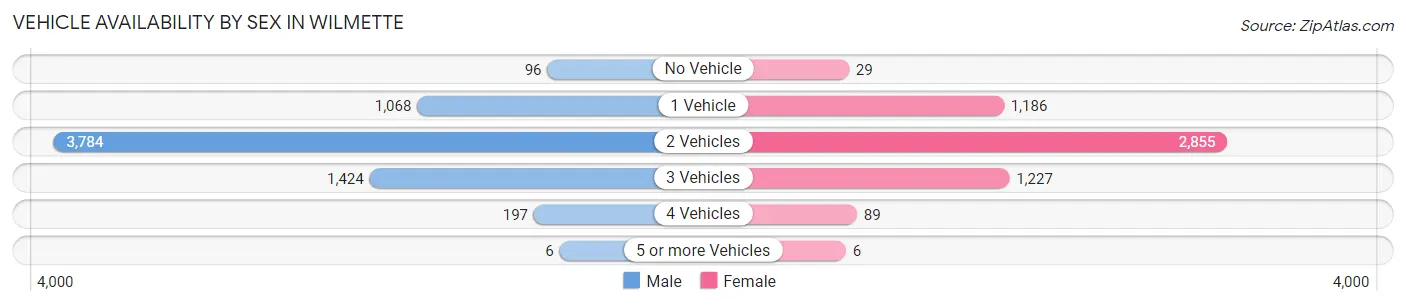
| Vehicles Available | Male | Female |
| No Vehicle | 96 (1.5%) | 29 (0.5%) |
| 1 Vehicle | 1,068 (16.2%) | 1,186 (22.0%) |
| 2 Vehicles | 3,784 (57.6%) | 2,855 (52.9%) |
| 3 Vehicles | 1,424 (21.7%) | 1,227 (22.8%) |
| 4 Vehicles | 197 (3.0%) | 89 (1.7%) |
| 5 or more Vehicles | 6 (0.1%) | 6 (0.1%) |
| Total | 6,575 (100.0%) | 5,392 (100.0%) |
Commute Time in Wilmette
The most frequently occuring commute durations in Wilmette are 45 to 59 minutes (1,317 commuters, 15.6%), 60 to 89 minutes (1,278 commuters, 15.1%), and 30 to 34 minutes (1,062 commuters, 12.6%).
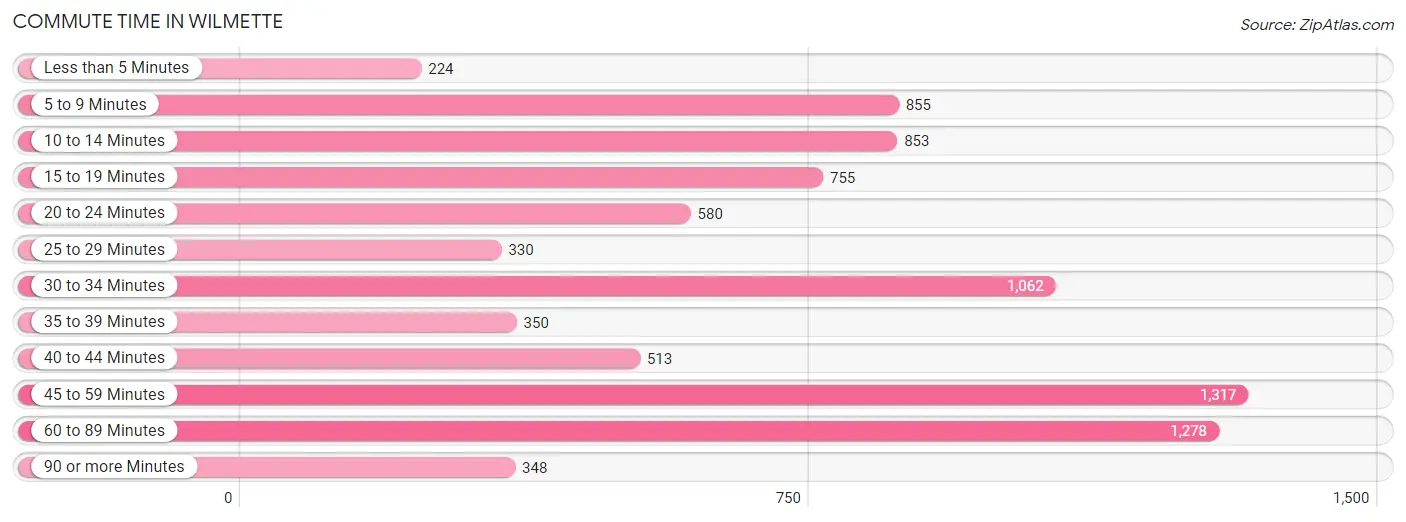
| Commute Time | # Commuters | % Commuters |
| Less than 5 Minutes | 224 | 2.6% |
| 5 to 9 Minutes | 855 | 10.1% |
| 10 to 14 Minutes | 853 | 10.1% |
| 15 to 19 Minutes | 755 | 8.9% |
| 20 to 24 Minutes | 580 | 6.9% |
| 25 to 29 Minutes | 330 | 3.9% |
| 30 to 34 Minutes | 1,062 | 12.6% |
| 35 to 39 Minutes | 350 | 4.1% |
| 40 to 44 Minutes | 513 | 6.1% |
| 45 to 59 Minutes | 1,317 | 15.6% |
| 60 to 89 Minutes | 1,278 | 15.1% |
| 90 or more Minutes | 348 | 4.1% |
Commute Time by Sex in Wilmette
The most common commute times in Wilmette are 45 to 59 minutes (926 commuters, 19.1%) for males and 10 to 14 minutes (523 commuters, 14.5%) for females.
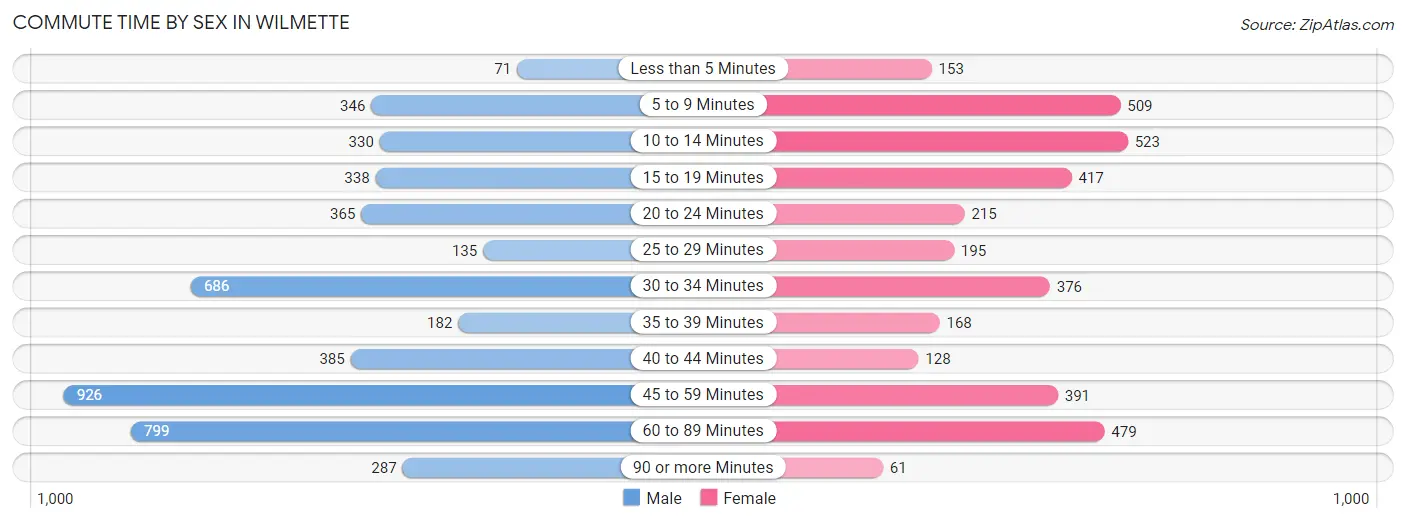
| Commute Time | Male | Female |
| Less than 5 Minutes | 71 (1.5%) | 153 (4.2%) |
| 5 to 9 Minutes | 346 (7.1%) | 509 (14.1%) |
| 10 to 14 Minutes | 330 (6.8%) | 523 (14.5%) |
| 15 to 19 Minutes | 338 (7.0%) | 417 (11.5%) |
| 20 to 24 Minutes | 365 (7.5%) | 215 (5.9%) |
| 25 to 29 Minutes | 135 (2.8%) | 195 (5.4%) |
| 30 to 34 Minutes | 686 (14.1%) | 376 (10.4%) |
| 35 to 39 Minutes | 182 (3.7%) | 168 (4.6%) |
| 40 to 44 Minutes | 385 (7.9%) | 128 (3.5%) |
| 45 to 59 Minutes | 926 (19.1%) | 391 (10.8%) |
| 60 to 89 Minutes | 799 (16.5%) | 479 (13.3%) |
| 90 or more Minutes | 287 (5.9%) | 61 (1.7%) |
Time of Departure to Work by Sex in Wilmette
The most frequent times of departure to work in Wilmette are 7:00 AM to 7:29 AM (954, 19.7%) for males and 8:00 AM to 8:29 AM (658, 18.2%) for females.
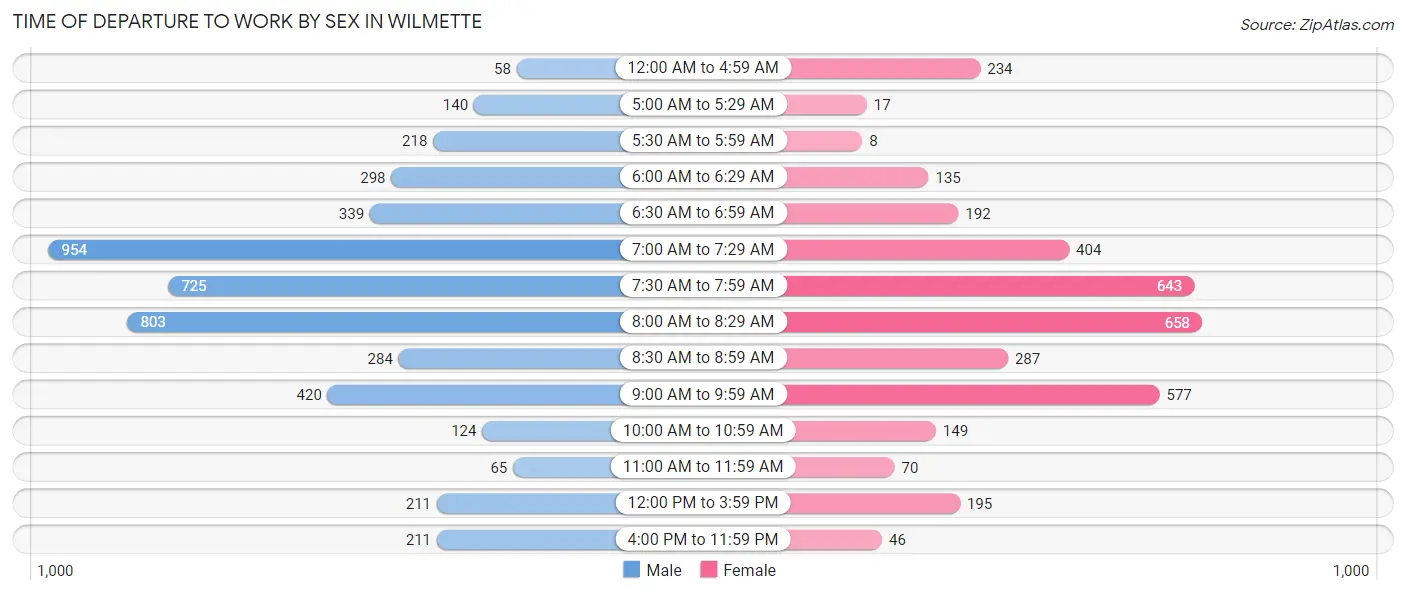
| Time of Departure | Male | Female |
| 12:00 AM to 4:59 AM | 58 (1.2%) | 234 (6.5%) |
| 5:00 AM to 5:29 AM | 140 (2.9%) | 17 (0.5%) |
| 5:30 AM to 5:59 AM | 218 (4.5%) | 8 (0.2%) |
| 6:00 AM to 6:29 AM | 298 (6.1%) | 135 (3.7%) |
| 6:30 AM to 6:59 AM | 339 (7.0%) | 192 (5.3%) |
| 7:00 AM to 7:29 AM | 954 (19.7%) | 404 (11.2%) |
| 7:30 AM to 7:59 AM | 725 (14.9%) | 643 (17.8%) |
| 8:00 AM to 8:29 AM | 803 (16.6%) | 658 (18.2%) |
| 8:30 AM to 8:59 AM | 284 (5.9%) | 287 (7.9%) |
| 9:00 AM to 9:59 AM | 420 (8.7%) | 577 (16.0%) |
| 10:00 AM to 10:59 AM | 124 (2.6%) | 149 (4.1%) |
| 11:00 AM to 11:59 AM | 65 (1.3%) | 70 (1.9%) |
| 12:00 PM to 3:59 PM | 211 (4.3%) | 195 (5.4%) |
| 4:00 PM to 11:59 PM | 211 (4.3%) | 46 (1.3%) |
| Total | 4,850 (100.0%) | 3,615 (100.0%) |
Housing Occupancy in Wilmette
Occupancy by Ownership in Wilmette
Of the total 10,398 dwellings in Wilmette, owner-occupied units account for 9,076 (87.3%), while renter-occupied units make up 1,322 (12.7%).
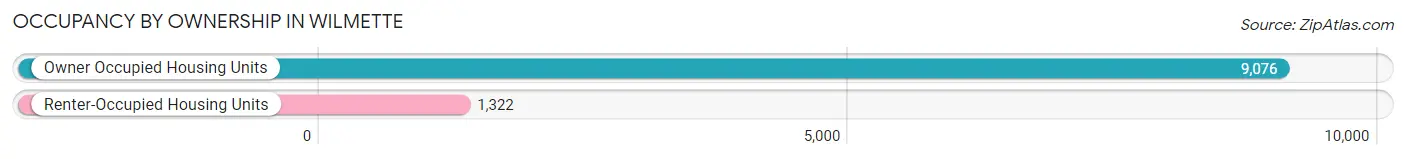
| Occupancy | # Housing Units | % Housing Units |
| Owner Occupied Housing Units | 9,076 | 87.3% |
| Renter-Occupied Housing Units | 1,322 | 12.7% |
| Total Occupied Housing Units | 10,398 | 100.0% |
Occupancy by Household Size in Wilmette
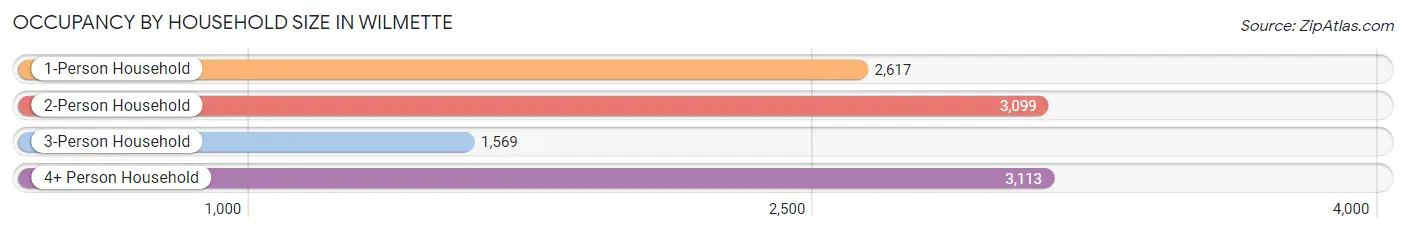
| Household Size | # Housing Units | % Housing Units |
| 1-Person Household | 2,617 | 25.2% |
| 2-Person Household | 3,099 | 29.8% |
| 3-Person Household | 1,569 | 15.1% |
| 4+ Person Household | 3,113 | 29.9% |
| Total Housing Units | 10,398 | 100.0% |
Occupancy by Ownership by Household Size in Wilmette
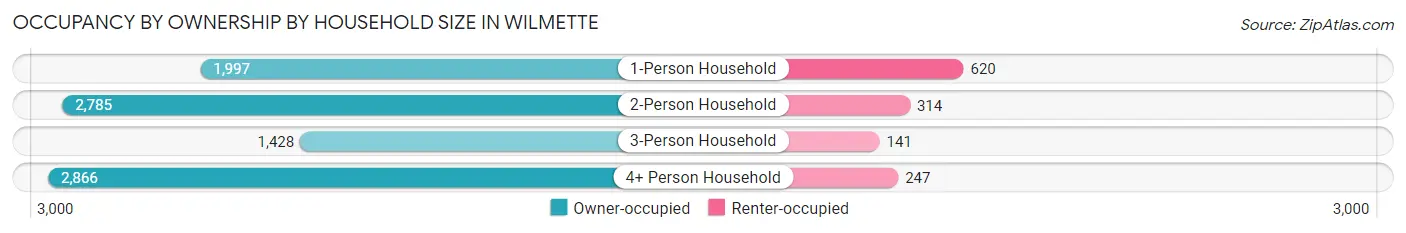
| Household Size | Owner-occupied | Renter-occupied |
| 1-Person Household | 1,997 (76.3%) | 620 (23.7%) |
| 2-Person Household | 2,785 (89.9%) | 314 (10.1%) |
| 3-Person Household | 1,428 (91.0%) | 141 (9.0%) |
| 4+ Person Household | 2,866 (92.1%) | 247 (7.9%) |
| Total Housing Units | 9,076 (87.3%) | 1,322 (12.7%) |
Occupancy by Educational Attainment in Wilmette
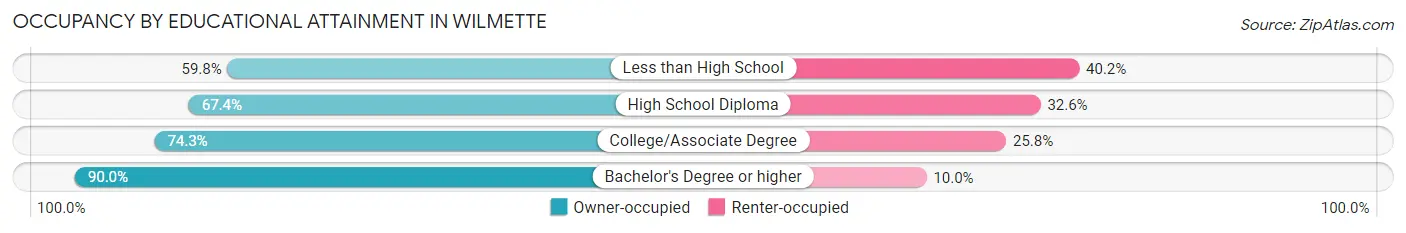
| Household Size | Owner-occupied | Renter-occupied |
| Less than High School | 101 (59.8%) | 68 (40.2%) |
| High School Diploma | 325 (67.4%) | 157 (32.6%) |
| College/Associate Degree | 591 (74.3%) | 205 (25.8%) |
| Bachelor's Degree or higher | 8,059 (90.0%) | 892 (10.0%) |
Occupancy by Age of Householder in Wilmette
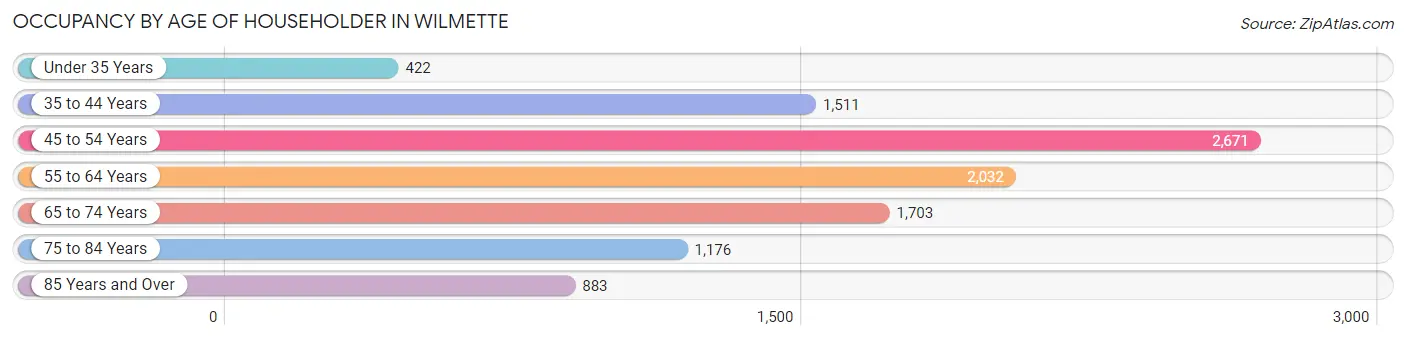
| Age Bracket | # Households | % Households |
| Under 35 Years | 422 | 4.1% |
| 35 to 44 Years | 1,511 | 14.5% |
| 45 to 54 Years | 2,671 | 25.7% |
| 55 to 64 Years | 2,032 | 19.5% |
| 65 to 74 Years | 1,703 | 16.4% |
| 75 to 84 Years | 1,176 | 11.3% |
| 85 Years and Over | 883 | 8.5% |
| Total | 10,398 | 100.0% |
Housing Finances in Wilmette
Median Income by Occupancy in Wilmette
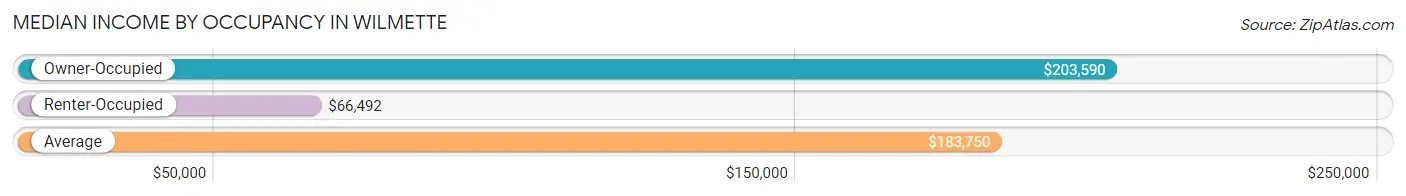
| Occupancy Type | # Households | Median Income |
| Owner-Occupied | 9,076 (87.3%) | $203,590 |
| Renter-Occupied | 1,322 (12.7%) | $66,492 |
| Average | 10,398 (100.0%) | $183,750 |
Occupancy by Householder Income Bracket in Wilmette
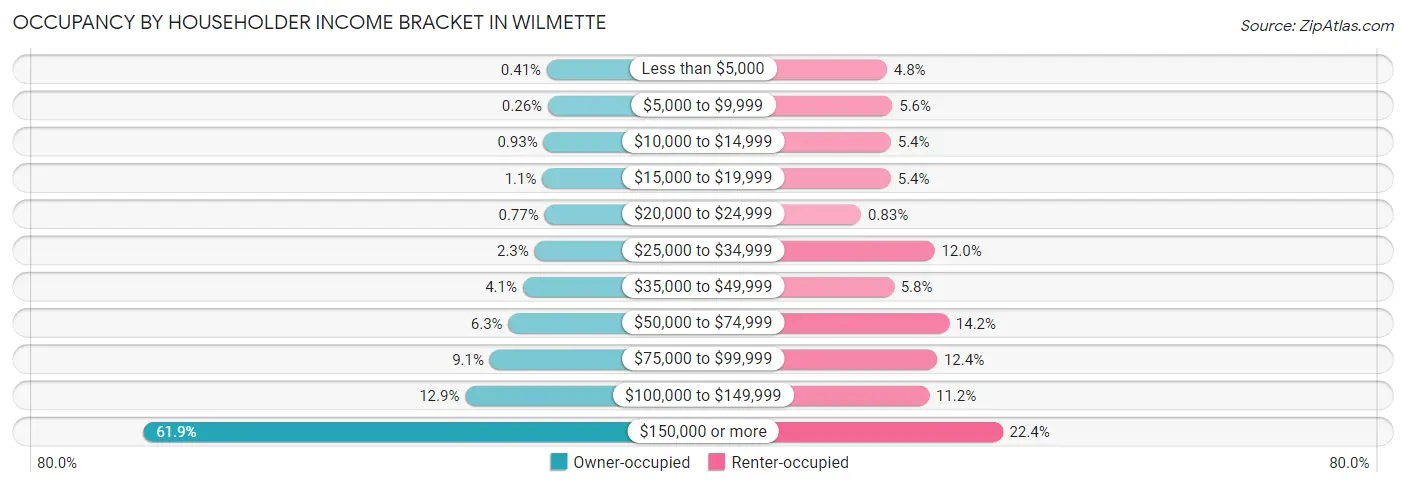
| Income Bracket | Owner-occupied | Renter-occupied |
| Less than $5,000 | 37 (0.4%) | 63 (4.8%) |
| $5,000 to $9,999 | 24 (0.3%) | 74 (5.6%) |
| $10,000 to $14,999 | 84 (0.9%) | 71 (5.4%) |
| $15,000 to $19,999 | 101 (1.1%) | 71 (5.4%) |
| $20,000 to $24,999 | 70 (0.8%) | 11 (0.8%) |
| $25,000 to $34,999 | 207 (2.3%) | 159 (12.0%) |
| $35,000 to $49,999 | 370 (4.1%) | 77 (5.8%) |
| $50,000 to $74,999 | 569 (6.3%) | 188 (14.2%) |
| $75,000 to $99,999 | 827 (9.1%) | 164 (12.4%) |
| $100,000 to $149,999 | 1,167 (12.9%) | 148 (11.2%) |
| $150,000 or more | 5,620 (61.9%) | 296 (22.4%) |
| Total | 9,076 (100.0%) | 1,322 (100.0%) |
Monthly Housing Cost Tiers in Wilmette
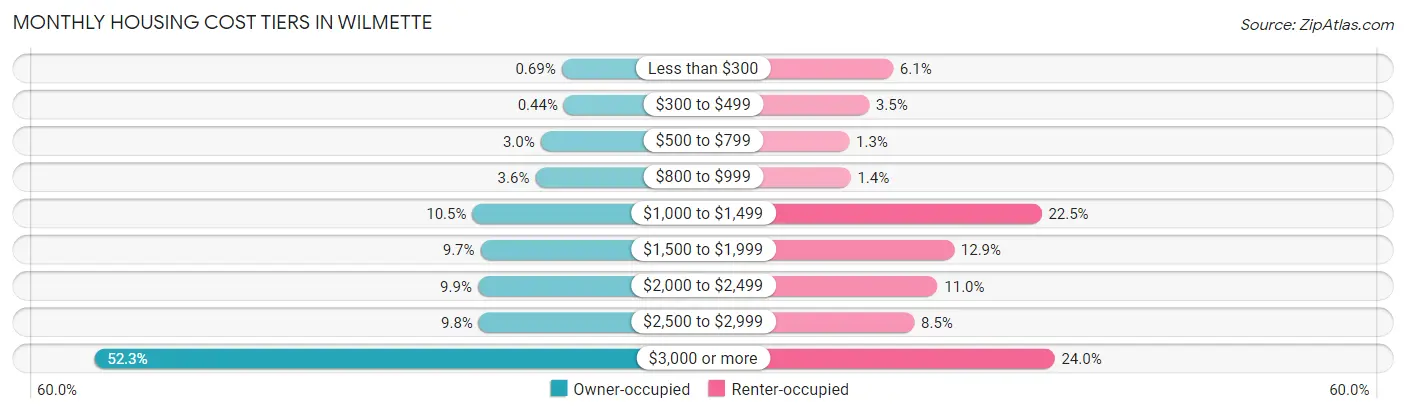
| Monthly Cost | Owner-occupied | Renter-occupied |
| Less than $300 | 63 (0.7%) | 81 (6.1%) |
| $300 to $499 | 40 (0.4%) | 46 (3.5%) |
| $500 to $799 | 272 (3.0%) | 17 (1.3%) |
| $800 to $999 | 326 (3.6%) | 19 (1.4%) |
| $1,000 to $1,499 | 957 (10.5%) | 298 (22.5%) |
| $1,500 to $1,999 | 876 (9.7%) | 170 (12.9%) |
| $2,000 to $2,499 | 902 (9.9%) | 146 (11.0%) |
| $2,500 to $2,999 | 893 (9.8%) | 112 (8.5%) |
| $3,000 or more | 4,747 (52.3%) | 317 (24.0%) |
| Total | 9,076 (100.0%) | 1,322 (100.0%) |
Physical Housing Characteristics in Wilmette
Housing Structures in Wilmette
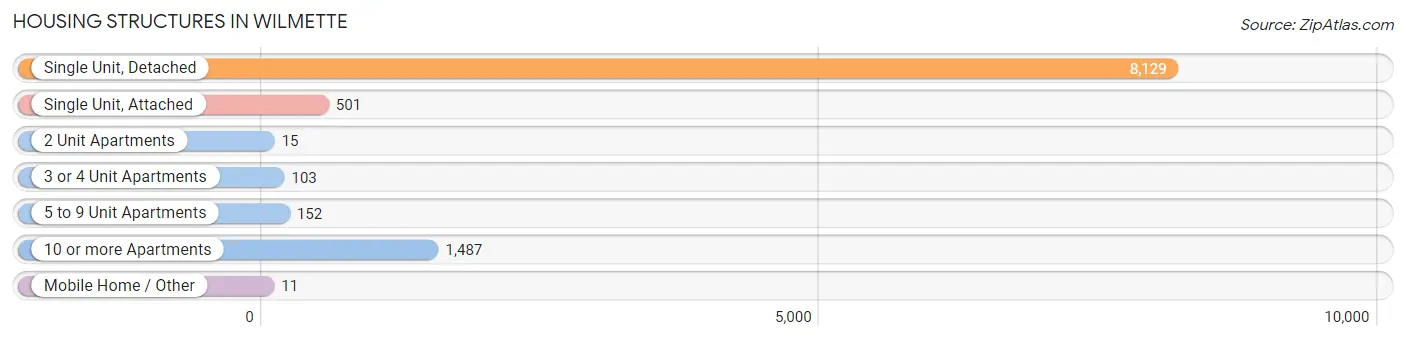
| Structure Type | # Housing Units | % Housing Units |
| Single Unit, Detached | 8,129 | 78.2% |
| Single Unit, Attached | 501 | 4.8% |
| 2 Unit Apartments | 15 | 0.1% |
| 3 or 4 Unit Apartments | 103 | 1.0% |
| 5 to 9 Unit Apartments | 152 | 1.5% |
| 10 or more Apartments | 1,487 | 14.3% |
| Mobile Home / Other | 11 | 0.1% |
| Total | 10,398 | 100.0% |
Housing Structures by Occupancy in Wilmette
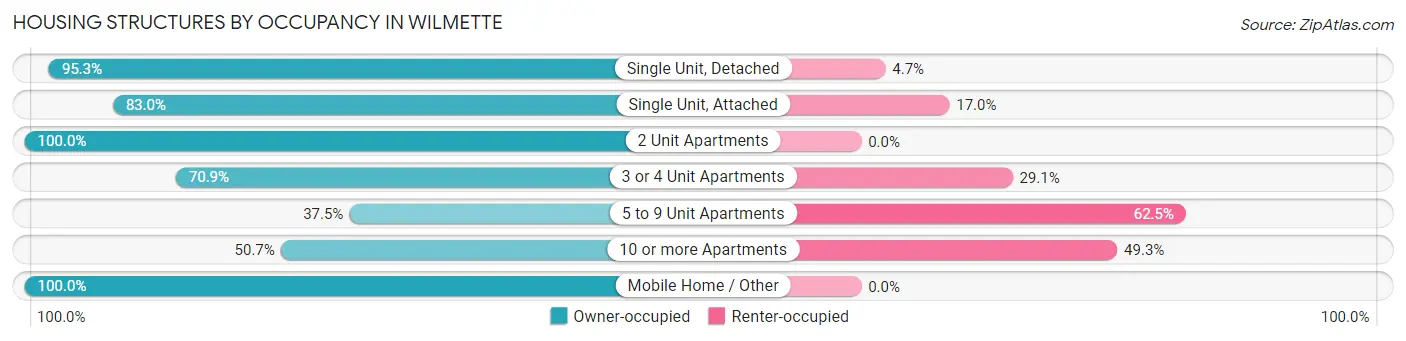
| Structure Type | Owner-occupied | Renter-occupied |
| Single Unit, Detached | 7,750 (95.3%) | 379 (4.7%) |
| Single Unit, Attached | 416 (83.0%) | 85 (17.0%) |
| 2 Unit Apartments | 15 (100.0%) | 0 (0.0%) |
| 3 or 4 Unit Apartments | 73 (70.9%) | 30 (29.1%) |
| 5 to 9 Unit Apartments | 57 (37.5%) | 95 (62.5%) |
| 10 or more Apartments | 754 (50.7%) | 733 (49.3%) |
| Mobile Home / Other | 11 (100.0%) | 0 (0.0%) |
| Total | 9,076 (87.3%) | 1,322 (12.7%) |
Housing Structures by Number of Rooms in Wilmette
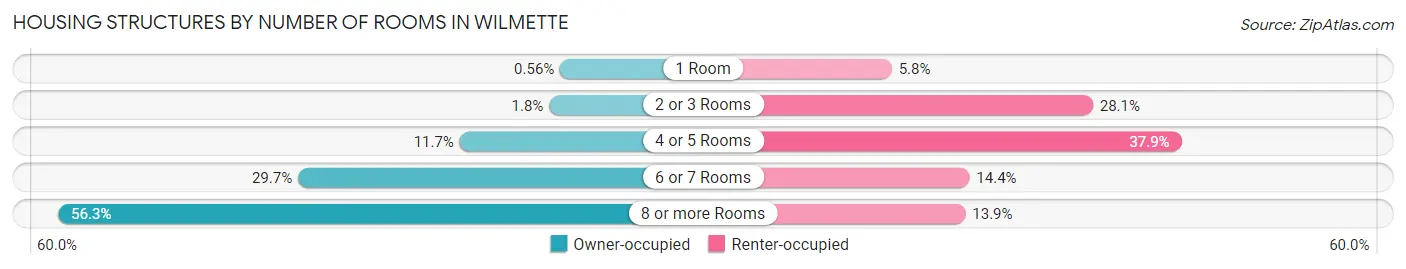
| Number of Rooms | Owner-occupied | Renter-occupied |
| 1 Room | 51 (0.6%) | 76 (5.8%) |
| 2 or 3 Rooms | 162 (1.8%) | 371 (28.1%) |
| 4 or 5 Rooms | 1,063 (11.7%) | 501 (37.9%) |
| 6 or 7 Rooms | 2,692 (29.7%) | 190 (14.4%) |
| 8 or more Rooms | 5,108 (56.3%) | 184 (13.9%) |
| Total | 9,076 (100.0%) | 1,322 (100.0%) |
Housing Structure by Heating Type in Wilmette
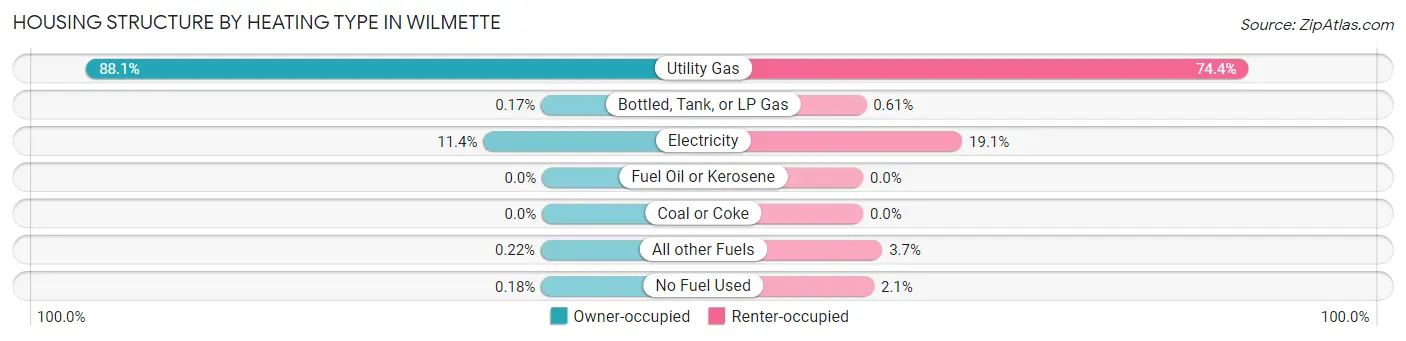
| Heating Type | Owner-occupied | Renter-occupied |
| Utility Gas | 7,994 (88.1%) | 984 (74.4%) |
| Bottled, Tank, or LP Gas | 15 (0.2%) | 8 (0.6%) |
| Electricity | 1,031 (11.4%) | 253 (19.1%) |
| Fuel Oil or Kerosene | 0 (0.0%) | 0 (0.0%) |
| Coal or Coke | 0 (0.0%) | 0 (0.0%) |
| All other Fuels | 20 (0.2%) | 49 (3.7%) |
| No Fuel Used | 16 (0.2%) | 28 (2.1%) |
| Total | 9,076 (100.0%) | 1,322 (100.0%) |
Household Vehicle Usage in Wilmette
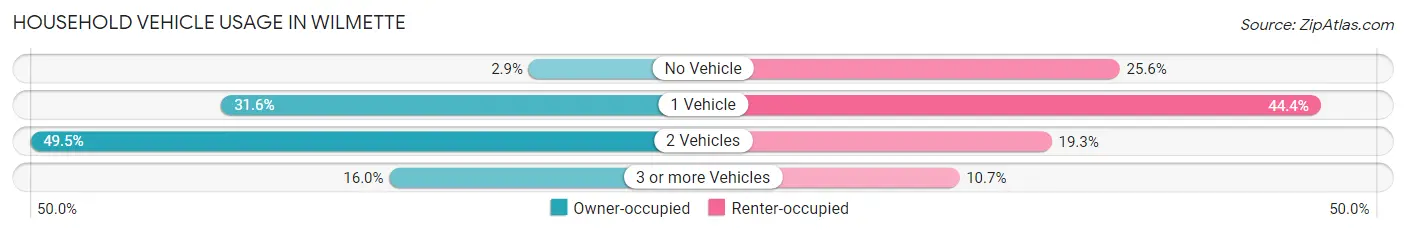
| Vehicles per Household | Owner-occupied | Renter-occupied |
| No Vehicle | 266 (2.9%) | 339 (25.6%) |
| 1 Vehicle | 2,872 (31.6%) | 587 (44.4%) |
| 2 Vehicles | 4,490 (49.5%) | 255 (19.3%) |
| 3 or more Vehicles | 1,448 (16.0%) | 141 (10.7%) |
| Total | 9,076 (100.0%) | 1,322 (100.0%) |
Real Estate & Mortgages in Wilmette
Real Estate and Mortgage Overview in Wilmette
| Characteristic | Without Mortgage | With Mortgage |
| Housing Units | 3,489 | 5,587 |
| Median Property Value | $677,100 | $827,600 |
| Median Household Income | $142,598 | $3,995 |
| Monthly Housing Costs | $1,501 | $4,395 |
| Real Estate Taxes | $10,001 | $19 |
Property Value by Mortgage Status in Wilmette
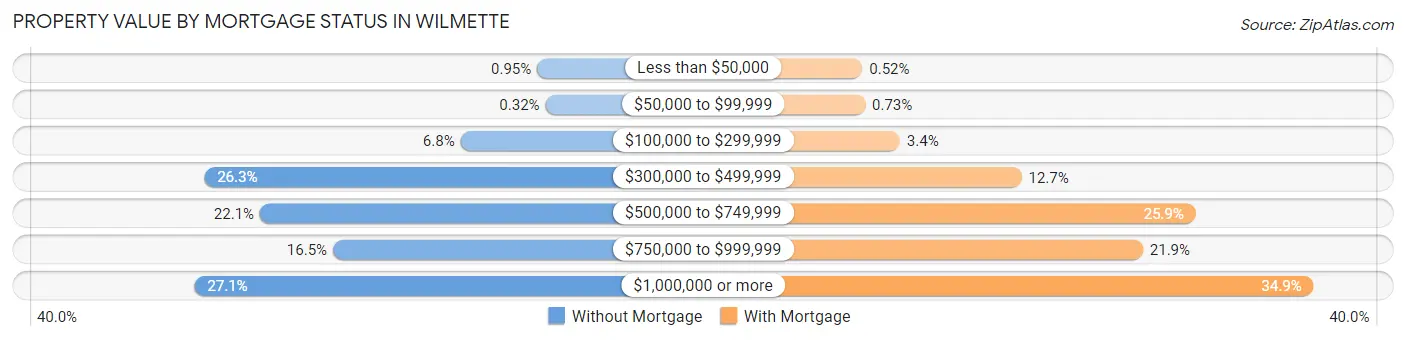
| Property Value | Without Mortgage | With Mortgage |
| Less than $50,000 | 33 (0.9%) | 29 (0.5%) |
| $50,000 to $99,999 | 11 (0.3%) | 41 (0.7%) |
| $100,000 to $299,999 | 237 (6.8%) | 189 (3.4%) |
| $300,000 to $499,999 | 918 (26.3%) | 707 (12.7%) |
| $500,000 to $749,999 | 770 (22.1%) | 1,448 (25.9%) |
| $750,000 to $999,999 | 576 (16.5%) | 1,223 (21.9%) |
| $1,000,000 or more | 944 (27.1%) | 1,950 (34.9%) |
| Total | 3,489 (100.0%) | 5,587 (100.0%) |
Household Income by Mortgage Status in Wilmette
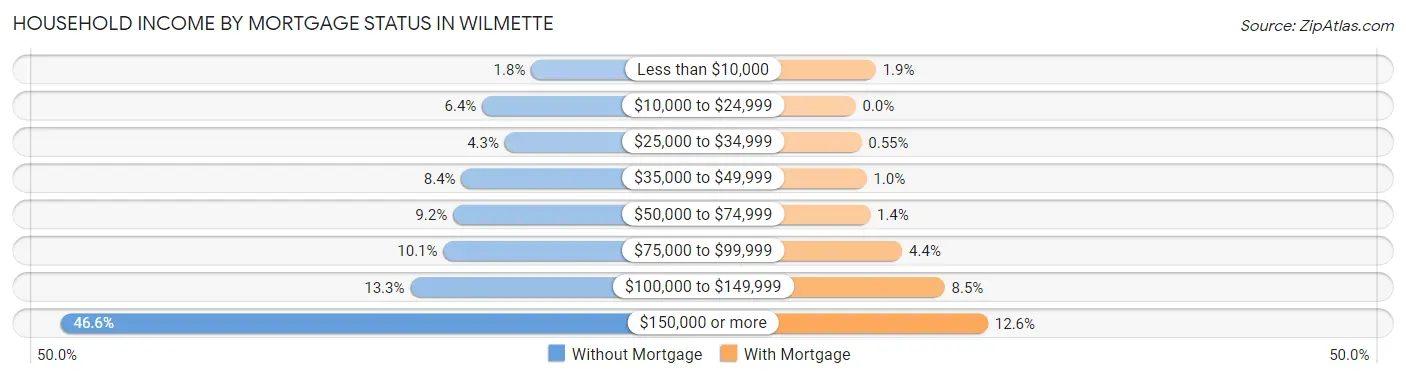
| Household Income | Without Mortgage | With Mortgage |
| Less than $10,000 | 61 (1.8%) | 107 (1.9%) |
| $10,000 to $24,999 | 224 (6.4%) | 0 (0.0%) |
| $25,000 to $34,999 | 149 (4.3%) | 31 (0.5%) |
| $35,000 to $49,999 | 293 (8.4%) | 58 (1.0%) |
| $50,000 to $74,999 | 321 (9.2%) | 77 (1.4%) |
| $75,000 to $99,999 | 353 (10.1%) | 248 (4.4%) |
| $100,000 to $149,999 | 463 (13.3%) | 474 (8.5%) |
| $150,000 or more | 1,625 (46.6%) | 704 (12.6%) |
| Total | 3,489 (100.0%) | 5,587 (100.0%) |
Property Value to Household Income Ratio in Wilmette
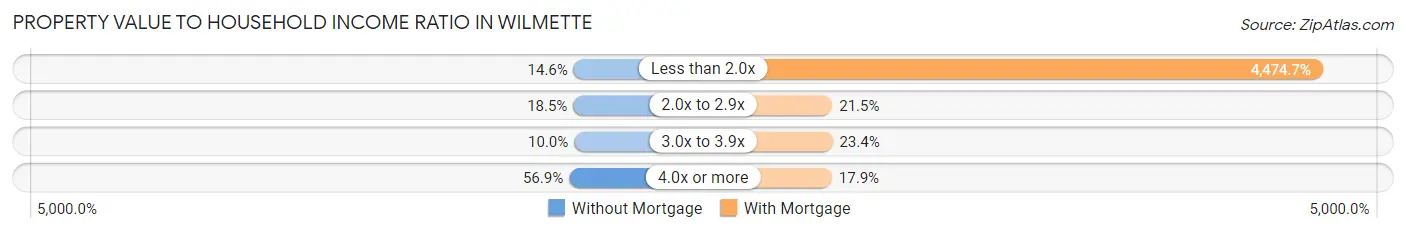
| Value-to-Income Ratio | Without Mortgage | With Mortgage |
| Less than 2.0x | 510 (14.6%) | 250,001 (4,474.7%) |
| 2.0x to 2.9x | 647 (18.5%) | 1,200 (21.5%) |
| 3.0x to 3.9x | 347 (10.0%) | 1,307 (23.4%) |
| 4.0x or more | 1,985 (56.9%) | 1,002 (17.9%) |
| Total | 3,489 (100.0%) | 5,587 (100.0%) |
Real Estate Taxes by Mortgage Status in Wilmette
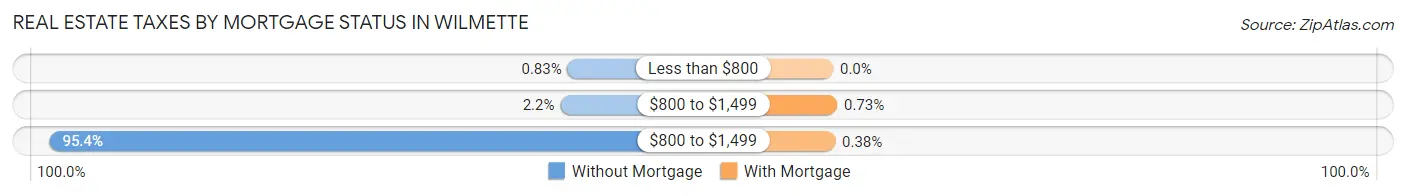
| Property Taxes | Without Mortgage | With Mortgage |
| Less than $800 | 29 (0.8%) | 0 (0.0%) |
| $800 to $1,499 | 75 (2.1%) | 41 (0.7%) |
| $800 to $1,499 | 3,330 (95.4%) | 21 (0.4%) |
| Total | 3,489 (100.0%) | 5,587 (100.0%) |
Health & Disability in Wilmette
Health Insurance Coverage by Age in Wilmette
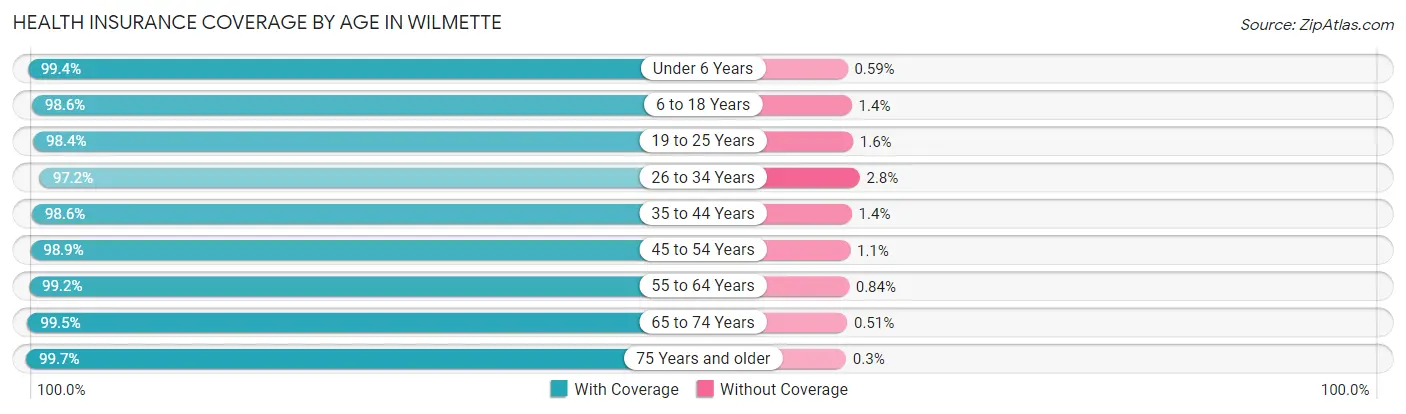
| Age Bracket | With Coverage | Without Coverage |
| Under 6 Years | 2,005 (99.4%) | 12 (0.6%) |
| 6 to 18 Years | 6,488 (98.6%) | 90 (1.4%) |
| 19 to 25 Years | 677 (98.4%) | 11 (1.6%) |
| 26 to 34 Years | 1,129 (97.2%) | 33 (2.8%) |
| 35 to 44 Years | 3,092 (98.6%) | 43 (1.4%) |
| 45 to 54 Years | 4,633 (98.9%) | 50 (1.1%) |
| 55 to 64 Years | 3,769 (99.2%) | 32 (0.8%) |
| 65 to 74 Years | 2,943 (99.5%) | 15 (0.5%) |
| 75 Years and older | 2,695 (99.7%) | 8 (0.3%) |
| Total | 27,431 (98.9%) | 294 (1.1%) |
Health Insurance Coverage by Citizenship Status in Wilmette
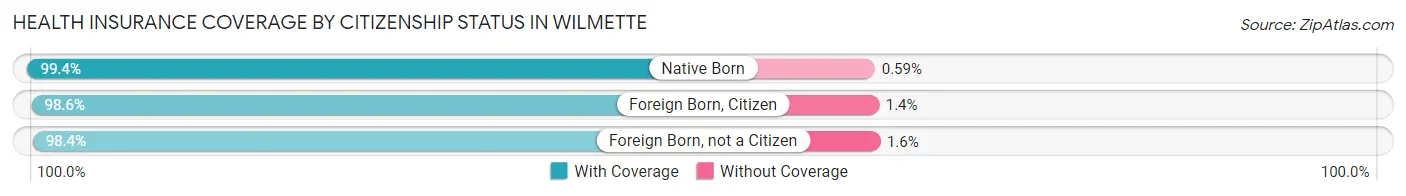
| Citizenship Status | With Coverage | Without Coverage |
| Native Born | 2,005 (99.4%) | 12 (0.6%) |
| Foreign Born, Citizen | 6,488 (98.6%) | 90 (1.4%) |
| Foreign Born, not a Citizen | 677 (98.4%) | 11 (1.6%) |
Health Insurance Coverage by Household Income in Wilmette
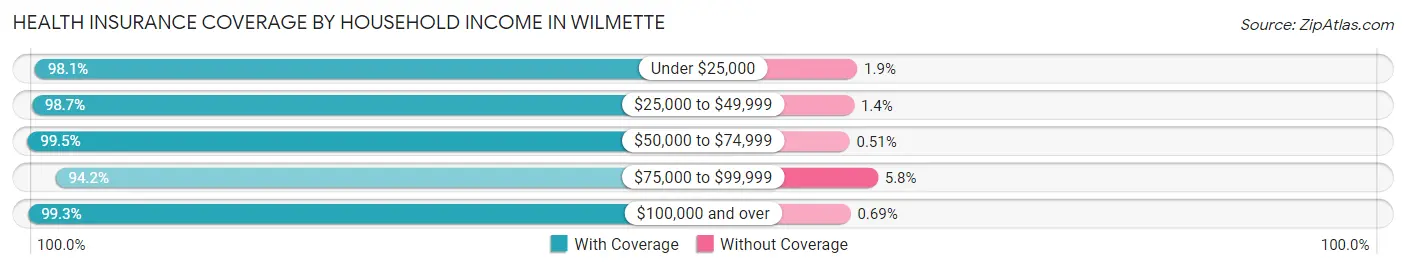
| Household Income | With Coverage | Without Coverage |
| Under $25,000 | 858 (98.1%) | 17 (1.9%) |
| $25,000 to $49,999 | 1,387 (98.7%) | 19 (1.3%) |
| $50,000 to $74,999 | 1,555 (99.5%) | 8 (0.5%) |
| $75,000 to $99,999 | 1,556 (94.2%) | 96 (5.8%) |
| $100,000 and over | 22,040 (99.3%) | 154 (0.7%) |
Public vs Private Health Insurance Coverage by Age in Wilmette
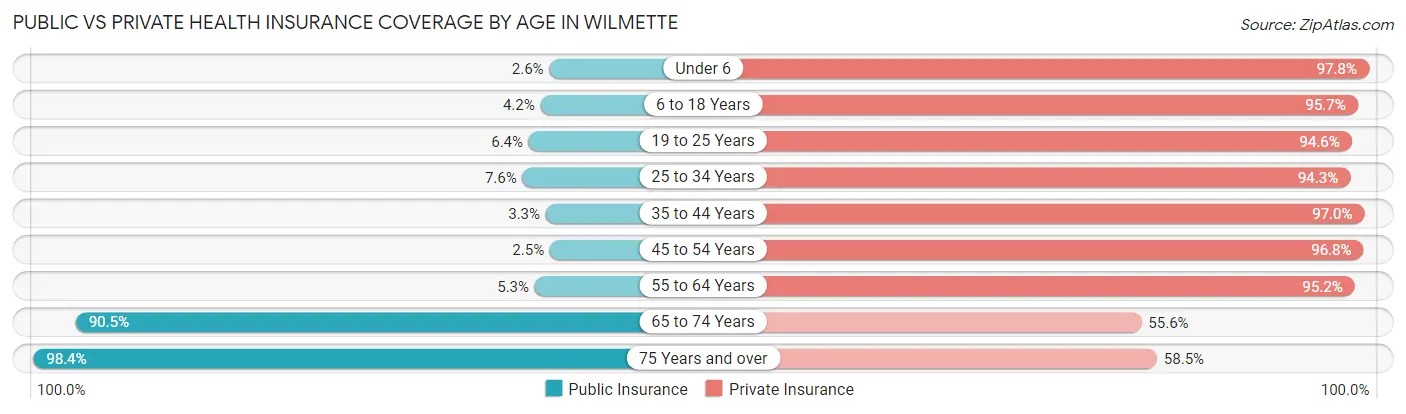
| Age Bracket | Public Insurance | Private Insurance |
| Under 6 | 52 (2.6%) | 1,973 (97.8%) |
| 6 to 18 Years | 278 (4.2%) | 6,297 (95.7%) |
| 19 to 25 Years | 44 (6.4%) | 651 (94.6%) |
| 25 to 34 Years | 88 (7.6%) | 1,096 (94.3%) |
| 35 to 44 Years | 102 (3.3%) | 3,040 (97.0%) |
| 45 to 54 Years | 116 (2.5%) | 4,533 (96.8%) |
| 55 to 64 Years | 201 (5.3%) | 3,618 (95.2%) |
| 65 to 74 Years | 2,677 (90.5%) | 1,645 (55.6%) |
| 75 Years and over | 2,659 (98.4%) | 1,581 (58.5%) |
| Total | 6,217 (22.4%) | 24,434 (88.1%) |
Disability Status by Sex by Age in Wilmette
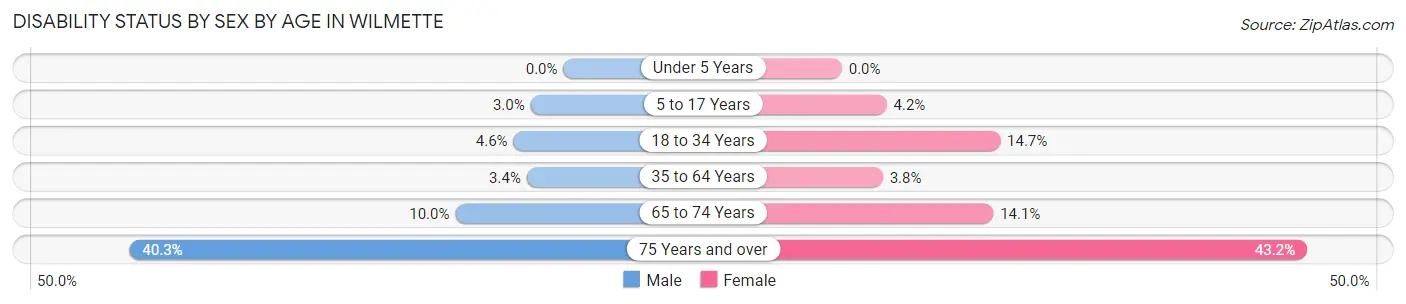
| Age Bracket | Male | Female |
| Under 5 Years | 0 (0.0%) | 0 (0.0%) |
| 5 to 17 Years | 101 (3.0%) | 130 (4.2%) |
| 18 to 34 Years | 51 (4.6%) | 171 (14.7%) |
| 35 to 64 Years | 193 (3.4%) | 226 (3.8%) |
| 65 to 74 Years | 141 (10.0%) | 218 (14.1%) |
| 75 Years and over | 455 (40.3%) | 679 (43.2%) |
Disability Class by Sex by Age in Wilmette
Disability Class: Hearing Difficulty
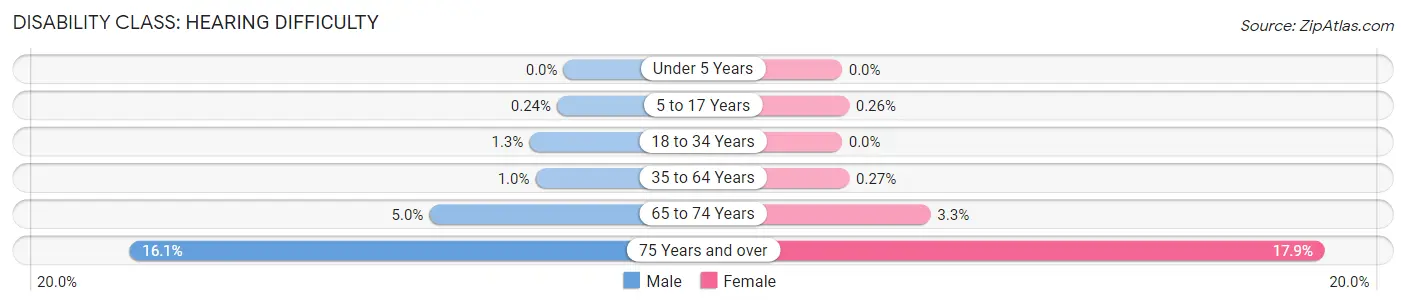
| Age Bracket | Male | Female |
| Under 5 Years | 0 (0.0%) | 0 (0.0%) |
| 5 to 17 Years | 8 (0.2%) | 8 (0.3%) |
| 18 to 34 Years | 14 (1.3%) | 0 (0.0%) |
| 35 to 64 Years | 59 (1.0%) | 16 (0.3%) |
| 65 to 74 Years | 70 (5.0%) | 51 (3.3%) |
| 75 Years and over | 182 (16.1%) | 282 (17.9%) |
Disability Class: Vision Difficulty
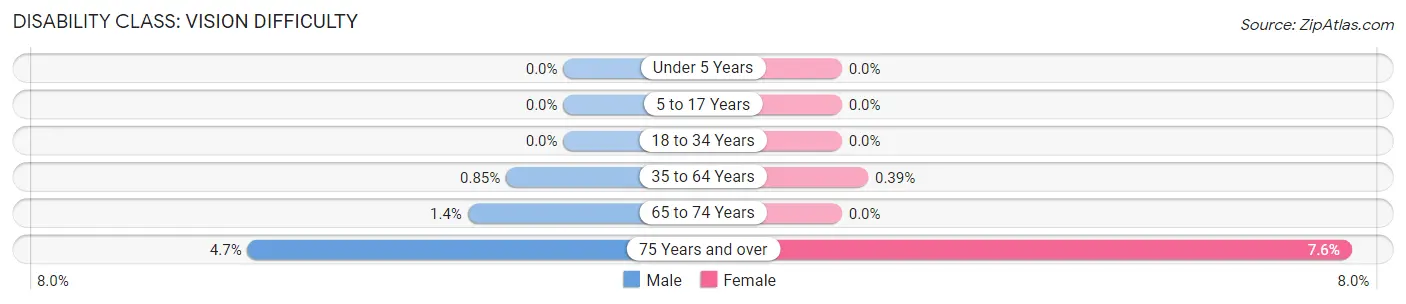
| Age Bracket | Male | Female |
| Under 5 Years | 0 (0.0%) | 0 (0.0%) |
| 5 to 17 Years | 0 (0.0%) | 0 (0.0%) |
| 18 to 34 Years | 0 (0.0%) | 0 (0.0%) |
| 35 to 64 Years | 48 (0.9%) | 23 (0.4%) |
| 65 to 74 Years | 20 (1.4%) | 0 (0.0%) |
| 75 Years and over | 53 (4.7%) | 119 (7.6%) |
Disability Class: Cognitive Difficulty
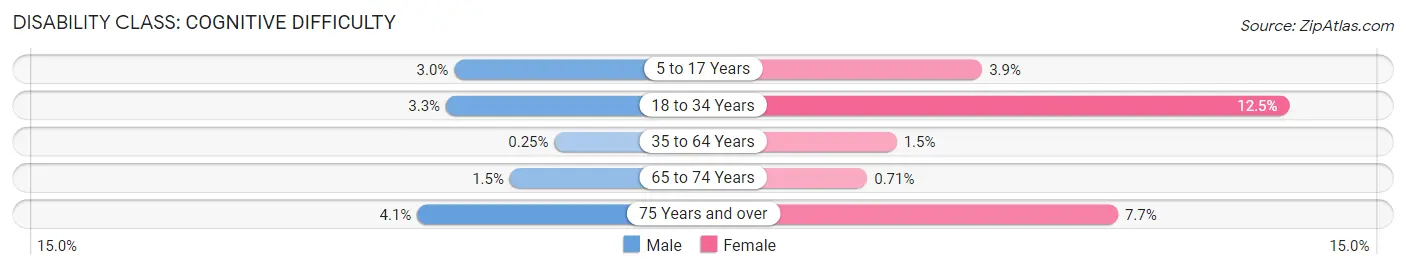
| Age Bracket | Male | Female |
| 5 to 17 Years | 101 (3.0%) | 122 (3.9%) |
| 18 to 34 Years | 36 (3.3%) | 145 (12.5%) |
| 35 to 64 Years | 14 (0.3%) | 91 (1.5%) |
| 65 to 74 Years | 21 (1.5%) | 11 (0.7%) |
| 75 Years and over | 46 (4.1%) | 121 (7.7%) |
Disability Class: Ambulatory Difficulty
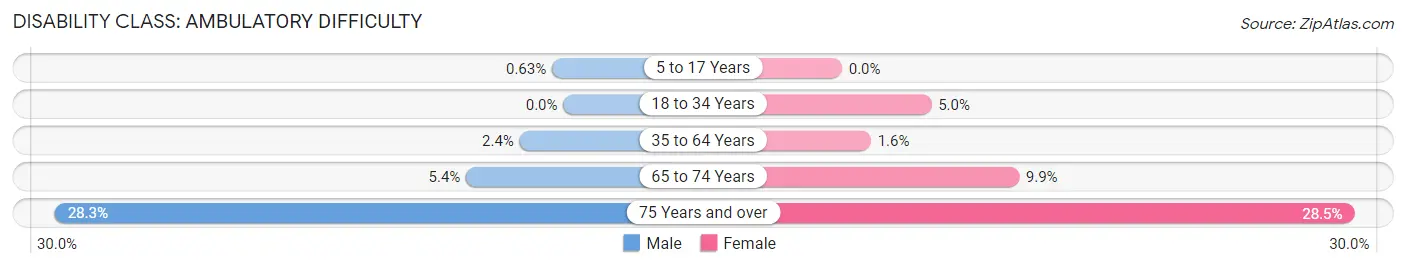
| Age Bracket | Male | Female |
| 5 to 17 Years | 21 (0.6%) | 0 (0.0%) |
| 18 to 34 Years | 0 (0.0%) | 58 (5.0%) |
| 35 to 64 Years | 138 (2.4%) | 96 (1.6%) |
| 65 to 74 Years | 76 (5.4%) | 153 (9.9%) |
| 75 Years and over | 320 (28.3%) | 449 (28.5%) |
Disability Class: Self-Care Difficulty
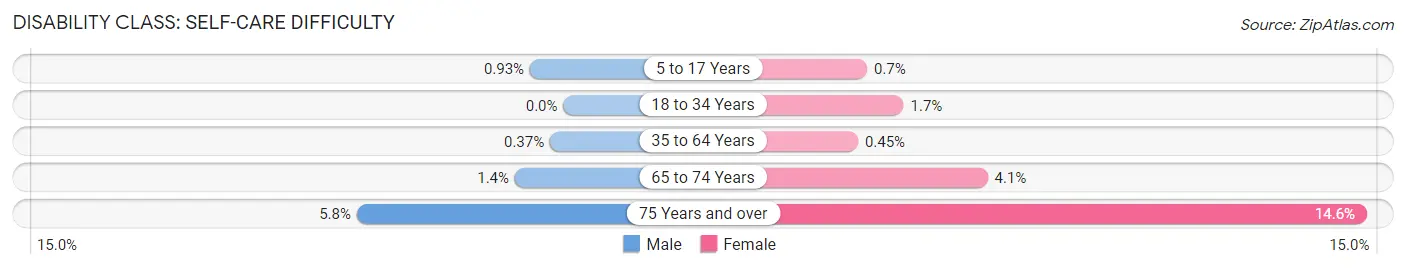
| Age Bracket | Male | Female |
| 5 to 17 Years | 31 (0.9%) | 22 (0.7%) |
| 18 to 34 Years | 0 (0.0%) | 20 (1.7%) |
| 35 to 64 Years | 21 (0.4%) | 27 (0.4%) |
| 65 to 74 Years | 19 (1.3%) | 63 (4.1%) |
| 75 Years and over | 65 (5.8%) | 230 (14.6%) |
Technology Access in Wilmette
Computing Device Access in Wilmette
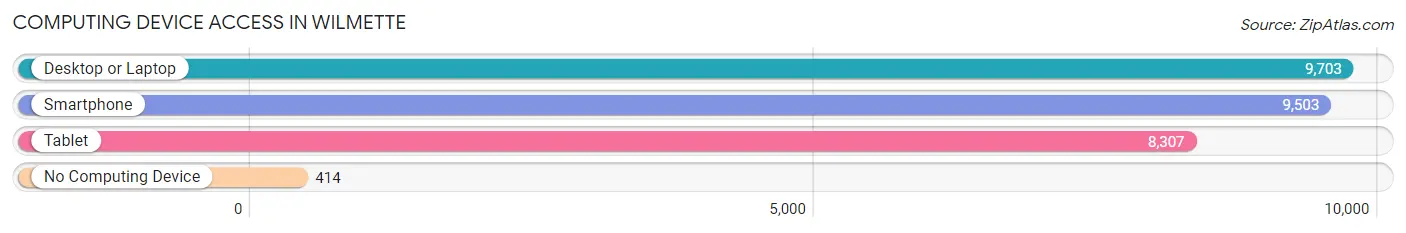
| Device Type | # Households | % Households |
| Desktop or Laptop | 9,703 | 93.3% |
| Smartphone | 9,503 | 91.4% |
| Tablet | 8,307 | 79.9% |
| No Computing Device | 414 | 4.0% |
| Total | 10,398 | 100.0% |
Internet Access in Wilmette
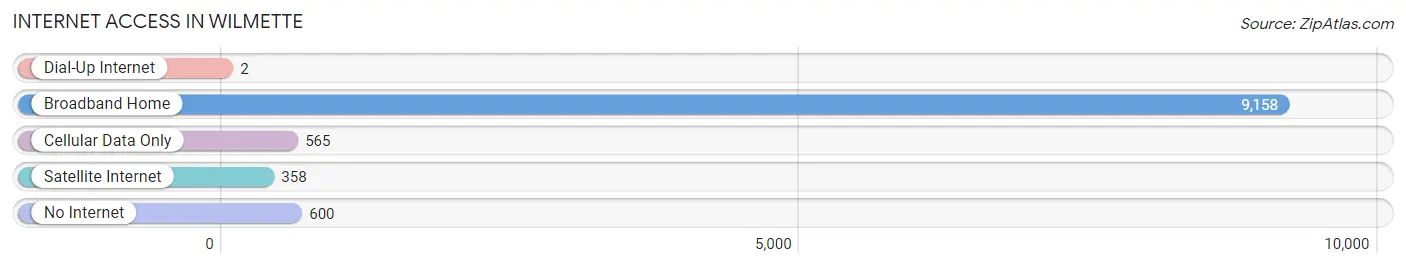
| Internet Type | # Households | % Households |
| Dial-Up Internet | 2 | 0.0% |
| Broadband Home | 9,158 | 88.1% |
| Cellular Data Only | 565 | 5.4% |
| Satellite Internet | 358 | 3.4% |
| No Internet | 600 | 5.8% |
| Total | 10,398 | 100.0% |
Wilmette Summary
Wilmette is a village located in Cook and Lake Counties in the state of Illinois. It is situated on the shores of Lake Michigan, just north of Chicago. The village has a population of 27,087 as of the 2010 census, making it the tenth largest municipality in the state. Wilmette is known for its beautiful beaches, parks, and recreational activities.
History
The area that is now Wilmette was first settled in 1836 by German immigrants. The village was originally known as South Evanston, and was incorporated in 1872. The name Wilmette was chosen in honor of Antoine Ouilmette, a French-Canadian fur trader who had settled in the area in the late 1700s.
In the late 19th century, Wilmette became a popular summer destination for wealthy Chicagoans. The village was home to several grand estates, including the Charles Gates Dawes House, which is now a National Historic Landmark.
Geography
Wilmette is located in northeastern Illinois, on the shores of Lake Michigan. The village is bordered by Evanston to the south, Skokie to the west, and Glenview to the north. Wilmette is approximately 25 miles north of downtown Chicago.
The village has a total area of 5.7 square miles, of which 5.3 square miles is land and 0.4 square miles is water. Wilmette is home to several parks and beaches, including Gillson Park, Centennial Park, and Langdon Park.
Economy
Wilmette is a primarily residential community, with a small commercial district located along Green Bay Road. The village is home to several corporate headquarters, including the global headquarters of Kraft Heinz and the North American headquarters of Wm. Wrigley Jr. Company.
Demographics
As of the 2010 census, Wilmette had a population of 27,087. The racial makeup of the village was 87.2% White, 4.3% Asian, 3.7% African American, and 2.3% Hispanic or Latino.
The median household income in Wilmette was $107,817 in 2018, and the median home value was $717,400. The village has a highly educated population, with over 80% of adults having a bachelor's degree or higher.
Wilmette is served by several public school districts, including Wilmette Public Schools District 39, New Trier Township High School District 203, and North Shore School District 112. The village is also home to several private schools, including Loyola Academy and Regina Dominican High School.
Common Questions
What is Per Capita Income in Wilmette?
Per Capita income in Wilmette is $103,076.
What is the Median Family Income in Wilmette?
Median Family Income in Wilmette is $233,411.
What is the Median Household income in Wilmette?
Median Household Income in Wilmette is $183,750.
What is Income or Wage Gap in Wilmette?
Income or Wage Gap in Wilmette is 54.8%.
Women in Wilmette earn 45.2 cents for every dollar earned by a man.
What is Inequality or Gini Index in Wilmette?
Inequality or Gini Index in Wilmette is 0.51.
What is the Total Population of Wilmette?
Total Population of Wilmette is 27,801.
What is the Total Male Population of Wilmette?
Total Male Population of Wilmette is 13,551.
What is the Total Female Population of Wilmette?
Total Female Population of Wilmette is 14,250.
What is the Ratio of Males per 100 Females in Wilmette?
There are 95.09 Males per 100 Females in Wilmette.
What is the Ratio of Females per 100 Males in Wilmette?
There are 105.16 Females per 100 Males in Wilmette.
What is the Median Population Age in Wilmette?
Median Population Age in Wilmette is 45.7 Years.
What is the Average Family Size in Wilmette
Average Family Size in Wilmette is 3.2 People.
What is the Average Household Size in Wilmette
Average Household Size in Wilmette is 2.7 People.
How Large is the Labor Force in Wilmette?
There are 12,733 People in the Labor Forcein in Wilmette.
What is the Percentage of People in the Labor Force in Wilmette?
60.9% of People are in the Labor Force in Wilmette.
What is the Unemployment Rate in Wilmette?
Unemployment Rate in Wilmette is 4.3%.