Cities with the Highest Percentage of Population Employed in Legal Services & Support in Delaware
RELATED REPORTS & OPTIONS
Legal Services & Support
Delaware
Compare Cities
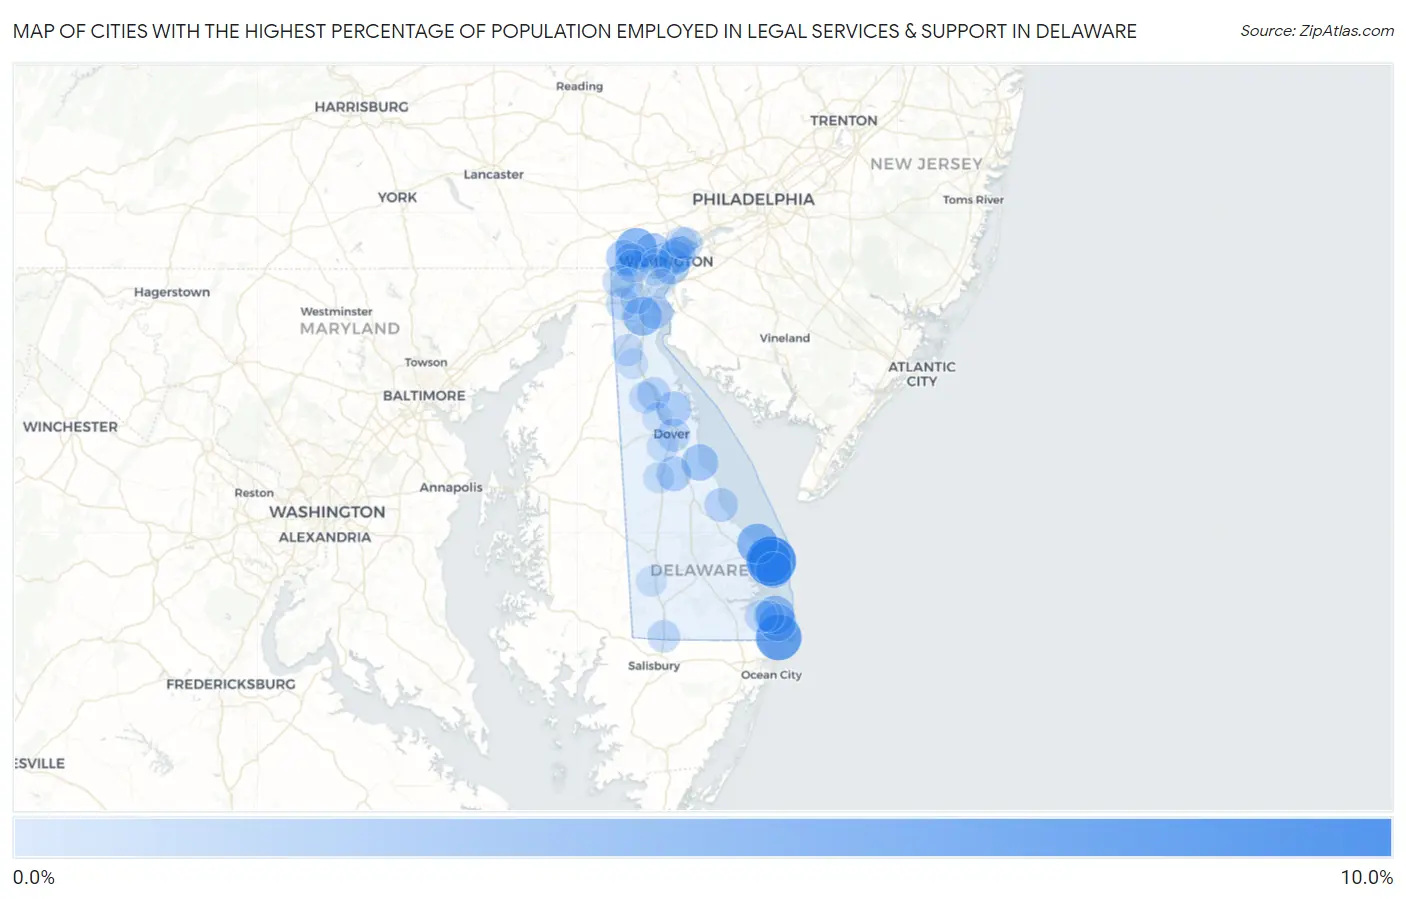
Map of Cities with the Highest Percentage of Population Employed in Legal Services & Support in Delaware
0.0%
10.0%
Cities with the Highest Percentage of Population Employed in Legal Services & Support in Delaware
| City | % Employed | vs State | vs National | |
| 1. | Henlopen Acres | 9.4% | 1.4%(+7.94)#1 | 1.2%(+8.19)#256 |
| 2. | Fenwick Island | 7.5% | 1.4%(+6.05)#2 | 1.2%(+6.29)#383 |
| 3. | Rehoboth Beach | 6.2% | 1.4%(+4.81)#3 | 1.2%(+5.06)#563 |
| 4. | Hockessin | 5.4% | 1.4%(+3.94)#4 | 1.2%(+4.18)#742 |
| 5. | Lewes | 4.9% | 1.4%(+3.46)#5 | 1.2%(+3.70)#879 |
| 6. | St Georges | 4.1% | 1.4%(+2.66)#6 | 1.2%(+2.91)#1,183 |
| 7. | Bethany Beach | 4.1% | 1.4%(+2.66)#7 | 1.2%(+2.91)#1,184 |
| 8. | South Bethany | 3.5% | 1.4%(+2.04)#8 | 1.2%(+2.29)#1,559 |
| 9. | Bowers | 2.9% | 1.4%(+1.51)#9 | 1.2%(+1.76)#1,997 |
| 10. | Greenville | 2.9% | 1.4%(+1.49)#10 | 1.2%(+1.74)#2,015 |
| 11. | Wilmington | 2.9% | 1.4%(+1.49)#11 | 1.2%(+1.73)#2,018 |
| 12. | Dewey Beach | 2.9% | 1.4%(+1.46)#12 | 1.2%(+1.71)#2,039 |
| 13. | Bellefonte | 2.5% | 1.4%(+1.11)#13 | 1.2%(+1.36)#2,402 |
| 14. | North Star | 2.4% | 1.4%(+1.01)#14 | 1.2%(+1.26)#2,515 |
| 15. | Riverview | 2.3% | 1.4%(+0.840)#15 | 1.2%(+1.09)#2,764 |
| 16. | Leipsic | 2.2% | 1.4%(+0.817)#16 | 1.2%(+1.06)#2,798 |
| 17. | Edgemoor | 1.9% | 1.4%(+0.489)#17 | 1.2%(+0.736)#3,365 |
| 18. | Pike Creek | 1.8% | 1.4%(+0.328)#18 | 1.2%(+0.574)#3,735 |
| 19. | Slaughter Beach | 1.7% | 1.4%(+0.294)#19 | 1.2%(+0.540)#3,815 |
| 20. | Delaware City | 1.6% | 1.4%(+0.127)#20 | 1.2%(+0.373)#4,232 |
| 21. | Smyrna | 1.5% | 1.4%(+0.108)#21 | 1.2%(+0.355)#4,288 |
| 22. | Dover | 1.4% | 1.4%(-0.027)#22 | 1.2%(+0.220)#4,735 |
| 23. | Pike Creek Valley | 1.4% | 1.4%(-0.069)#23 | 1.2%(+0.178)#4,861 |
| 24. | Glasgow | 1.3% | 1.4%(-0.153)#24 | 1.2%(+0.094)#5,134 |
| 25. | Delmar | 1.2% | 1.4%(-0.218)#25 | 1.2%(+0.028)#5,412 |
| 26. | Millville | 1.2% | 1.4%(-0.227)#26 | 1.2%(+0.019)#5,446 |
| 27. | Claymont | 1.2% | 1.4%(-0.245)#27 | 1.2%(+0.002)#5,513 |
| 28. | Newark | 1.0% | 1.4%(-0.422)#28 | 1.2%(-0.176)#6,337 |
| 29. | Ardentown | 1.0% | 1.4%(-0.430)#29 | 1.2%(-0.184)#6,373 |
| 30. | Clayton | 0.89% | 1.4%(-0.537)#30 | 1.2%(-0.290)#6,907 |
| 31. | Middletown | 0.88% | 1.4%(-0.553)#31 | 1.2%(-0.306)#6,991 |
| 32. | Ocean View | 0.77% | 1.4%(-0.660)#32 | 1.2%(-0.414)#7,612 |
| 33. | Newport | 0.74% | 1.4%(-0.691)#33 | 1.2%(-0.444)#7,805 |
| 34. | Wyoming | 0.71% | 1.4%(-0.717)#34 | 1.2%(-0.471)#7,983 |
| 35. | Bear | 0.68% | 1.4%(-0.753)#35 | 1.2%(-0.506)#8,241 |
| 36. | Brookside | 0.59% | 1.4%(-0.841)#36 | 1.2%(-0.595)#8,868 |
| 37. | Felton | 0.55% | 1.4%(-0.884)#37 | 1.2%(-0.637)#9,177 |
| 38. | Townsend | 0.46% | 1.4%(-0.974)#38 | 1.2%(-0.728)#9,851 |
| 39. | Seaford | 0.41% | 1.4%(-1.02)#39 | 1.2%(-0.777)#10,190 |
| 40. | Elsmere | 0.29% | 1.4%(-1.14)#40 | 1.2%(-0.891)#10,969 |
| 41. | Cheswold | 0.28% | 1.4%(-1.15)#41 | 1.2%(-0.907)#11,071 |
| 42. | New Castle | 0.16% | 1.4%(-1.28)#42 | 1.2%(-1.03)#11,599 |
1
Common Questions
What are the Top 10 Cities with the Highest Percentage of Population Employed in Legal Services & Support in Delaware?
Top 10 Cities with the Highest Percentage of Population Employed in Legal Services & Support in Delaware are:
#1
9.4%
#2
7.5%
#3
6.2%
#4
5.4%
#5
4.9%
#6
4.1%
#7
4.1%
#8
3.5%
#9
2.9%
#10
2.9%
What city has the Highest Percentage of Population Employed in Legal Services & Support in Delaware?
Henlopen Acres has the Highest Percentage of Population Employed in Legal Services & Support in Delaware with 9.4%.
What is the Percentage of Population Employed in Legal Services & Support in the State of Delaware?
Percentage of Population Employed in Legal Services & Support in Delaware is 1.4%.
What is the Percentage of Population Employed in Legal Services & Support in the United States?
Percentage of Population Employed in Legal Services & Support in the United States is 1.2%.