Zip Codes with the Highest Percentage of Population Employed in Legal Services & Support in Bloomington, IL
RELATED REPORTS & OPTIONS
Legal Services & Support
Bloomington
Compare Zip Codes
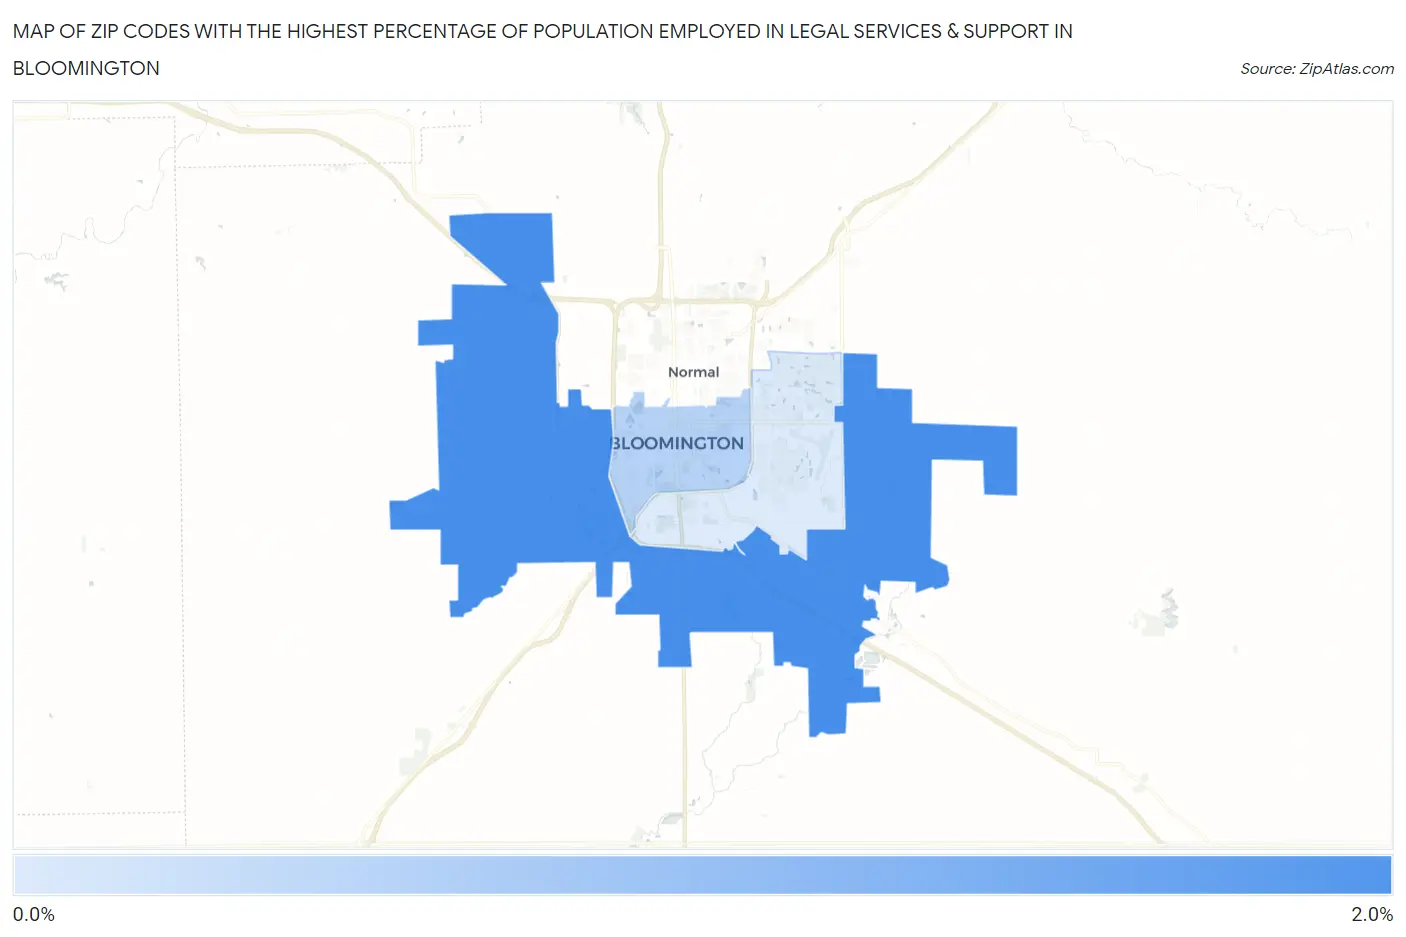
Map of Zip Codes with the Highest Percentage of Population Employed in Legal Services & Support in Bloomington
0.74%
1.5%
Zip Codes with the Highest Percentage of Population Employed in Legal Services & Support in Bloomington, IL
| Zip Code | % Employed | vs State | vs National | |
| 1. | 61705 | 1.5% | 1.3%(+0.173)#180 | 1.2%(+0.339)#4,945 |
| 2. | 61701 | 0.94% | 1.3%(-0.405)#309 | 1.2%(-0.239)#8,244 |
| 3. | 61704 | 0.74% | 1.3%(-0.607)#372 | 1.2%(-0.442)#9,993 |
1
Common Questions
What are the Top Zip Codes with the Highest Percentage of Population Employed in Legal Services & Support in Bloomington, IL?
Top Zip Codes with the Highest Percentage of Population Employed in Legal Services & Support in Bloomington, IL are:
What zip code has the Highest Percentage of Population Employed in Legal Services & Support in Bloomington, IL?
61705 has the Highest Percentage of Population Employed in Legal Services & Support in Bloomington, IL with 1.5%.
What is the Percentage of Population Employed in Legal Services & Support in Bloomington, IL?
Percentage of Population Employed in Legal Services & Support in Bloomington is 0.95%.
What is the Percentage of Population Employed in Legal Services & Support in Illinois?
Percentage of Population Employed in Legal Services & Support in Illinois is 1.3%.
What is the Percentage of Population Employed in Legal Services & Support in the United States?
Percentage of Population Employed in Legal Services & Support in the United States is 1.2%.