Zip Codes with the Highest Percentage of Population Employed in Legal Services & Support in Des Plaines, IL
RELATED REPORTS & OPTIONS
Legal Services & Support
Des Plaines
Compare Zip Codes
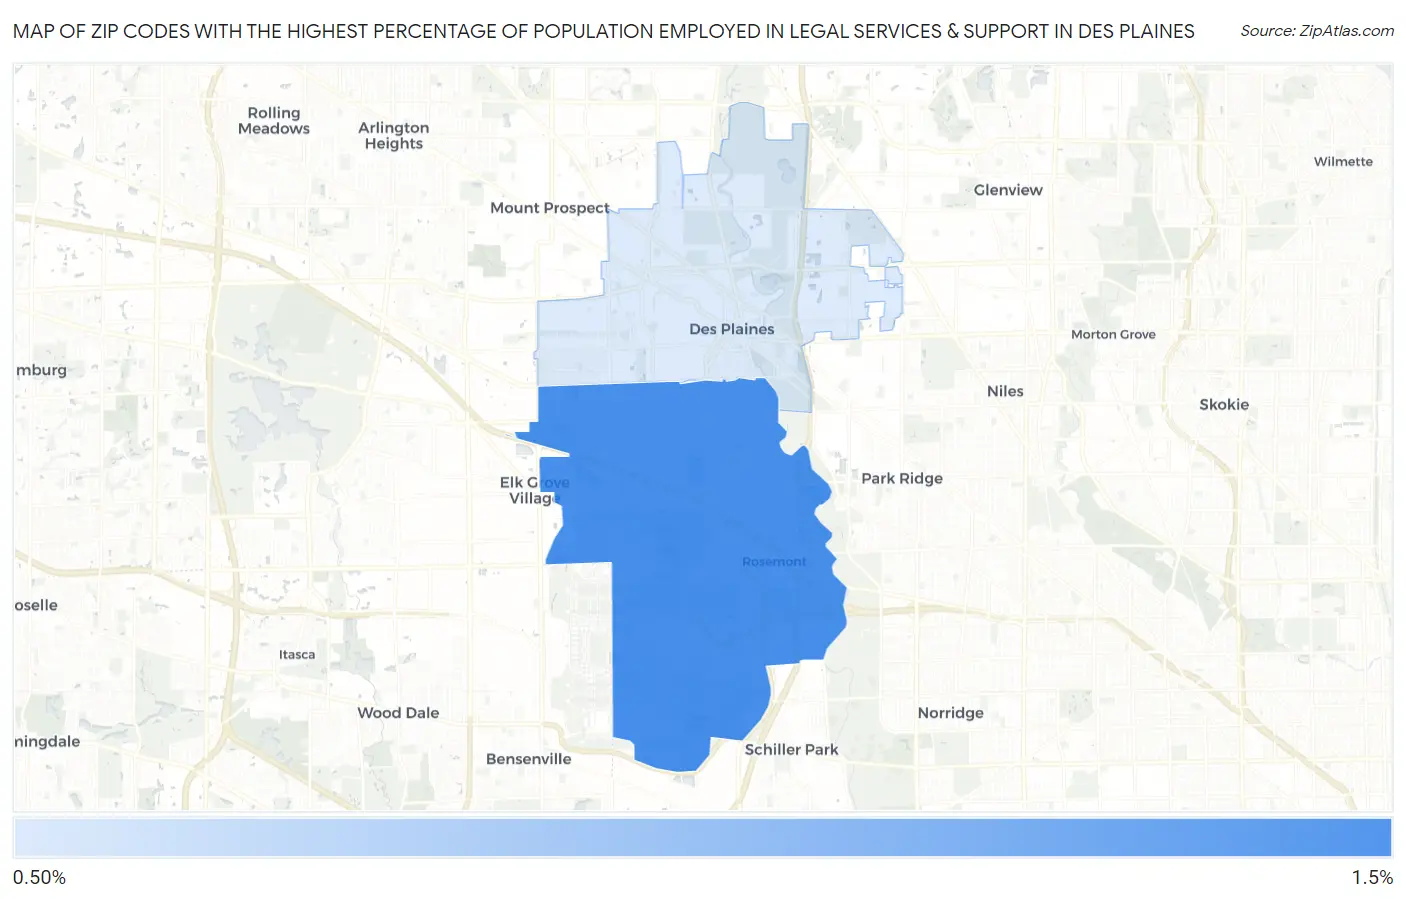
Map of Zip Codes with the Highest Percentage of Population Employed in Legal Services & Support in Des Plaines
0.85%
1.2%
Zip Codes with the Highest Percentage of Population Employed in Legal Services & Support in Des Plaines, IL
| Zip Code | % Employed | vs State | vs National | |
| 1. | 60018 | 1.2% | 1.3%(-0.119)#231 | 1.2%(+0.047)#6,318 |
| 2. | 60016 | 0.85% | 1.3%(-0.502)#334 | 1.2%(-0.337)#9,044 |
1
Common Questions
What are the Top Zip Codes with the Highest Percentage of Population Employed in Legal Services & Support in Des Plaines, IL?
Top Zip Codes with the Highest Percentage of Population Employed in Legal Services & Support in Des Plaines, IL are:
What zip code has the Highest Percentage of Population Employed in Legal Services & Support in Des Plaines, IL?
60018 has the Highest Percentage of Population Employed in Legal Services & Support in Des Plaines, IL with 1.2%.
What is the Percentage of Population Employed in Legal Services & Support in Des Plaines, IL?
Percentage of Population Employed in Legal Services & Support in Des Plaines is 1.2%.
What is the Percentage of Population Employed in Legal Services & Support in Illinois?
Percentage of Population Employed in Legal Services & Support in Illinois is 1.3%.
What is the Percentage of Population Employed in Legal Services & Support in the United States?
Percentage of Population Employed in Legal Services & Support in the United States is 1.2%.