Glen Ellyn, IL Map & Demographics
Glen Ellyn Map
Glen Ellyn Overview
$72,404
PER CAPITA INCOME
$174,904
AVG FAMILY INCOME
$128,132
AVG HOUSEHOLD INCOME
50.1%
WAGE / INCOME GAP [ % ]
49.9¢/ $1
WAGE / INCOME GAP [ $ ]
0.51
INEQUALITY / GINI INDEX
28,304
TOTAL POPULATION
13,996
MALE POPULATION
14,308
FEMALE POPULATION
97.82
MALES / 100 FEMALES
102.23
FEMALES / 100 MALES
41.6
MEDIAN AGE
3.1
AVG FAMILY SIZE
2.6
AVG HOUSEHOLD SIZE
13,978
LABOR FORCE [ PEOPLE ]
63.8%
PERCENT IN LABOR FORCE
5.1%
UNEMPLOYMENT RATE
Glen Ellyn Zip Codes
Glen Ellyn Area Codes
Income in Glen Ellyn
Income Overview in Glen Ellyn
Per Capita Income in Glen Ellyn is $72,404, while median incomes of families and households are $174,904 and $128,132 respectively.
| Characteristic | Number | Measure |
| Per Capita Income | 28,304 | $72,404 |
| Median Family Income | 7,713 | $174,904 |
| Mean Family Income | 7,713 | $232,879 |
| Median Household Income | 10,981 | $128,132 |
| Mean Household Income | 10,981 | $185,910 |
| Income Deficit | 7,713 | $0 |
| Wage / Income Gap (%) | 28,304 | 50.12% |
| Wage / Income Gap ($) | 28,304 | 49.88¢ per $1 |
| Gini / Inequality Index | 28,304 | 0.51 |
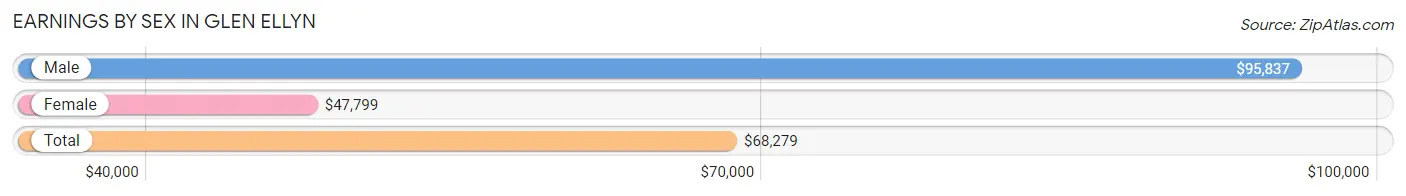
Earnings by Sex in Glen Ellyn
Average Earnings in Glen Ellyn are $68,279, $95,837 for men and $47,799 for women, a difference of 50.1%.
| Sex | Number | Average Earnings |
| Male | 7,961 (54.1%) | $95,837 |
| Female | 6,761 (45.9%) | $47,799 |
| Total | 14,722 (100.0%) | $68,279 |
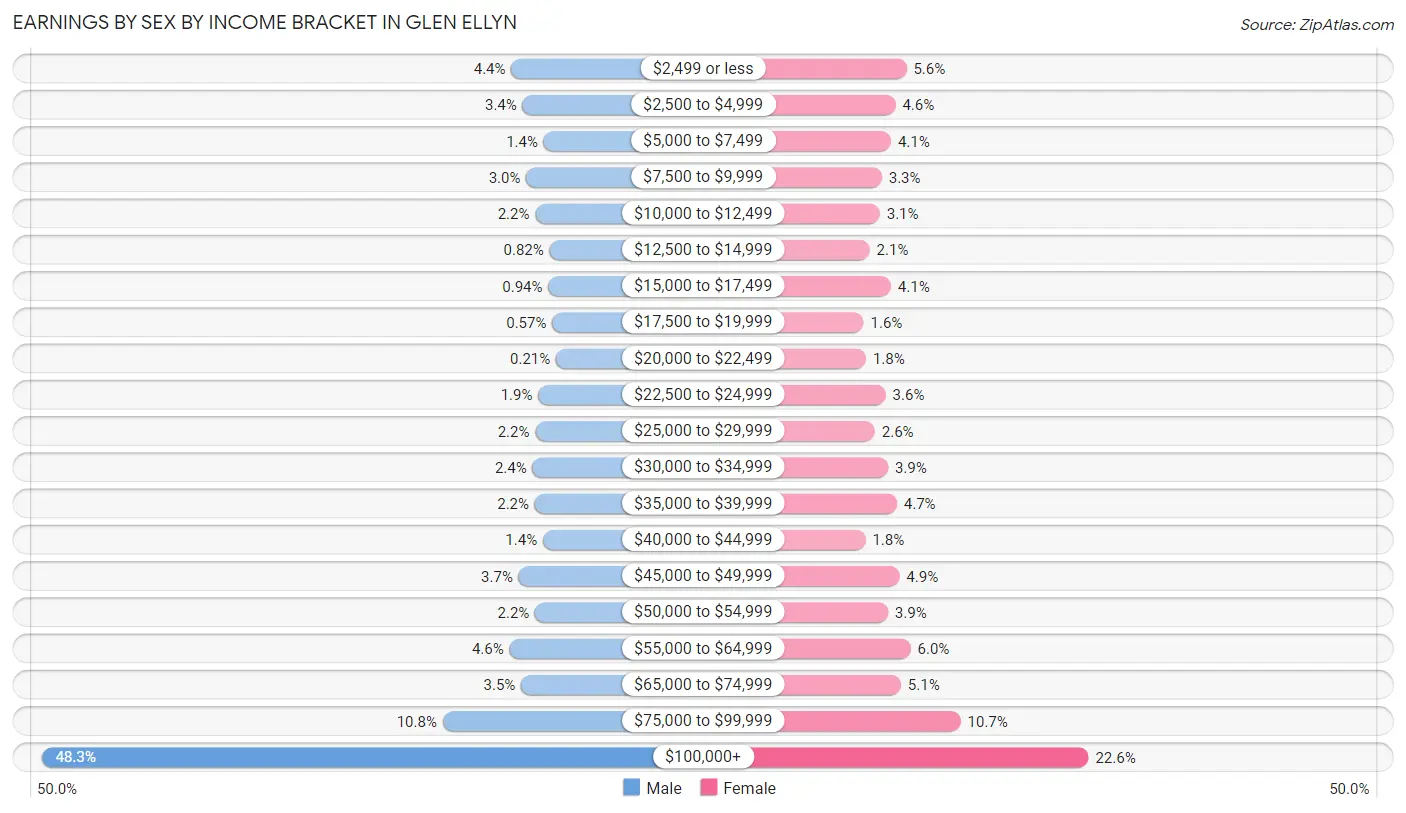
Earnings by Sex by Income Bracket in Glen Ellyn
The most common earnings brackets in Glen Ellyn are $100,000+ for men (3,847 | 48.3%) and $100,000+ for women (1,531 | 22.6%).
| Income | Male | Female |
| $2,499 or less | 350 (4.4%) | 378 (5.6%) |
| $2,500 to $4,999 | 267 (3.4%) | 308 (4.6%) |
| $5,000 to $7,499 | 108 (1.4%) | 280 (4.1%) |
| $7,500 to $9,999 | 239 (3.0%) | 222 (3.3%) |
| $10,000 to $12,499 | 172 (2.2%) | 209 (3.1%) |
| $12,500 to $14,999 | 65 (0.8%) | 145 (2.1%) |
| $15,000 to $17,499 | 75 (0.9%) | 279 (4.1%) |
| $17,500 to $19,999 | 45 (0.6%) | 106 (1.6%) |
| $20,000 to $22,499 | 17 (0.2%) | 122 (1.8%) |
| $22,500 to $24,999 | 150 (1.9%) | 246 (3.6%) |
| $25,000 to $29,999 | 172 (2.2%) | 178 (2.6%) |
| $30,000 to $34,999 | 193 (2.4%) | 261 (3.9%) |
| $35,000 to $39,999 | 175 (2.2%) | 317 (4.7%) |
| $40,000 to $44,999 | 115 (1.4%) | 118 (1.8%) |
| $45,000 to $49,999 | 295 (3.7%) | 333 (4.9%) |
| $50,000 to $54,999 | 173 (2.2%) | 260 (3.8%) |
| $55,000 to $64,999 | 364 (4.6%) | 404 (6.0%) |
| $65,000 to $74,999 | 277 (3.5%) | 343 (5.1%) |
| $75,000 to $99,999 | 862 (10.8%) | 721 (10.7%) |
| $100,000+ | 3,847 (48.3%) | 1,531 (22.6%) |
| Total | 7,961 (100.0%) | 6,761 (100.0%) |
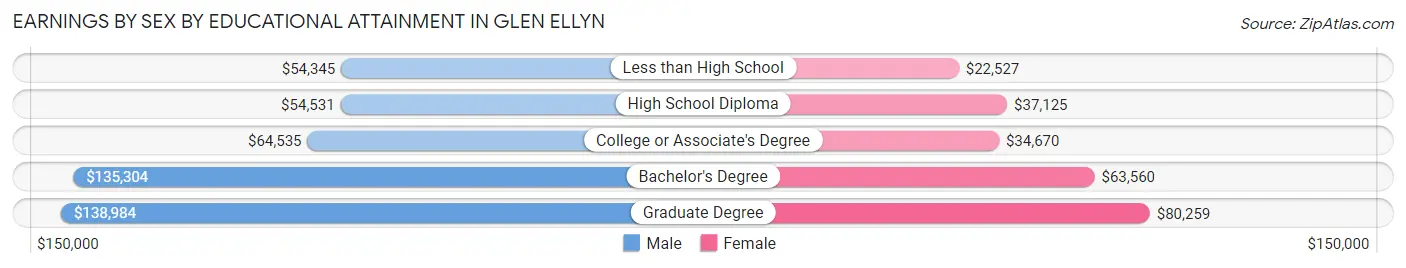
Earnings by Sex by Educational Attainment in Glen Ellyn
Average earnings in Glen Ellyn are $109,855 for men and $53,629 for women, a difference of 51.2%. Men with an educational attainment of graduate degree enjoy the highest average annual earnings of $138,984, while those with less than high school education earn the least with $54,345. Women with an educational attainment of graduate degree earn the most with the average annual earnings of $80,259, while those with less than high school education have the smallest earnings of $22,527.
| Educational Attainment | Male Income | Female Income |
| Less than High School | $54,345 | $22,527 |
| High School Diploma | $54,531 | $37,125 |
| College or Associate's Degree | $64,535 | $34,670 |
| Bachelor's Degree | $135,304 | $63,560 |
| Graduate Degree | $138,984 | $80,259 |
| Total | $109,855 | $53,629 |
Family Income in Glen Ellyn
Family Income Brackets in Glen Ellyn
According to the Glen Ellyn family income data, there are 3,409 families falling into the $200,000+ income range, which is the most common income bracket and makes up 44.2% of all families. Conversely, the $10,000 to $14,999 income bracket is the least frequent group with only 69 families (0.9%) belonging to this category.
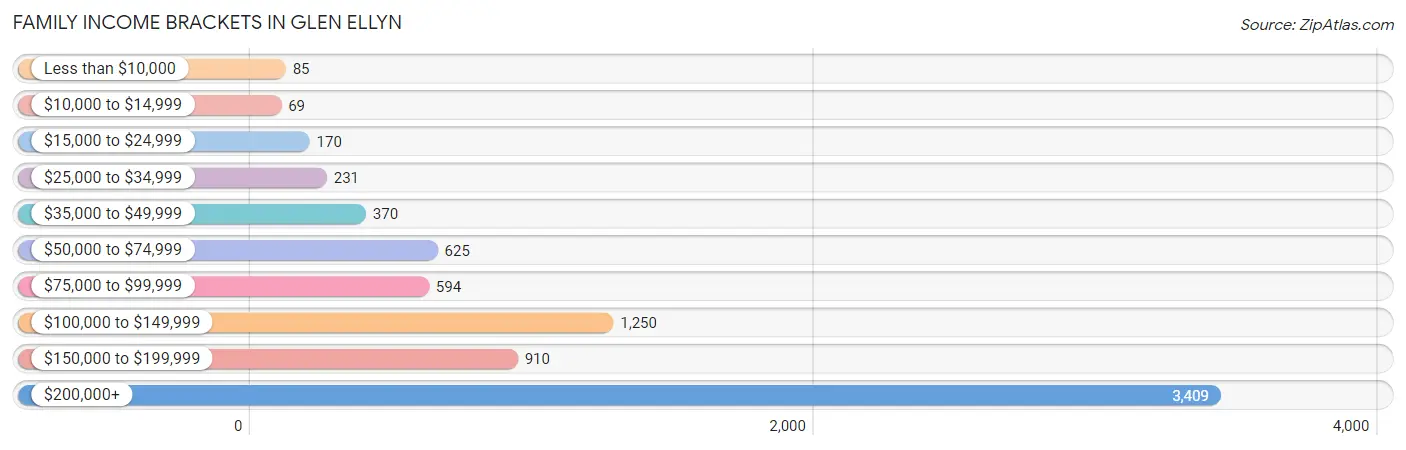
| Income Bracket | # Families | % Families |
| Less than $10,000 | 85 | 1.1% |
| $10,000 to $14,999 | 69 | 0.9% |
| $15,000 to $24,999 | 170 | 2.2% |
| $25,000 to $34,999 | 231 | 3.0% |
| $35,000 to $49,999 | 370 | 4.8% |
| $50,000 to $74,999 | 625 | 8.1% |
| $75,000 to $99,999 | 594 | 7.7% |
| $100,000 to $149,999 | 1,250 | 16.2% |
| $150,000 to $199,999 | 910 | 11.8% |
| $200,000+ | 3,409 | 44.2% |
Family Income by Famaliy Size in Glen Ellyn
5-person families (814 | 10.5%) account for the highest median family income in Glen Ellyn with $250,001 per family, while 2-person families (3,446 | 44.7%) have the highest median income of $67,500 per family member.
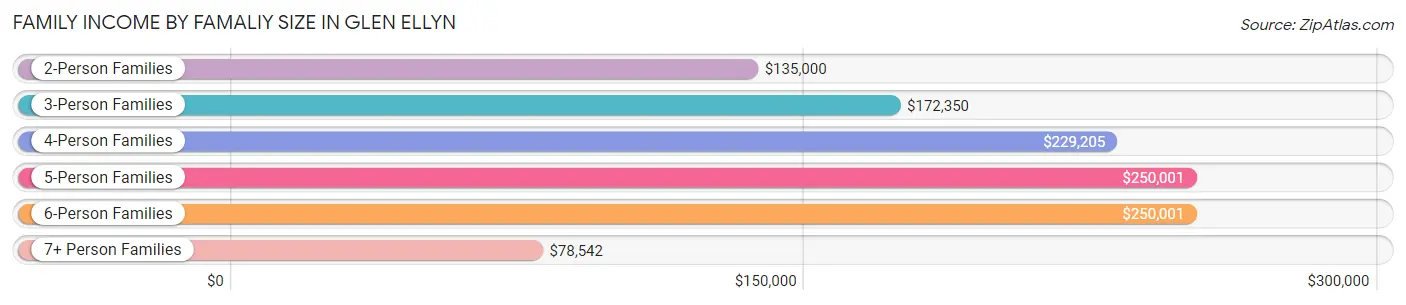
| Income Bracket | # Families | Median Income |
| 2-Person Families | 3,446 (44.7%) | $135,000 |
| 3-Person Families | 1,448 (18.8%) | $172,350 |
| 4-Person Families | 1,739 (22.6%) | $229,205 |
| 5-Person Families | 814 (10.5%) | $250,001 |
| 6-Person Families | 172 (2.2%) | $250,001 |
| 7+ Person Families | 94 (1.2%) | $78,542 |
| Total | 7,713 (100.0%) | $174,904 |
Family Income by Number of Earners in Glen Ellyn
The median family income in Glen Ellyn is $174,904, with families comprising 2 earners (3,697) having the highest median family income of $228,119, while families with no earners (962) have the lowest median family income of $73,714, accounting for 47.9% and 12.5% of families, respectively.
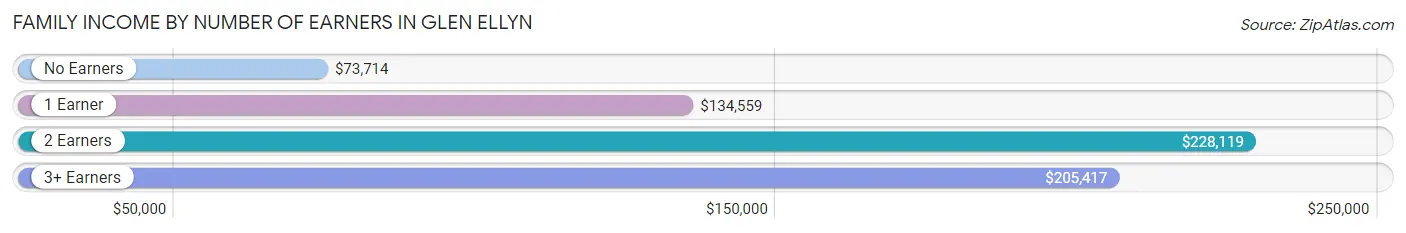
| Number of Earners | # Families | Median Income |
| No Earners | 962 (12.5%) | $73,714 |
| 1 Earner | 2,078 (26.9%) | $134,559 |
| 2 Earners | 3,697 (47.9%) | $228,119 |
| 3+ Earners | 976 (12.7%) | $205,417 |
| Total | 7,713 (100.0%) | $174,904 |
Household Income in Glen Ellyn
Household Income Brackets in Glen Ellyn
With 3,536 households falling in the category, the $200,000+ income range is the most frequent in Glen Ellyn, accounting for 32.2% of all households. In contrast, only 187 households (1.7%) fall into the $10,000 to $14,999 income bracket, making it the least populous group.
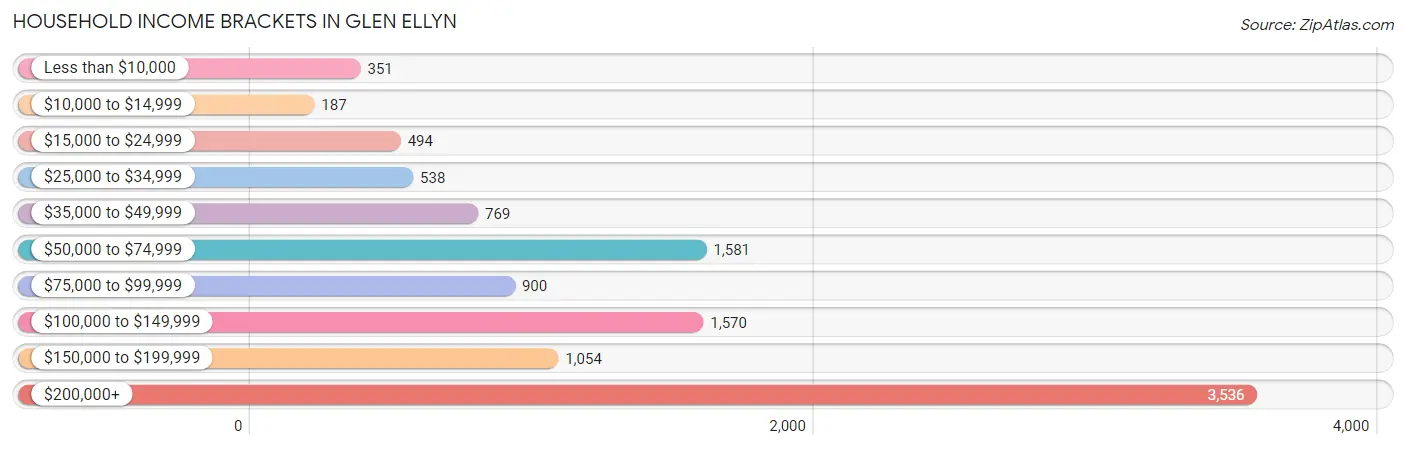
| Income Bracket | # Households | % Households |
| Less than $10,000 | 351 | 3.2% |
| $10,000 to $14,999 | 187 | 1.7% |
| $15,000 to $24,999 | 494 | 4.5% |
| $25,000 to $34,999 | 538 | 4.9% |
| $35,000 to $49,999 | 769 | 7.0% |
| $50,000 to $74,999 | 1,581 | 14.4% |
| $75,000 to $99,999 | 900 | 8.2% |
| $100,000 to $149,999 | 1,570 | 14.3% |
| $150,000 to $199,999 | 1,054 | 9.6% |
| $200,000+ | 3,536 | 32.2% |
Household Income by Householder Age in Glen Ellyn
The median household income in Glen Ellyn is $128,132, with the highest median household income of $166,250 found in the 25 to 44 years age bracket for the primary householder. A total of 2,985 households (27.2%) fall into this category. Meanwhile, the 15 to 24 years age bracket for the primary householder has the lowest median household income of $50,996, with 255 households (2.3%) in this group.
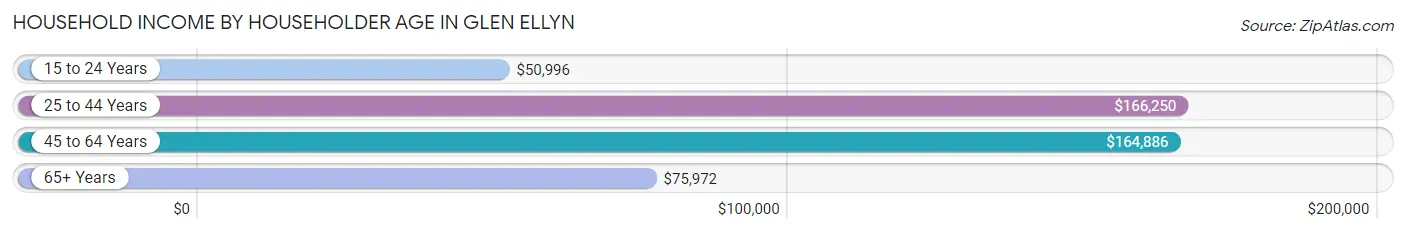
| Income Bracket | # Households | Median Income |
| 15 to 24 Years | 255 (2.3%) | $50,996 |
| 25 to 44 Years | 2,985 (27.2%) | $166,250 |
| 45 to 64 Years | 4,148 (37.8%) | $164,886 |
| 65+ Years | 3,593 (32.7%) | $75,972 |
| Total | 10,981 (100.0%) | $128,132 |
Poverty in Glen Ellyn
Income Below Poverty by Sex and Age in Glen Ellyn
With 4.7% poverty level for males and 6.6% for females among the residents of Glen Ellyn, 18 to 24 year old males and 18 to 24 year old females are the most vulnerable to poverty, with 203 males (18.5%) and 155 females (18.1%) in their respective age groups living below the poverty level.
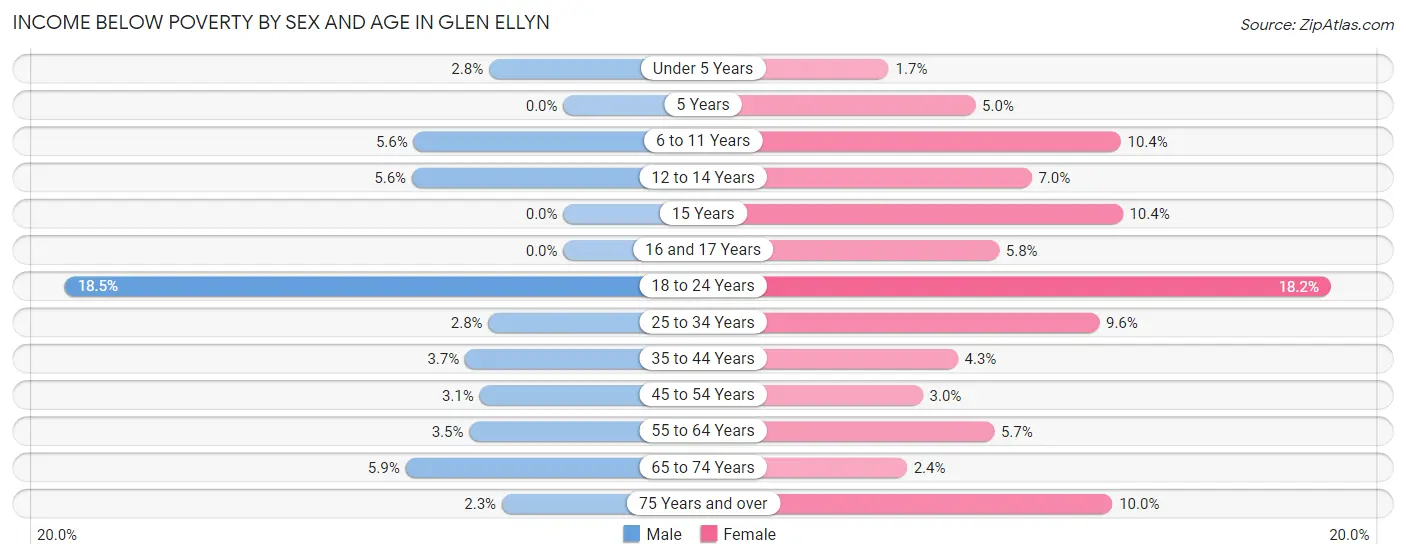
| Age Bracket | Male | Female |
| Under 5 Years | 30 (2.8%) | 14 (1.7%) |
| 5 Years | 0 (0.0%) | 9 (5.0%) |
| 6 to 11 Years | 70 (5.6%) | 127 (10.3%) |
| 12 to 14 Years | 25 (5.6%) | 48 (7.0%) |
| 15 Years | 0 (0.0%) | 25 (10.4%) |
| 16 and 17 Years | 0 (0.0%) | 27 (5.8%) |
| 18 to 24 Years | 203 (18.5%) | 155 (18.1%) |
| 25 to 34 Years | 26 (2.8%) | 116 (9.6%) |
| 35 to 44 Years | 75 (3.6%) | 82 (4.3%) |
| 45 to 54 Years | 57 (3.1%) | 56 (3.0%) |
| 55 to 64 Years | 67 (3.5%) | 109 (5.7%) |
| 65 to 74 Years | 88 (5.9%) | 38 (2.4%) |
| 75 Years and over | 22 (2.3%) | 135 (10.0%) |
| Total | 663 (4.7%) | 941 (6.6%) |
Income Above Poverty by Sex and Age in Glen Ellyn
According to the poverty statistics in Glen Ellyn, males aged 5 years and females aged under 5 years are the age groups that are most secure financially, with 100.0% of males and 98.3% of females in these age groups living above the poverty line.
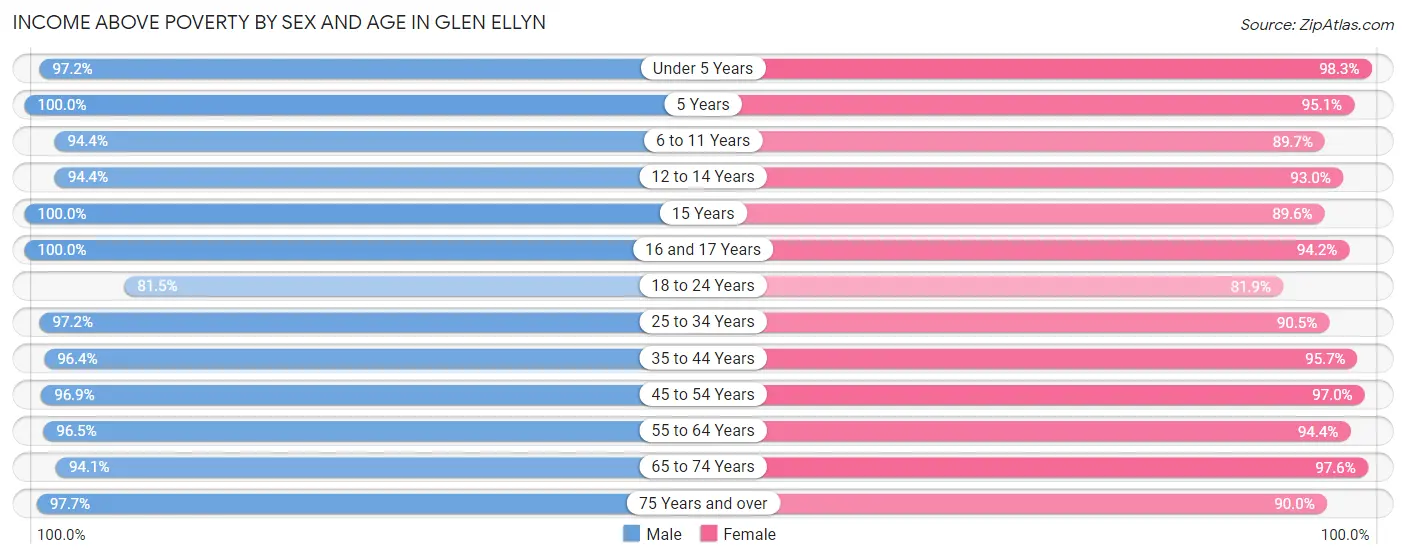
| Age Bracket | Male | Female |
| Under 5 Years | 1,056 (97.2%) | 789 (98.3%) |
| 5 Years | 223 (100.0%) | 173 (95.1%) |
| 6 to 11 Years | 1,188 (94.4%) | 1,100 (89.6%) |
| 12 to 14 Years | 420 (94.4%) | 634 (93.0%) |
| 15 Years | 217 (100.0%) | 215 (89.6%) |
| 16 and 17 Years | 438 (100.0%) | 436 (94.2%) |
| 18 to 24 Years | 894 (81.5%) | 699 (81.9%) |
| 25 to 34 Years | 908 (97.2%) | 1,099 (90.4%) |
| 35 to 44 Years | 1,980 (96.4%) | 1,825 (95.7%) |
| 45 to 54 Years | 1,775 (96.9%) | 1,809 (97.0%) |
| 55 to 64 Years | 1,855 (96.5%) | 1,821 (94.4%) |
| 65 to 74 Years | 1,414 (94.1%) | 1,540 (97.6%) |
| 75 Years and over | 942 (97.7%) | 1,209 (90.0%) |
| Total | 13,310 (95.3%) | 13,349 (93.4%) |
Income Below Poverty Among Married-Couple Families in Glen Ellyn
The poverty statistics for married-couple families in Glen Ellyn show that 1.5% or 97 of the total 6,579 families live below the poverty line. Families with no children have the highest poverty rate of 1.7%, comprising of 59 families. On the other hand, families with 5 or more children have the lowest poverty rate of 0.0%, which includes 0 families.
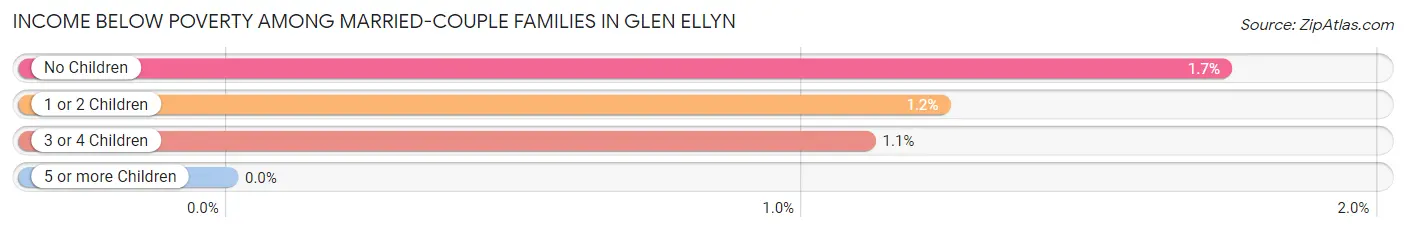
| Children | Above Poverty | Below Poverty |
| No Children | 3,343 (98.3%) | 59 (1.7%) |
| 1 or 2 Children | 2,386 (98.8%) | 30 (1.2%) |
| 3 or 4 Children | 715 (98.9%) | 8 (1.1%) |
| 5 or more Children | 38 (100.0%) | 0 (0.0%) |
| Total | 6,482 (98.5%) | 97 (1.5%) |
Income Below Poverty Among Single-Parent Households in Glen Ellyn
According to the poverty data in Glen Ellyn, 10.1% or 26 single-father households and 21.9% or 192 single-mother households are living below the poverty line. Among single-father households, those with 3 or 4 children have the highest poverty rate, with 15 households (100.0%) experiencing poverty. Likewise, among single-mother households, those with 5 or more children have the highest poverty rate, with 11 households (100.0%) falling below the poverty line.
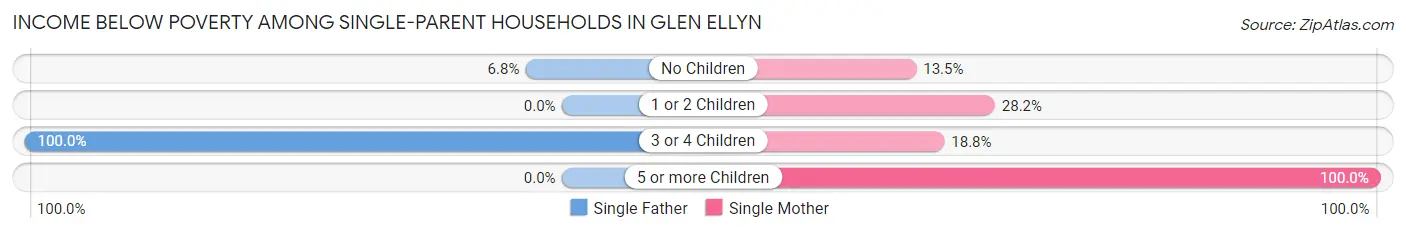
| Children | Single Father | Single Mother |
| No Children | 11 (6.8%) | 54 (13.5%) |
| 1 or 2 Children | 0 (0.0%) | 118 (28.2%) |
| 3 or 4 Children | 15 (100.0%) | 9 (18.8%) |
| 5 or more Children | 0 (0.0%) | 11 (100.0%) |
| Total | 26 (10.1%) | 192 (21.9%) |
Income Below Poverty Among Married-Couple vs Single-Parent Households in Glen Ellyn
The poverty data for Glen Ellyn shows that 97 of the married-couple family households (1.5%) and 218 of the single-parent households (19.2%) are living below the poverty level. Within the married-couple family households, those with no children have the highest poverty rate, with 59 households (1.7%) falling below the poverty line. Among the single-parent households, those with 5 or more children have the highest poverty rate, with 11 household (100.0%) living below poverty.
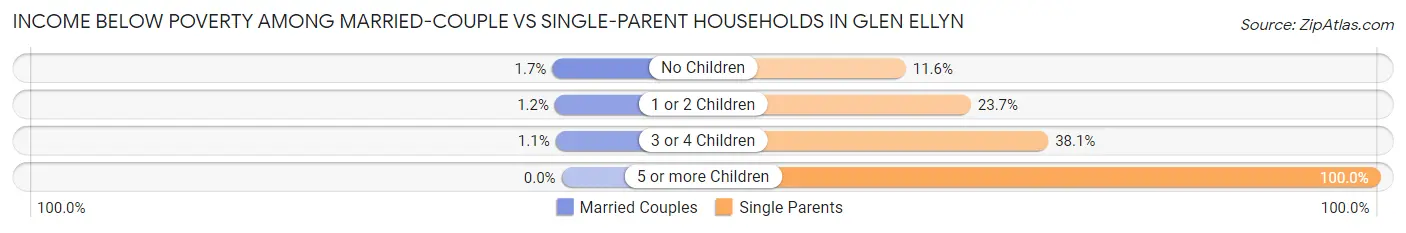
| Children | Married-Couple Families | Single-Parent Households |
| No Children | 59 (1.7%) | 65 (11.6%) |
| 1 or 2 Children | 30 (1.2%) | 118 (23.7%) |
| 3 or 4 Children | 8 (1.1%) | 24 (38.1%) |
| 5 or more Children | 0 (0.0%) | 11 (100.0%) |
| Total | 97 (1.5%) | 218 (19.2%) |
Race in Glen Ellyn
The most populous races in Glen Ellyn are White / Caucasian (23,321 | 82.4%), Asian (2,540 | 9.0%), and Hispanic or Latino (1,543 | 5.4%).
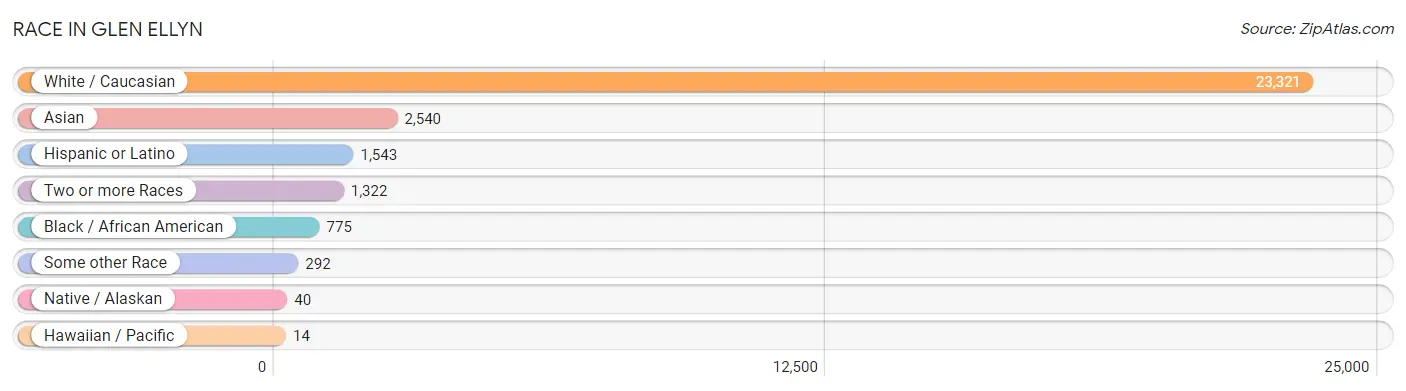
| Race | # Population | % Population |
| Asian | 2,540 | 9.0% |
| Black / African American | 775 | 2.7% |
| Hawaiian / Pacific | 14 | 0.1% |
| Hispanic or Latino | 1,543 | 5.4% |
| Native / Alaskan | 40 | 0.1% |
| White / Caucasian | 23,321 | 82.4% |
| Two or more Races | 1,322 | 4.7% |
| Some other Race | 292 | 1.0% |
| Total | 28,304 | 100.0% |
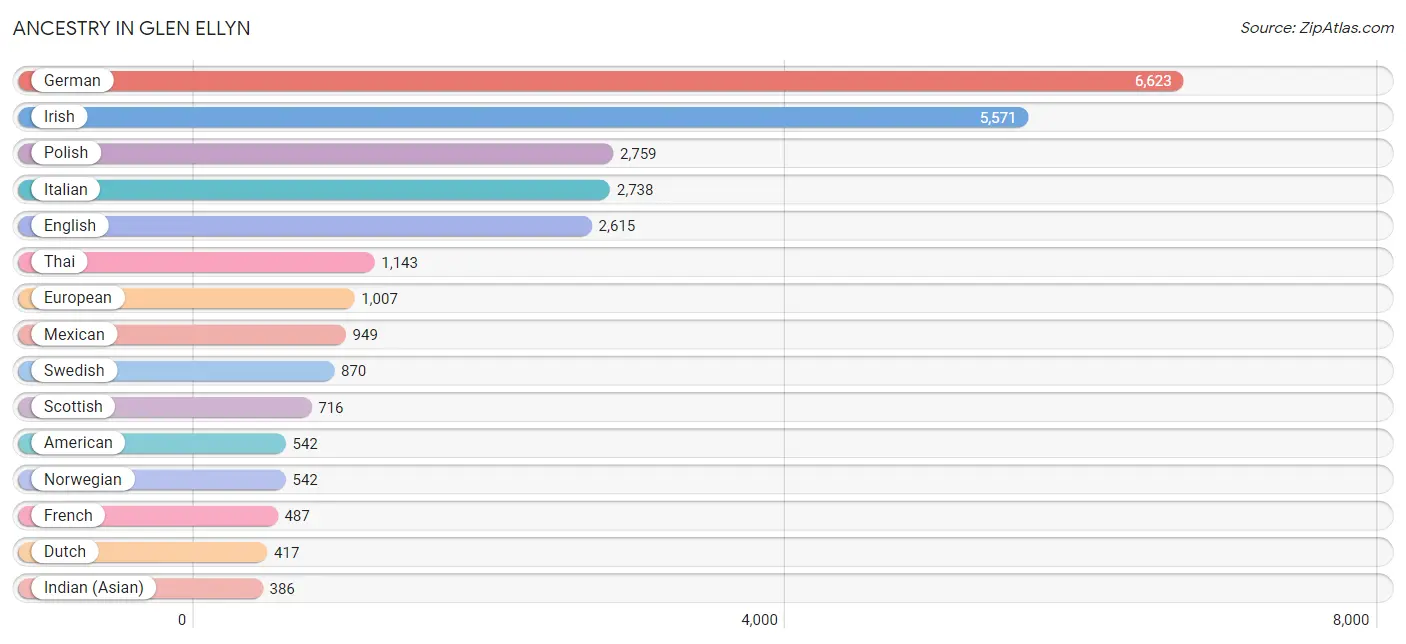
Ancestry in Glen Ellyn
The most populous ancestries reported in Glen Ellyn are German (6,623 | 23.4%), Irish (5,571 | 19.7%), Polish (2,759 | 9.8%), Italian (2,738 | 9.7%), and English (2,615 | 9.2%), together accounting for 71.7% of all Glen Ellyn residents.
| Ancestry | # Population | % Population |
| African | 31 | 0.1% |
| Albanian | 178 | 0.6% |
| American | 542 | 1.9% |
| Apache | 19 | 0.1% |
| Arab | 182 | 0.6% |
| Assyrian / Chaldean / Syriac | 14 | 0.1% |
| Australian | 5 | 0.0% |
| Austrian | 120 | 0.4% |
| Belgian | 30 | 0.1% |
| Bhutanese | 43 | 0.2% |
| Blackfeet | 6 | 0.0% |
| Brazilian | 40 | 0.1% |
| British | 115 | 0.4% |
| Bulgarian | 10 | 0.0% |
| Burmese | 198 | 0.7% |
| Canadian | 56 | 0.2% |
| Central American | 57 | 0.2% |
| Central American Indian | 23 | 0.1% |
| Cherokee | 44 | 0.2% |
| Chippewa | 7 | 0.0% |
| Choctaw | 7 | 0.0% |
| Colombian | 33 | 0.1% |
| Croatian | 89 | 0.3% |
| Cuban | 115 | 0.4% |
| Czech | 308 | 1.1% |
| Czechoslovakian | 41 | 0.1% |
| Danish | 212 | 0.7% |
| Dutch | 417 | 1.5% |
| Eastern European | 135 | 0.5% |
| English | 2,615 | 9.2% |
| Estonian | 9 | 0.0% |
| European | 1,007 | 3.6% |
| Filipino | 56 | 0.2% |
| Finnish | 25 | 0.1% |
| French | 487 | 1.7% |
| French Canadian | 107 | 0.4% |
| German | 6,623 | 23.4% |
| Greek | 176 | 0.6% |
| Guatemalan | 28 | 0.1% |
| Hungarian | 110 | 0.4% |
| Indian (Asian) | 386 | 1.4% |
| Indonesian | 247 | 0.9% |
| Inupiat | 34 | 0.1% |
| Iranian | 110 | 0.4% |
| Iraqi | 36 | 0.1% |
| Irish | 5,571 | 19.7% |
| Iroquois | 24 | 0.1% |
| Israeli | 284 | 1.0% |
| Italian | 2,738 | 9.7% |
| Jamaican | 1 | 0.0% |
| Korean | 282 | 1.0% |
| Laotian | 31 | 0.1% |
| Latvian | 23 | 0.1% |
| Lebanese | 37 | 0.1% |
| Lithuanian | 328 | 1.2% |
| Luxembourger | 43 | 0.2% |
| Mexican | 949 | 3.4% |
| Native Hawaiian | 49 | 0.2% |
| Nigerian | 12 | 0.0% |
| Northern European | 11 | 0.0% |
| Norwegian | 542 | 1.9% |
| Pakistani | 63 | 0.2% |
| Palestinian | 70 | 0.3% |
| Panamanian | 28 | 0.1% |
| Peruvian | 30 | 0.1% |
| Polish | 2,759 | 9.8% |
| Portuguese | 78 | 0.3% |
| Puerto Rican | 178 | 0.6% |
| Romanian | 31 | 0.1% |
| Russian | 172 | 0.6% |
| Salvadoran | 1 | 0.0% |
| Samoan | 14 | 0.1% |
| Scandinavian | 73 | 0.3% |
| Scotch-Irish | 328 | 1.2% |
| Scottish | 716 | 2.5% |
| Slavic | 31 | 0.1% |
| Slovak | 109 | 0.4% |
| Slovene | 47 | 0.2% |
| South African | 7 | 0.0% |
| South American | 74 | 0.3% |
| Spaniard | 37 | 0.1% |
| Spanish | 85 | 0.3% |
| Subsaharan African | 95 | 0.3% |
| Swedish | 870 | 3.1% |
| Swiss | 98 | 0.4% |
| Syrian | 22 | 0.1% |
| Thai | 1,143 | 4.0% |
| Ukrainian | 178 | 0.6% |
| Venezuelan | 11 | 0.0% |
| Welsh | 99 | 0.4% |
| Yugoslavian | 44 | 0.2% | View All 91 Rows |
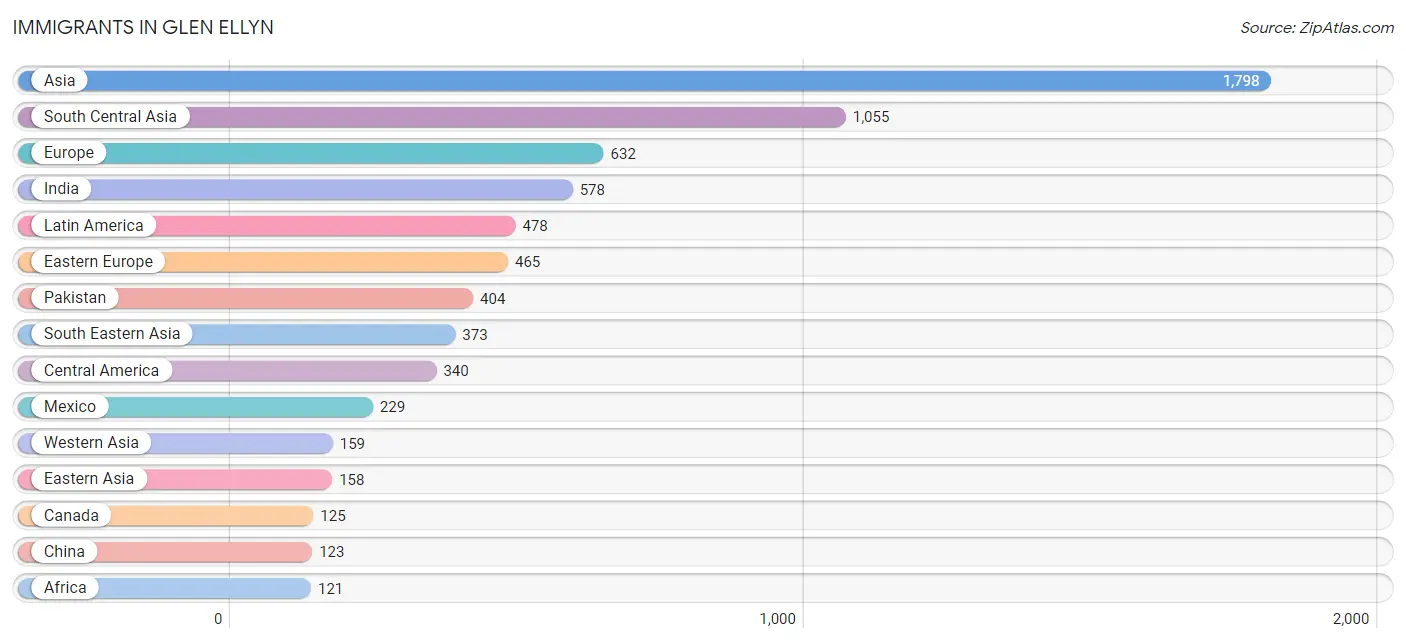
Immigrants in Glen Ellyn
The most numerous immigrant groups reported in Glen Ellyn came from Asia (1,798 | 6.4%), South Central Asia (1,055 | 3.7%), Europe (632 | 2.2%), India (578 | 2.0%), and Latin America (478 | 1.7%), together accounting for 16.0% of all Glen Ellyn residents.
| Immigration Origin | # Population | % Population |
| Africa | 121 | 0.4% |
| Albania | 110 | 0.4% |
| Argentina | 11 | 0.0% |
| Asia | 1,798 | 6.4% |
| Austria | 16 | 0.1% |
| Bosnia and Herzegovina | 29 | 0.1% |
| Brazil | 58 | 0.2% |
| Bulgaria | 10 | 0.0% |
| Canada | 125 | 0.4% |
| Caribbean | 45 | 0.2% |
| Central America | 340 | 1.2% |
| China | 123 | 0.4% |
| Colombia | 24 | 0.1% |
| Croatia | 9 | 0.0% |
| Cuba | 45 | 0.2% |
| Czechoslovakia | 28 | 0.1% |
| Eastern Africa | 29 | 0.1% |
| Eastern Asia | 158 | 0.6% |
| Eastern Europe | 465 | 1.6% |
| Egypt | 9 | 0.0% |
| England | 27 | 0.1% |
| Europe | 632 | 2.2% |
| Germany | 36 | 0.1% |
| Guatemala | 28 | 0.1% |
| India | 578 | 2.0% |
| Iran | 73 | 0.3% |
| Iraq | 55 | 0.2% |
| Ireland | 14 | 0.1% |
| Israel | 6 | 0.0% |
| Italy | 48 | 0.2% |
| Japan | 12 | 0.0% |
| Korea | 23 | 0.1% |
| Kuwait | 11 | 0.0% |
| Laos | 3 | 0.0% |
| Latin America | 478 | 1.7% |
| Lithuania | 30 | 0.1% |
| Mexico | 229 | 0.8% |
| Middle Africa | 45 | 0.2% |
| Netherlands | 5 | 0.0% |
| Northern Africa | 9 | 0.0% |
| Northern Europe | 46 | 0.2% |
| Norway | 5 | 0.0% |
| Pakistan | 404 | 1.4% |
| Panama | 83 | 0.3% |
| Philippines | 47 | 0.2% |
| Poland | 84 | 0.3% |
| Romania | 10 | 0.0% |
| Russia | 15 | 0.1% |
| Saudi Arabia | 55 | 0.2% |
| Singapore | 21 | 0.1% |
| South Africa | 7 | 0.0% |
| South America | 93 | 0.3% |
| South Central Asia | 1,055 | 3.7% |
| South Eastern Asia | 373 | 1.3% |
| Southern Europe | 48 | 0.2% |
| Switzerland | 16 | 0.1% |
| Syria | 32 | 0.1% |
| Taiwan | 19 | 0.1% |
| Thailand | 63 | 0.2% |
| Ukraine | 116 | 0.4% |
| Western Africa | 31 | 0.1% |
| Western Asia | 159 | 0.6% |
| Western Europe | 73 | 0.3% |
| Zaire | 45 | 0.2% |
| Zimbabwe | 22 | 0.1% | View All 65 Rows |
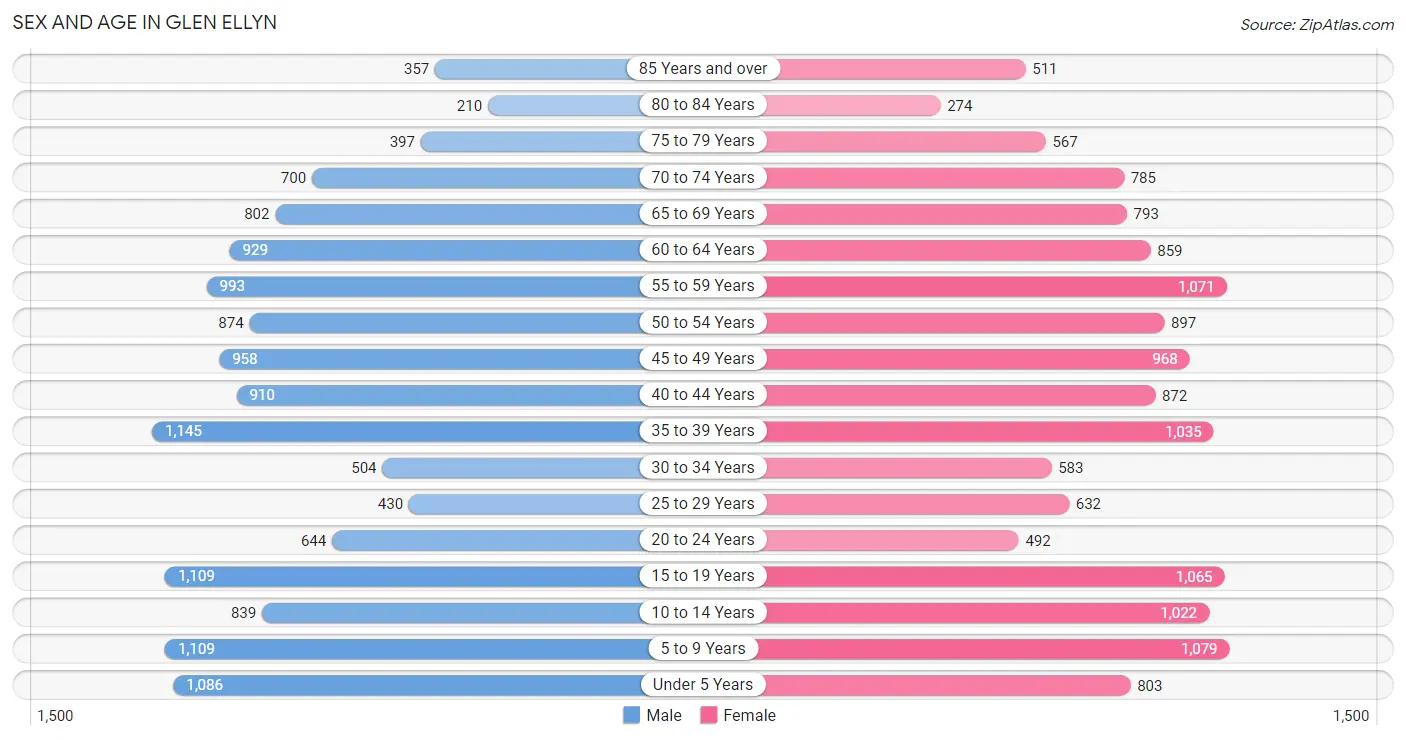
Sex and Age in Glen Ellyn
Sex and Age in Glen Ellyn
The most populous age groups in Glen Ellyn are 35 to 39 Years (1,145 | 8.2%) for men and 5 to 9 Years (1,079 | 7.5%) for women.
| Age Bracket | Male | Female |
| Under 5 Years | 1,086 (7.8%) | 803 (5.6%) |
| 5 to 9 Years | 1,109 (7.9%) | 1,079 (7.5%) |
| 10 to 14 Years | 839 (6.0%) | 1,022 (7.1%) |
| 15 to 19 Years | 1,109 (7.9%) | 1,065 (7.4%) |
| 20 to 24 Years | 644 (4.6%) | 492 (3.4%) |
| 25 to 29 Years | 430 (3.1%) | 632 (4.4%) |
| 30 to 34 Years | 504 (3.6%) | 583 (4.1%) |
| 35 to 39 Years | 1,145 (8.2%) | 1,035 (7.2%) |
| 40 to 44 Years | 910 (6.5%) | 872 (6.1%) |
| 45 to 49 Years | 958 (6.8%) | 968 (6.8%) |
| 50 to 54 Years | 874 (6.2%) | 897 (6.3%) |
| 55 to 59 Years | 993 (7.1%) | 1,071 (7.5%) |
| 60 to 64 Years | 929 (6.6%) | 859 (6.0%) |
| 65 to 69 Years | 802 (5.7%) | 793 (5.5%) |
| 70 to 74 Years | 700 (5.0%) | 785 (5.5%) |
| 75 to 79 Years | 397 (2.8%) | 567 (4.0%) |
| 80 to 84 Years | 210 (1.5%) | 274 (1.9%) |
| 85 Years and over | 357 (2.5%) | 511 (3.6%) |
| Total | 13,996 (100.0%) | 14,308 (100.0%) |
Families and Households in Glen Ellyn
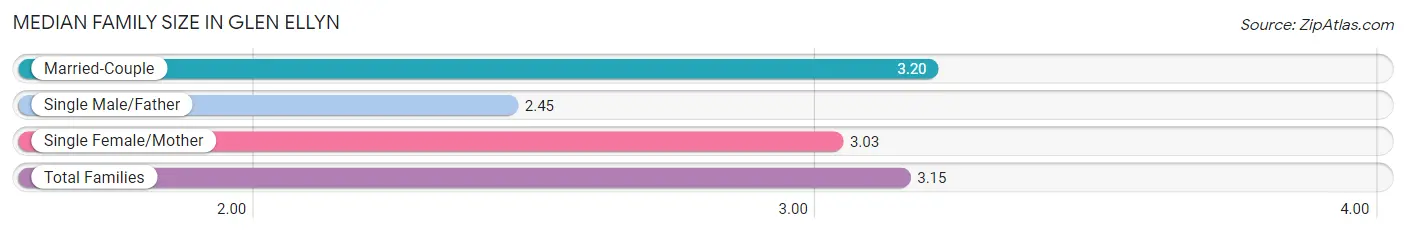
Median Family Size in Glen Ellyn
The median family size in Glen Ellyn is 3.15 persons per family, with married-couple families (6,579 | 85.3%) accounting for the largest median family size of 3.2 persons per family. On the other hand, single male/father families (257 | 3.3%) represent the smallest median family size with 2.45 persons per family.
| Family Type | # Families | Family Size |
| Married-Couple | 6,579 (85.3%) | 3.20 |
| Single Male/Father | 257 (3.3%) | 2.45 |
| Single Female/Mother | 877 (11.4%) | 3.03 |
| Total Families | 7,713 (100.0%) | 3.15 |
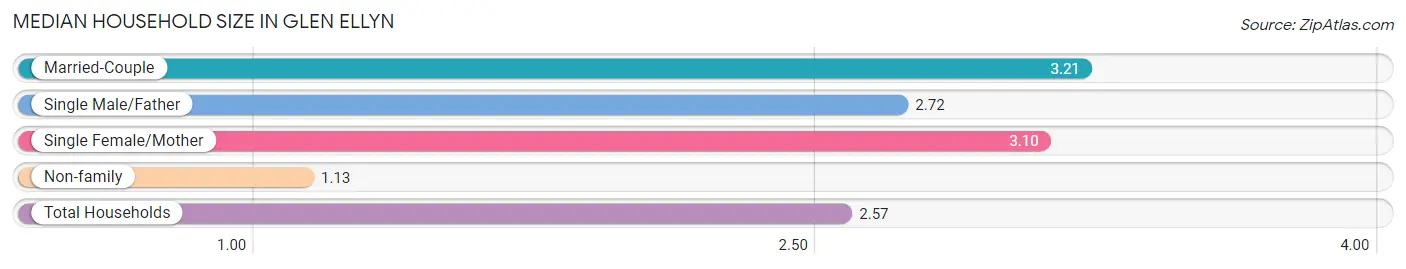
Median Household Size in Glen Ellyn
The median household size in Glen Ellyn is 2.57 persons per household, with married-couple households (6,579 | 59.9%) accounting for the largest median household size of 3.21 persons per household. non-family households (3,268 | 29.8%) represent the smallest median household size with 1.13 persons per household.
| Household Type | # Households | Household Size |
| Married-Couple | 6,579 (59.9%) | 3.21 |
| Single Male/Father | 257 (2.3%) | 2.72 |
| Single Female/Mother | 877 (8.0%) | 3.10 |
| Non-family | 3,268 (29.8%) | 1.13 |
| Total Households | 10,981 (100.0%) | 2.57 |
Household Size by Marriage Status in Glen Ellyn
Out of a total of 10,981 households in Glen Ellyn, 7,713 (70.2%) are family households, while 3,268 (29.8%) are nonfamily households. The most numerous type of family households are 2-person households, comprising 3,361, and the most common type of nonfamily households are 1-person households, comprising 2,934.
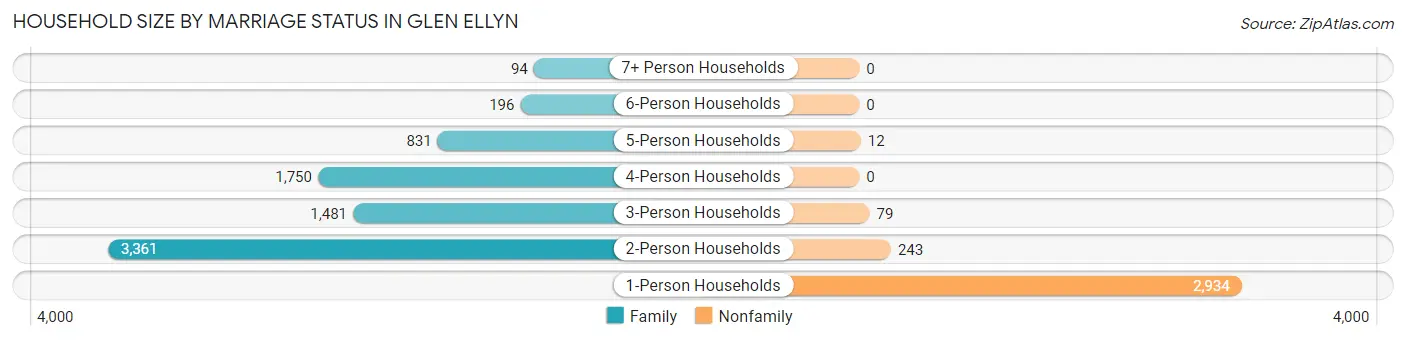
| Household Size | Family Households | Nonfamily Households |
| 1-Person Households | - | 2,934 (26.7%) |
| 2-Person Households | 3,361 (30.6%) | 243 (2.2%) |
| 3-Person Households | 1,481 (13.5%) | 79 (0.7%) |
| 4-Person Households | 1,750 (15.9%) | 0 (0.0%) |
| 5-Person Households | 831 (7.6%) | 12 (0.1%) |
| 6-Person Households | 196 (1.8%) | 0 (0.0%) |
| 7+ Person Households | 94 (0.9%) | 0 (0.0%) |
| Total | 7,713 (70.2%) | 3,268 (29.8%) |
Female Fertility in Glen Ellyn
Fertility by Age in Glen Ellyn
Average fertility rate in Glen Ellyn is 56.0 births per 1,000 women. Women in the age bracket of 20 to 34 years have the highest fertility rate with 120.0 births per 1,000 women. Women in the age bracket of 20 to 34 years acount for 62.5% of all women with births.
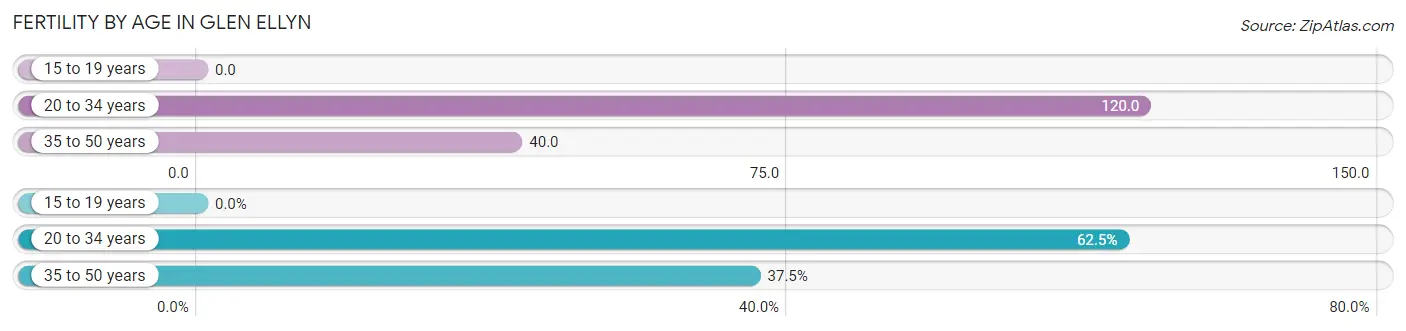
| Age Bracket | Women with Births | Births / 1,000 Women |
| 15 to 19 years | 0 (0.0%) | 0.0 |
| 20 to 34 years | 205 (62.5%) | 120.0 |
| 35 to 50 years | 123 (37.5%) | 40.0 |
| Total | 328 (100.0%) | 56.0 |
Fertility by Age by Marriage Status in Glen Ellyn
94.5% of women with births (328) in Glen Ellyn are married. The highest percentage of unmarried women with births falls into 35 to 50 years age bracket with 14.6% of them unmarried at the time of birth, while the lowest percentage of unmarried women with births belong to 20 to 34 years age bracket with 0.0% of them unmarried.
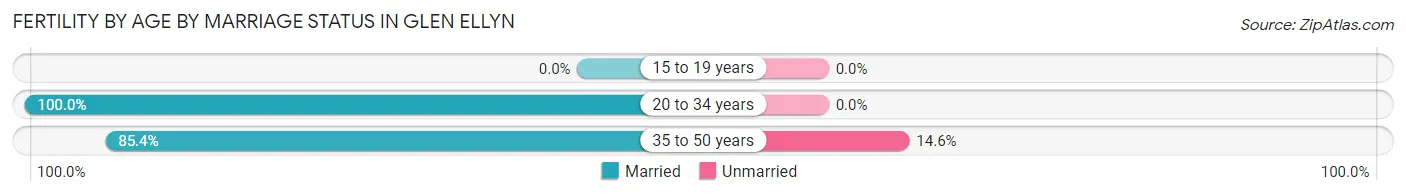
| Age Bracket | Married | Unmarried |
| 15 to 19 years | 0 (0.0%) | 0 (0.0%) |
| 20 to 34 years | 205 (100.0%) | 0 (0.0%) |
| 35 to 50 years | 105 (85.4%) | 18 (14.6%) |
| Total | 310 (94.5%) | 18 (5.5%) |
Fertility by Education in Glen Ellyn
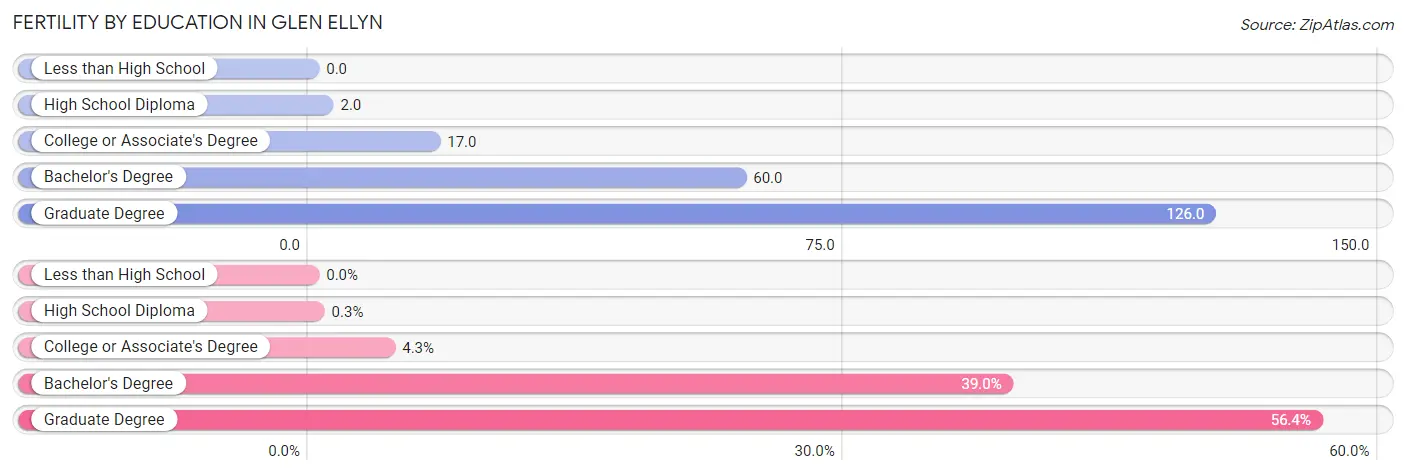
| Educational Attainment | Women with Births | Births / 1,000 Women |
| Less than High School | 0 (0.0%) | 0.0 |
| High School Diploma | 1 (0.3%) | 2.0 |
| College or Associate's Degree | 14 (4.3%) | 17.0 |
| Bachelor's Degree | 128 (39.0%) | 60.0 |
| Graduate Degree | 185 (56.4%) | 126.0 |
| Total | 328 (100.0%) | 56.0 |
Fertility by Education by Marriage Status in Glen Ellyn
5.5% of women with births in Glen Ellyn are unmarried. Women with the educational attainment of high school diploma are most likely to be married with 100.0% of them married at childbirth, while women with the educational attainment of bachelor's degree are least likely to be married with 14.1% of them unmarried at childbirth.
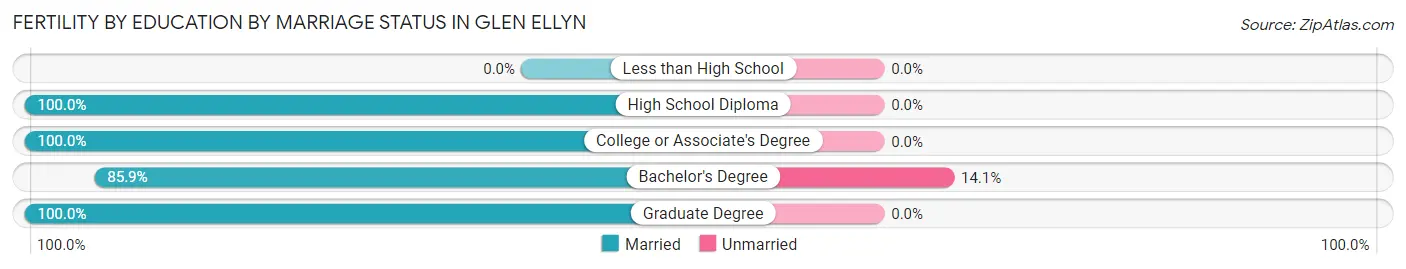
| Educational Attainment | Married | Unmarried |
| Less than High School | 0 (0.0%) | 0 (0.0%) |
| High School Diploma | 1 (100.0%) | 0 (0.0%) |
| College or Associate's Degree | 14 (100.0%) | 0 (0.0%) |
| Bachelor's Degree | 110 (85.9%) | 18 (14.1%) |
| Graduate Degree | 185 (100.0%) | 0 (0.0%) |
| Total | 310 (94.5%) | 18 (5.5%) |
Employment Characteristics in Glen Ellyn
Employment by Class of Employer in Glen Ellyn
Among the 13,139 employed individuals in Glen Ellyn, private company employees (9,378 | 71.4%), not-for-profit organizations (1,170 | 8.9%), and local government employees (899 | 6.8%) make up the most common classes of employment.
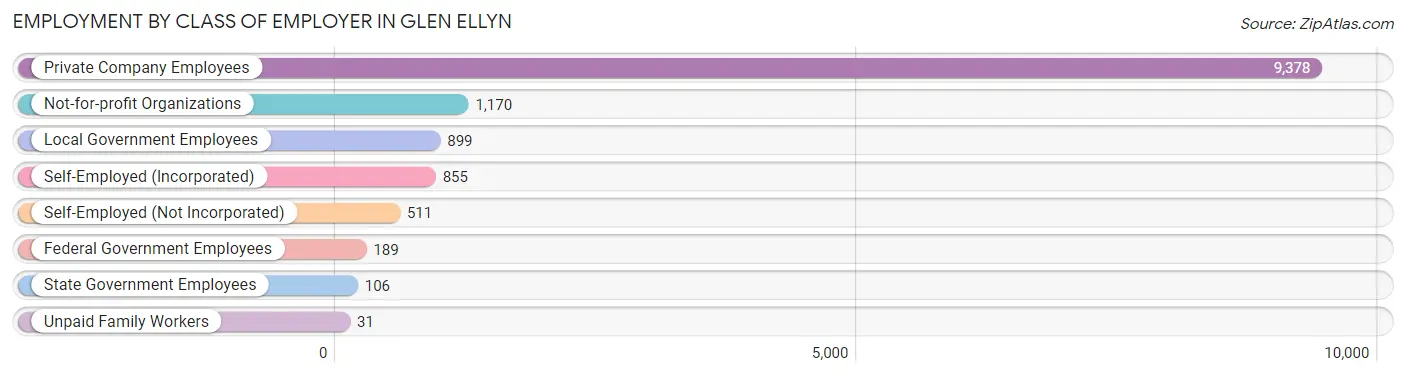
| Employer Class | # Employees | % Employees |
| Private Company Employees | 9,378 | 71.4% |
| Self-Employed (Incorporated) | 855 | 6.5% |
| Self-Employed (Not Incorporated) | 511 | 3.9% |
| Not-for-profit Organizations | 1,170 | 8.9% |
| Local Government Employees | 899 | 6.8% |
| State Government Employees | 106 | 0.8% |
| Federal Government Employees | 189 | 1.4% |
| Unpaid Family Workers | 31 | 0.2% |
| Total | 13,139 | 100.0% |
Employment Status by Age in Glen Ellyn
According to the labor force statistics for Glen Ellyn, out of the total population over 16 years of age (21,909), 63.8% or 13,978 individuals are in the labor force, with 5.1% or 713 of them unemployed. The age group with the highest labor force participation rate is 45 to 54 years, with 88.4% or 3,268 individuals in the labor force. Within the labor force, the 25 to 29 years age range has the highest percentage of unemployed individuals, with 9.2% or 82 of them being unemployed.
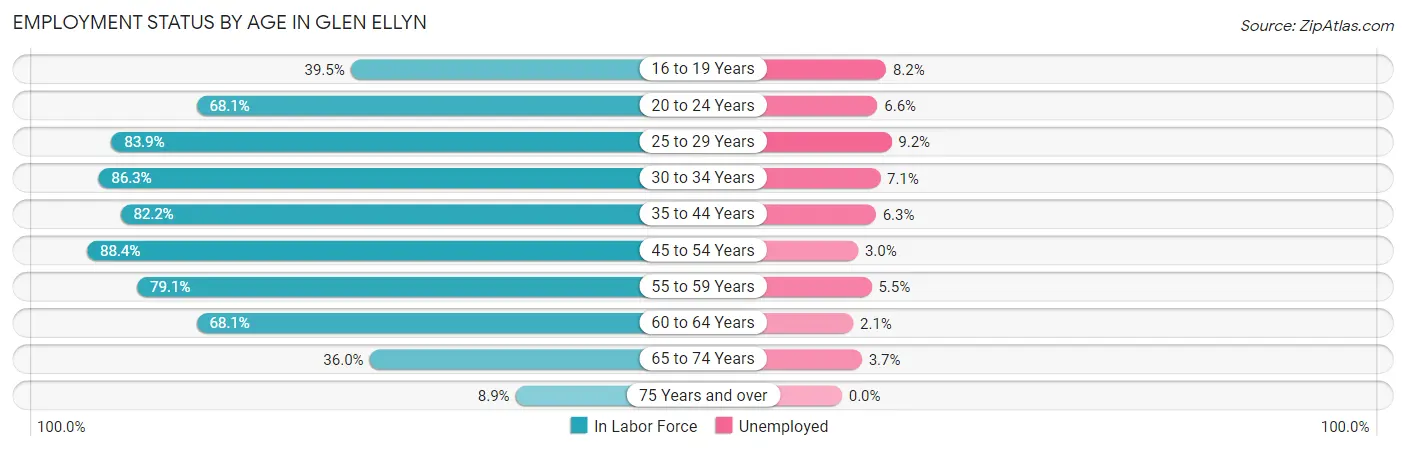
| Age Bracket | In Labor Force | Unemployed |
| 16 to 19 Years | 678 (39.5%) | 56 (8.2%) |
| 20 to 24 Years | 774 (68.1%) | 51 (6.6%) |
| 25 to 29 Years | 891 (83.9%) | 82 (9.2%) |
| 30 to 34 Years | 938 (86.3%) | 67 (7.1%) |
| 35 to 44 Years | 3,257 (82.2%) | 205 (6.3%) |
| 45 to 54 Years | 3,268 (88.4%) | 98 (3.0%) |
| 55 to 59 Years | 1,633 (79.1%) | 90 (5.5%) |
| 60 to 64 Years | 1,218 (68.1%) | 26 (2.1%) |
| 65 to 74 Years | 1,109 (36.0%) | 41 (3.7%) |
| 75 Years and over | 206 (8.9%) | 0 (0.0%) |
| Total | 13,978 (63.8%) | 713 (5.1%) |
Employment Status by Educational Attainment in Glen Ellyn
According to labor force statistics for Glen Ellyn, 82.0% of individuals (11,201) out of the total population between 25 and 64 years of age (13,660) are in the labor force, with 5.1% or 571 of them being unemployed. The group with the highest labor force participation rate are those with the educational attainment of bachelor's degree or higher, with 84.6% or 8,639 individuals in the labor force. Within the labor force, individuals with bachelor's degree or higher education have the highest percentage of unemployment, with 5.4% or 467 of them being unemployed.
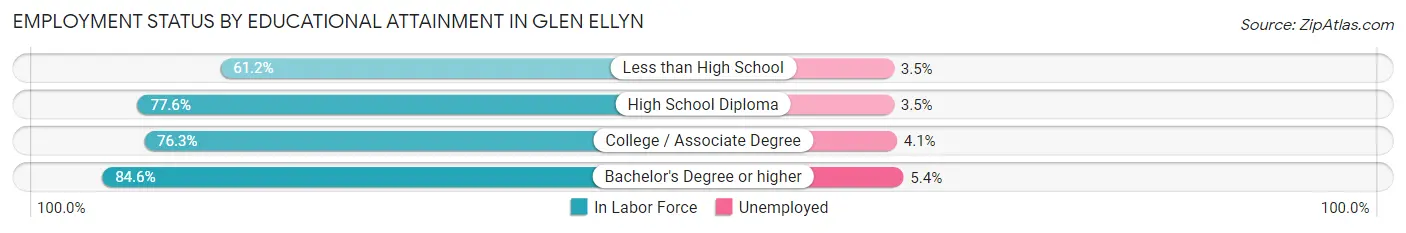
| Educational Attainment | In Labor Force | Unemployed |
| Less than High School | 312 (61.2%) | 18 (3.5%) |
| High School Diploma | 805 (77.6%) | 36 (3.5%) |
| College / Associate Degree | 1,451 (76.3%) | 78 (4.1%) |
| Bachelor's Degree or higher | 8,639 (84.6%) | 551 (5.4%) |
| Total | 11,201 (82.0%) | 697 (5.1%) |
Employment Occupations by Sex in Glen Ellyn
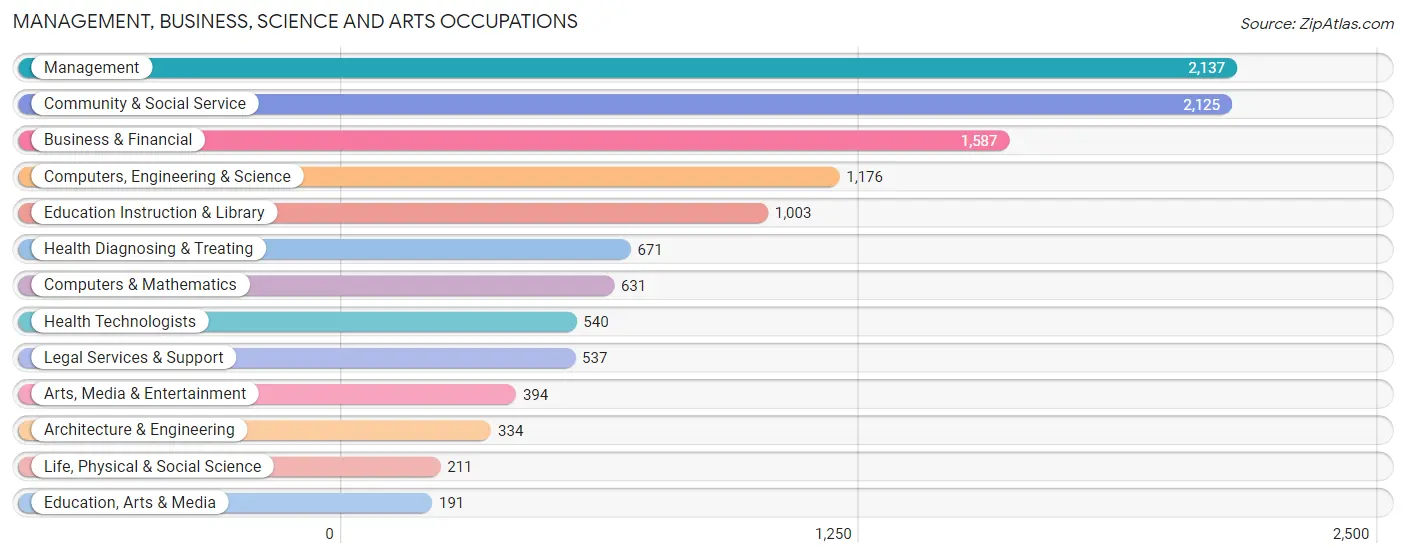
Management, Business, Science and Arts Occupations
The most common Management, Business, Science and Arts occupations in Glen Ellyn are Management (2,137 | 16.1%), Community & Social Service (2,125 | 16.0%), Business & Financial (1,587 | 12.0%), Computers, Engineering & Science (1,176 | 8.9%), and Education Instruction & Library (1,003 | 7.6%).
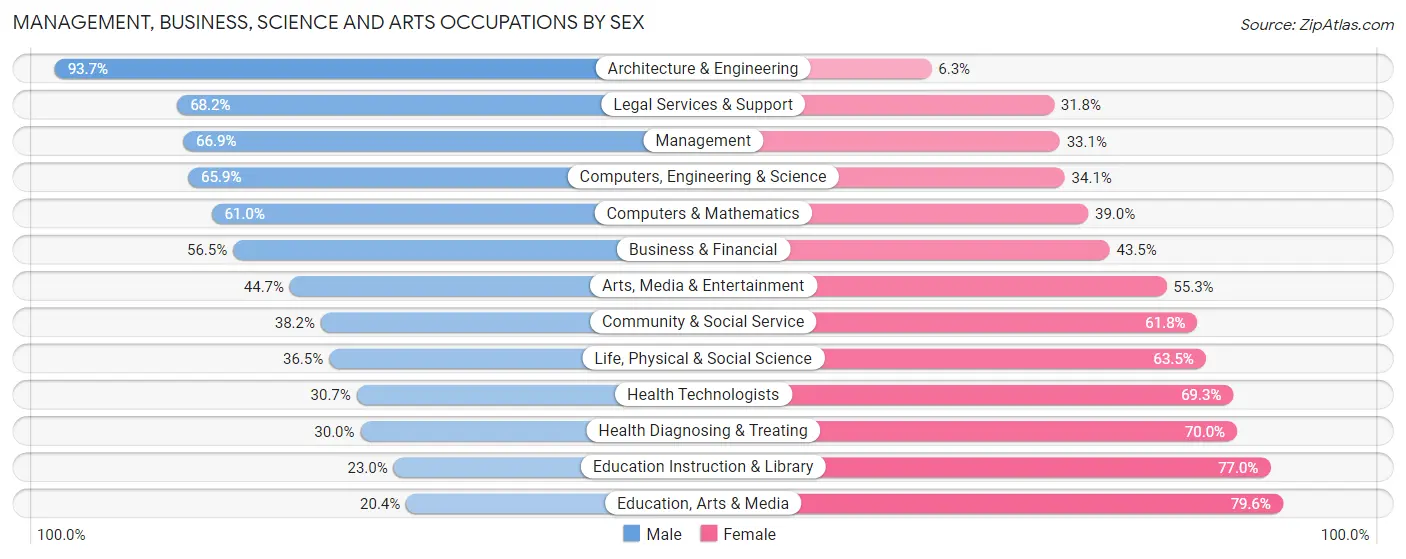
Management, Business, Science and Arts Occupations by Sex
Within the Management, Business, Science and Arts occupations in Glen Ellyn, the most male-oriented occupations are Architecture & Engineering (93.7%), Legal Services & Support (68.2%), and Management (66.9%), while the most female-oriented occupations are Education, Arts & Media (79.6%), Education Instruction & Library (77.0%), and Health Diagnosing & Treating (70.0%).
| Occupation | Male | Female |
| Management | 1,430 (66.9%) | 707 (33.1%) |
| Business & Financial | 897 (56.5%) | 690 (43.5%) |
| Computers, Engineering & Science | 775 (65.9%) | 401 (34.1%) |
| Computers & Mathematics | 385 (61.0%) | 246 (39.0%) |
| Architecture & Engineering | 313 (93.7%) | 21 (6.3%) |
| Life, Physical & Social Science | 77 (36.5%) | 134 (63.5%) |
| Community & Social Service | 812 (38.2%) | 1,313 (61.8%) |
| Education, Arts & Media | 39 (20.4%) | 152 (79.6%) |
| Legal Services & Support | 366 (68.2%) | 171 (31.8%) |
| Education Instruction & Library | 231 (23.0%) | 772 (77.0%) |
| Arts, Media & Entertainment | 176 (44.7%) | 218 (55.3%) |
| Health Diagnosing & Treating | 201 (30.0%) | 470 (70.0%) |
| Health Technologists | 166 (30.7%) | 374 (69.3%) |
| Total (Category) | 4,115 (53.5%) | 3,581 (46.5%) |
| Total (Overall) | 7,191 (54.2%) | 6,067 (45.8%) |
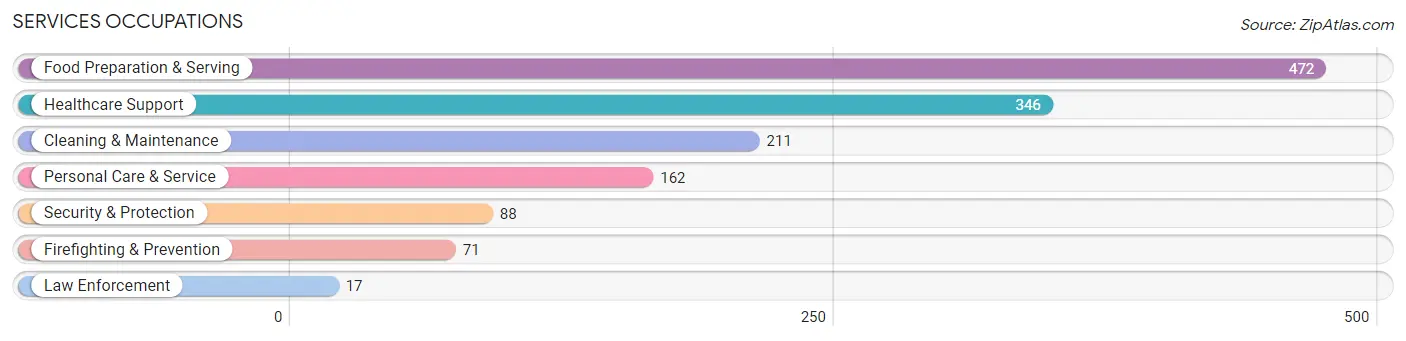
Services Occupations
The most common Services occupations in Glen Ellyn are Food Preparation & Serving (472 | 3.6%), Healthcare Support (346 | 2.6%), Cleaning & Maintenance (211 | 1.6%), Personal Care & Service (162 | 1.2%), and Security & Protection (88 | 0.7%).
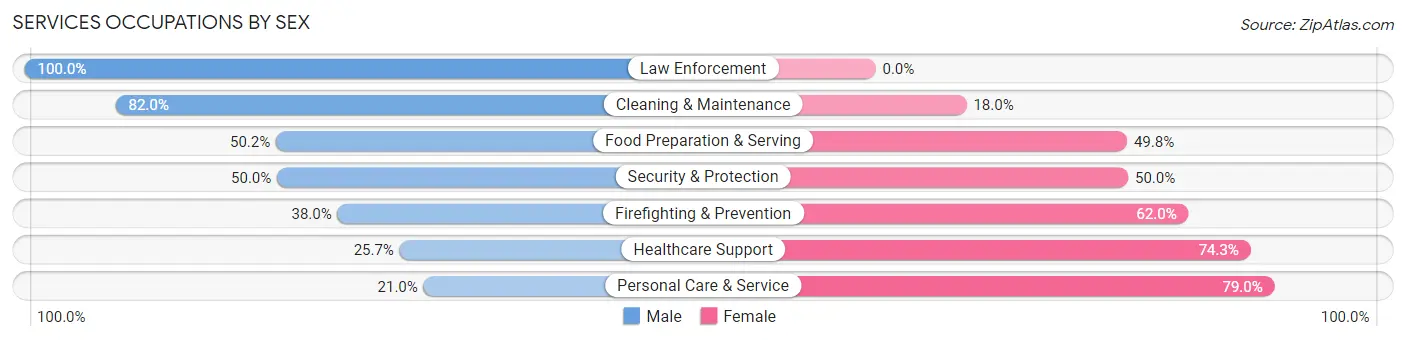
Services Occupations by Sex
Within the Services occupations in Glen Ellyn, the most male-oriented occupations are Law Enforcement (100.0%), Cleaning & Maintenance (82.0%), and Food Preparation & Serving (50.2%), while the most female-oriented occupations are Personal Care & Service (79.0%), Healthcare Support (74.3%), and Firefighting & Prevention (62.0%).
| Occupation | Male | Female |
| Healthcare Support | 89 (25.7%) | 257 (74.3%) |
| Security & Protection | 44 (50.0%) | 44 (50.0%) |
| Firefighting & Prevention | 27 (38.0%) | 44 (62.0%) |
| Law Enforcement | 17 (100.0%) | 0 (0.0%) |
| Food Preparation & Serving | 237 (50.2%) | 235 (49.8%) |
| Cleaning & Maintenance | 173 (82.0%) | 38 (18.0%) |
| Personal Care & Service | 34 (21.0%) | 128 (79.0%) |
| Total (Category) | 577 (45.1%) | 702 (54.9%) |
| Total (Overall) | 7,191 (54.2%) | 6,067 (45.8%) |
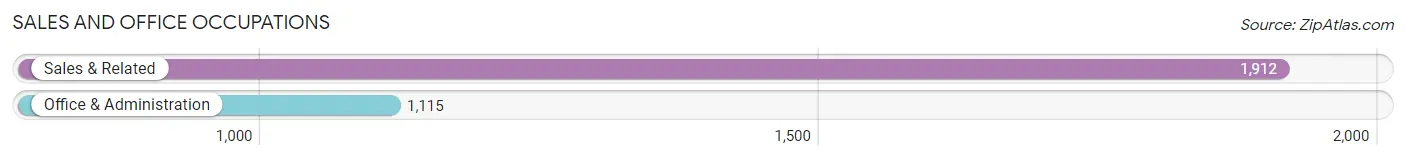
Sales and Office Occupations
The most common Sales and Office occupations in Glen Ellyn are Sales & Related (1,912 | 14.4%), and Office & Administration (1,115 | 8.4%).
Sales and Office Occupations by Sex
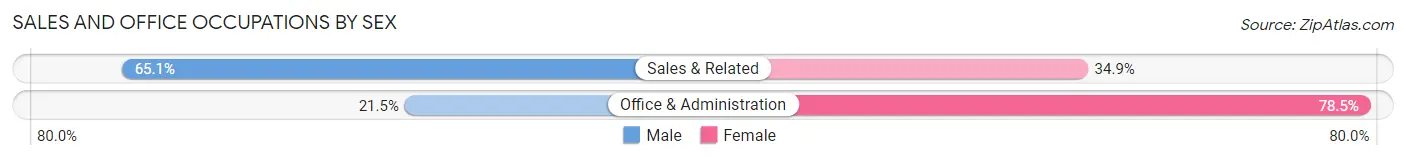
| Occupation | Male | Female |
| Sales & Related | 1,244 (65.1%) | 668 (34.9%) |
| Office & Administration | 240 (21.5%) | 875 (78.5%) |
| Total (Category) | 1,484 (49.0%) | 1,543 (51.0%) |
| Total (Overall) | 7,191 (54.2%) | 6,067 (45.8%) |
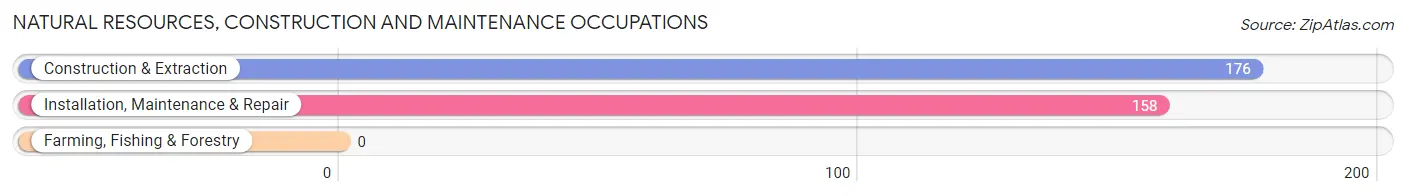
Natural Resources, Construction and Maintenance Occupations
The most common Natural Resources, Construction and Maintenance occupations in Glen Ellyn are Construction & Extraction (176 | 1.3%), and Installation, Maintenance & Repair (158 | 1.2%).
Natural Resources, Construction and Maintenance Occupations by Sex
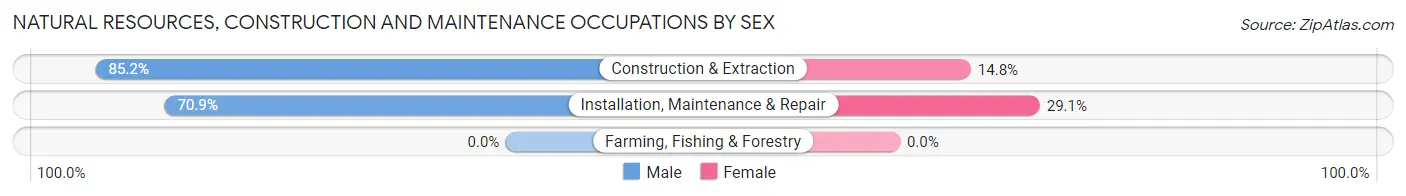
| Occupation | Male | Female |
| Farming, Fishing & Forestry | 0 (0.0%) | 0 (0.0%) |
| Construction & Extraction | 150 (85.2%) | 26 (14.8%) |
| Installation, Maintenance & Repair | 112 (70.9%) | 46 (29.1%) |
| Total (Category) | 262 (78.4%) | 72 (21.6%) |
| Total (Overall) | 7,191 (54.2%) | 6,067 (45.8%) |
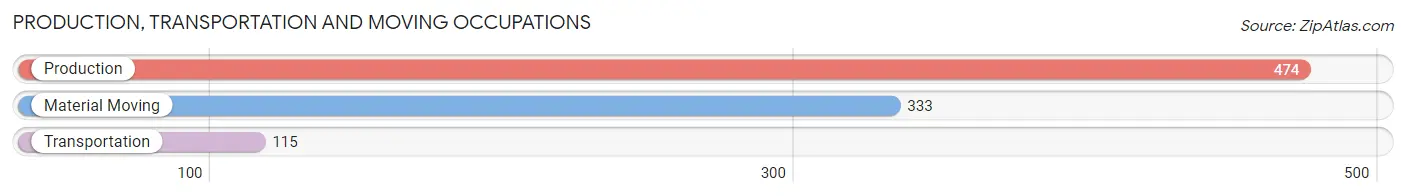
Production, Transportation and Moving Occupations
The most common Production, Transportation and Moving occupations in Glen Ellyn are Production (474 | 3.6%), Material Moving (333 | 2.5%), and Transportation (115 | 0.9%).
Production, Transportation and Moving Occupations by Sex
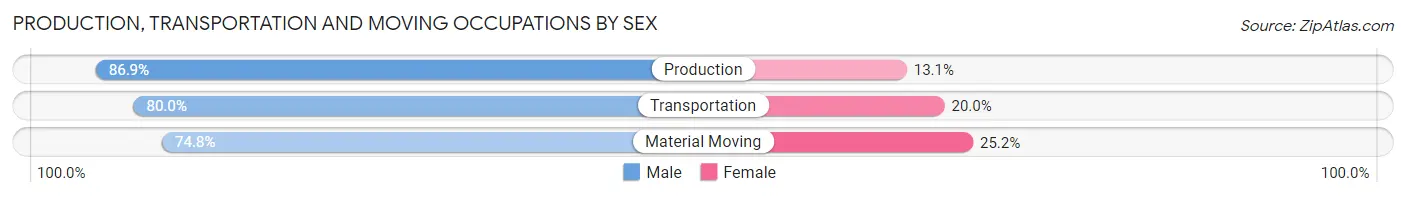
| Occupation | Male | Female |
| Production | 412 (86.9%) | 62 (13.1%) |
| Transportation | 92 (80.0%) | 23 (20.0%) |
| Material Moving | 249 (74.8%) | 84 (25.2%) |
| Total (Category) | 753 (81.7%) | 169 (18.3%) |
| Total (Overall) | 7,191 (54.2%) | 6,067 (45.8%) |
Employment Industries by Sex in Glen Ellyn
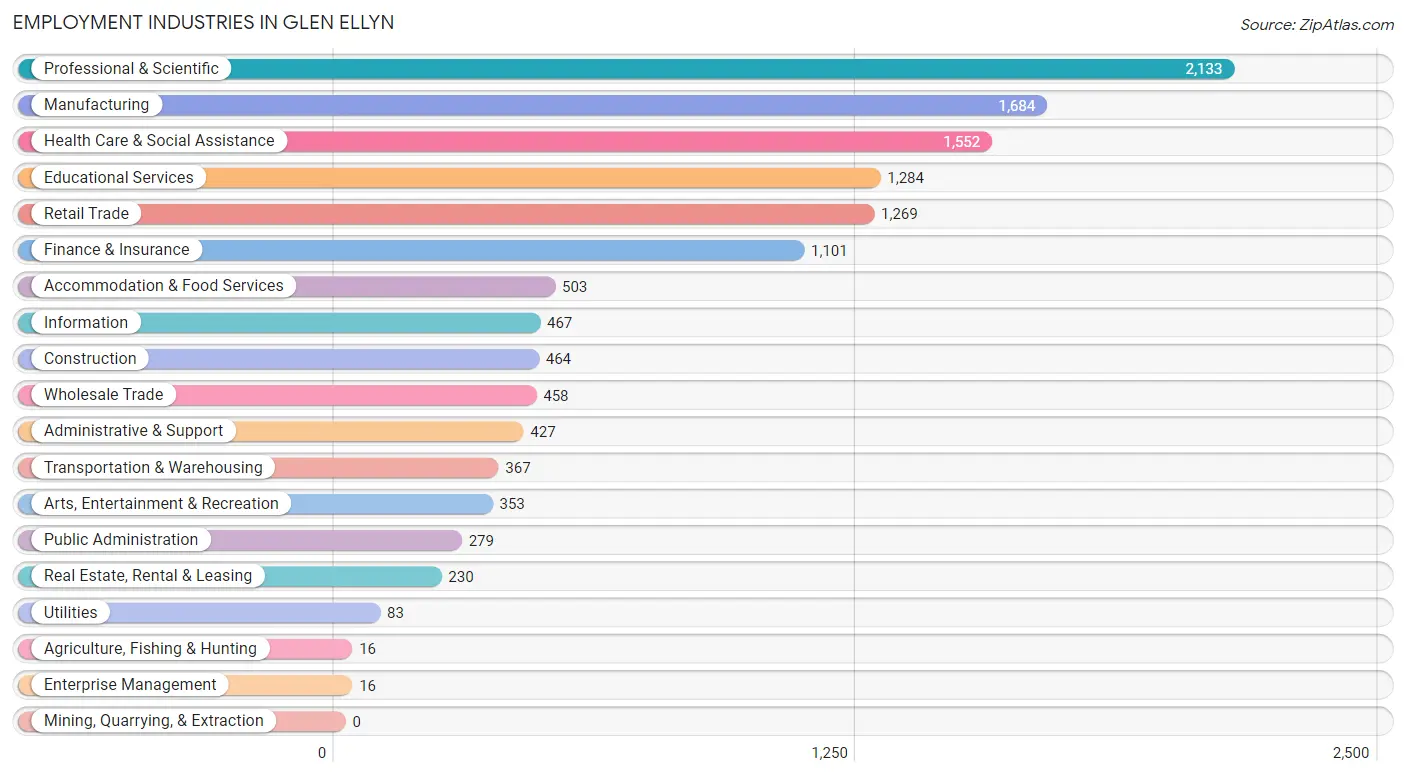
Employment Industries in Glen Ellyn
The major employment industries in Glen Ellyn include Professional & Scientific (2,133 | 16.1%), Manufacturing (1,684 | 12.7%), Health Care & Social Assistance (1,552 | 11.7%), Educational Services (1,284 | 9.7%), and Retail Trade (1,269 | 9.6%).
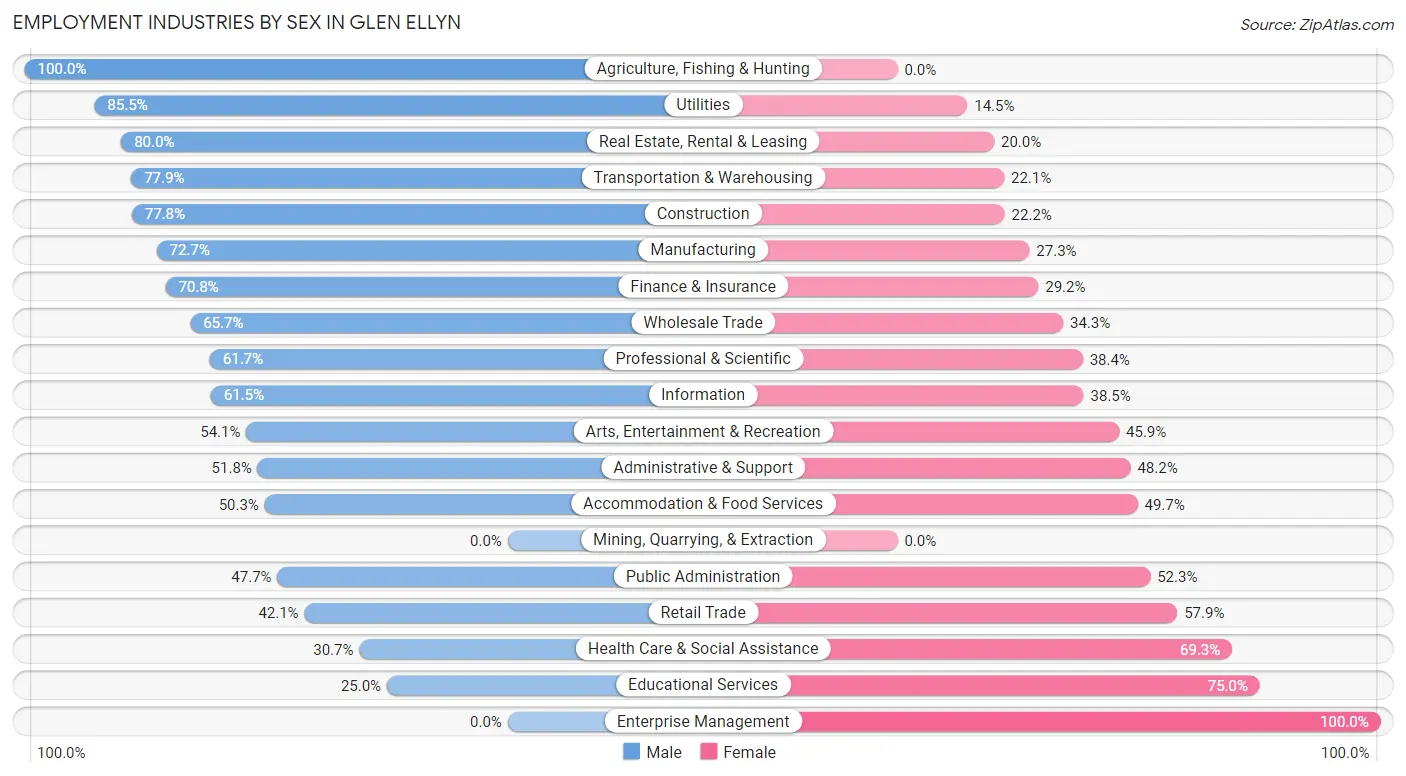
Employment Industries by Sex in Glen Ellyn
The Glen Ellyn industries that see more men than women are Agriculture, Fishing & Hunting (100.0%), Utilities (85.5%), and Real Estate, Rental & Leasing (80.0%), whereas the industries that tend to have a higher number of women are Enterprise Management (100.0%), Educational Services (75.0%), and Health Care & Social Assistance (69.3%).
| Industry | Male | Female |
| Agriculture, Fishing & Hunting | 16 (100.0%) | 0 (0.0%) |
| Mining, Quarrying, & Extraction | 0 (0.0%) | 0 (0.0%) |
| Construction | 361 (77.8%) | 103 (22.2%) |
| Manufacturing | 1,224 (72.7%) | 460 (27.3%) |
| Wholesale Trade | 301 (65.7%) | 157 (34.3%) |
| Retail Trade | 534 (42.1%) | 735 (57.9%) |
| Transportation & Warehousing | 286 (77.9%) | 81 (22.1%) |
| Utilities | 71 (85.5%) | 12 (14.5%) |
| Information | 287 (61.5%) | 180 (38.5%) |
| Finance & Insurance | 780 (70.8%) | 321 (29.2%) |
| Real Estate, Rental & Leasing | 184 (80.0%) | 46 (20.0%) |
| Professional & Scientific | 1,315 (61.7%) | 818 (38.4%) |
| Enterprise Management | 0 (0.0%) | 16 (100.0%) |
| Administrative & Support | 221 (51.8%) | 206 (48.2%) |
| Educational Services | 321 (25.0%) | 963 (75.0%) |
| Health Care & Social Assistance | 477 (30.7%) | 1,075 (69.3%) |
| Arts, Entertainment & Recreation | 191 (54.1%) | 162 (45.9%) |
| Accommodation & Food Services | 253 (50.3%) | 250 (49.7%) |
| Public Administration | 133 (47.7%) | 146 (52.3%) |
| Total | 7,191 (54.2%) | 6,067 (45.8%) |
Education in Glen Ellyn
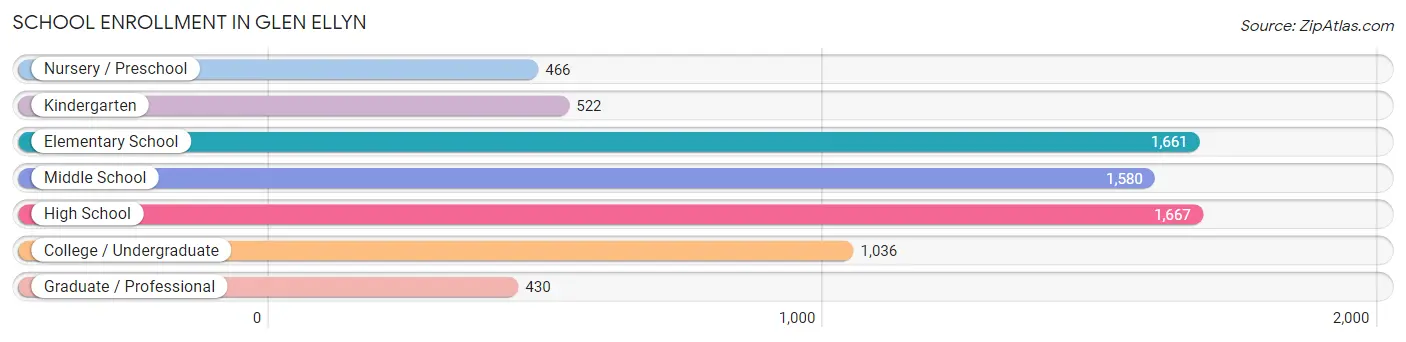
School Enrollment in Glen Ellyn
The most common levels of schooling among the 7,362 students in Glen Ellyn are high school (1,667 | 22.6%), elementary school (1,661 | 22.6%), and middle school (1,580 | 21.5%).
| School Level | # Students | % Students |
| Nursery / Preschool | 466 | 6.3% |
| Kindergarten | 522 | 7.1% |
| Elementary School | 1,661 | 22.6% |
| Middle School | 1,580 | 21.5% |
| High School | 1,667 | 22.6% |
| College / Undergraduate | 1,036 | 14.1% |
| Graduate / Professional | 430 | 5.8% |
| Total | 7,362 | 100.0% |
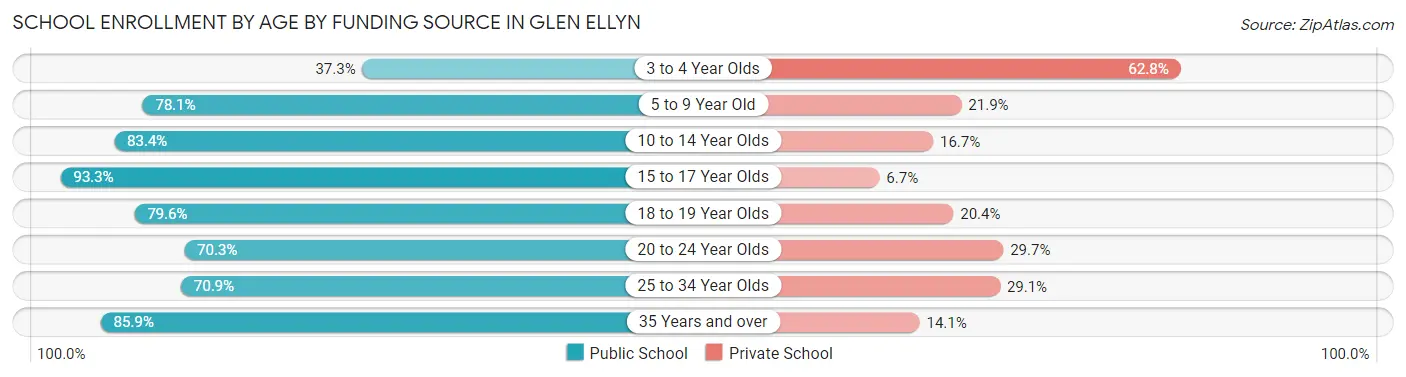
School Enrollment by Age by Funding Source in Glen Ellyn
Out of a total of 7,362 students who are enrolled in schools in Glen Ellyn, 1,480 (20.1%) attend a private institution, while the remaining 5,882 (79.9%) are enrolled in public schools. The age group of 3 to 4 year olds has the highest likelihood of being enrolled in private schools, with 219 (62.7% in the age bracket) enrolled. Conversely, the age group of 15 to 17 year olds has the lowest likelihood of being enrolled in a private school, with 1,206 (93.3% in the age bracket) attending a public institution.
| Age Bracket | Public School | Private School |
| 3 to 4 Year Olds | 130 (37.2%) | 219 (62.7%) |
| 5 to 9 Year Old | 1,705 (78.1%) | 479 (21.9%) |
| 10 to 14 Year Olds | 1,517 (83.4%) | 303 (16.7%) |
| 15 to 17 Year Olds | 1,206 (93.3%) | 86 (6.7%) |
| 18 to 19 Year Olds | 487 (79.6%) | 125 (20.4%) |
| 20 to 24 Year Olds | 298 (70.3%) | 126 (29.7%) |
| 25 to 34 Year Olds | 207 (70.9%) | 85 (29.1%) |
| 35 Years and over | 334 (85.9%) | 55 (14.1%) |
| Total | 5,882 (79.9%) | 1,480 (20.1%) |
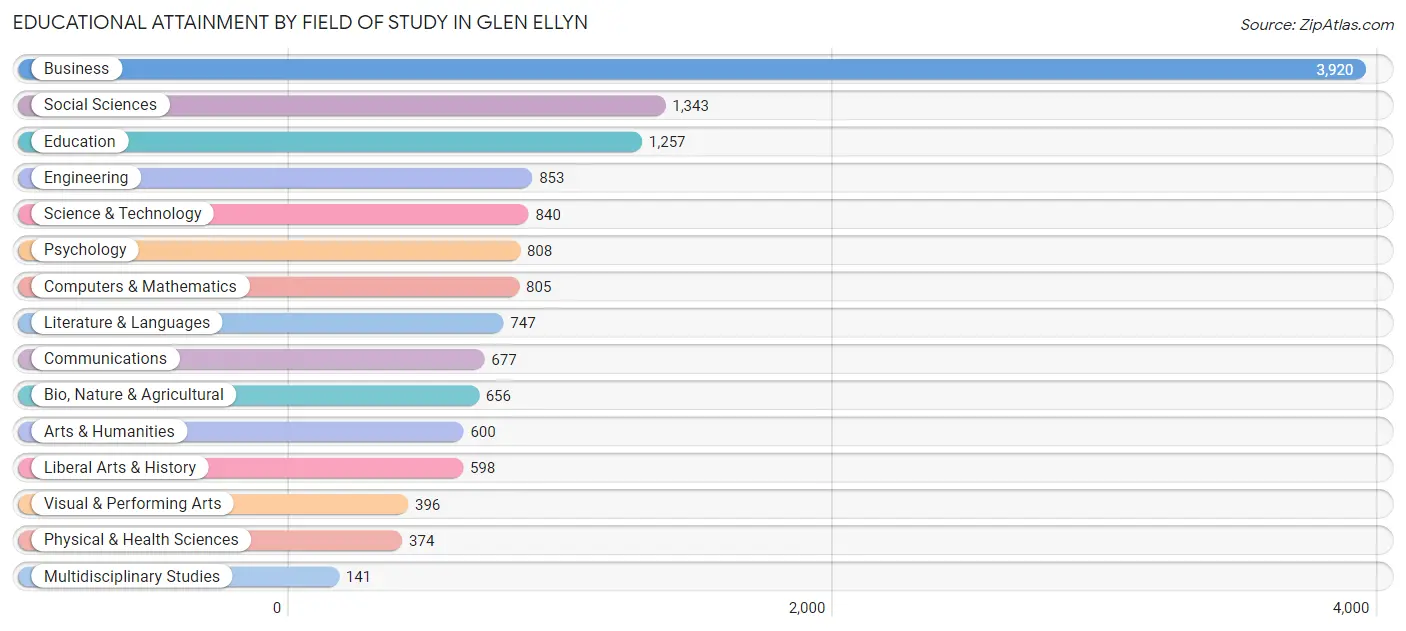
Educational Attainment by Field of Study in Glen Ellyn
Business (3,920 | 28.0%), social sciences (1,343 | 9.6%), education (1,257 | 9.0%), engineering (853 | 6.1%), and science & technology (840 | 6.0%) are the most common fields of study among 14,015 individuals in Glen Ellyn who have obtained a bachelor's degree or higher.
| Field of Study | # Graduates | % Graduates |
| Computers & Mathematics | 805 | 5.7% |
| Bio, Nature & Agricultural | 656 | 4.7% |
| Physical & Health Sciences | 374 | 2.7% |
| Psychology | 808 | 5.8% |
| Social Sciences | 1,343 | 9.6% |
| Engineering | 853 | 6.1% |
| Multidisciplinary Studies | 141 | 1.0% |
| Science & Technology | 840 | 6.0% |
| Business | 3,920 | 28.0% |
| Education | 1,257 | 9.0% |
| Literature & Languages | 747 | 5.3% |
| Liberal Arts & History | 598 | 4.3% |
| Visual & Performing Arts | 396 | 2.8% |
| Communications | 677 | 4.8% |
| Arts & Humanities | 600 | 4.3% |
| Total | 14,015 | 100.0% |
Transportation & Commute in Glen Ellyn
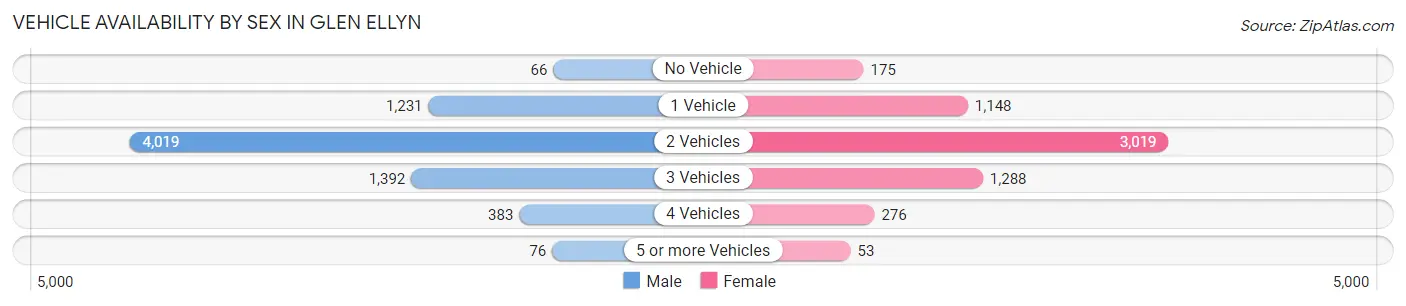
Vehicle Availability by Sex in Glen Ellyn
The most prevalent vehicle ownership categories in Glen Ellyn are males with 2 vehicles (4,019, accounting for 56.1%) and females with 2 vehicles (3,019, making up 67.4%).
| Vehicles Available | Male | Female |
| No Vehicle | 66 (0.9%) | 175 (2.9%) |
| 1 Vehicle | 1,231 (17.2%) | 1,148 (19.3%) |
| 2 Vehicles | 4,019 (56.1%) | 3,019 (50.7%) |
| 3 Vehicles | 1,392 (19.4%) | 1,288 (21.6%) |
| 4 Vehicles | 383 (5.3%) | 276 (4.6%) |
| 5 or more Vehicles | 76 (1.1%) | 53 (0.9%) |
| Total | 7,167 (100.0%) | 5,959 (100.0%) |
Commute Time in Glen Ellyn
The most frequently occuring commute durations in Glen Ellyn are 30 to 34 minutes (1,537 commuters, 15.9%), 60 to 89 minutes (1,150 commuters, 11.9%), and 5 to 9 minutes (1,148 commuters, 11.9%).
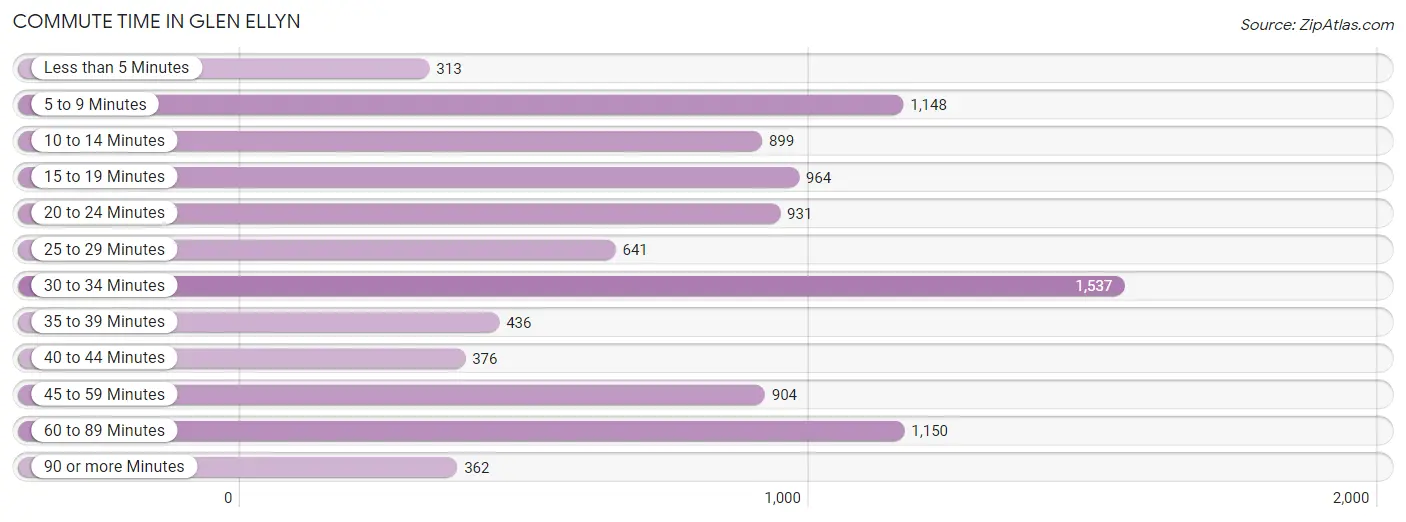
| Commute Time | # Commuters | % Commuters |
| Less than 5 Minutes | 313 | 3.2% |
| 5 to 9 Minutes | 1,148 | 11.9% |
| 10 to 14 Minutes | 899 | 9.3% |
| 15 to 19 Minutes | 964 | 10.0% |
| 20 to 24 Minutes | 931 | 9.6% |
| 25 to 29 Minutes | 641 | 6.6% |
| 30 to 34 Minutes | 1,537 | 15.9% |
| 35 to 39 Minutes | 436 | 4.5% |
| 40 to 44 Minutes | 376 | 3.9% |
| 45 to 59 Minutes | 904 | 9.4% |
| 60 to 89 Minutes | 1,150 | 11.9% |
| 90 or more Minutes | 362 | 3.7% |
Commute Time by Sex in Glen Ellyn
The most common commute times in Glen Ellyn are 60 to 89 minutes (868 commuters, 16.5%) for males and 30 to 34 minutes (707 commuters, 16.1%) for females.
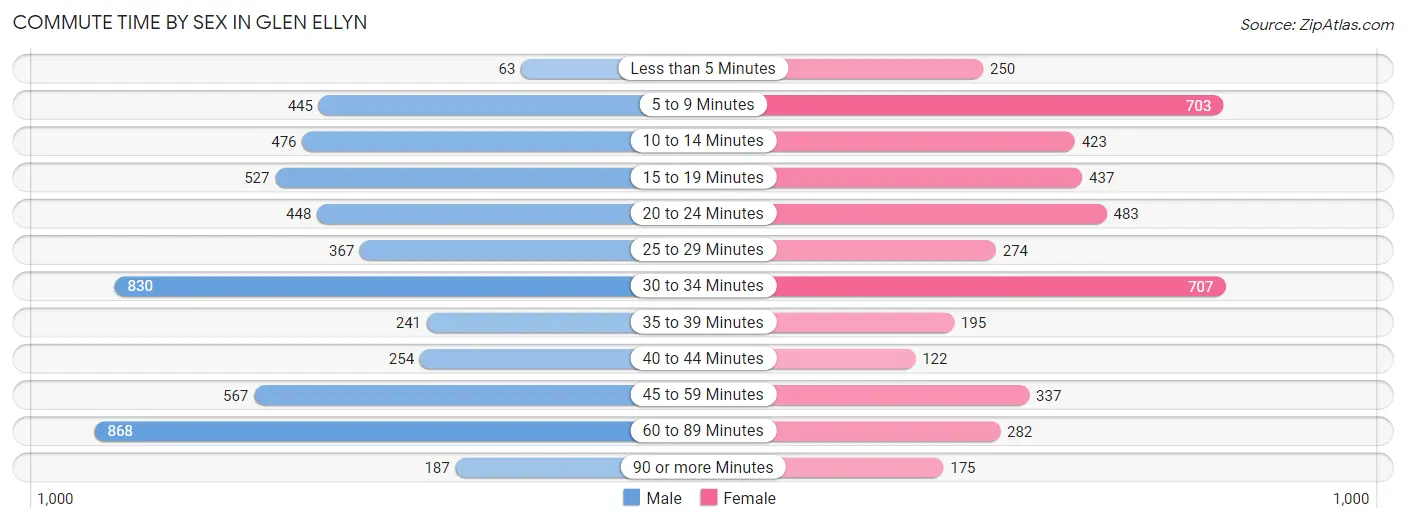
| Commute Time | Male | Female |
| Less than 5 Minutes | 63 (1.2%) | 250 (5.7%) |
| 5 to 9 Minutes | 445 (8.4%) | 703 (16.0%) |
| 10 to 14 Minutes | 476 (9.0%) | 423 (9.6%) |
| 15 to 19 Minutes | 527 (10.0%) | 437 (10.0%) |
| 20 to 24 Minutes | 448 (8.5%) | 483 (11.0%) |
| 25 to 29 Minutes | 367 (7.0%) | 274 (6.2%) |
| 30 to 34 Minutes | 830 (15.7%) | 707 (16.1%) |
| 35 to 39 Minutes | 241 (4.6%) | 195 (4.4%) |
| 40 to 44 Minutes | 254 (4.8%) | 122 (2.8%) |
| 45 to 59 Minutes | 567 (10.7%) | 337 (7.7%) |
| 60 to 89 Minutes | 868 (16.5%) | 282 (6.4%) |
| 90 or more Minutes | 187 (3.5%) | 175 (4.0%) |
Time of Departure to Work by Sex in Glen Ellyn
The most frequent times of departure to work in Glen Ellyn are 7:30 AM to 7:59 AM (767, 14.5%) for males and 7:30 AM to 7:59 AM (810, 18.5%) for females.
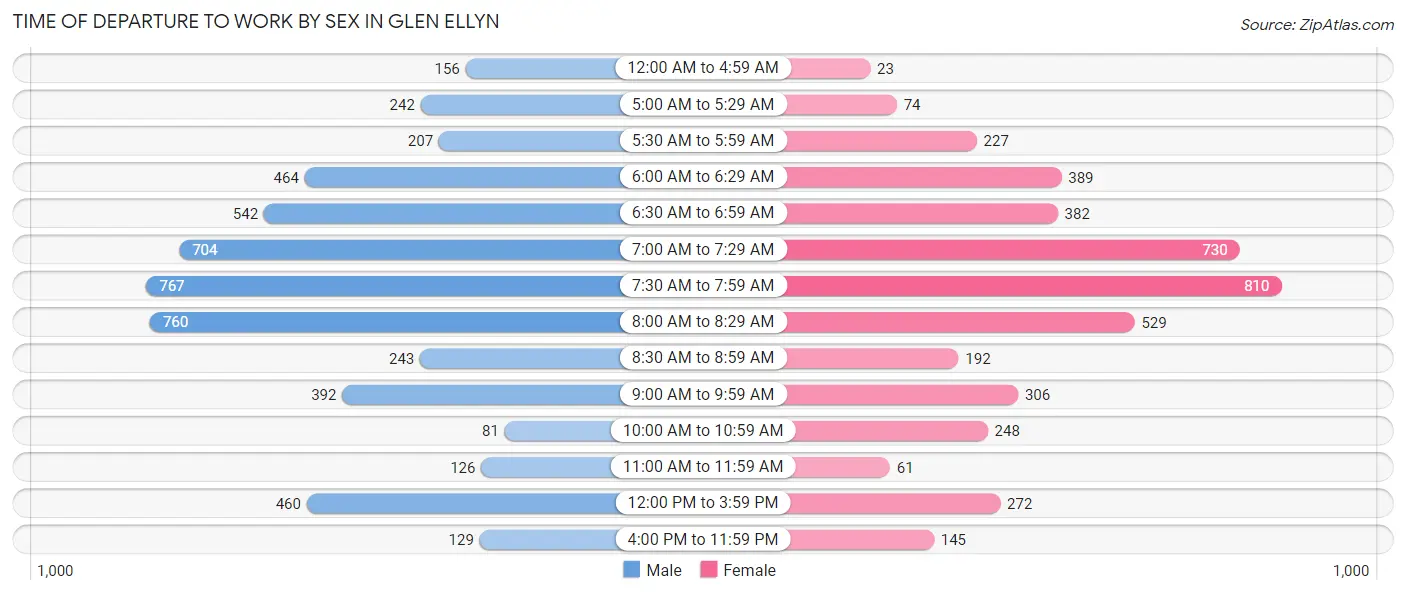
| Time of Departure | Male | Female |
| 12:00 AM to 4:59 AM | 156 (3.0%) | 23 (0.5%) |
| 5:00 AM to 5:29 AM | 242 (4.6%) | 74 (1.7%) |
| 5:30 AM to 5:59 AM | 207 (3.9%) | 227 (5.2%) |
| 6:00 AM to 6:29 AM | 464 (8.8%) | 389 (8.9%) |
| 6:30 AM to 6:59 AM | 542 (10.3%) | 382 (8.7%) |
| 7:00 AM to 7:29 AM | 704 (13.4%) | 730 (16.6%) |
| 7:30 AM to 7:59 AM | 767 (14.5%) | 810 (18.5%) |
| 8:00 AM to 8:29 AM | 760 (14.4%) | 529 (12.1%) |
| 8:30 AM to 8:59 AM | 243 (4.6%) | 192 (4.4%) |
| 9:00 AM to 9:59 AM | 392 (7.4%) | 306 (7.0%) |
| 10:00 AM to 10:59 AM | 81 (1.5%) | 248 (5.7%) |
| 11:00 AM to 11:59 AM | 126 (2.4%) | 61 (1.4%) |
| 12:00 PM to 3:59 PM | 460 (8.7%) | 272 (6.2%) |
| 4:00 PM to 11:59 PM | 129 (2.5%) | 145 (3.3%) |
| Total | 5,273 (100.0%) | 4,388 (100.0%) |
Housing Occupancy in Glen Ellyn
Occupancy by Ownership in Glen Ellyn
Of the total 10,981 dwellings in Glen Ellyn, owner-occupied units account for 8,549 (77.8%), while renter-occupied units make up 2,432 (22.2%).
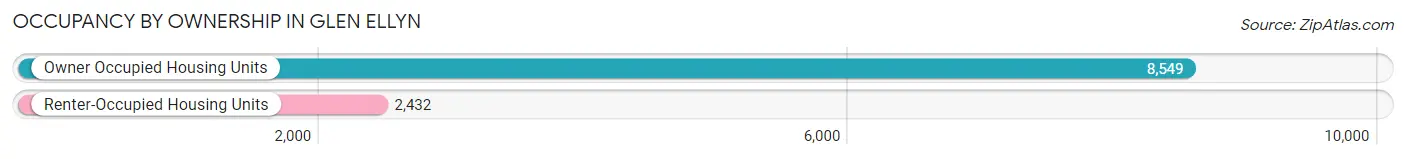
| Occupancy | # Housing Units | % Housing Units |
| Owner Occupied Housing Units | 8,549 | 77.8% |
| Renter-Occupied Housing Units | 2,432 | 22.2% |
| Total Occupied Housing Units | 10,981 | 100.0% |
Occupancy by Household Size in Glen Ellyn
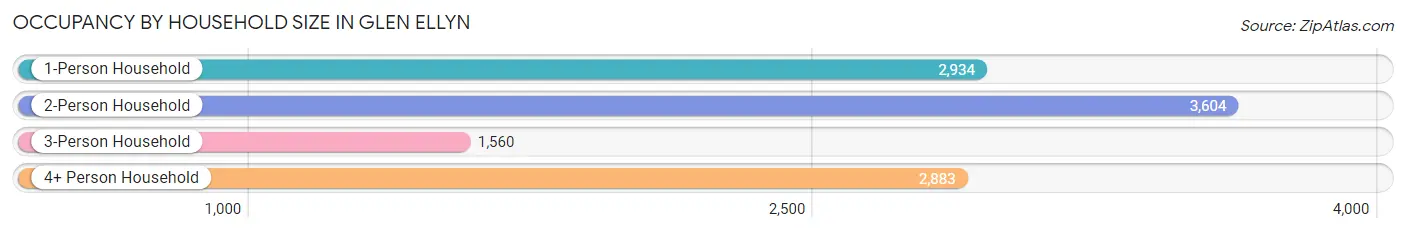
| Household Size | # Housing Units | % Housing Units |
| 1-Person Household | 2,934 | 26.7% |
| 2-Person Household | 3,604 | 32.8% |
| 3-Person Household | 1,560 | 14.2% |
| 4+ Person Household | 2,883 | 26.3% |
| Total Housing Units | 10,981 | 100.0% |
Occupancy by Ownership by Household Size in Glen Ellyn
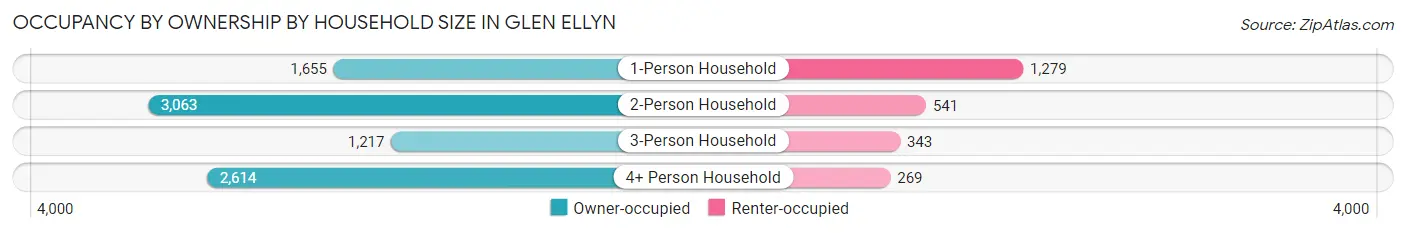
| Household Size | Owner-occupied | Renter-occupied |
| 1-Person Household | 1,655 (56.4%) | 1,279 (43.6%) |
| 2-Person Household | 3,063 (85.0%) | 541 (15.0%) |
| 3-Person Household | 1,217 (78.0%) | 343 (22.0%) |
| 4+ Person Household | 2,614 (90.7%) | 269 (9.3%) |
| Total Housing Units | 8,549 (77.8%) | 2,432 (22.2%) |
Occupancy by Educational Attainment in Glen Ellyn
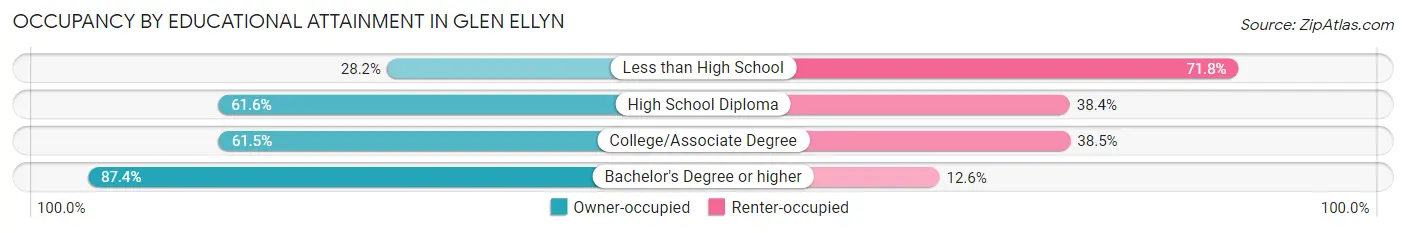
| Household Size | Owner-occupied | Renter-occupied |
| Less than High School | 93 (28.2%) | 237 (71.8%) |
| High School Diploma | 677 (61.6%) | 422 (38.4%) |
| College/Associate Degree | 1,357 (61.5%) | 850 (38.5%) |
| Bachelor's Degree or higher | 6,422 (87.4%) | 923 (12.6%) |
Occupancy by Age of Householder in Glen Ellyn
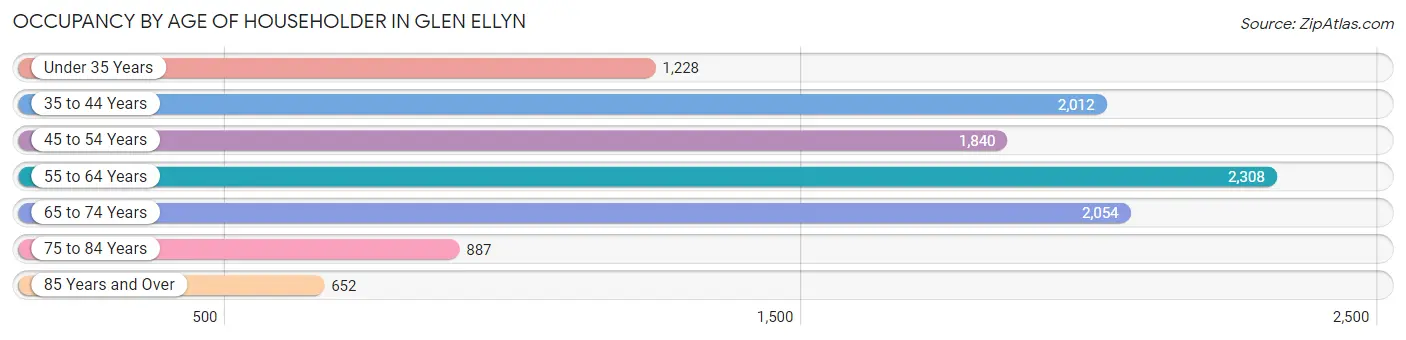
| Age Bracket | # Households | % Households |
| Under 35 Years | 1,228 | 11.2% |
| 35 to 44 Years | 2,012 | 18.3% |
| 45 to 54 Years | 1,840 | 16.8% |
| 55 to 64 Years | 2,308 | 21.0% |
| 65 to 74 Years | 2,054 | 18.7% |
| 75 to 84 Years | 887 | 8.1% |
| 85 Years and Over | 652 | 5.9% |
| Total | 10,981 | 100.0% |
Housing Finances in Glen Ellyn
Median Income by Occupancy in Glen Ellyn
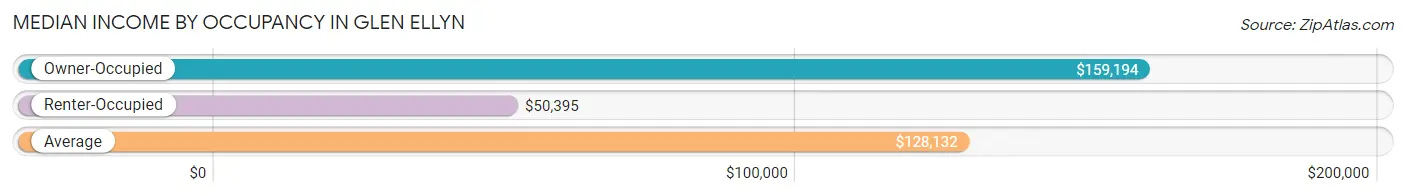
| Occupancy Type | # Households | Median Income |
| Owner-Occupied | 8,549 (77.8%) | $159,194 |
| Renter-Occupied | 2,432 (22.2%) | $50,395 |
| Average | 10,981 (100.0%) | $128,132 |
Occupancy by Householder Income Bracket in Glen Ellyn
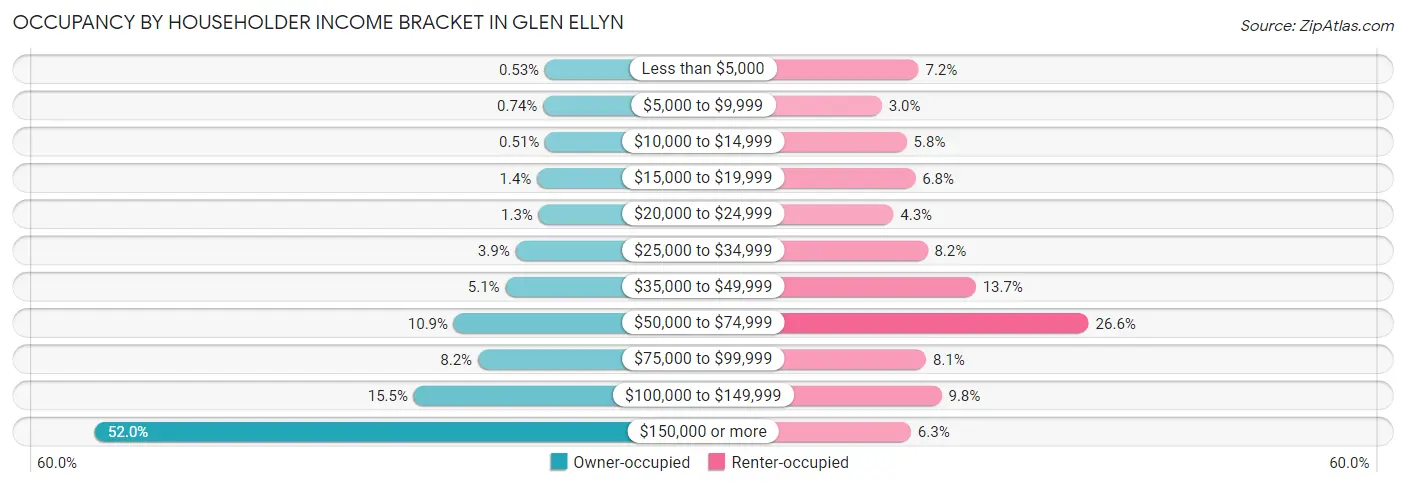
| Income Bracket | Owner-occupied | Renter-occupied |
| Less than $5,000 | 45 (0.5%) | 175 (7.2%) |
| $5,000 to $9,999 | 63 (0.7%) | 73 (3.0%) |
| $10,000 to $14,999 | 44 (0.5%) | 142 (5.8%) |
| $15,000 to $19,999 | 121 (1.4%) | 166 (6.8%) |
| $20,000 to $24,999 | 107 (1.3%) | 105 (4.3%) |
| $25,000 to $34,999 | 333 (3.9%) | 200 (8.2%) |
| $35,000 to $49,999 | 432 (5.1%) | 334 (13.7%) |
| $50,000 to $74,999 | 935 (10.9%) | 648 (26.6%) |
| $75,000 to $99,999 | 700 (8.2%) | 196 (8.1%) |
| $100,000 to $149,999 | 1,327 (15.5%) | 239 (9.8%) |
| $150,000 or more | 4,442 (52.0%) | 154 (6.3%) |
| Total | 8,549 (100.0%) | 2,432 (100.0%) |
Monthly Housing Cost Tiers in Glen Ellyn
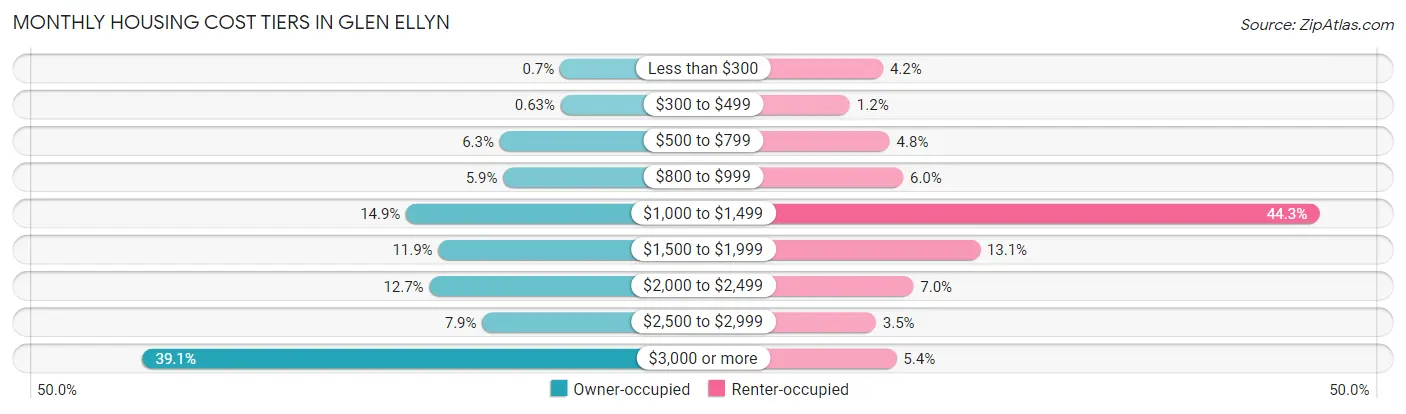
| Monthly Cost | Owner-occupied | Renter-occupied |
| Less than $300 | 60 (0.7%) | 102 (4.2%) |
| $300 to $499 | 54 (0.6%) | 28 (1.1%) |
| $500 to $799 | 534 (6.2%) | 117 (4.8%) |
| $800 to $999 | 507 (5.9%) | 147 (6.0%) |
| $1,000 to $1,499 | 1,271 (14.9%) | 1,078 (44.3%) |
| $1,500 to $1,999 | 1,017 (11.9%) | 319 (13.1%) |
| $2,000 to $2,499 | 1,088 (12.7%) | 170 (7.0%) |
| $2,500 to $2,999 | 672 (7.9%) | 86 (3.5%) |
| $3,000 or more | 3,346 (39.1%) | 132 (5.4%) |
| Total | 8,549 (100.0%) | 2,432 (100.0%) |
Physical Housing Characteristics in Glen Ellyn
Housing Structures in Glen Ellyn
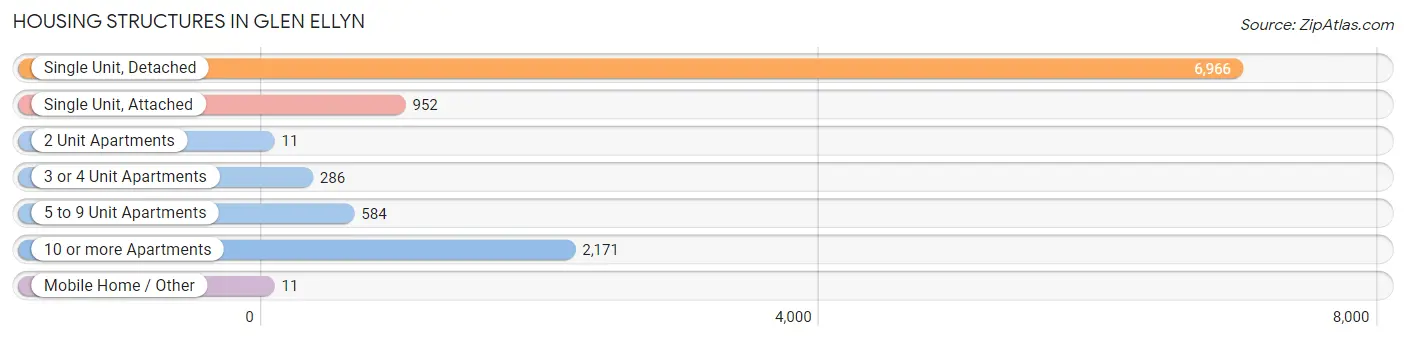
| Structure Type | # Housing Units | % Housing Units |
| Single Unit, Detached | 6,966 | 63.4% |
| Single Unit, Attached | 952 | 8.7% |
| 2 Unit Apartments | 11 | 0.1% |
| 3 or 4 Unit Apartments | 286 | 2.6% |
| 5 to 9 Unit Apartments | 584 | 5.3% |
| 10 or more Apartments | 2,171 | 19.8% |
| Mobile Home / Other | 11 | 0.1% |
| Total | 10,981 | 100.0% |
Housing Structures by Occupancy in Glen Ellyn
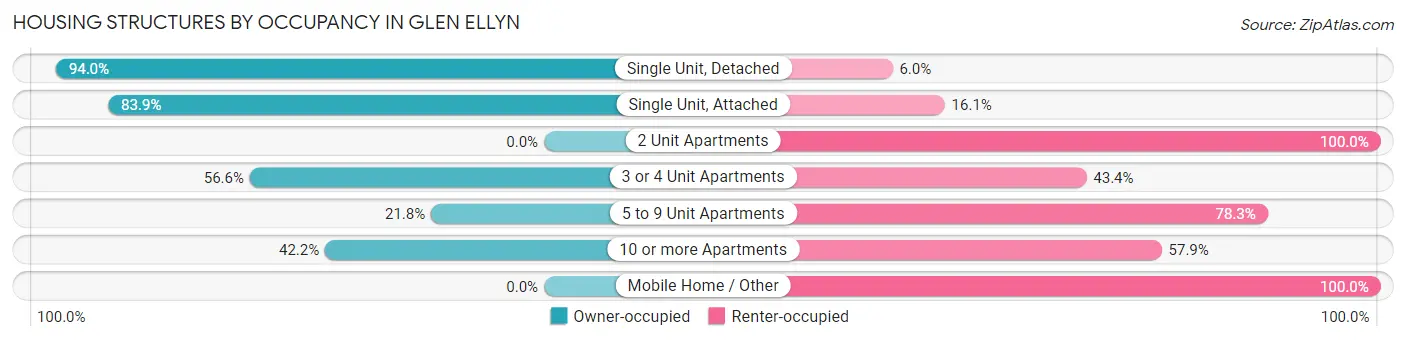
| Structure Type | Owner-occupied | Renter-occupied |
| Single Unit, Detached | 6,546 (94.0%) | 420 (6.0%) |
| Single Unit, Attached | 799 (83.9%) | 153 (16.1%) |
| 2 Unit Apartments | 0 (0.0%) | 11 (100.0%) |
| 3 or 4 Unit Apartments | 162 (56.6%) | 124 (43.4%) |
| 5 to 9 Unit Apartments | 127 (21.7%) | 457 (78.2%) |
| 10 or more Apartments | 915 (42.1%) | 1,256 (57.9%) |
| Mobile Home / Other | 0 (0.0%) | 11 (100.0%) |
| Total | 8,549 (77.8%) | 2,432 (22.2%) |
Housing Structures by Number of Rooms in Glen Ellyn
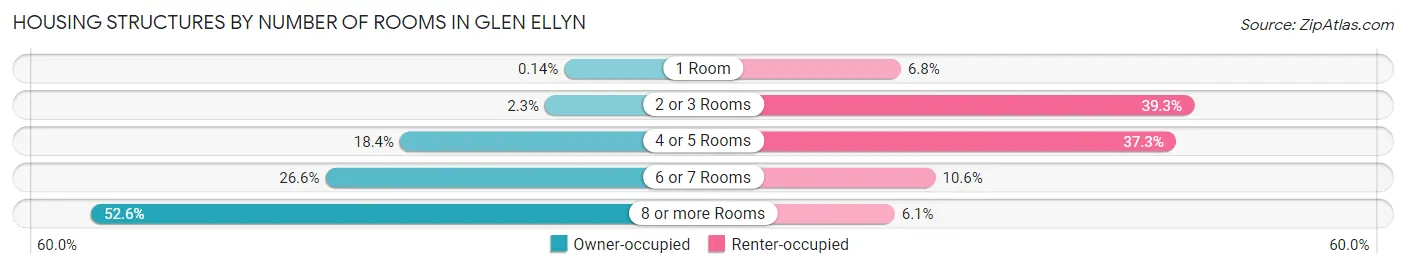
| Number of Rooms | Owner-occupied | Renter-occupied |
| 1 Room | 12 (0.1%) | 165 (6.8%) |
| 2 or 3 Rooms | 193 (2.3%) | 955 (39.3%) |
| 4 or 5 Rooms | 1,569 (18.3%) | 906 (37.2%) |
| 6 or 7 Rooms | 2,277 (26.6%) | 258 (10.6%) |
| 8 or more Rooms | 4,498 (52.6%) | 148 (6.1%) |
| Total | 8,549 (100.0%) | 2,432 (100.0%) |
Housing Structure by Heating Type in Glen Ellyn
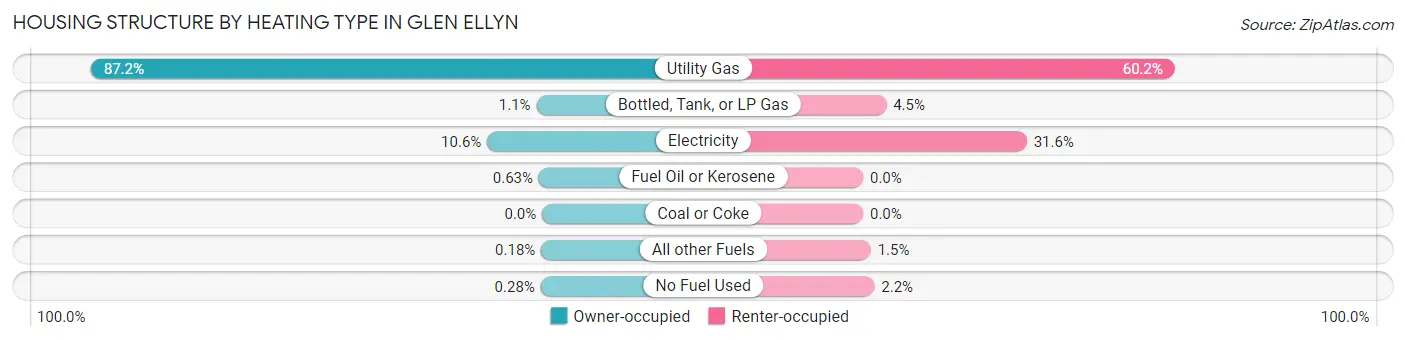
| Heating Type | Owner-occupied | Renter-occupied |
| Utility Gas | 7,455 (87.2%) | 1,465 (60.2%) |
| Bottled, Tank, or LP Gas | 93 (1.1%) | 109 (4.5%) |
| Electricity | 908 (10.6%) | 769 (31.6%) |
| Fuel Oil or Kerosene | 54 (0.6%) | 0 (0.0%) |
| Coal or Coke | 0 (0.0%) | 0 (0.0%) |
| All other Fuels | 15 (0.2%) | 36 (1.5%) |
| No Fuel Used | 24 (0.3%) | 53 (2.2%) |
| Total | 8,549 (100.0%) | 2,432 (100.0%) |
Household Vehicle Usage in Glen Ellyn
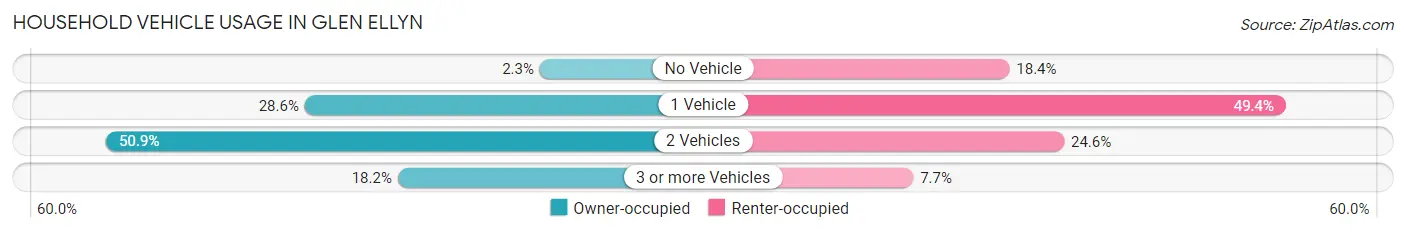
| Vehicles per Household | Owner-occupied | Renter-occupied |
| No Vehicle | 196 (2.3%) | 448 (18.4%) |
| 1 Vehicle | 2,447 (28.6%) | 1,201 (49.4%) |
| 2 Vehicles | 4,350 (50.9%) | 597 (24.5%) |
| 3 or more Vehicles | 1,556 (18.2%) | 186 (7.6%) |
| Total | 8,549 (100.0%) | 2,432 (100.0%) |
Real Estate & Mortgages in Glen Ellyn
Real Estate and Mortgage Overview in Glen Ellyn
| Characteristic | Without Mortgage | With Mortgage |
| Housing Units | 2,914 | 5,635 |
| Median Property Value | $453,700 | $564,800 |
| Median Household Income | $97,216 | $3,463 |
| Monthly Housing Costs | $1,238 | $3,256 |
| Real Estate Taxes | $9,655 | $60 |
Property Value by Mortgage Status in Glen Ellyn
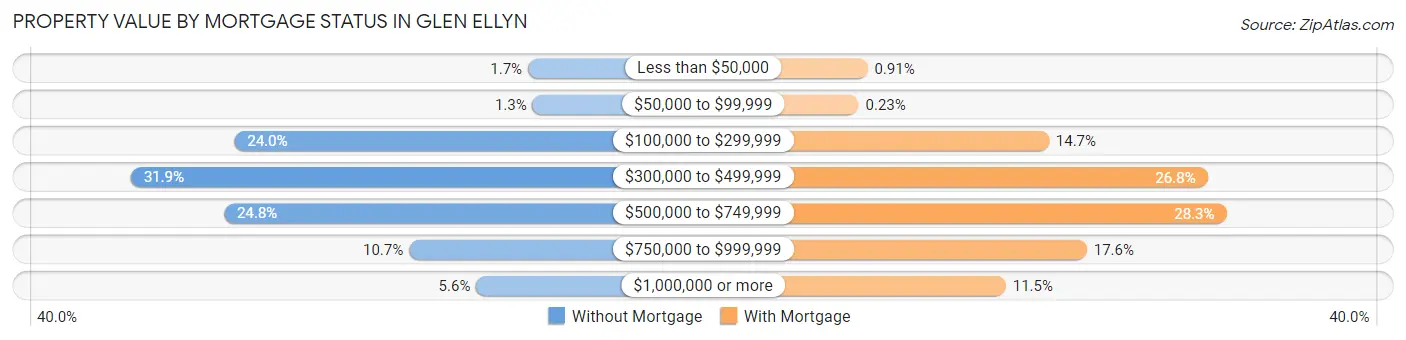
| Property Value | Without Mortgage | With Mortgage |
| Less than $50,000 | 48 (1.7%) | 51 (0.9%) |
| $50,000 to $99,999 | 38 (1.3%) | 13 (0.2%) |
| $100,000 to $299,999 | 700 (24.0%) | 830 (14.7%) |
| $300,000 to $499,999 | 930 (31.9%) | 1,511 (26.8%) |
| $500,000 to $749,999 | 723 (24.8%) | 1,592 (28.2%) |
| $750,000 to $999,999 | 312 (10.7%) | 993 (17.6%) |
| $1,000,000 or more | 163 (5.6%) | 645 (11.5%) |
| Total | 2,914 (100.0%) | 5,635 (100.0%) |
Household Income by Mortgage Status in Glen Ellyn
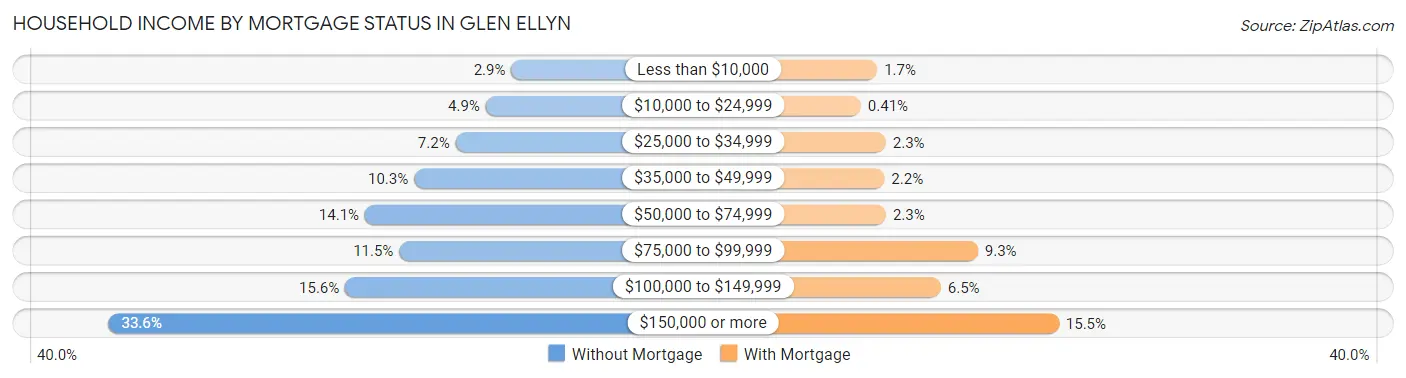
| Household Income | Without Mortgage | With Mortgage |
| Less than $10,000 | 85 (2.9%) | 93 (1.7%) |
| $10,000 to $24,999 | 142 (4.9%) | 23 (0.4%) |
| $25,000 to $34,999 | 209 (7.2%) | 130 (2.3%) |
| $35,000 to $49,999 | 301 (10.3%) | 124 (2.2%) |
| $50,000 to $74,999 | 410 (14.1%) | 131 (2.3%) |
| $75,000 to $99,999 | 334 (11.5%) | 525 (9.3%) |
| $100,000 to $149,999 | 454 (15.6%) | 366 (6.5%) |
| $150,000 or more | 979 (33.6%) | 873 (15.5%) |
| Total | 2,914 (100.0%) | 5,635 (100.0%) |
Property Value to Household Income Ratio in Glen Ellyn
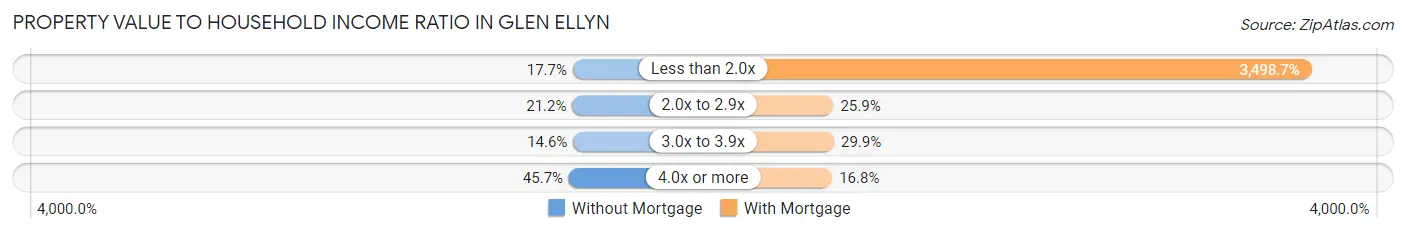
| Value-to-Income Ratio | Without Mortgage | With Mortgage |
| Less than 2.0x | 517 (17.7%) | 197,150 (3,498.7%) |
| 2.0x to 2.9x | 617 (21.2%) | 1,458 (25.9%) |
| 3.0x to 3.9x | 426 (14.6%) | 1,687 (29.9%) |
| 4.0x or more | 1,333 (45.7%) | 944 (16.8%) |
| Total | 2,914 (100.0%) | 5,635 (100.0%) |
Real Estate Taxes by Mortgage Status in Glen Ellyn
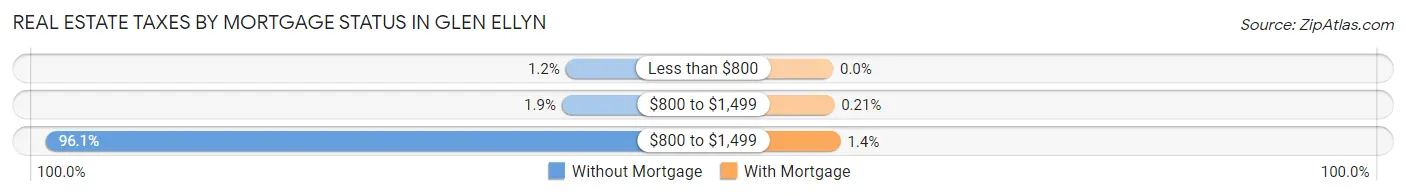
| Property Taxes | Without Mortgage | With Mortgage |
| Less than $800 | 35 (1.2%) | 0 (0.0%) |
| $800 to $1,499 | 55 (1.9%) | 12 (0.2%) |
| $800 to $1,499 | 2,801 (96.1%) | 76 (1.3%) |
| Total | 2,914 (100.0%) | 5,635 (100.0%) |
Health & Disability in Glen Ellyn
Health Insurance Coverage by Age in Glen Ellyn
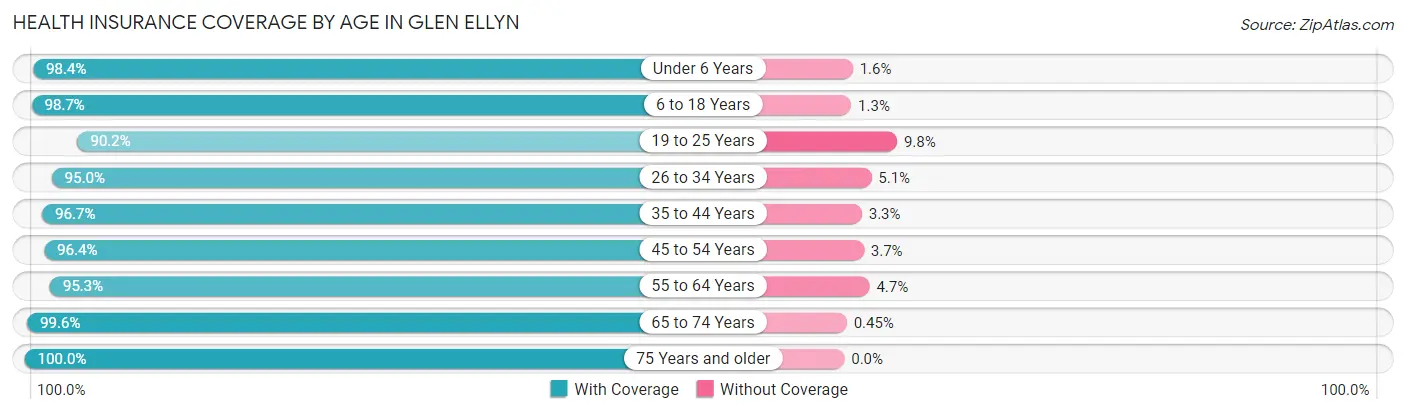
| Age Bracket | With Coverage | Without Coverage |
| Under 6 Years | 2,259 (98.4%) | 36 (1.6%) |
| 6 to 18 Years | 5,458 (98.7%) | 71 (1.3%) |
| 19 to 25 Years | 1,577 (90.2%) | 172 (9.8%) |
| 26 to 34 Years | 1,731 (95.0%) | 92 (5.1%) |
| 35 to 44 Years | 3,833 (96.7%) | 129 (3.3%) |
| 45 to 54 Years | 3,562 (96.4%) | 135 (3.6%) |
| 55 to 64 Years | 3,671 (95.3%) | 181 (4.7%) |
| 65 to 74 Years | 3,066 (99.6%) | 14 (0.4%) |
| 75 Years and older | 2,308 (100.0%) | 0 (0.0%) |
| Total | 27,465 (97.1%) | 830 (2.9%) |
Health Insurance Coverage by Citizenship Status in Glen Ellyn
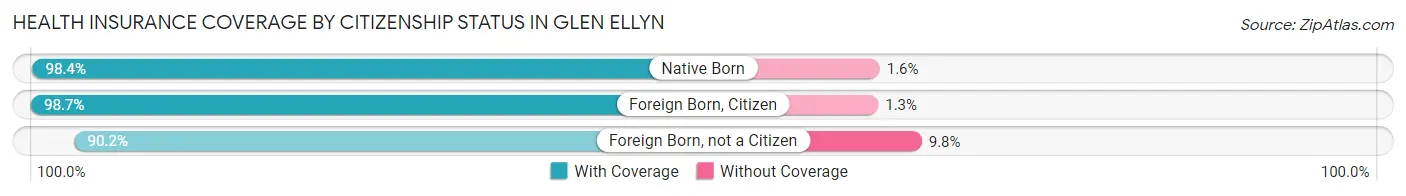
| Citizenship Status | With Coverage | Without Coverage |
| Native Born | 2,259 (98.4%) | 36 (1.6%) |
| Foreign Born, Citizen | 5,458 (98.7%) | 71 (1.3%) |
| Foreign Born, not a Citizen | 1,577 (90.2%) | 172 (9.8%) |
Health Insurance Coverage by Household Income in Glen Ellyn
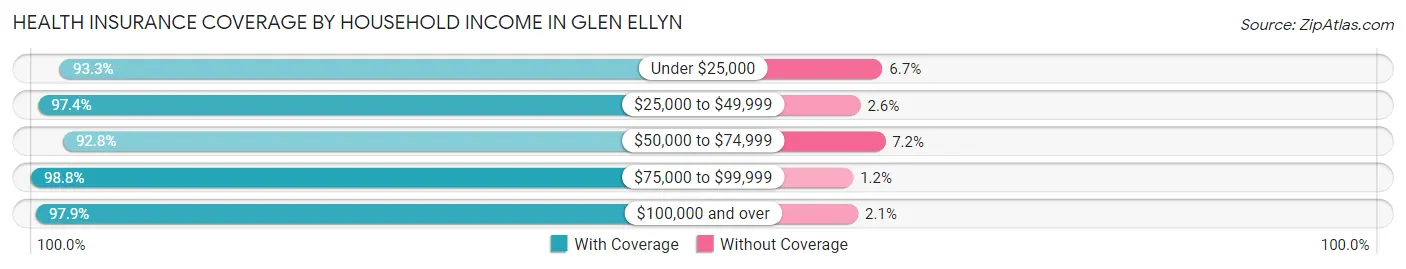
| Household Income | With Coverage | Without Coverage |
| Under $25,000 | 1,510 (93.3%) | 108 (6.7%) |
| $25,000 to $49,999 | 2,315 (97.4%) | 61 (2.6%) |
| $50,000 to $74,999 | 2,861 (92.8%) | 222 (7.2%) |
| $75,000 to $99,999 | 1,884 (98.8%) | 23 (1.2%) |
| $100,000 and over | 18,846 (97.9%) | 410 (2.1%) |
Public vs Private Health Insurance Coverage by Age in Glen Ellyn
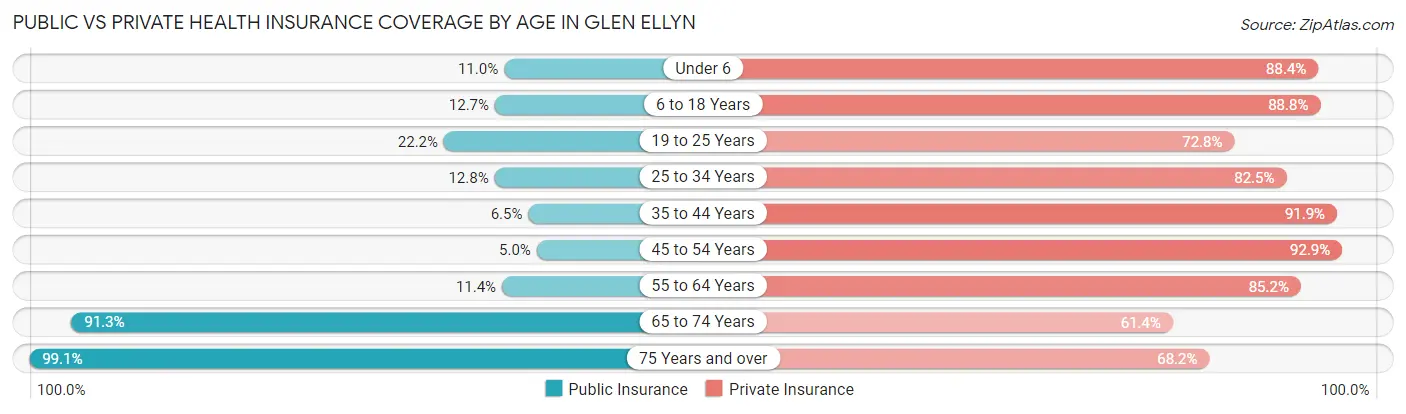
| Age Bracket | Public Insurance | Private Insurance |
| Under 6 | 253 (11.0%) | 2,029 (88.4%) |
| 6 to 18 Years | 703 (12.7%) | 4,910 (88.8%) |
| 19 to 25 Years | 388 (22.2%) | 1,274 (72.8%) |
| 25 to 34 Years | 233 (12.8%) | 1,504 (82.5%) |
| 35 to 44 Years | 258 (6.5%) | 3,641 (91.9%) |
| 45 to 54 Years | 183 (5.0%) | 3,433 (92.9%) |
| 55 to 64 Years | 439 (11.4%) | 3,281 (85.2%) |
| 65 to 74 Years | 2,813 (91.3%) | 1,892 (61.4%) |
| 75 Years and over | 2,288 (99.1%) | 1,574 (68.2%) |
| Total | 7,558 (26.7%) | 23,538 (83.2%) |
Disability Status by Sex by Age in Glen Ellyn
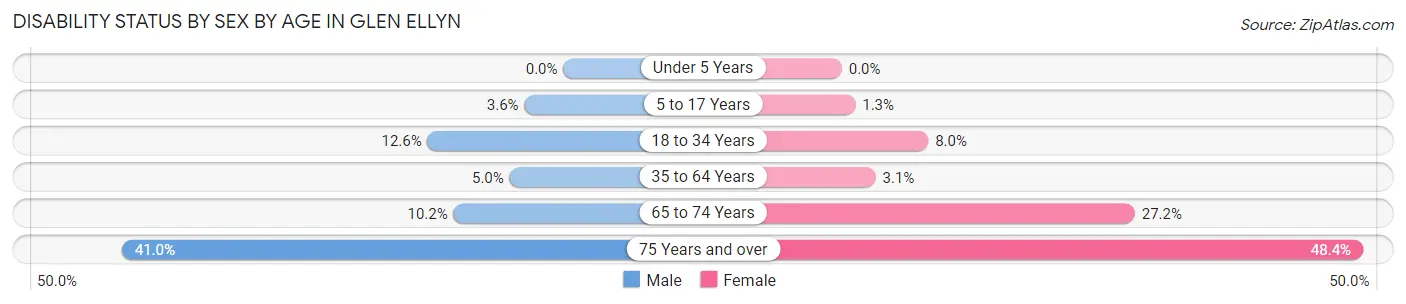
| Age Bracket | Male | Female |
| Under 5 Years | 0 (0.0%) | 0 (0.0%) |
| 5 to 17 Years | 94 (3.6%) | 35 (1.3%) |
| 18 to 34 Years | 256 (12.6%) | 166 (8.0%) |
| 35 to 64 Years | 290 (5.0%) | 179 (3.1%) |
| 65 to 74 Years | 153 (10.2%) | 429 (27.2%) |
| 75 Years and over | 395 (41.0%) | 650 (48.4%) |
Disability Class by Sex by Age in Glen Ellyn
Disability Class: Hearing Difficulty
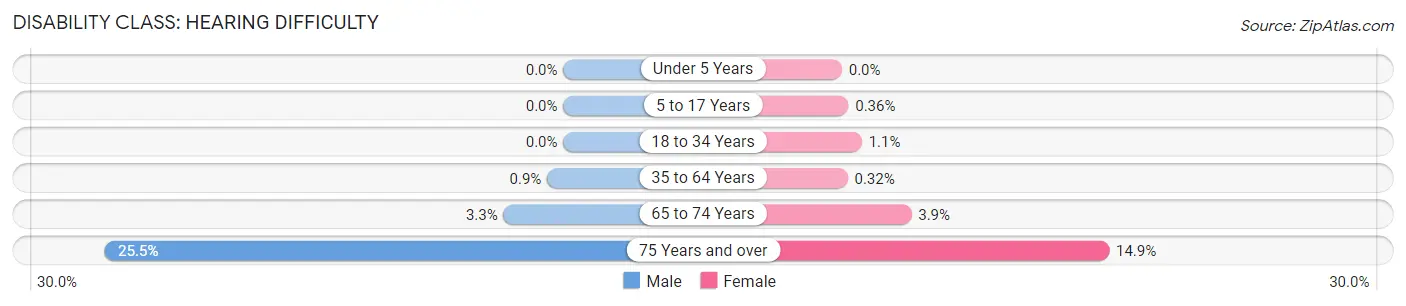
| Age Bracket | Male | Female |
| Under 5 Years | 0 (0.0%) | 0 (0.0%) |
| 5 to 17 Years | 0 (0.0%) | 10 (0.4%) |
| 18 to 34 Years | 0 (0.0%) | 23 (1.1%) |
| 35 to 64 Years | 52 (0.9%) | 18 (0.3%) |
| 65 to 74 Years | 50 (3.3%) | 61 (3.9%) |
| 75 Years and over | 246 (25.5%) | 200 (14.9%) |
Disability Class: Vision Difficulty
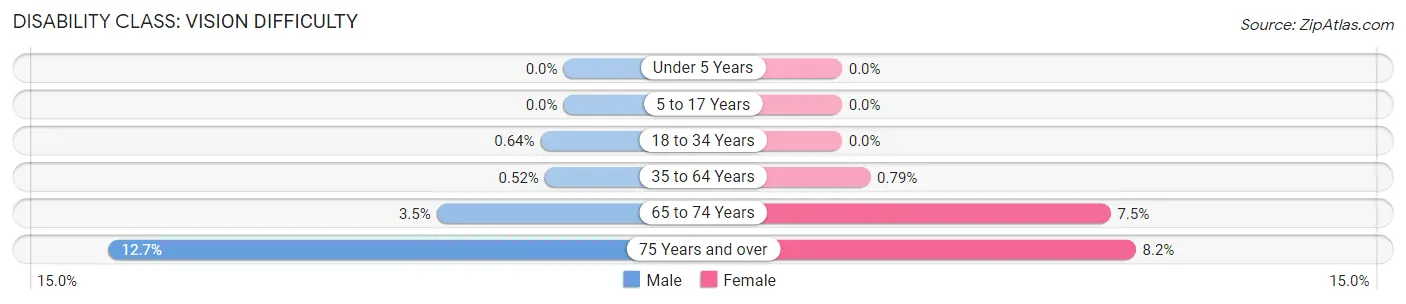
| Age Bracket | Male | Female |
| Under 5 Years | 0 (0.0%) | 0 (0.0%) |
| 5 to 17 Years | 0 (0.0%) | 0 (0.0%) |
| 18 to 34 Years | 13 (0.6%) | 0 (0.0%) |
| 35 to 64 Years | 30 (0.5%) | 45 (0.8%) |
| 65 to 74 Years | 53 (3.5%) | 118 (7.5%) |
| 75 Years and over | 122 (12.7%) | 110 (8.2%) |
Disability Class: Cognitive Difficulty
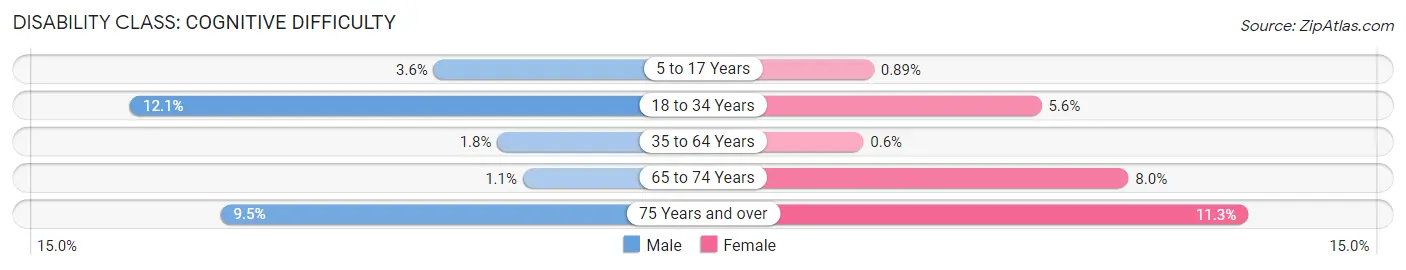
| Age Bracket | Male | Female |
| 5 to 17 Years | 94 (3.6%) | 25 (0.9%) |
| 18 to 34 Years | 245 (12.1%) | 115 (5.6%) |
| 35 to 64 Years | 107 (1.8%) | 34 (0.6%) |
| 65 to 74 Years | 17 (1.1%) | 126 (8.0%) |
| 75 Years and over | 92 (9.5%) | 152 (11.3%) |
Disability Class: Ambulatory Difficulty
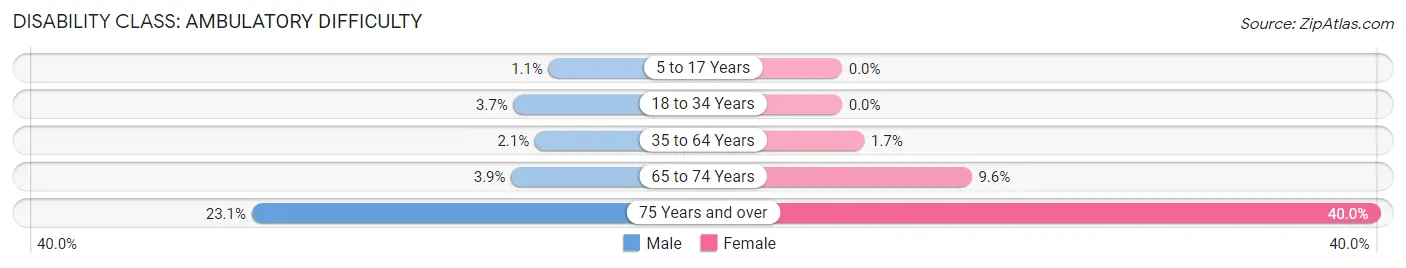
| Age Bracket | Male | Female |
| 5 to 17 Years | 28 (1.1%) | 0 (0.0%) |
| 18 to 34 Years | 75 (3.7%) | 0 (0.0%) |
| 35 to 64 Years | 122 (2.1%) | 94 (1.7%) |
| 65 to 74 Years | 58 (3.9%) | 152 (9.6%) |
| 75 Years and over | 223 (23.1%) | 537 (40.0%) |
Disability Class: Self-Care Difficulty
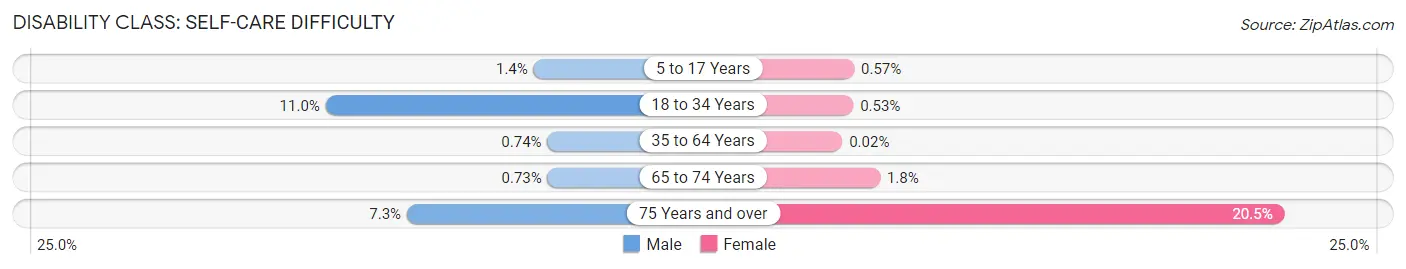
| Age Bracket | Male | Female |
| 5 to 17 Years | 36 (1.4%) | 16 (0.6%) |
| 18 to 34 Years | 224 (11.0%) | 11 (0.5%) |
| 35 to 64 Years | 43 (0.7%) | 1 (0.0%) |
| 65 to 74 Years | 11 (0.7%) | 28 (1.8%) |
| 75 Years and over | 70 (7.3%) | 276 (20.5%) |
Technology Access in Glen Ellyn
Computing Device Access in Glen Ellyn
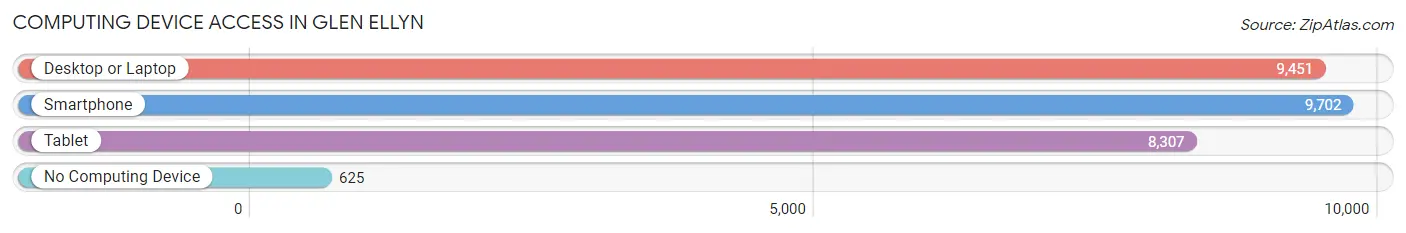
| Device Type | # Households | % Households |
| Desktop or Laptop | 9,451 | 86.1% |
| Smartphone | 9,702 | 88.3% |
| Tablet | 8,307 | 75.6% |
| No Computing Device | 625 | 5.7% |
| Total | 10,981 | 100.0% |
Internet Access in Glen Ellyn
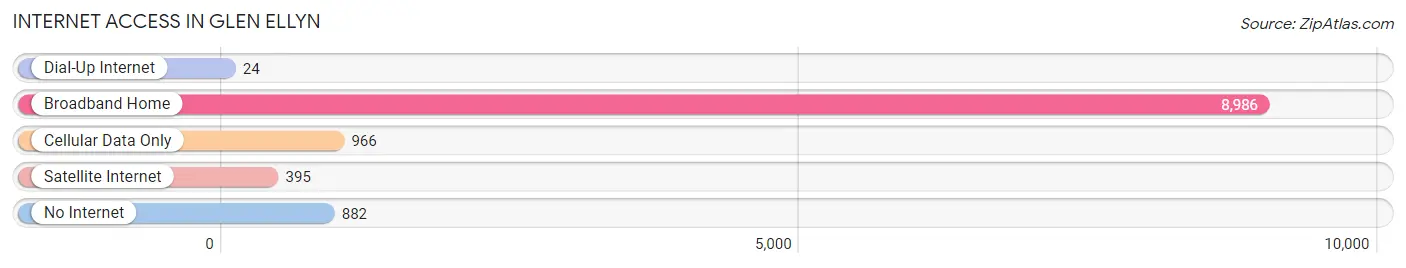
| Internet Type | # Households | % Households |
| Dial-Up Internet | 24 | 0.2% |
| Broadband Home | 8,986 | 81.8% |
| Cellular Data Only | 966 | 8.8% |
| Satellite Internet | 395 | 3.6% |
| No Internet | 882 | 8.0% |
| Total | 10,981 | 100.0% |
Glen Ellyn Summary
Glen Ellyn is a village located in DuPage County, Illinois, United States. It is a western suburb of Chicago, located approximately 25 miles (40 km) from the city's downtown. As of the 2010 census, the village had a total population of 27,450.
History
The area that is now Glen Ellyn was first settled in the 1830s by Deacon Winslow Churchill. The area was originally known as Danby, after Churchill's hometown in England. In 1834, the first post office was established in the area, and the name was changed to Glen Ellyn. The name was chosen to honor the wife of one of the area's first settlers, Thomas E. Hill, who named the village after his wife's hometown of Glen Ellyn, Wales.
In the late 19th century, Glen Ellyn began to grow rapidly as a commuter town for Chicago. The village was incorporated in 1892, and the first village president was elected in 1895. The village continued to grow throughout the 20th century, and by the 2000 census, the population had grown to 27,450.
Geography
Glen Ellyn is located in DuPage County, Illinois, approximately 25 miles (40 km) west of downtown Chicago. The village is situated on the western edge of the Chicago metropolitan area. The village is bordered by Lombard to the north, Wheaton to the east, Carol Stream to the south, and Glenbard West High School to the west.
The village has a total area of 5.2 square miles (13.4 km2), of which 5.1 square miles (13.2 km2) is land and 0.1 square miles (0.2 km2) is water. The village is located in the Fox River Valley, and is drained by the West Branch of the DuPage River.
Economy
Glen Ellyn is a primarily residential community, with a small but vibrant business district. The village is home to a variety of businesses, including restaurants, retail stores, professional services, and more. The village is also home to several corporate headquarters, including the headquarters of the American Academy of Pediatrics and the American College of Radiology.
The village is served by two major highways, Interstate 355 and Interstate 88. The village is also served by Metra's Union Pacific/West Line, which provides commuter rail service to downtown Chicago.
Demographics
As of the 2010 census, the village had a total population of 27,450. The racial makeup of the village was 87.2% White, 4.3% African American, 0.2% Native American, 4.7% Asian, 0.1% Pacific Islander, 1.7% from other races, and 2.0% from two or more races. Hispanic or Latino of any race were 6.7% of the population.
The median income for a household in the village was $87,811, and the median income for a family was $103,945. The per capita income for the village was $41,945. About 3.2% of families and 4.7% of the population were below the poverty line, including 5.2% of those under age 18 and 4.2% of those age 65 or over.
Common Questions
What is Per Capita Income in Glen Ellyn?
Per Capita income in Glen Ellyn is $72,404.
What is the Median Family Income in Glen Ellyn?
Median Family Income in Glen Ellyn is $174,904.
What is the Median Household income in Glen Ellyn?
Median Household Income in Glen Ellyn is $128,132.
What is Income or Wage Gap in Glen Ellyn?
Income or Wage Gap in Glen Ellyn is 50.1%.
Women in Glen Ellyn earn 49.9 cents for every dollar earned by a man.
What is Inequality or Gini Index in Glen Ellyn?
Inequality or Gini Index in Glen Ellyn is 0.51.
What is the Total Population of Glen Ellyn?
Total Population of Glen Ellyn is 28,304.
What is the Total Male Population of Glen Ellyn?
Total Male Population of Glen Ellyn is 13,996.
What is the Total Female Population of Glen Ellyn?
Total Female Population of Glen Ellyn is 14,308.
What is the Ratio of Males per 100 Females in Glen Ellyn?
There are 97.82 Males per 100 Females in Glen Ellyn.
What is the Ratio of Females per 100 Males in Glen Ellyn?
There are 102.23 Females per 100 Males in Glen Ellyn.
What is the Median Population Age in Glen Ellyn?
Median Population Age in Glen Ellyn is 41.6 Years.
What is the Average Family Size in Glen Ellyn
Average Family Size in Glen Ellyn is 3.1 People.
What is the Average Household Size in Glen Ellyn
Average Household Size in Glen Ellyn is 2.6 People.
How Large is the Labor Force in Glen Ellyn?
There are 13,978 People in the Labor Forcein in Glen Ellyn.
What is the Percentage of People in the Labor Force in Glen Ellyn?
63.8% of People are in the Labor Force in Glen Ellyn.
What is the Unemployment Rate in Glen Ellyn?
Unemployment Rate in Glen Ellyn is 5.1%.