Hometown, IL Map & Demographics
Hometown Map
Hometown Overview
$28,736
PER CAPITA INCOME
$64,250
AVG FAMILY INCOME
$56,841
AVG HOUSEHOLD INCOME
23.0%
WAGE / INCOME GAP [ % ]
77.0¢/ $1
WAGE / INCOME GAP [ $ ]
0.34
INEQUALITY / GINI INDEX
4,299
TOTAL POPULATION
2,127
MALE POPULATION
2,172
FEMALE POPULATION
97.93
MALES / 100 FEMALES
102.12
FEMALES / 100 MALES
39.7
MEDIAN AGE
3.2
AVG FAMILY SIZE
2.2
AVG HOUSEHOLD SIZE
2,279
LABOR FORCE [ PEOPLE ]
65.3%
PERCENT IN LABOR FORCE
5.9%
UNEMPLOYMENT RATE
Hometown Zip Codes
Hometown Area Codes
Income in Hometown
Income Overview in Hometown
Per Capita Income in Hometown is $28,736, while median incomes of families and households are $64,250 and $56,841 respectively.
| Characteristic | Number | Measure |
| Per Capita Income | 4,299 | $28,736 |
| Median Family Income | 959 | $64,250 |
| Mean Family Income | 959 | $78,896 |
| Median Household Income | 1,907 | $56,841 |
| Mean Household Income | 1,907 | $63,238 |
| Income Deficit | 959 | $0 |
| Wage / Income Gap (%) | 4,299 | 22.98% |
| Wage / Income Gap ($) | 4,299 | 77.02¢ per $1 |
| Gini / Inequality Index | 4,299 | 0.34 |
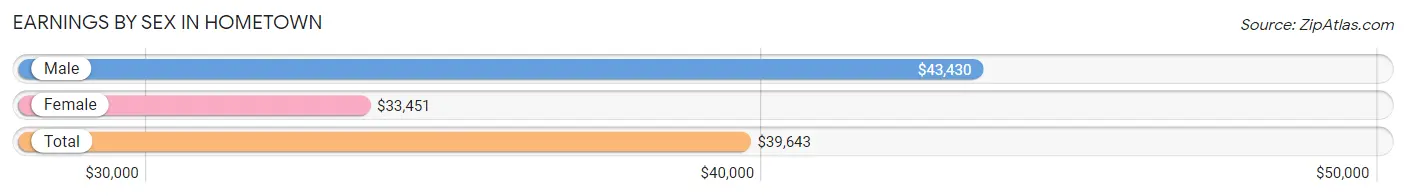
Earnings by Sex in Hometown
Average Earnings in Hometown are $39,643, $43,430 for men and $33,451 for women, a difference of 23.0%.
| Sex | Number | Average Earnings |
| Male | 1,212 (52.2%) | $43,430 |
| Female | 1,108 (47.8%) | $33,451 |
| Total | 2,320 (100.0%) | $39,643 |
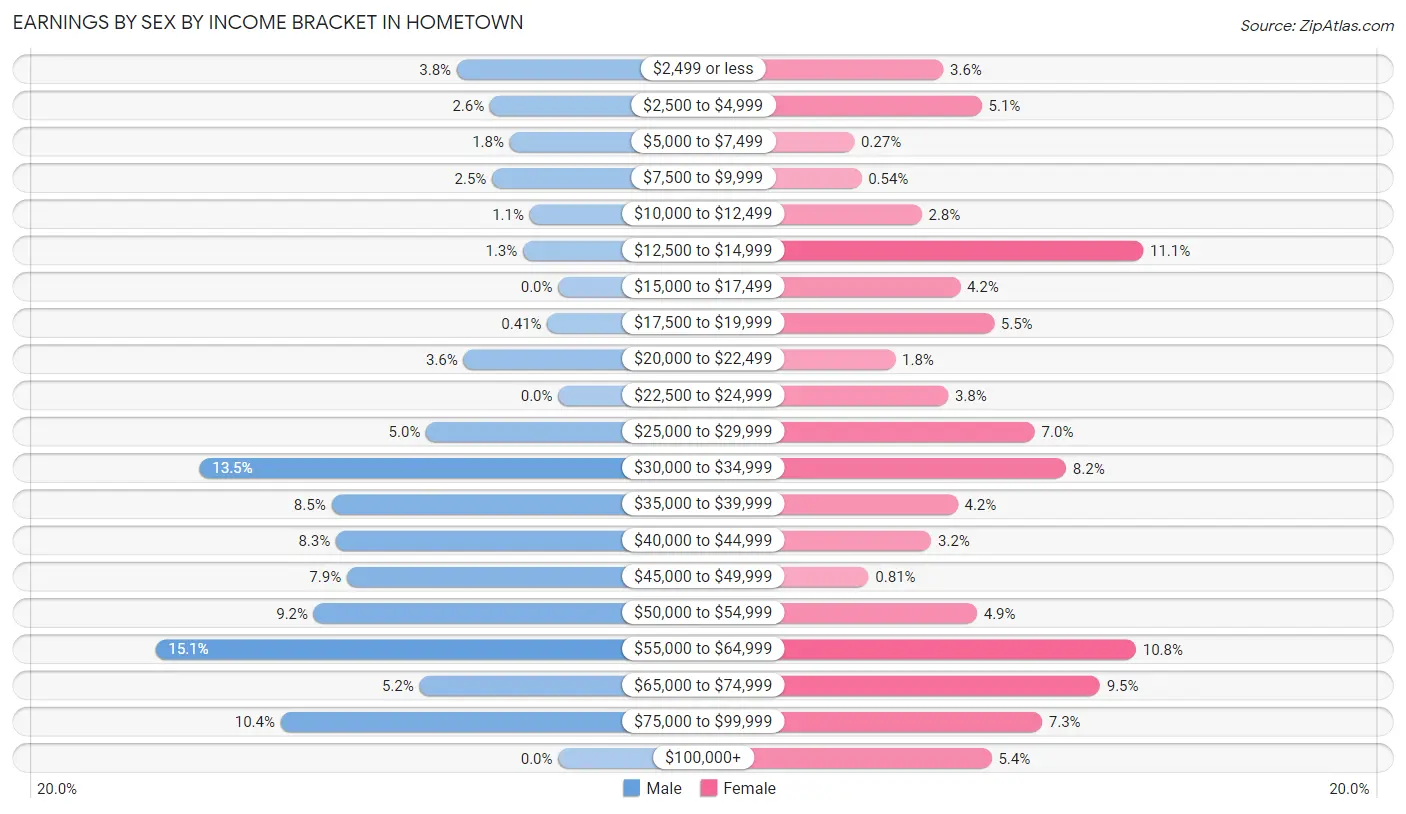
Earnings by Sex by Income Bracket in Hometown
The most common earnings brackets in Hometown are $55,000 to $64,999 for men (183 | 15.1%) and $12,500 to $14,999 for women (123 | 11.1%).
| Income | Male | Female |
| $2,499 or less | 46 (3.8%) | 40 (3.6%) |
| $2,500 to $4,999 | 31 (2.6%) | 56 (5.1%) |
| $5,000 to $7,499 | 22 (1.8%) | 3 (0.3%) |
| $7,500 to $9,999 | 30 (2.5%) | 6 (0.5%) |
| $10,000 to $12,499 | 13 (1.1%) | 31 (2.8%) |
| $12,500 to $14,999 | 16 (1.3%) | 123 (11.1%) |
| $15,000 to $17,499 | 0 (0.0%) | 47 (4.2%) |
| $17,500 to $19,999 | 5 (0.4%) | 61 (5.5%) |
| $20,000 to $22,499 | 43 (3.5%) | 20 (1.8%) |
| $22,500 to $24,999 | 0 (0.0%) | 42 (3.8%) |
| $25,000 to $29,999 | 60 (5.0%) | 78 (7.0%) |
| $30,000 to $34,999 | 163 (13.5%) | 91 (8.2%) |
| $35,000 to $39,999 | 103 (8.5%) | 46 (4.2%) |
| $40,000 to $44,999 | 101 (8.3%) | 35 (3.2%) |
| $45,000 to $49,999 | 96 (7.9%) | 9 (0.8%) |
| $50,000 to $54,999 | 111 (9.2%) | 54 (4.9%) |
| $55,000 to $64,999 | 183 (15.1%) | 120 (10.8%) |
| $65,000 to $74,999 | 63 (5.2%) | 105 (9.5%) |
| $75,000 to $99,999 | 126 (10.4%) | 81 (7.3%) |
| $100,000+ | 0 (0.0%) | 60 (5.4%) |
| Total | 1,212 (100.0%) | 1,108 (100.0%) |
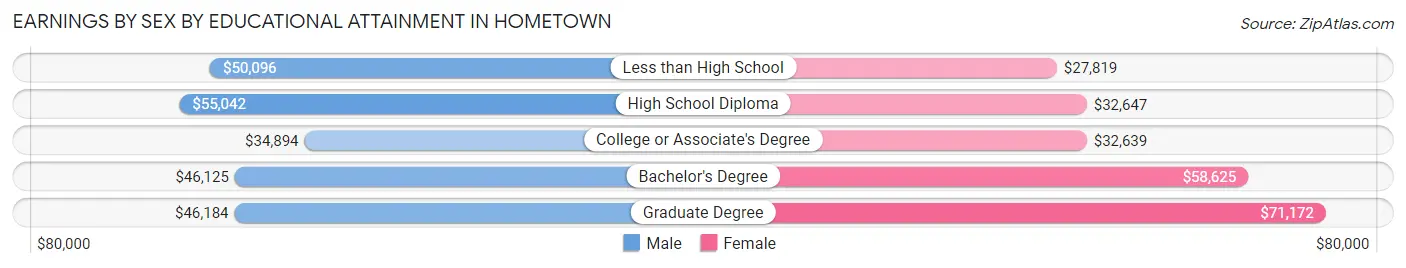
Earnings by Sex by Educational Attainment in Hometown
Average earnings in Hometown are $45,608 for men and $38,370 for women, a difference of 15.9%. Men with an educational attainment of high school diploma enjoy the highest average annual earnings of $55,042, while those with college or associate's degree education earn the least with $34,894. Women with an educational attainment of graduate degree earn the most with the average annual earnings of $71,172, while those with less than high school education have the smallest earnings of $27,819.
| Educational Attainment | Male Income | Female Income |
| Less than High School | $50,096 | $27,819 |
| High School Diploma | $55,042 | $32,647 |
| College or Associate's Degree | $34,894 | $32,639 |
| Bachelor's Degree | $46,125 | $58,625 |
| Graduate Degree | $46,184 | $71,172 |
| Total | $45,608 | $38,370 |
Family Income in Hometown
Family Income Brackets in Hometown
According to the Hometown family income data, there are 415 families falling into the $50,000 to $74,999 income range, which is the most common income bracket and makes up 43.3% of all families.
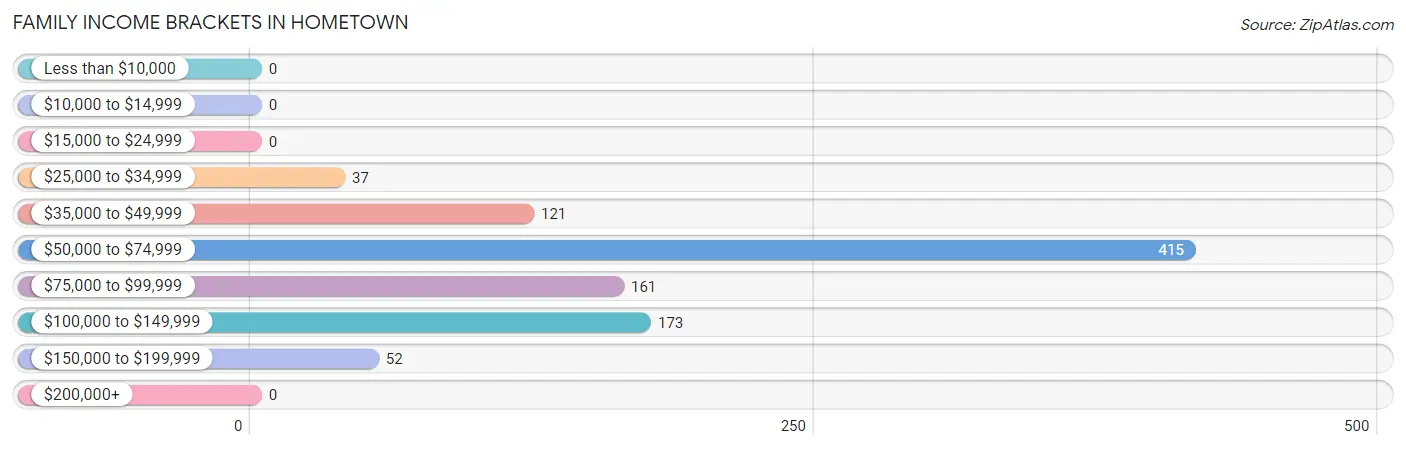
| Income Bracket | # Families | % Families |
| Less than $10,000 | 0 | 0.0% |
| $10,000 to $14,999 | 0 | 0.0% |
| $15,000 to $24,999 | 0 | 0.0% |
| $25,000 to $34,999 | 37 | 3.9% |
| $35,000 to $49,999 | 121 | 12.6% |
| $50,000 to $74,999 | 415 | 43.3% |
| $75,000 to $99,999 | 161 | 16.8% |
| $100,000 to $149,999 | 173 | 18.0% |
| $150,000 to $199,999 | 52 | 5.4% |
| $200,000+ | 0 | 0.0% |
Family Income by Famaliy Size in Hometown
4-person families (175 | 18.2%) account for the highest median family income in Hometown with $119,196 per family, while 4-person families (175 | 18.2%) have the highest median income of $29,799 per family member.
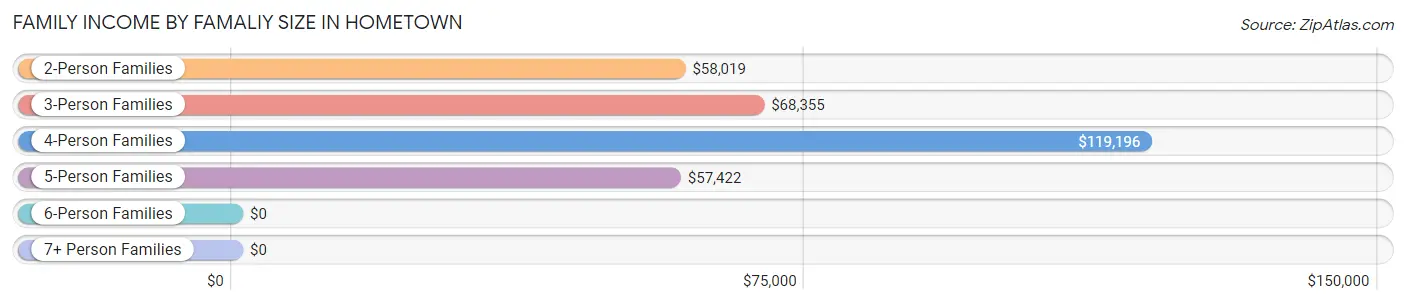
| Income Bracket | # Families | Median Income |
| 2-Person Families | 361 (37.6%) | $58,019 |
| 3-Person Families | 283 (29.5%) | $68,355 |
| 4-Person Families | 175 (18.2%) | $119,196 |
| 5-Person Families | 124 (12.9%) | $57,422 |
| 6-Person Families | 9 (0.9%) | $0 |
| 7+ Person Families | 7 (0.7%) | $0 |
| Total | 959 (100.0%) | $64,250 |
Family Income by Number of Earners in Hometown
The median family income in Hometown is $64,250, with families comprising 3+ earners (102) having the highest median family income of $122,833, while families with no earners (60) have the lowest median family income of $51,944, accounting for 10.6% and 6.3% of families, respectively.
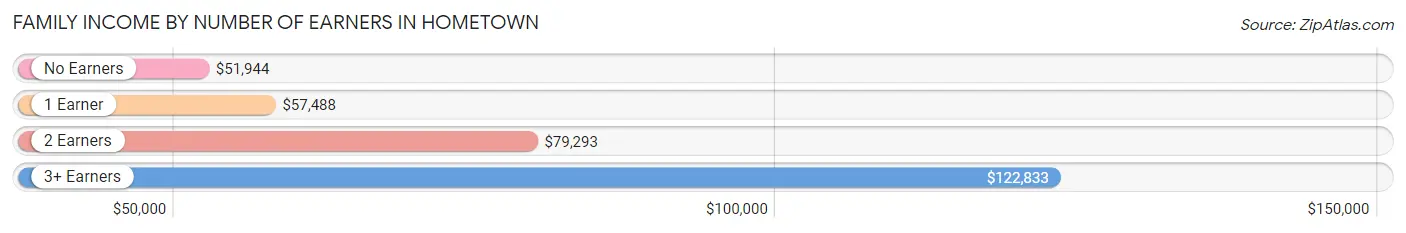
| Number of Earners | # Families | Median Income |
| No Earners | 60 (6.3%) | $51,944 |
| 1 Earner | 443 (46.2%) | $57,488 |
| 2 Earners | 354 (36.9%) | $79,293 |
| 3+ Earners | 102 (10.6%) | $122,833 |
| Total | 959 (100.0%) | $64,250 |
Household Income in Hometown
Household Income Brackets in Hometown
With 576 households falling in the category, the $50,000 to $74,999 income range is the most frequent in Hometown, accounting for 30.2% of all households.
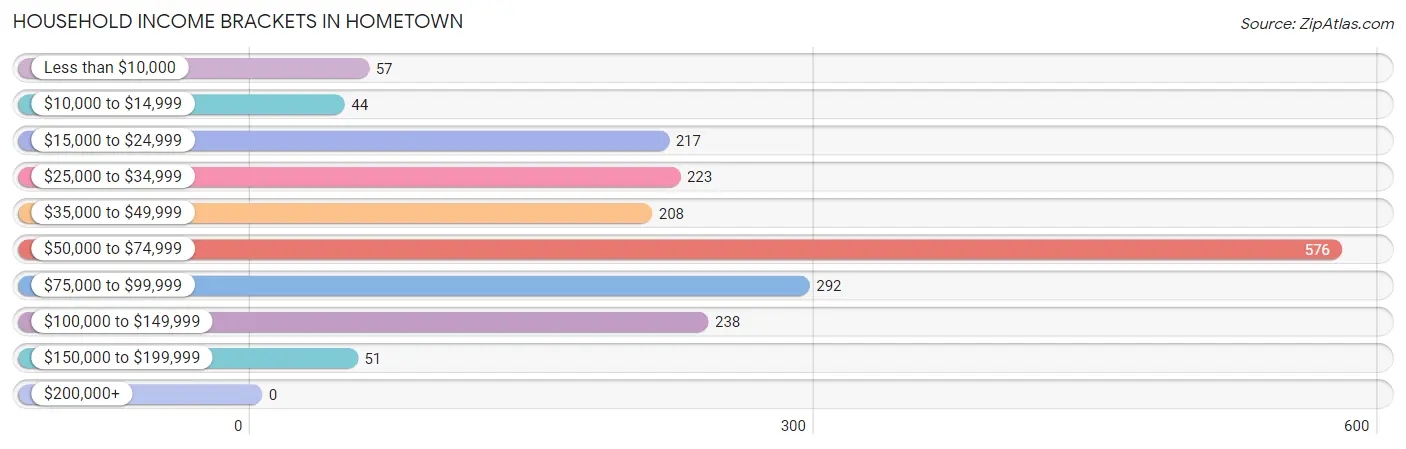
| Income Bracket | # Households | % Households |
| Less than $10,000 | 57 | 3.0% |
| $10,000 to $14,999 | 44 | 2.3% |
| $15,000 to $24,999 | 217 | 11.4% |
| $25,000 to $34,999 | 223 | 11.7% |
| $35,000 to $49,999 | 208 | 10.9% |
| $50,000 to $74,999 | 576 | 30.2% |
| $75,000 to $99,999 | 292 | 15.3% |
| $100,000 to $149,999 | 238 | 12.5% |
| $150,000 to $199,999 | 51 | 2.7% |
| $200,000+ | 0 | 0.0% |
Household Income by Householder Age in Hometown
The median household income in Hometown is $56,841, with the highest median household income of $78,370 found in the 25 to 44 years age bracket for the primary householder. A total of 510 households (26.7%) fall into this category. Meanwhile, the 15 to 24 years age bracket for the primary householder has the lowest median household income of $0, with 18 households (0.9%) in this group.
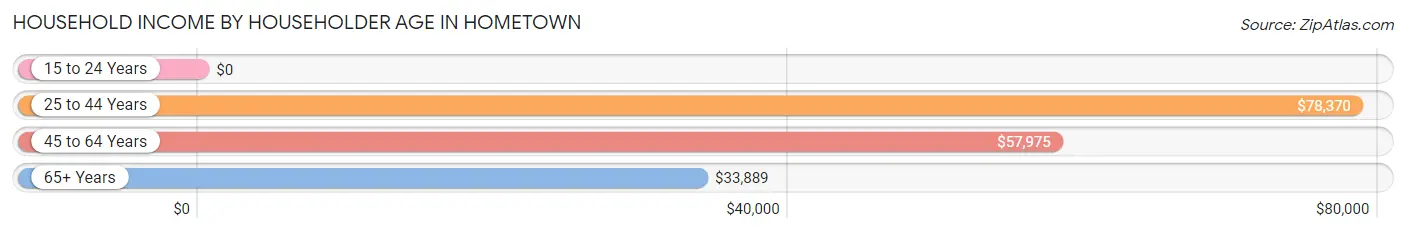
| Income Bracket | # Households | Median Income |
| 15 to 24 Years | 18 (0.9%) | $0 |
| 25 to 44 Years | 510 (26.7%) | $78,370 |
| 45 to 64 Years | 807 (42.3%) | $57,975 |
| 65+ Years | 572 (30.0%) | $33,889 |
| Total | 1,907 (100.0%) | $56,841 |
Poverty in Hometown
Income Below Poverty by Sex and Age in Hometown
With 3.9% poverty level for males and 7.2% for females among the residents of Hometown, 16 and 17 year old males and 65 to 74 year old females are the most vulnerable to poverty, with 9 males (28.1%) and 68 females (34.7%) in their respective age groups living below the poverty level.
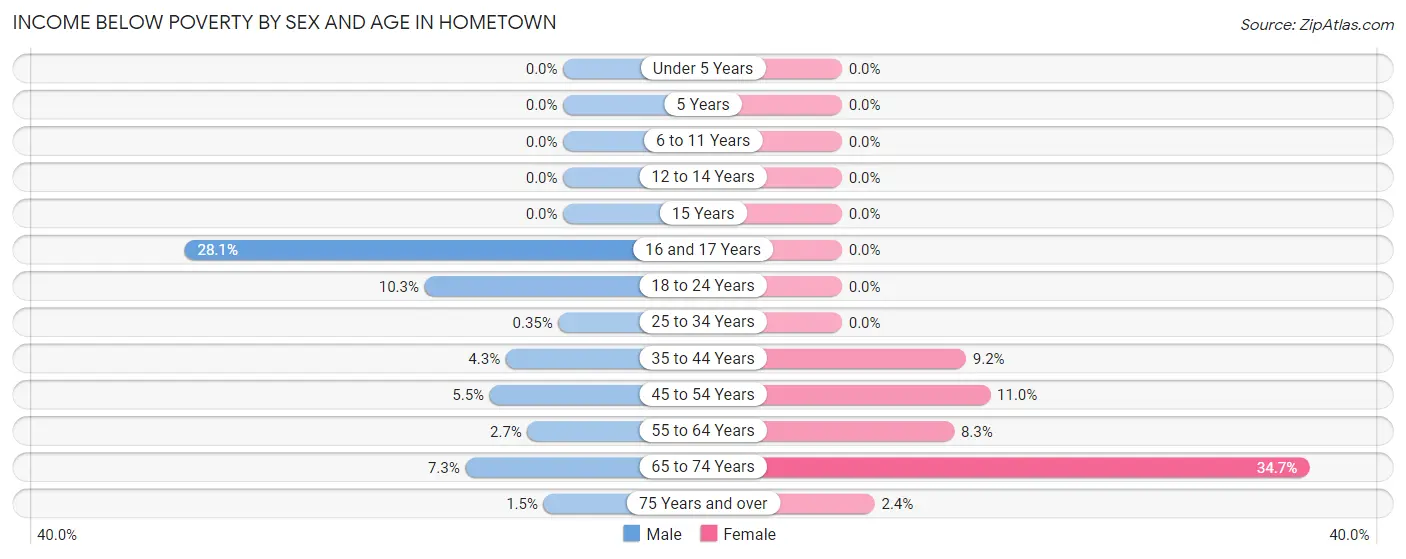
| Age Bracket | Male | Female |
| Under 5 Years | 0 (0.0%) | 0 (0.0%) |
| 5 Years | 0 (0.0%) | 0 (0.0%) |
| 6 to 11 Years | 0 (0.0%) | 0 (0.0%) |
| 12 to 14 Years | 0 (0.0%) | 0 (0.0%) |
| 15 Years | 0 (0.0%) | 0 (0.0%) |
| 16 and 17 Years | 9 (28.1%) | 0 (0.0%) |
| 18 to 24 Years | 18 (10.3%) | 0 (0.0%) |
| 25 to 34 Years | 1 (0.4%) | 0 (0.0%) |
| 35 to 44 Years | 16 (4.3%) | 21 (9.2%) |
| 45 to 54 Years | 11 (5.4%) | 38 (11.0%) |
| 55 to 64 Years | 9 (2.6%) | 25 (8.3%) |
| 65 to 74 Years | 17 (7.3%) | 68 (34.7%) |
| 75 Years and over | 1 (1.5%) | 5 (2.4%) |
| Total | 82 (3.9%) | 157 (7.2%) |
Income Above Poverty by Sex and Age in Hometown
According to the poverty statistics in Hometown, males aged under 5 years and females aged under 5 years are the age groups that are most secure financially, with 100.0% of males and 100.0% of females in these age groups living above the poverty line.
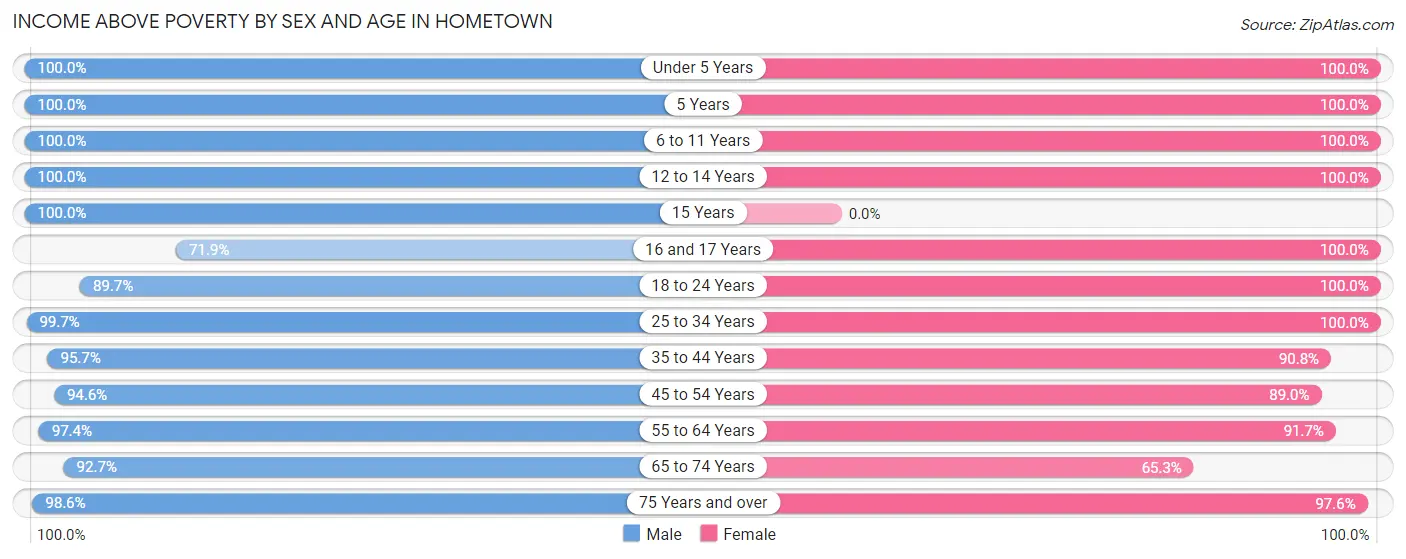
| Age Bracket | Male | Female |
| Under 5 Years | 121 (100.0%) | 38 (100.0%) |
| 5 Years | 39 (100.0%) | 22 (100.0%) |
| 6 to 11 Years | 138 (100.0%) | 281 (100.0%) |
| 12 to 14 Years | 106 (100.0%) | 53 (100.0%) |
| 15 Years | 11 (100.0%) | 0 (0.0%) |
| 16 and 17 Years | 23 (71.9%) | 20 (100.0%) |
| 18 to 24 Years | 157 (89.7%) | 233 (100.0%) |
| 25 to 34 Years | 283 (99.7%) | 250 (100.0%) |
| 35 to 44 Years | 360 (95.7%) | 207 (90.8%) |
| 45 to 54 Years | 191 (94.6%) | 307 (89.0%) |
| 55 to 64 Years | 331 (97.4%) | 275 (91.7%) |
| 65 to 74 Years | 217 (92.7%) | 128 (65.3%) |
| 75 Years and over | 68 (98.6%) | 201 (97.6%) |
| Total | 2,045 (96.1%) | 2,015 (92.8%) |
Income Below Poverty Among Married-Couple Families in Hometown
The poverty statistics for married-couple families in Hometown show that 1.5% or 10 of the total 648 families live below the poverty line. Families with 1 or 2 children have the highest poverty rate of 4.7%, comprising of 10 families. On the other hand, families with no children have the lowest poverty rate of 0.0%, which includes 0 families.
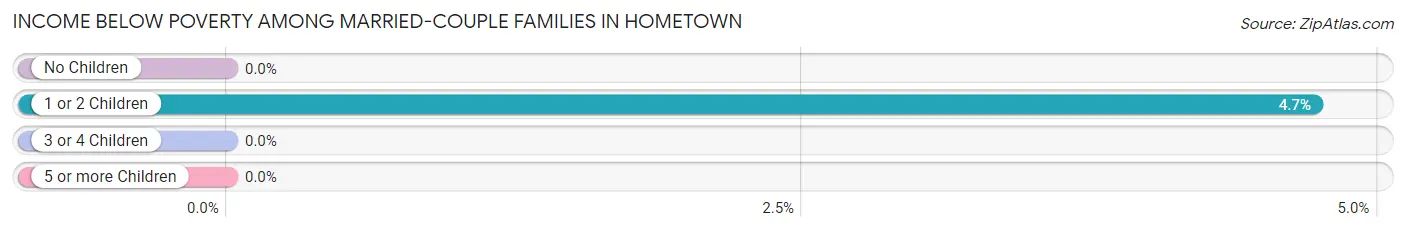
| Children | Above Poverty | Below Poverty |
| No Children | 310 (100.0%) | 0 (0.0%) |
| 1 or 2 Children | 202 (95.3%) | 10 (4.7%) |
| 3 or 4 Children | 126 (100.0%) | 0 (0.0%) |
| 5 or more Children | 0 (0.0%) | 0 (0.0%) |
| Total | 638 (98.5%) | 10 (1.5%) |
Income Below Poverty Among Single-Parent Households in Hometown
| Children | Single Father | Single Mother |
| No Children | 0 (0.0%) | 0 (0.0%) |
| 1 or 2 Children | 0 (0.0%) | 0 (0.0%) |
| 3 or 4 Children | 0 (0.0%) | 0 (0.0%) |
| 5 or more Children | 0 (0.0%) | 0 (0.0%) |
| Total | 0 (0.0%) | 0 (0.0%) |
Income Below Poverty Among Married-Couple vs Single-Parent Households in Hometown
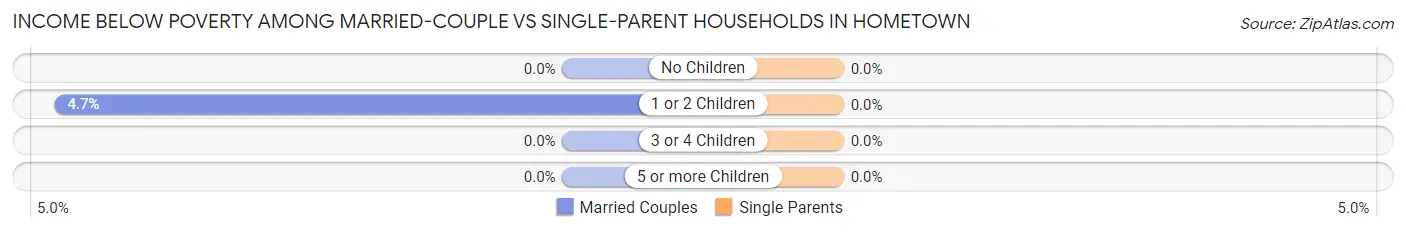
| Children | Married-Couple Families | Single-Parent Households |
| No Children | 0 (0.0%) | 0 (0.0%) |
| 1 or 2 Children | 10 (4.7%) | 0 (0.0%) |
| 3 or 4 Children | 0 (0.0%) | 0 (0.0%) |
| 5 or more Children | 0 (0.0%) | 0 (0.0%) |
| Total | 10 (1.5%) | 0 (0.0%) |
Race in Hometown
The most populous races in Hometown are White / Caucasian (2,984 | 69.4%), Hispanic or Latino (1,368 | 31.8%), and Two or more Races (609 | 14.2%).
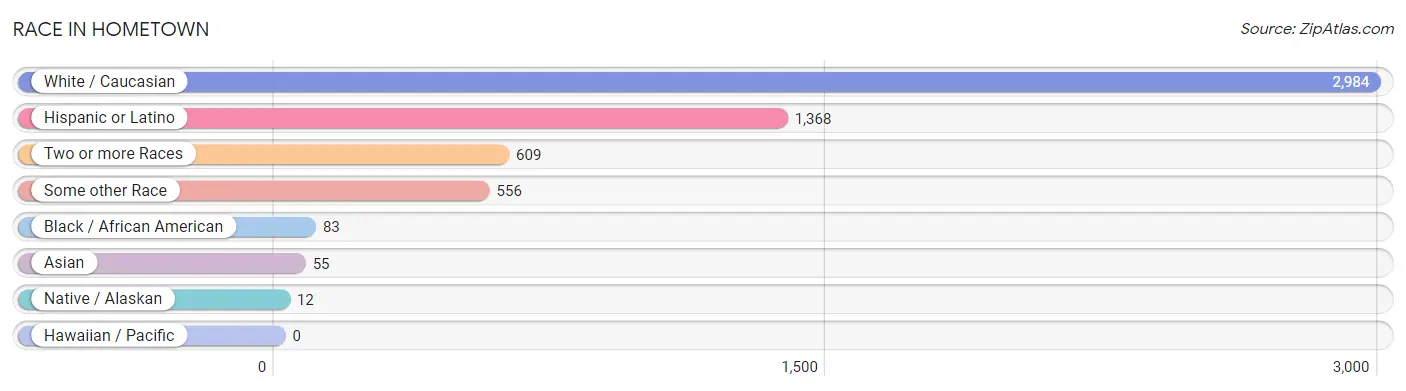
| Race | # Population | % Population |
| Asian | 55 | 1.3% |
| Black / African American | 83 | 1.9% |
| Hawaiian / Pacific | 0 | 0.0% |
| Hispanic or Latino | 1,368 | 31.8% |
| Native / Alaskan | 12 | 0.3% |
| White / Caucasian | 2,984 | 69.4% |
| Two or more Races | 609 | 14.2% |
| Some other Race | 556 | 12.9% |
| Total | 4,299 | 100.0% |
Ancestry in Hometown
The most populous ancestries reported in Hometown are Mexican (1,071 | 24.9%), Irish (1,047 | 24.3%), German (768 | 17.9%), Polish (515 | 12.0%), and Italian (479 | 11.1%), together accounting for 90.2% of all Hometown residents.
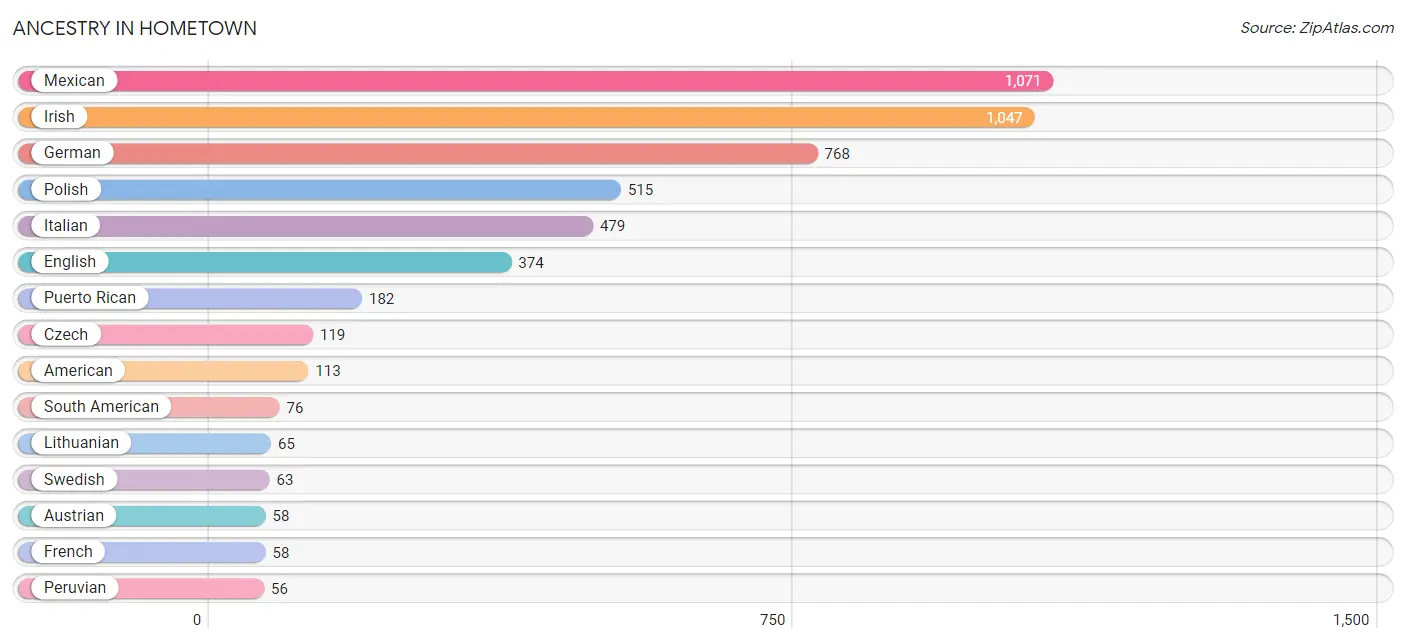
| Ancestry | # Population | % Population |
| Albanian | 41 | 0.9% |
| American | 113 | 2.6% |
| Austrian | 58 | 1.3% |
| Belgian | 34 | 0.8% |
| Bhutanese | 44 | 1.0% |
| Croatian | 30 | 0.7% |
| Czech | 119 | 2.8% |
| Danish | 36 | 0.8% |
| Dutch | 44 | 1.0% |
| Ecuadorian | 20 | 0.5% |
| English | 374 | 8.7% |
| Finnish | 13 | 0.3% |
| French | 58 | 1.3% |
| German | 768 | 17.9% |
| Greek | 21 | 0.5% |
| Hungarian | 5 | 0.1% |
| Indonesian | 1 | 0.0% |
| Irish | 1,047 | 24.3% |
| Italian | 479 | 11.1% |
| Korean | 10 | 0.2% |
| Lithuanian | 65 | 1.5% |
| Mexican | 1,071 | 24.9% |
| Mexican American Indian | 12 | 0.3% |
| Norwegian | 5 | 0.1% |
| Peruvian | 56 | 1.3% |
| Polish | 515 | 12.0% |
| Puerto Rican | 182 | 4.2% |
| Russian | 20 | 0.5% |
| Scandinavian | 10 | 0.2% |
| Scotch-Irish | 2 | 0.1% |
| Slovak | 13 | 0.3% |
| South American | 76 | 1.8% |
| South American Indian | 56 | 1.3% |
| Swedish | 63 | 1.5% |
| Welsh | 20 | 0.5% | View All 35 Rows |
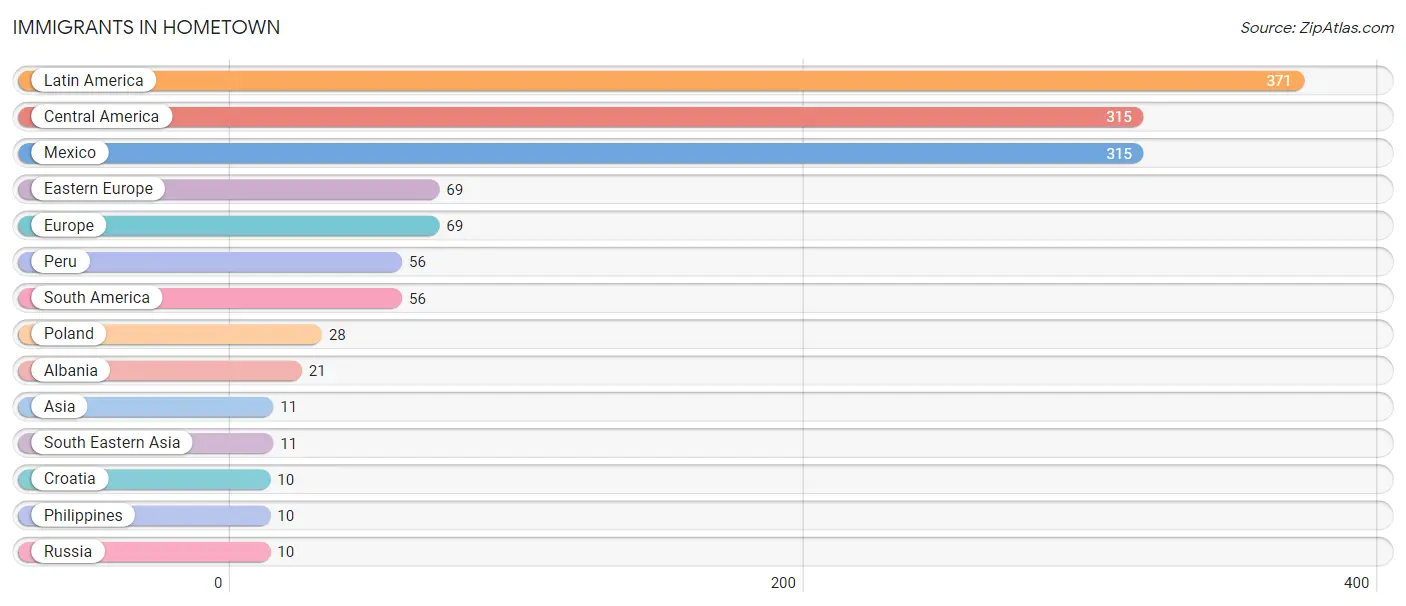
Immigrants in Hometown
The most numerous immigrant groups reported in Hometown came from Latin America (371 | 8.6%), Central America (315 | 7.3%), Mexico (315 | 7.3%), Eastern Europe (69 | 1.6%), and Europe (69 | 1.6%), together accounting for 26.5% of all Hometown residents.
| Immigration Origin | # Population | % Population |
| Albania | 21 | 0.5% |
| Asia | 11 | 0.3% |
| Central America | 315 | 7.3% |
| Croatia | 10 | 0.2% |
| Eastern Europe | 69 | 1.6% |
| Europe | 69 | 1.6% |
| Latin America | 371 | 8.6% |
| Mexico | 315 | 7.3% |
| Peru | 56 | 1.3% |
| Philippines | 10 | 0.2% |
| Poland | 28 | 0.6% |
| Russia | 10 | 0.2% |
| South America | 56 | 1.3% |
| South Eastern Asia | 11 | 0.3% | View All 14 Rows |
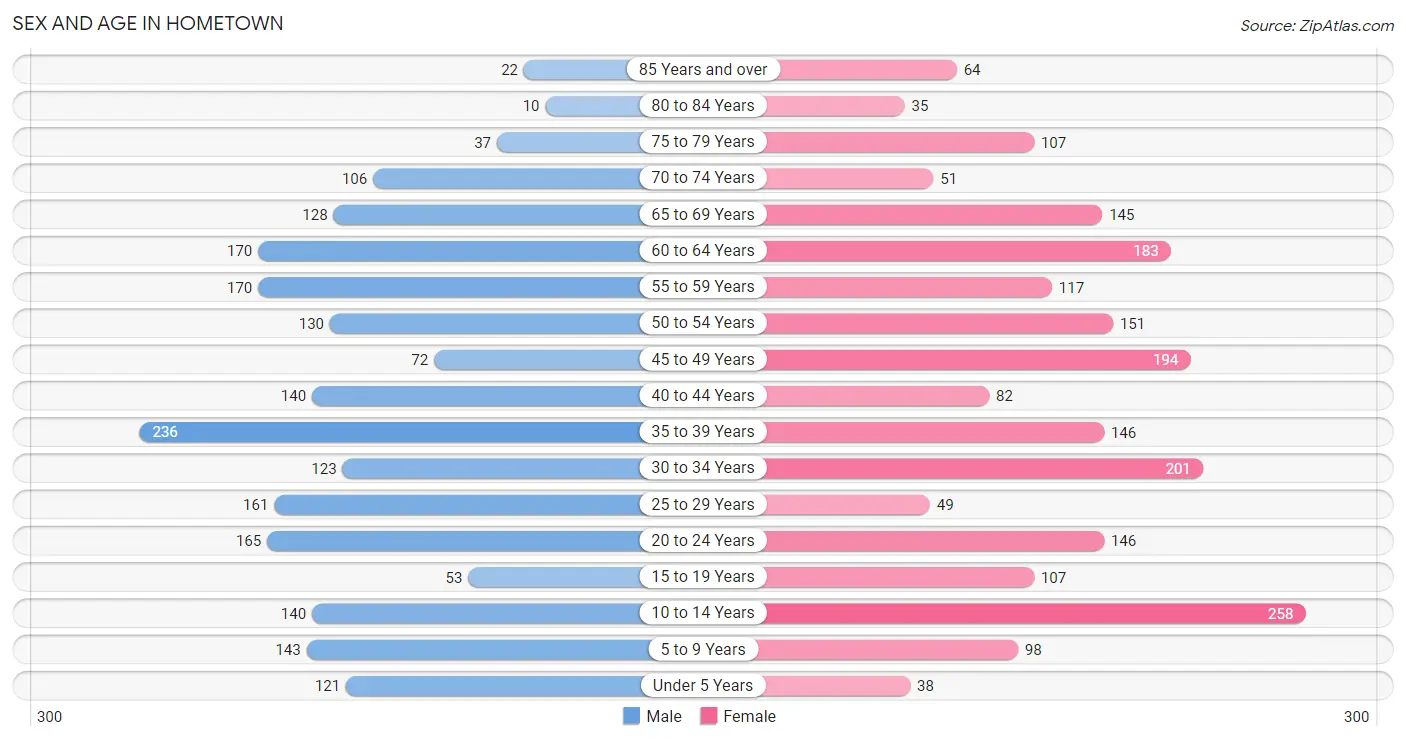
Sex and Age in Hometown
Sex and Age in Hometown
The most populous age groups in Hometown are 35 to 39 Years (236 | 11.1%) for men and 10 to 14 Years (258 | 11.9%) for women.
| Age Bracket | Male | Female |
| Under 5 Years | 121 (5.7%) | 38 (1.8%) |
| 5 to 9 Years | 143 (6.7%) | 98 (4.5%) |
| 10 to 14 Years | 140 (6.6%) | 258 (11.9%) |
| 15 to 19 Years | 53 (2.5%) | 107 (4.9%) |
| 20 to 24 Years | 165 (7.8%) | 146 (6.7%) |
| 25 to 29 Years | 161 (7.6%) | 49 (2.3%) |
| 30 to 34 Years | 123 (5.8%) | 201 (9.2%) |
| 35 to 39 Years | 236 (11.1%) | 146 (6.7%) |
| 40 to 44 Years | 140 (6.6%) | 82 (3.8%) |
| 45 to 49 Years | 72 (3.4%) | 194 (8.9%) |
| 50 to 54 Years | 130 (6.1%) | 151 (7.0%) |
| 55 to 59 Years | 170 (8.0%) | 117 (5.4%) |
| 60 to 64 Years | 170 (8.0%) | 183 (8.4%) |
| 65 to 69 Years | 128 (6.0%) | 145 (6.7%) |
| 70 to 74 Years | 106 (5.0%) | 51 (2.4%) |
| 75 to 79 Years | 37 (1.7%) | 107 (4.9%) |
| 80 to 84 Years | 10 (0.5%) | 35 (1.6%) |
| 85 Years and over | 22 (1.0%) | 64 (2.9%) |
| Total | 2,127 (100.0%) | 2,172 (100.0%) |
Families and Households in Hometown
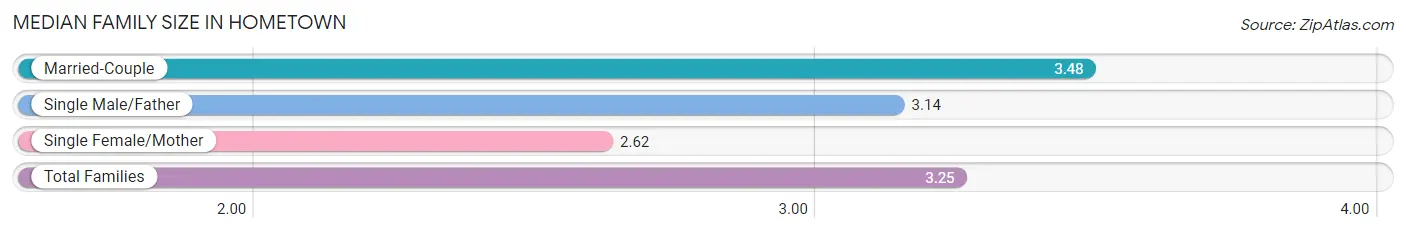
Median Family Size in Hometown
The median family size in Hometown is 3.25 persons per family, with married-couple families (648 | 67.6%) accounting for the largest median family size of 3.48 persons per family. On the other hand, single female/mother families (217 | 22.6%) represent the smallest median family size with 2.62 persons per family.
| Family Type | # Families | Family Size |
| Married-Couple | 648 (67.6%) | 3.48 |
| Single Male/Father | 94 (9.8%) | 3.14 |
| Single Female/Mother | 217 (22.6%) | 2.62 |
| Total Families | 959 (100.0%) | 3.25 |
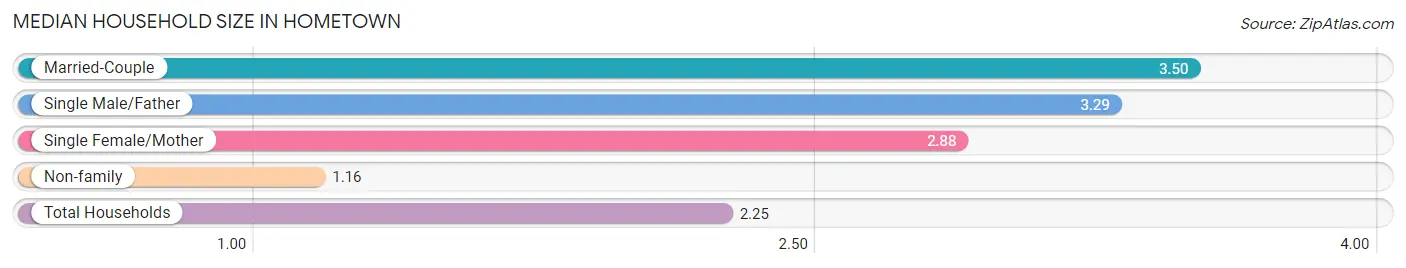
Median Household Size in Hometown
The median household size in Hometown is 2.25 persons per household, with married-couple households (648 | 34.0%) accounting for the largest median household size of 3.5 persons per household. non-family households (948 | 49.7%) represent the smallest median household size with 1.16 persons per household.
| Household Type | # Households | Household Size |
| Married-Couple | 648 (34.0%) | 3.50 |
| Single Male/Father | 94 (4.9%) | 3.29 |
| Single Female/Mother | 217 (11.4%) | 2.88 |
| Non-family | 948 (49.7%) | 1.16 |
| Total Households | 1,907 (100.0%) | 2.25 |
Household Size by Marriage Status in Hometown
Out of a total of 1,907 households in Hometown, 959 (50.3%) are family households, while 948 (49.7%) are nonfamily households. The most numerous type of family households are 2-person households, comprising 332, and the most common type of nonfamily households are 1-person households, comprising 813.
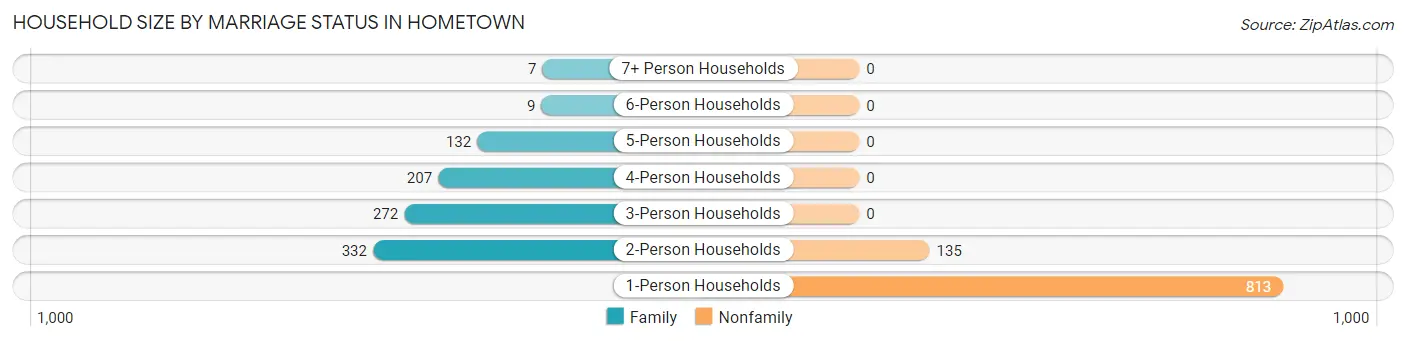
| Household Size | Family Households | Nonfamily Households |
| 1-Person Households | - | 813 (42.6%) |
| 2-Person Households | 332 (17.4%) | 135 (7.1%) |
| 3-Person Households | 272 (14.3%) | 0 (0.0%) |
| 4-Person Households | 207 (10.8%) | 0 (0.0%) |
| 5-Person Households | 132 (6.9%) | 0 (0.0%) |
| 6-Person Households | 9 (0.5%) | 0 (0.0%) |
| 7+ Person Households | 7 (0.4%) | 0 (0.0%) |
| Total | 959 (50.3%) | 948 (49.7%) |
Female Fertility in Hometown
Fertility by Age in Hometown
Average fertility rate in Hometown is 26.0 births per 1,000 women. Women in the age bracket of 20 to 34 years have the highest fertility rate with 43.0 births per 1,000 women. Women in the age bracket of 20 to 34 years acount for 68.0% of all women with births.
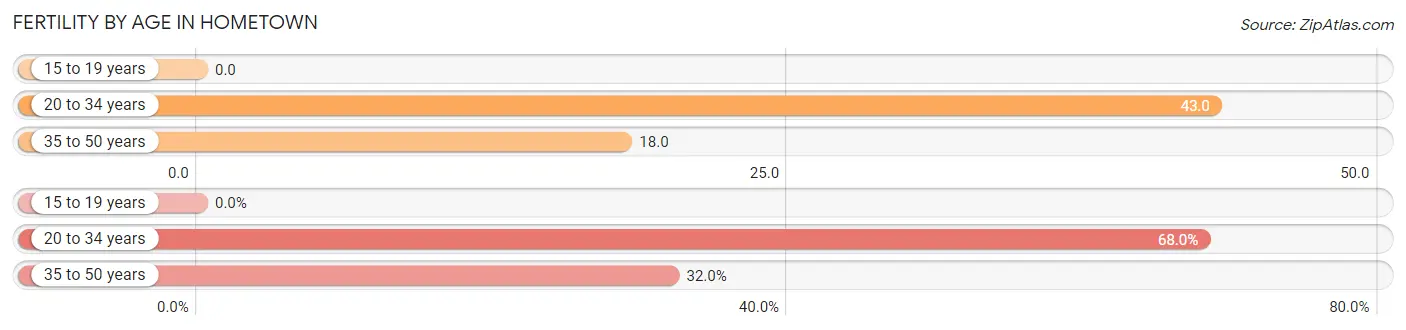
| Age Bracket | Women with Births | Births / 1,000 Women |
| 15 to 19 years | 0 (0.0%) | 0.0 |
| 20 to 34 years | 17 (68.0%) | 43.0 |
| 35 to 50 years | 8 (32.0%) | 18.0 |
| Total | 25 (100.0%) | 26.0 |
Fertility by Age by Marriage Status in Hometown
52.0% of women with births (25) in Hometown are married. The highest percentage of unmarried women with births falls into 20 to 34 years age bracket with 70.6% of them unmarried at the time of birth, while the lowest percentage of unmarried women with births belong to 35 to 50 years age bracket with 0.0% of them unmarried.
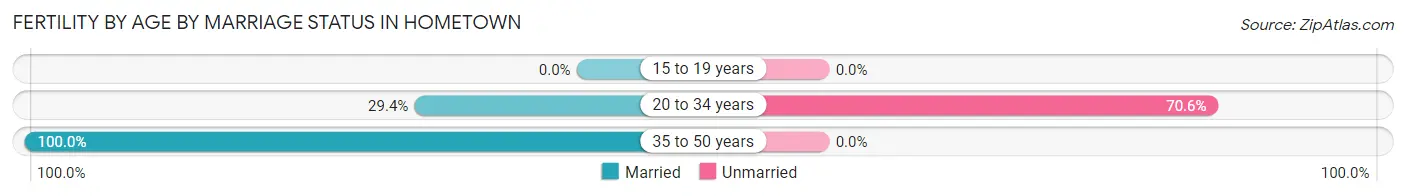
| Age Bracket | Married | Unmarried |
| 15 to 19 years | 0 (0.0%) | 0 (0.0%) |
| 20 to 34 years | 5 (29.4%) | 12 (70.6%) |
| 35 to 50 years | 8 (100.0%) | 0 (0.0%) |
| Total | 13 (52.0%) | 12 (48.0%) |
Fertility by Education in Hometown
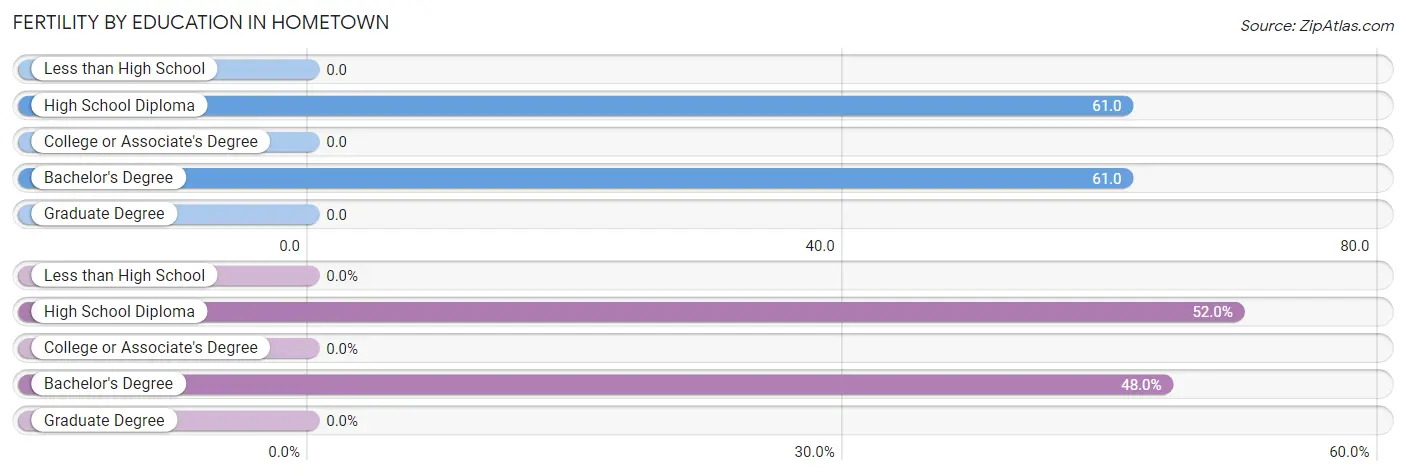
| Educational Attainment | Women with Births | Births / 1,000 Women |
| Less than High School | 0 (0.0%) | 0.0 |
| High School Diploma | 13 (52.0%) | 61.0 |
| College or Associate's Degree | 0 (0.0%) | 0.0 |
| Bachelor's Degree | 12 (48.0%) | 61.0 |
| Graduate Degree | 0 (0.0%) | 0.0 |
| Total | 25 (100.0%) | 26.0 |
Fertility by Education by Marriage Status in Hometown
48.0% of women with births in Hometown are unmarried. Women with the educational attainment of high school diploma are most likely to be married with 100.0% of them married at childbirth, while women with the educational attainment of bachelor's degree are least likely to be married with 100.0% of them unmarried at childbirth.
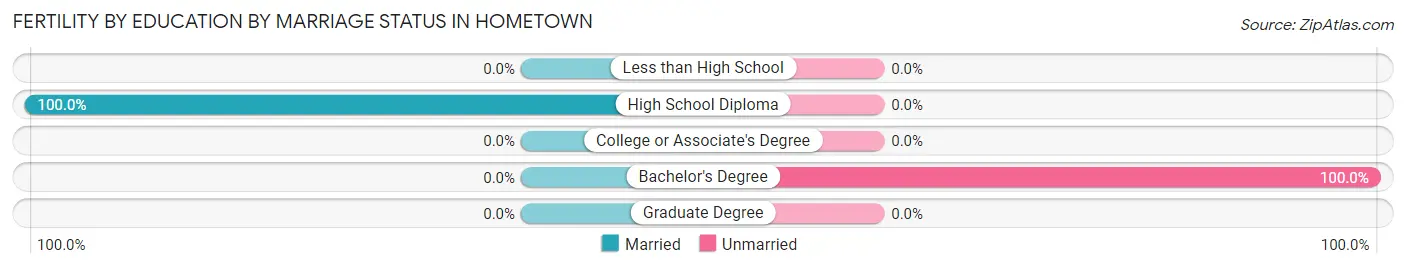
| Educational Attainment | Married | Unmarried |
| Less than High School | 0 (0.0%) | 0 (0.0%) |
| High School Diploma | 13 (100.0%) | 0 (0.0%) |
| College or Associate's Degree | 0 (0.0%) | 0 (0.0%) |
| Bachelor's Degree | 0 (0.0%) | 12 (100.0%) |
| Graduate Degree | 0 (0.0%) | 0 (0.0%) |
| Total | 13 (52.0%) | 12 (48.0%) |
Employment Characteristics in Hometown
Employment by Class of Employer in Hometown
Among the 1,997 employed individuals in Hometown, private company employees (1,321 | 66.1%), not-for-profit organizations (267 | 13.4%), and state government employees (158 | 7.9%) make up the most common classes of employment.
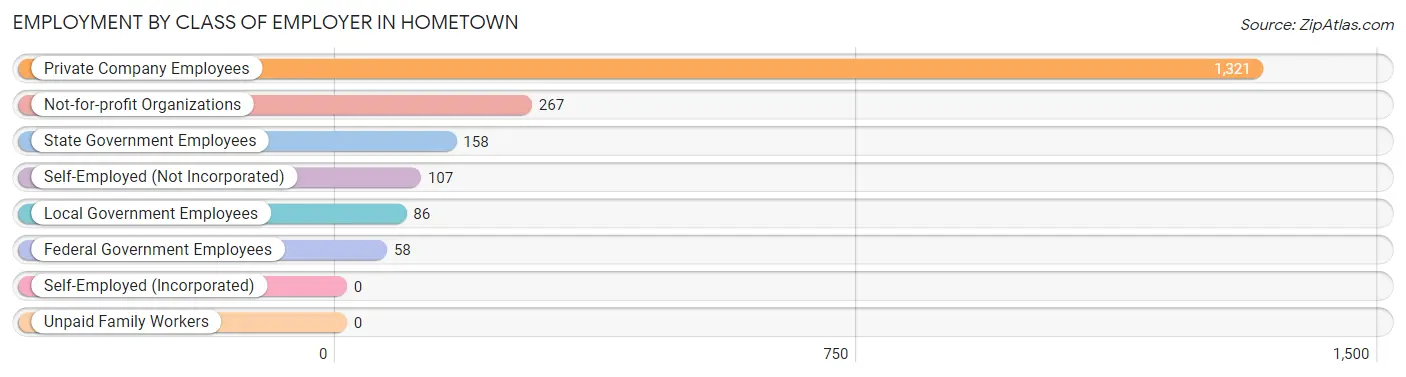
| Employer Class | # Employees | % Employees |
| Private Company Employees | 1,321 | 66.1% |
| Self-Employed (Incorporated) | 0 | 0.0% |
| Self-Employed (Not Incorporated) | 107 | 5.4% |
| Not-for-profit Organizations | 267 | 13.4% |
| Local Government Employees | 86 | 4.3% |
| State Government Employees | 158 | 7.9% |
| Federal Government Employees | 58 | 2.9% |
| Unpaid Family Workers | 0 | 0.0% |
| Total | 1,997 | 100.0% |
Employment Status by Age in Hometown
According to the labor force statistics for Hometown, out of the total population over 16 years of age (3,490), 65.3% or 2,279 individuals are in the labor force, with 5.9% or 134 of them unemployed. The age group with the highest labor force participation rate is 25 to 29 years, with 99.5% or 209 individuals in the labor force. Within the labor force, the 20 to 24 years age range has the highest percentage of unemployed individuals, with 26.6% or 43 of them being unemployed.
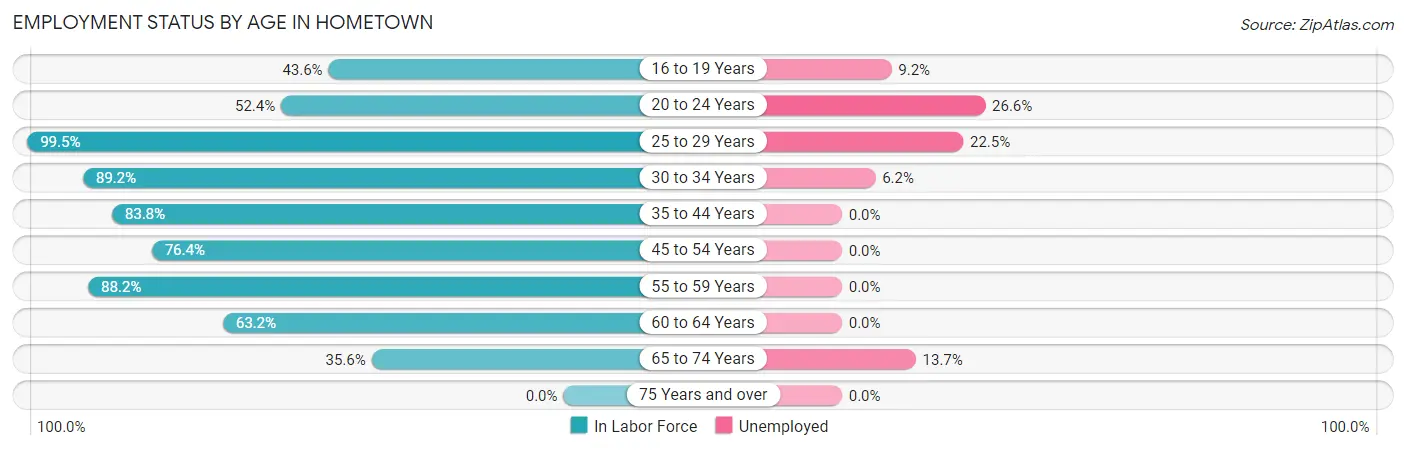
| Age Bracket | In Labor Force | Unemployed |
| 16 to 19 Years | 65 (43.6%) | 6 (9.2%) |
| 20 to 24 Years | 163 (52.4%) | 43 (26.6%) |
| 25 to 29 Years | 209 (99.5%) | 47 (22.5%) |
| 30 to 34 Years | 289 (89.2%) | 18 (6.2%) |
| 35 to 44 Years | 506 (83.8%) | 0 (0.0%) |
| 45 to 54 Years | 418 (76.4%) | 0 (0.0%) |
| 55 to 59 Years | 253 (88.2%) | 0 (0.0%) |
| 60 to 64 Years | 223 (63.2%) | 0 (0.0%) |
| 65 to 74 Years | 153 (35.6%) | 21 (13.7%) |
| 75 Years and over | 0 (0.0%) | 0 (0.0%) |
| Total | 2,279 (65.3%) | 134 (5.9%) |
Employment Status by Educational Attainment in Hometown
According to labor force statistics for Hometown, 81.6% of individuals (1,897) out of the total population between 25 and 64 years of age (2,325) are in the labor force, with 3.4% or 64 of them being unemployed. The group with the highest labor force participation rate are those with the educational attainment of bachelor's degree or higher, with 92.7% or 458 individuals in the labor force. Within the labor force, individuals with college / associate degree education have the highest percentage of unemployment, with 10.8% or 65 of them being unemployed.
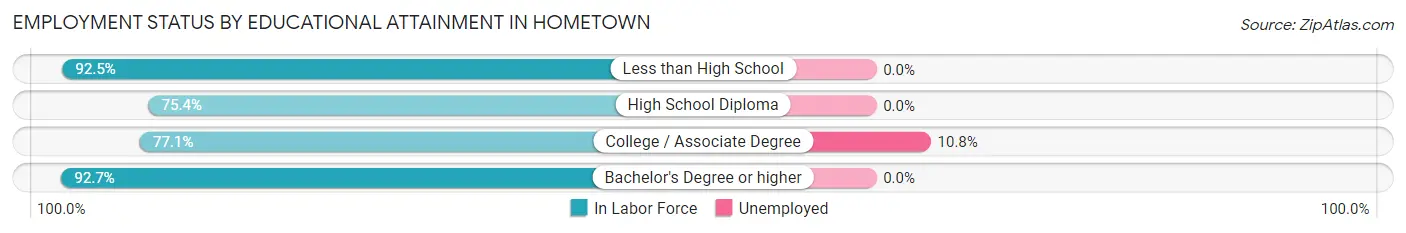
| Educational Attainment | In Labor Force | Unemployed |
| Less than High School | 247 (92.5%) | 0 (0.0%) |
| High School Diploma | 593 (75.4%) | 0 (0.0%) |
| College / Associate Degree | 600 (77.1%) | 84 (10.8%) |
| Bachelor's Degree or higher | 458 (92.7%) | 0 (0.0%) |
| Total | 1,897 (81.6%) | 79 (3.4%) |
Employment Occupations by Sex in Hometown
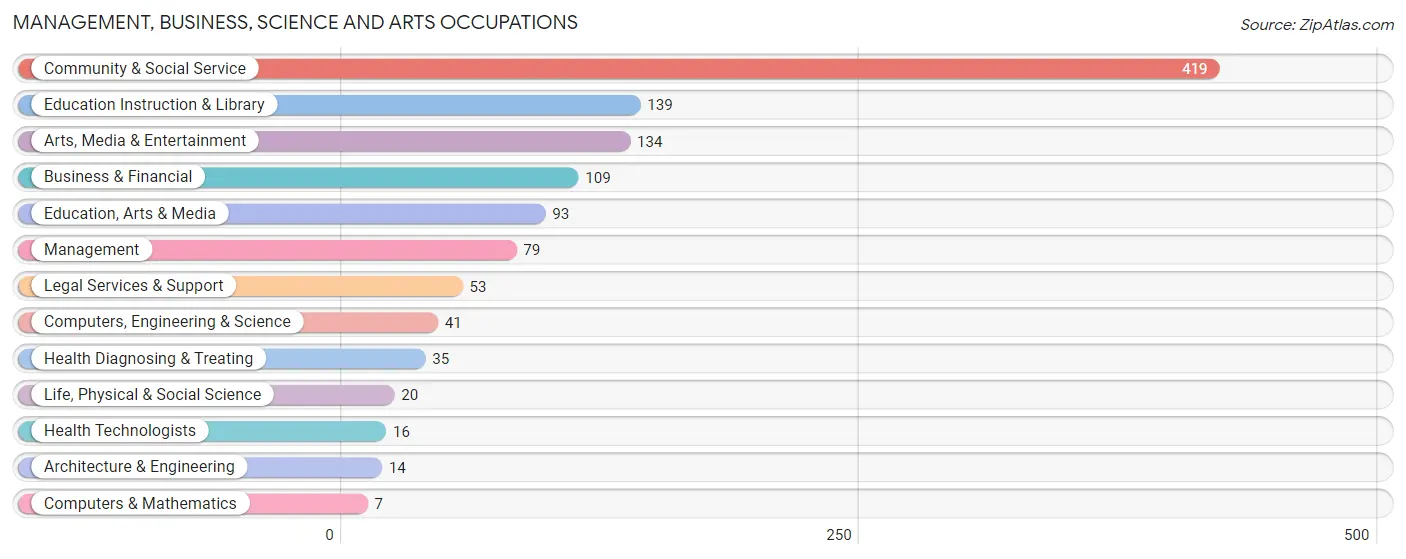
Management, Business, Science and Arts Occupations
The most common Management, Business, Science and Arts occupations in Hometown are Community & Social Service (419 | 19.6%), Education Instruction & Library (139 | 6.5%), Arts, Media & Entertainment (134 | 6.3%), Business & Financial (109 | 5.1%), and Education, Arts & Media (93 | 4.3%).
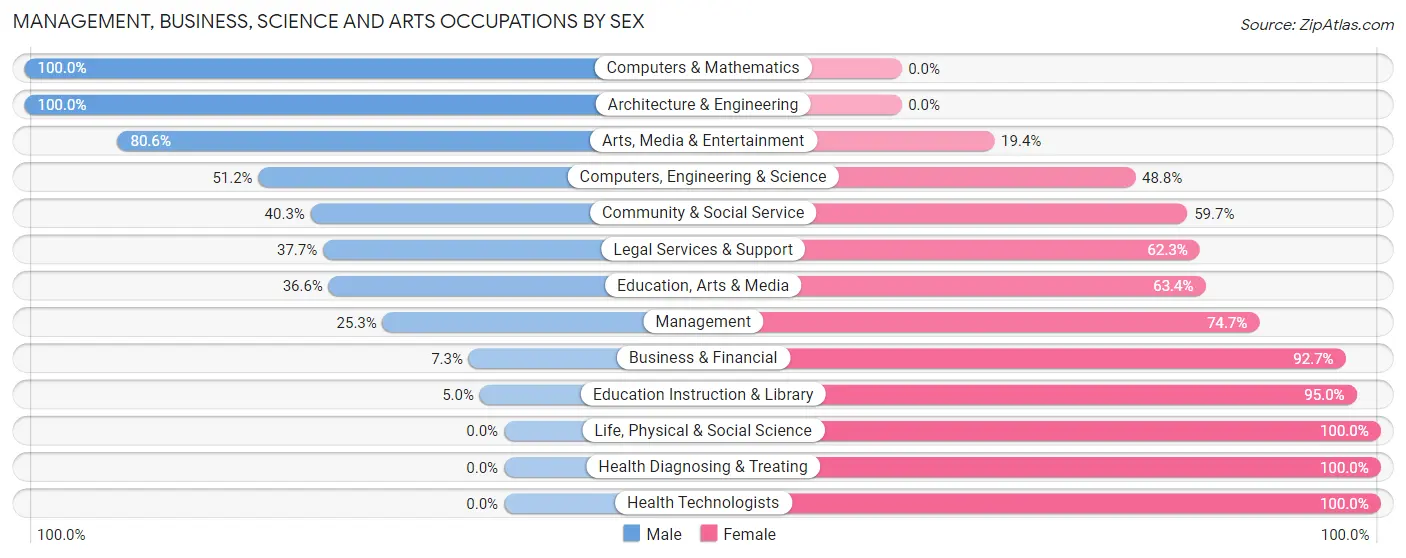
Management, Business, Science and Arts Occupations by Sex
Within the Management, Business, Science and Arts occupations in Hometown, the most male-oriented occupations are Computers & Mathematics (100.0%), Architecture & Engineering (100.0%), and Arts, Media & Entertainment (80.6%), while the most female-oriented occupations are Life, Physical & Social Science (100.0%), Health Diagnosing & Treating (100.0%), and Health Technologists (100.0%).
| Occupation | Male | Female |
| Management | 20 (25.3%) | 59 (74.7%) |
| Business & Financial | 8 (7.3%) | 101 (92.7%) |
| Computers, Engineering & Science | 21 (51.2%) | 20 (48.8%) |
| Computers & Mathematics | 7 (100.0%) | 0 (0.0%) |
| Architecture & Engineering | 14 (100.0%) | 0 (0.0%) |
| Life, Physical & Social Science | 0 (0.0%) | 20 (100.0%) |
| Community & Social Service | 169 (40.3%) | 250 (59.7%) |
| Education, Arts & Media | 34 (36.6%) | 59 (63.4%) |
| Legal Services & Support | 20 (37.7%) | 33 (62.3%) |
| Education Instruction & Library | 7 (5.0%) | 132 (95.0%) |
| Arts, Media & Entertainment | 108 (80.6%) | 26 (19.4%) |
| Health Diagnosing & Treating | 0 (0.0%) | 35 (100.0%) |
| Health Technologists | 0 (0.0%) | 16 (100.0%) |
| Total (Category) | 218 (31.9%) | 465 (68.1%) |
| Total (Overall) | 1,050 (49.1%) | 1,087 (50.9%) |
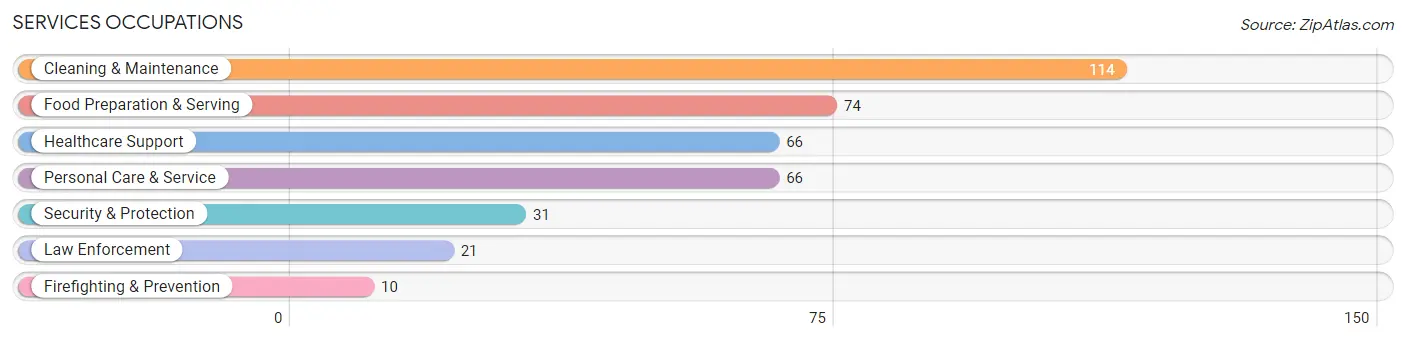
Services Occupations
The most common Services occupations in Hometown are Cleaning & Maintenance (114 | 5.3%), Food Preparation & Serving (74 | 3.5%), Healthcare Support (66 | 3.1%), Personal Care & Service (66 | 3.1%), and Security & Protection (31 | 1.5%).
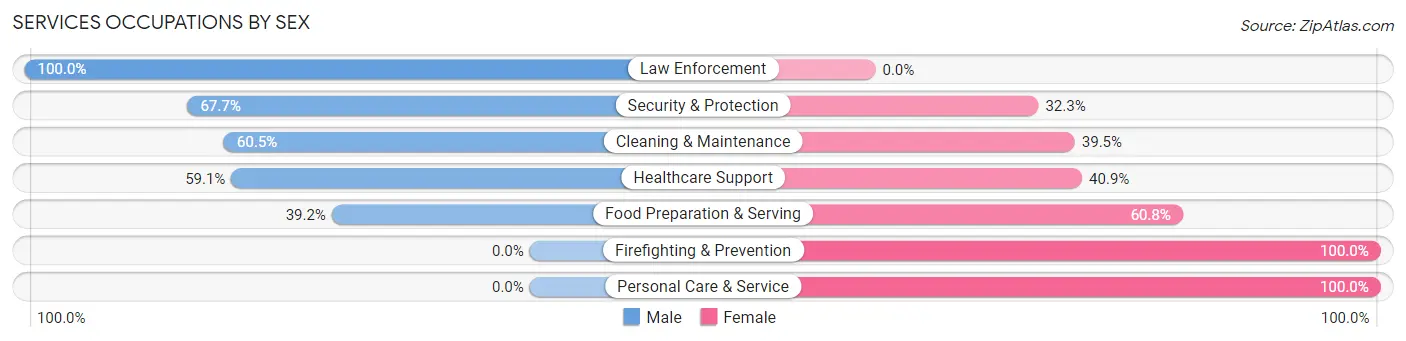
Services Occupations by Sex
Within the Services occupations in Hometown, the most male-oriented occupations are Law Enforcement (100.0%), Security & Protection (67.7%), and Cleaning & Maintenance (60.5%), while the most female-oriented occupations are Firefighting & Prevention (100.0%), Personal Care & Service (100.0%), and Food Preparation & Serving (60.8%).
| Occupation | Male | Female |
| Healthcare Support | 39 (59.1%) | 27 (40.9%) |
| Security & Protection | 21 (67.7%) | 10 (32.3%) |
| Firefighting & Prevention | 0 (0.0%) | 10 (100.0%) |
| Law Enforcement | 21 (100.0%) | 0 (0.0%) |
| Food Preparation & Serving | 29 (39.2%) | 45 (60.8%) |
| Cleaning & Maintenance | 69 (60.5%) | 45 (39.5%) |
| Personal Care & Service | 0 (0.0%) | 66 (100.0%) |
| Total (Category) | 158 (45.0%) | 193 (55.0%) |
| Total (Overall) | 1,050 (49.1%) | 1,087 (50.9%) |
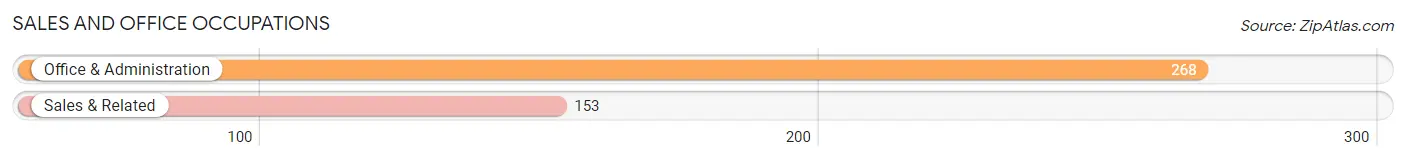
Sales and Office Occupations
The most common Sales and Office occupations in Hometown are Office & Administration (268 | 12.5%), and Sales & Related (153 | 7.2%).
Sales and Office Occupations by Sex
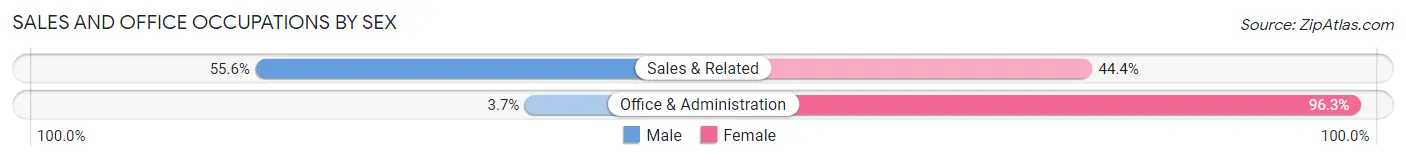
| Occupation | Male | Female |
| Sales & Related | 85 (55.6%) | 68 (44.4%) |
| Office & Administration | 10 (3.7%) | 258 (96.3%) |
| Total (Category) | 95 (22.6%) | 326 (77.4%) |
| Total (Overall) | 1,050 (49.1%) | 1,087 (50.9%) |
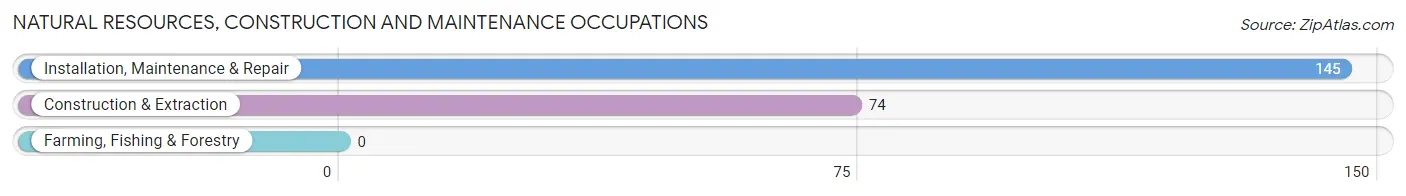
Natural Resources, Construction and Maintenance Occupations
The most common Natural Resources, Construction and Maintenance occupations in Hometown are Installation, Maintenance & Repair (145 | 6.8%), and Construction & Extraction (74 | 3.5%).
Natural Resources, Construction and Maintenance Occupations by Sex
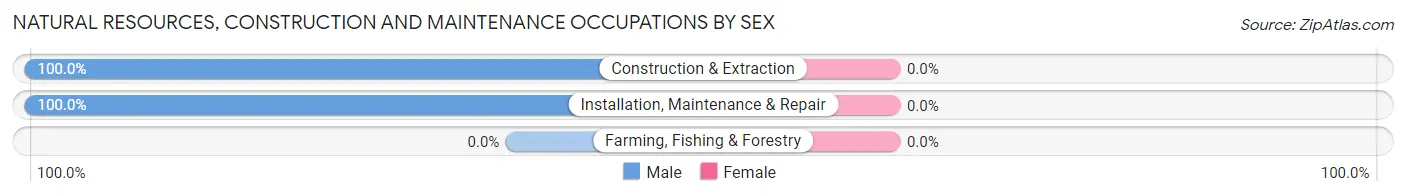
| Occupation | Male | Female |
| Farming, Fishing & Forestry | 0 (0.0%) | 0 (0.0%) |
| Construction & Extraction | 74 (100.0%) | 0 (0.0%) |
| Installation, Maintenance & Repair | 145 (100.0%) | 0 (0.0%) |
| Total (Category) | 219 (100.0%) | 0 (0.0%) |
| Total (Overall) | 1,050 (49.1%) | 1,087 (50.9%) |
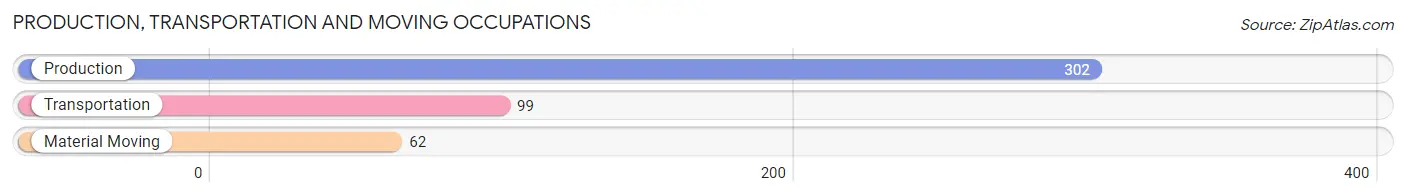
Production, Transportation and Moving Occupations
The most common Production, Transportation and Moving occupations in Hometown are Production (302 | 14.1%), Transportation (99 | 4.6%), and Material Moving (62 | 2.9%).
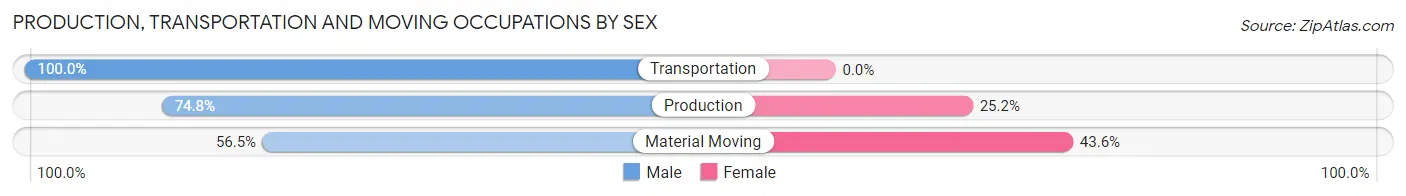
Production, Transportation and Moving Occupations by Sex
| Occupation | Male | Female |
| Production | 226 (74.8%) | 76 (25.2%) |
| Transportation | 99 (100.0%) | 0 (0.0%) |
| Material Moving | 35 (56.5%) | 27 (43.5%) |
| Total (Category) | 360 (77.7%) | 103 (22.3%) |
| Total (Overall) | 1,050 (49.1%) | 1,087 (50.9%) |
Employment Industries by Sex in Hometown
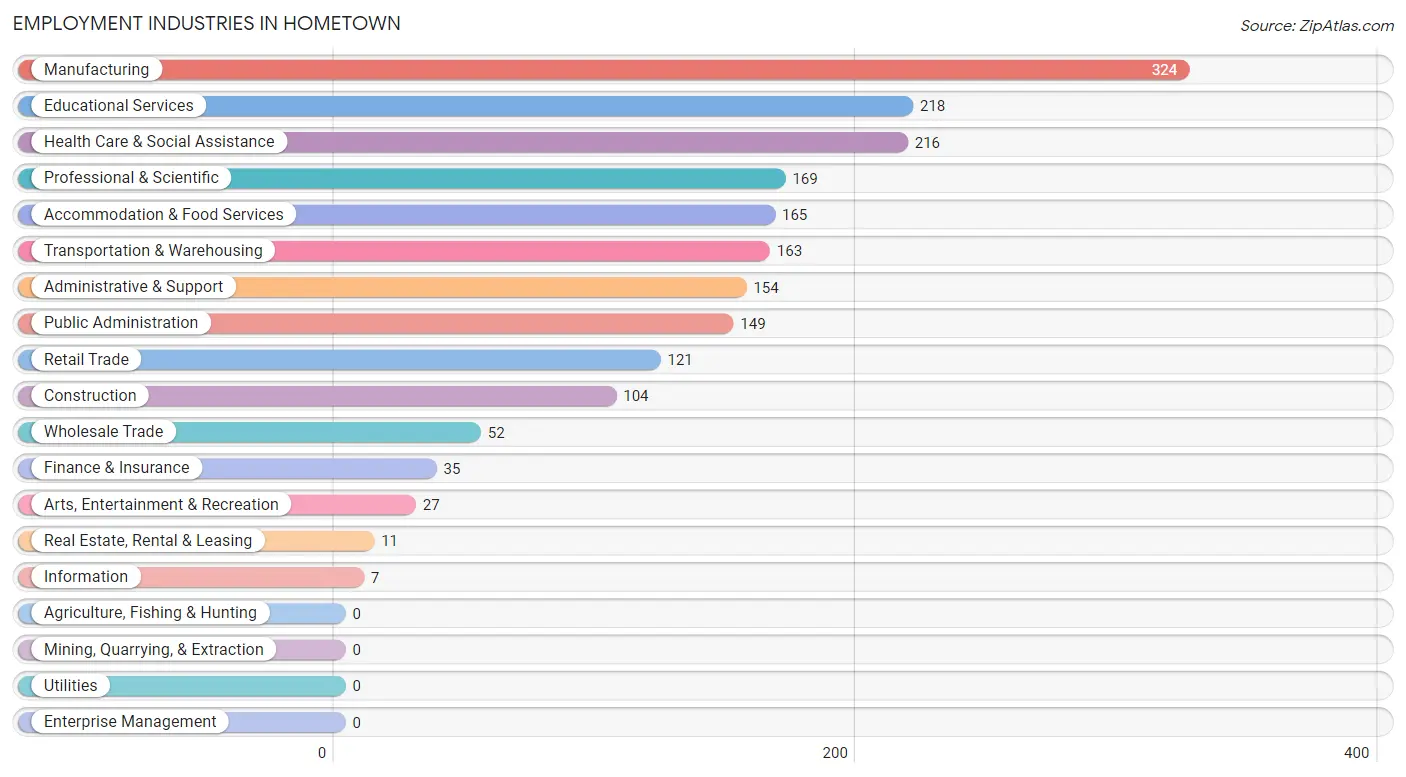
Employment Industries in Hometown
The major employment industries in Hometown include Manufacturing (324 | 15.2%), Educational Services (218 | 10.2%), Health Care & Social Assistance (216 | 10.1%), Professional & Scientific (169 | 7.9%), and Accommodation & Food Services (165 | 7.7%).
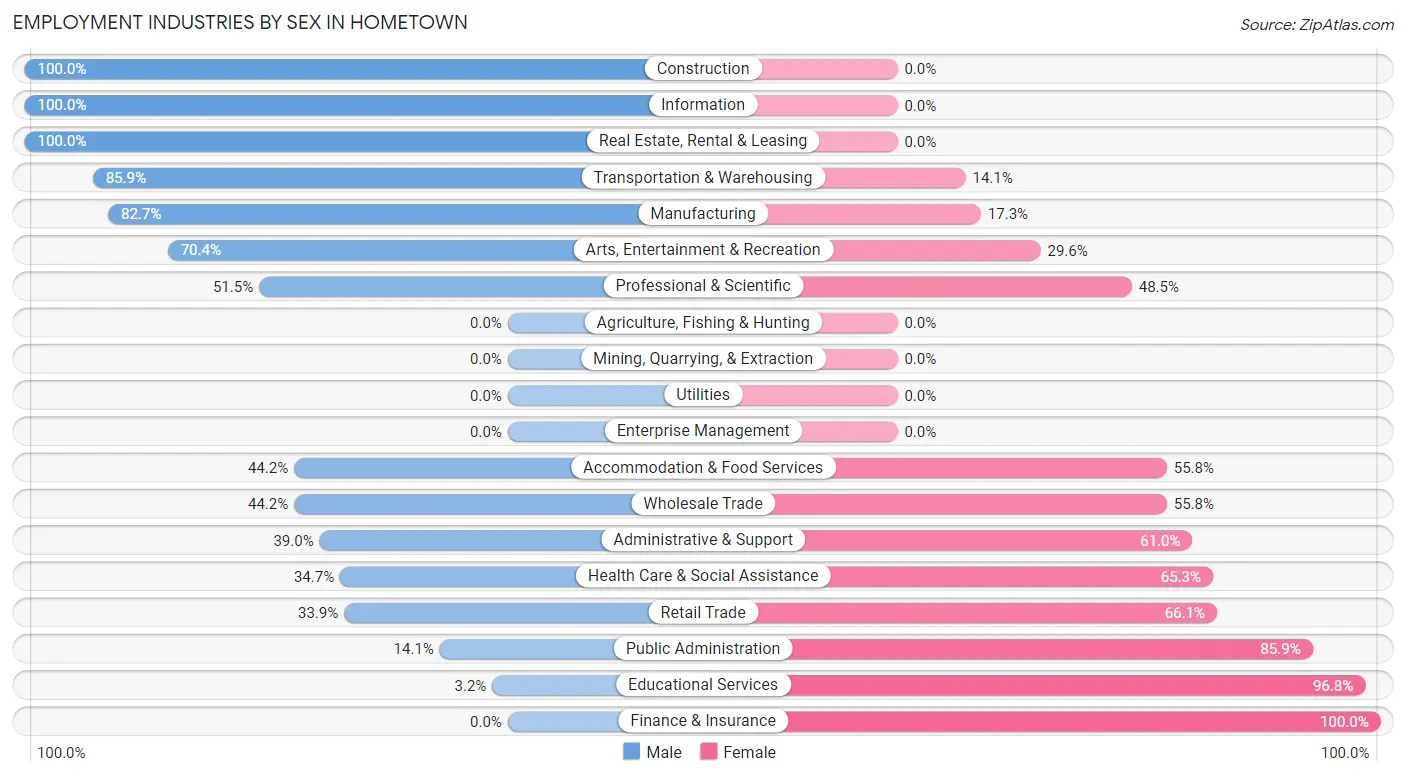
Employment Industries by Sex in Hometown
The Hometown industries that see more men than women are Construction (100.0%), Information (100.0%), and Real Estate, Rental & Leasing (100.0%), whereas the industries that tend to have a higher number of women are Finance & Insurance (100.0%), Educational Services (96.8%), and Public Administration (85.9%).
| Industry | Male | Female |
| Agriculture, Fishing & Hunting | 0 (0.0%) | 0 (0.0%) |
| Mining, Quarrying, & Extraction | 0 (0.0%) | 0 (0.0%) |
| Construction | 104 (100.0%) | 0 (0.0%) |
| Manufacturing | 268 (82.7%) | 56 (17.3%) |
| Wholesale Trade | 23 (44.2%) | 29 (55.8%) |
| Retail Trade | 41 (33.9%) | 80 (66.1%) |
| Transportation & Warehousing | 140 (85.9%) | 23 (14.1%) |
| Utilities | 0 (0.0%) | 0 (0.0%) |
| Information | 7 (100.0%) | 0 (0.0%) |
| Finance & Insurance | 0 (0.0%) | 35 (100.0%) |
| Real Estate, Rental & Leasing | 11 (100.0%) | 0 (0.0%) |
| Professional & Scientific | 87 (51.5%) | 82 (48.5%) |
| Enterprise Management | 0 (0.0%) | 0 (0.0%) |
| Administrative & Support | 60 (39.0%) | 94 (61.0%) |
| Educational Services | 7 (3.2%) | 211 (96.8%) |
| Health Care & Social Assistance | 75 (34.7%) | 141 (65.3%) |
| Arts, Entertainment & Recreation | 19 (70.4%) | 8 (29.6%) |
| Accommodation & Food Services | 73 (44.2%) | 92 (55.8%) |
| Public Administration | 21 (14.1%) | 128 (85.9%) |
| Total | 1,050 (49.1%) | 1,087 (50.9%) |
Education in Hometown
School Enrollment in Hometown
The most common levels of schooling among the 990 students in Hometown are middle school (375 | 37.9%), college / undergraduate (185 | 18.7%), and elementary school (161 | 16.3%).
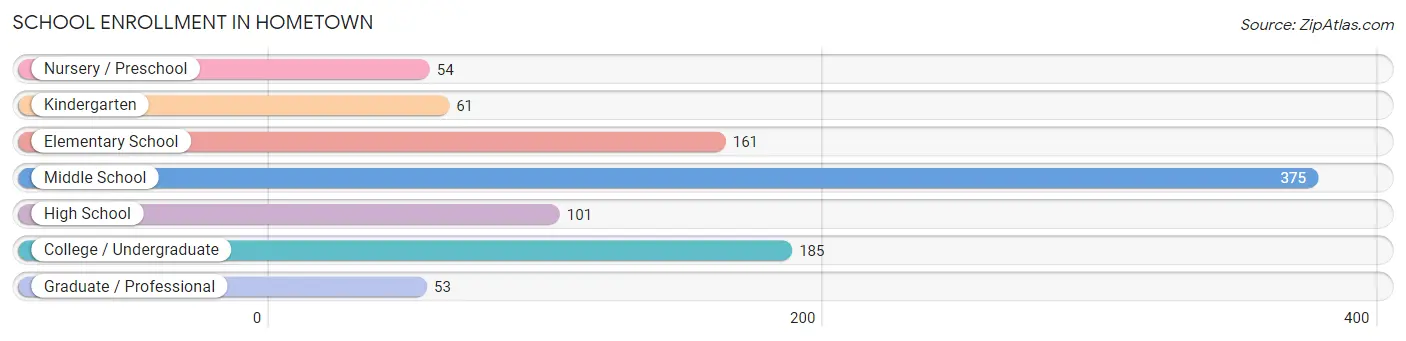
| School Level | # Students | % Students |
| Nursery / Preschool | 54 | 5.4% |
| Kindergarten | 61 | 6.2% |
| Elementary School | 161 | 16.3% |
| Middle School | 375 | 37.9% |
| High School | 101 | 10.2% |
| College / Undergraduate | 185 | 18.7% |
| Graduate / Professional | 53 | 5.3% |
| Total | 990 | 100.0% |
School Enrollment by Age by Funding Source in Hometown
Out of a total of 990 students who are enrolled in schools in Hometown, 130 (13.1%) attend a private institution, while the remaining 860 (86.9%) are enrolled in public schools. The age group of 3 to 4 year olds has the highest likelihood of being enrolled in private schools, with 19 (54.3% in the age bracket) enrolled. Conversely, the age group of 10 to 14 year olds has the lowest likelihood of being enrolled in a private school, with 386 (100.0% in the age bracket) attending a public institution.
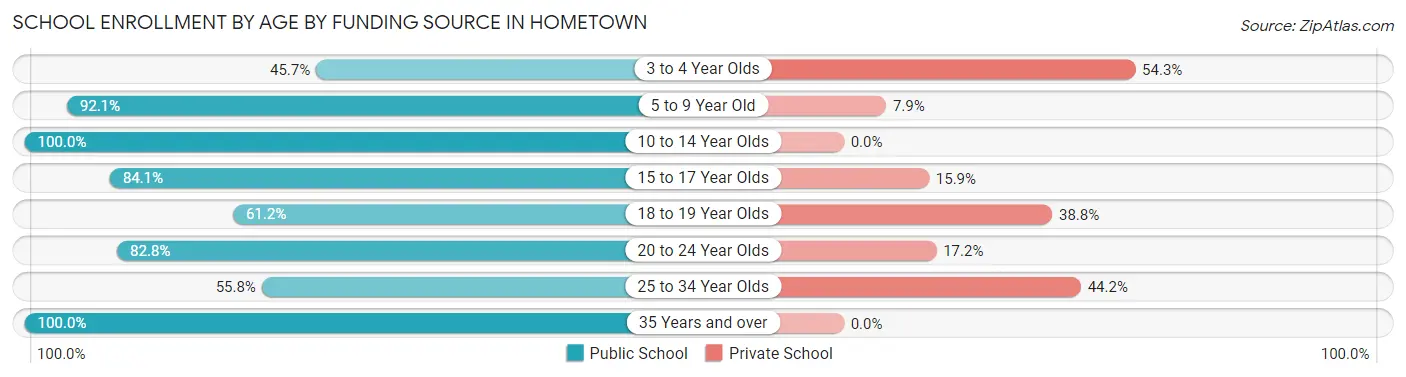
| Age Bracket | Public School | Private School |
| 3 to 4 Year Olds | 16 (45.7%) | 19 (54.3%) |
| 5 to 9 Year Old | 222 (92.1%) | 19 (7.9%) |
| 10 to 14 Year Olds | 386 (100.0%) | 0 (0.0%) |
| 15 to 17 Year Olds | 53 (84.1%) | 10 (15.9%) |
| 18 to 19 Year Olds | 52 (61.2%) | 33 (38.8%) |
| 20 to 24 Year Olds | 72 (82.8%) | 15 (17.2%) |
| 25 to 34 Year Olds | 43 (55.8%) | 34 (44.2%) |
| 35 Years and over | 16 (100.0%) | 0 (0.0%) |
| Total | 860 (86.9%) | 130 (13.1%) |
Educational Attainment by Field of Study in Hometown
Business (121 | 19.1%), visual & performing arts (110 | 17.3%), liberal arts & history (79 | 12.5%), education (63 | 9.9%), and social sciences (58 | 9.1%) are the most common fields of study among 634 individuals in Hometown who have obtained a bachelor's degree or higher.
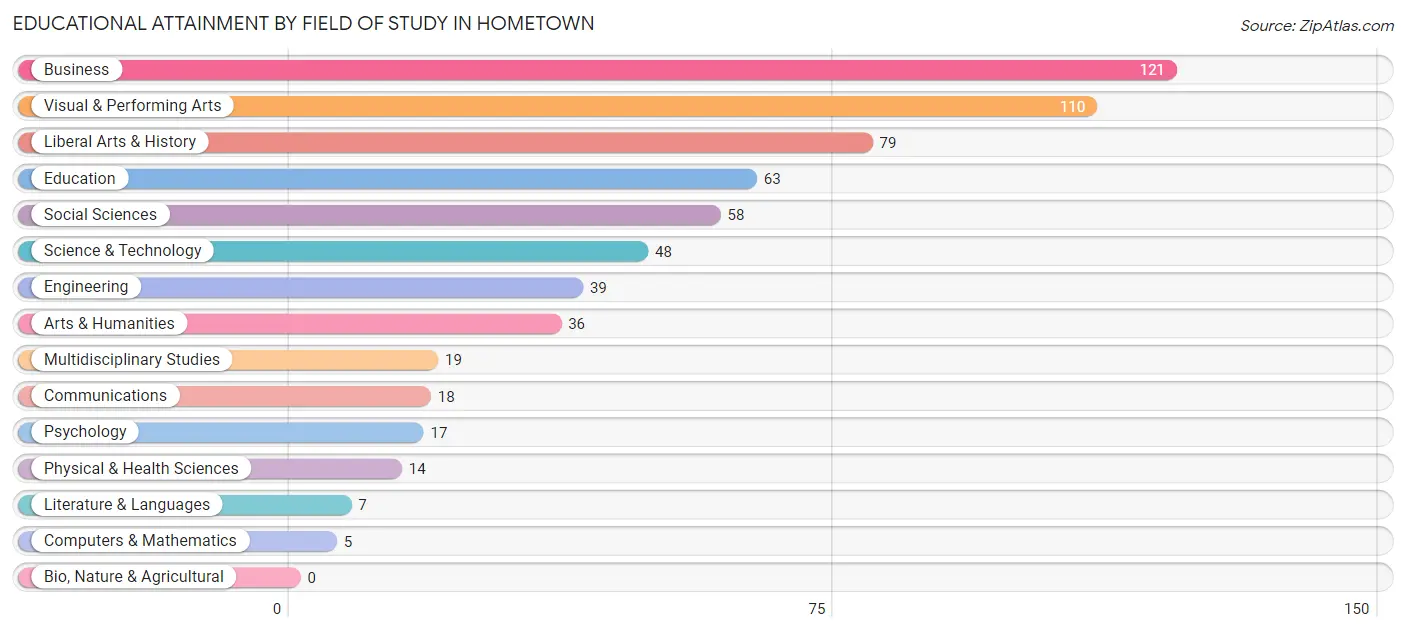
| Field of Study | # Graduates | % Graduates |
| Computers & Mathematics | 5 | 0.8% |
| Bio, Nature & Agricultural | 0 | 0.0% |
| Physical & Health Sciences | 14 | 2.2% |
| Psychology | 17 | 2.7% |
| Social Sciences | 58 | 9.1% |
| Engineering | 39 | 6.1% |
| Multidisciplinary Studies | 19 | 3.0% |
| Science & Technology | 48 | 7.6% |
| Business | 121 | 19.1% |
| Education | 63 | 9.9% |
| Literature & Languages | 7 | 1.1% |
| Liberal Arts & History | 79 | 12.5% |
| Visual & Performing Arts | 110 | 17.3% |
| Communications | 18 | 2.8% |
| Arts & Humanities | 36 | 5.7% |
| Total | 634 | 100.0% |
Transportation & Commute in Hometown
Vehicle Availability by Sex in Hometown
The most prevalent vehicle ownership categories in Hometown are males with 2 vehicles (414, accounting for 42.2%) and females with 2 vehicles (392, making up 40.8%).
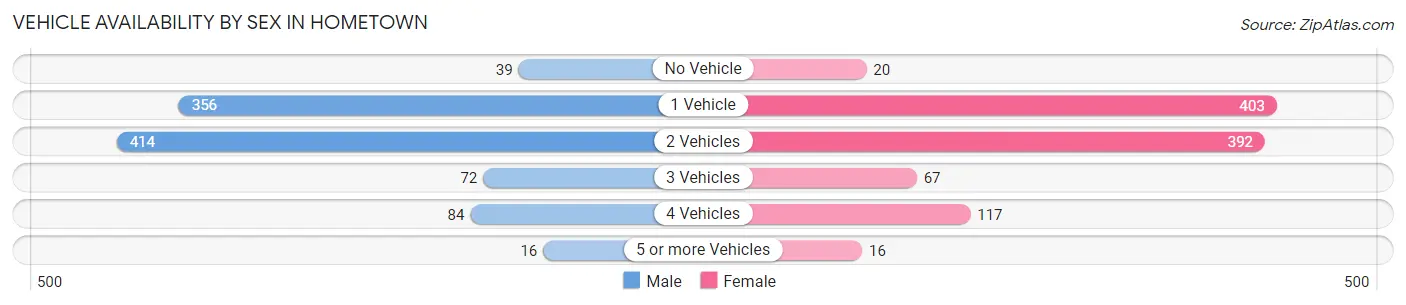
| Vehicles Available | Male | Female |
| No Vehicle | 39 (4.0%) | 20 (2.0%) |
| 1 Vehicle | 356 (36.3%) | 403 (39.7%) |
| 2 Vehicles | 414 (42.2%) | 392 (38.6%) |
| 3 Vehicles | 72 (7.3%) | 67 (6.6%) |
| 4 Vehicles | 84 (8.6%) | 117 (11.5%) |
| 5 or more Vehicles | 16 (1.6%) | 16 (1.6%) |
| Total | 981 (100.0%) | 1,015 (100.0%) |
Commute Time in Hometown
The most frequently occuring commute durations in Hometown are 10 to 14 minutes (249 commuters, 13.3%), 20 to 24 minutes (249 commuters, 13.3%), and 30 to 34 minutes (223 commuters, 11.9%).
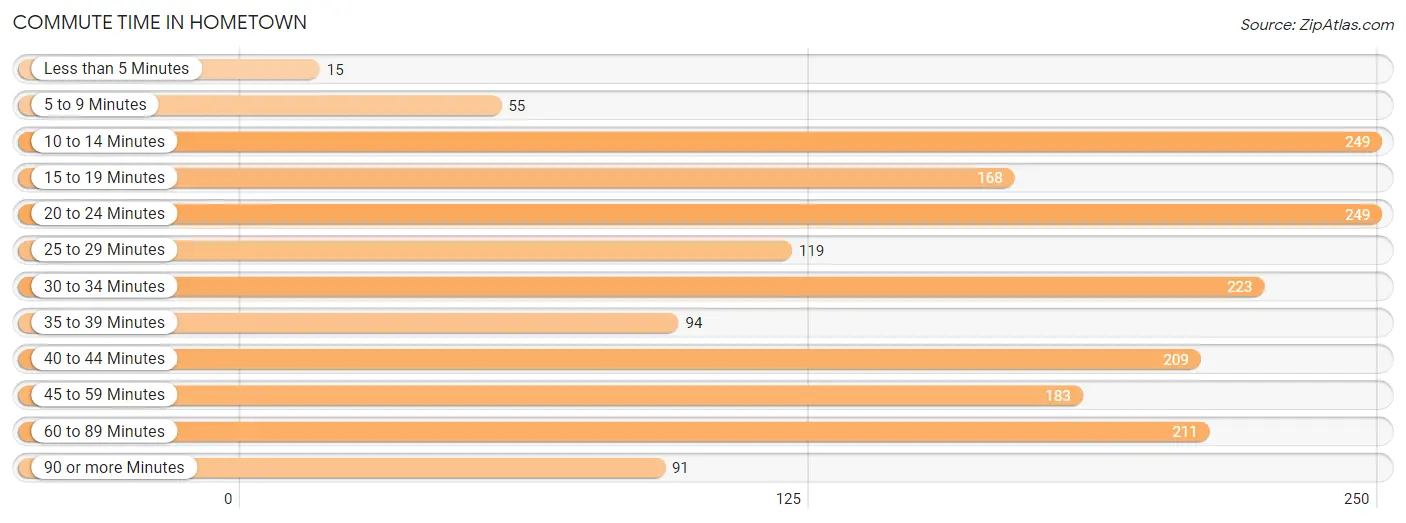
| Commute Time | # Commuters | % Commuters |
| Less than 5 Minutes | 15 | 0.8% |
| 5 to 9 Minutes | 55 | 2.9% |
| 10 to 14 Minutes | 249 | 13.3% |
| 15 to 19 Minutes | 168 | 9.0% |
| 20 to 24 Minutes | 249 | 13.3% |
| 25 to 29 Minutes | 119 | 6.4% |
| 30 to 34 Minutes | 223 | 11.9% |
| 35 to 39 Minutes | 94 | 5.0% |
| 40 to 44 Minutes | 209 | 11.2% |
| 45 to 59 Minutes | 183 | 9.8% |
| 60 to 89 Minutes | 211 | 11.3% |
| 90 or more Minutes | 91 | 4.9% |
Commute Time by Sex in Hometown
The most common commute times in Hometown are 40 to 44 minutes (173 commuters, 18.2%) for males and 20 to 24 minutes (172 commuters, 18.7%) for females.
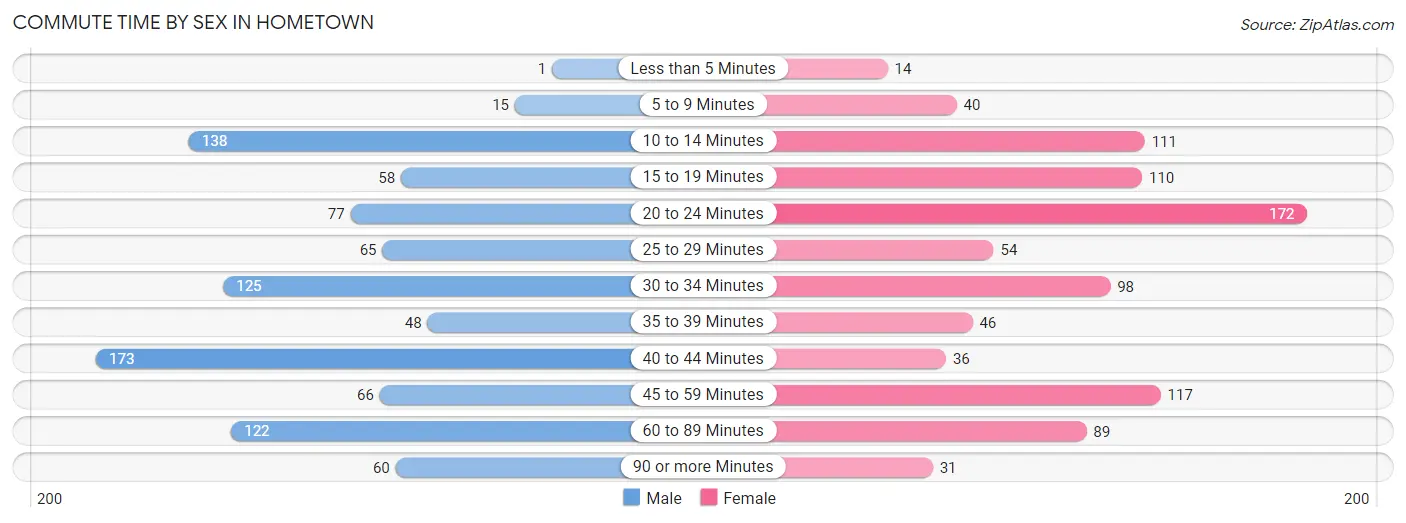
| Commute Time | Male | Female |
| Less than 5 Minutes | 1 (0.1%) | 14 (1.5%) |
| 5 to 9 Minutes | 15 (1.6%) | 40 (4.4%) |
| 10 to 14 Minutes | 138 (14.6%) | 111 (12.1%) |
| 15 to 19 Minutes | 58 (6.1%) | 110 (12.0%) |
| 20 to 24 Minutes | 77 (8.1%) | 172 (18.7%) |
| 25 to 29 Minutes | 65 (6.9%) | 54 (5.9%) |
| 30 to 34 Minutes | 125 (13.2%) | 98 (10.7%) |
| 35 to 39 Minutes | 48 (5.1%) | 46 (5.0%) |
| 40 to 44 Minutes | 173 (18.2%) | 36 (3.9%) |
| 45 to 59 Minutes | 66 (7.0%) | 117 (12.8%) |
| 60 to 89 Minutes | 122 (12.9%) | 89 (9.7%) |
| 90 or more Minutes | 60 (6.3%) | 31 (3.4%) |
Time of Departure to Work by Sex in Hometown
The most frequent times of departure to work in Hometown are 8:30 AM to 8:59 AM (187, 19.7%) for males and 7:30 AM to 7:59 AM (191, 20.8%) for females.
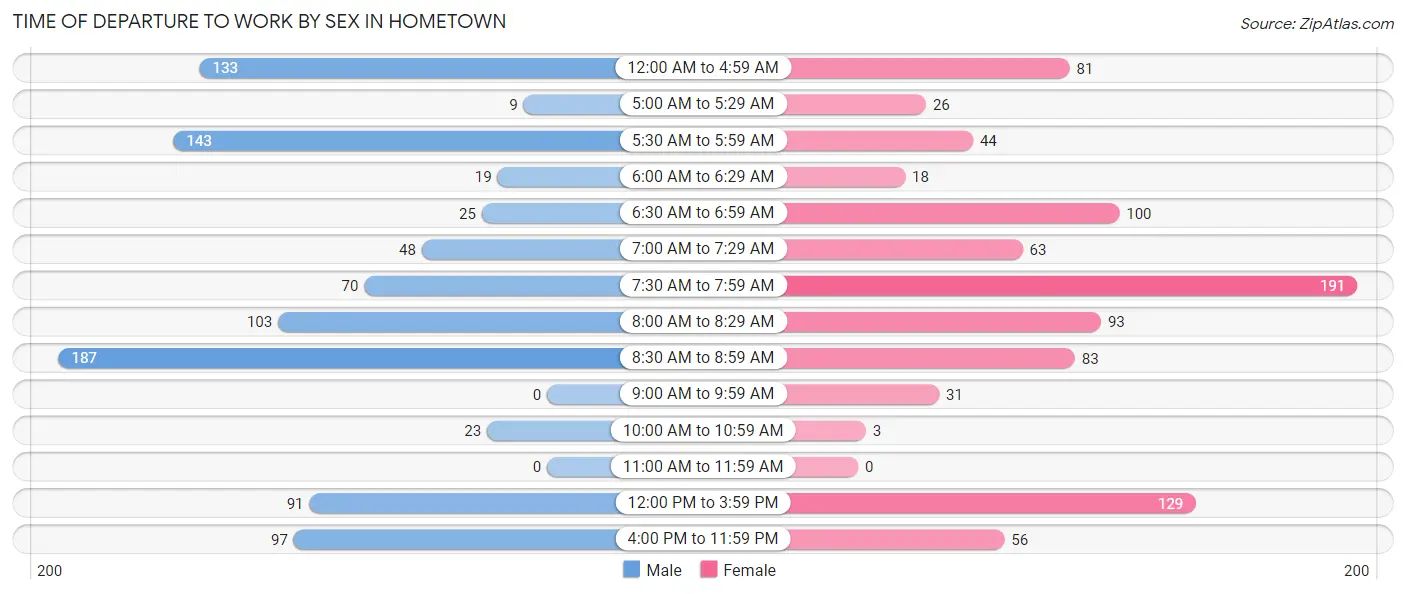
| Time of Departure | Male | Female |
| 12:00 AM to 4:59 AM | 133 (14.0%) | 81 (8.8%) |
| 5:00 AM to 5:29 AM | 9 (0.9%) | 26 (2.8%) |
| 5:30 AM to 5:59 AM | 143 (15.1%) | 44 (4.8%) |
| 6:00 AM to 6:29 AM | 19 (2.0%) | 18 (2.0%) |
| 6:30 AM to 6:59 AM | 25 (2.6%) | 100 (10.9%) |
| 7:00 AM to 7:29 AM | 48 (5.1%) | 63 (6.9%) |
| 7:30 AM to 7:59 AM | 70 (7.4%) | 191 (20.8%) |
| 8:00 AM to 8:29 AM | 103 (10.9%) | 93 (10.1%) |
| 8:30 AM to 8:59 AM | 187 (19.7%) | 83 (9.0%) |
| 9:00 AM to 9:59 AM | 0 (0.0%) | 31 (3.4%) |
| 10:00 AM to 10:59 AM | 23 (2.4%) | 3 (0.3%) |
| 11:00 AM to 11:59 AM | 0 (0.0%) | 0 (0.0%) |
| 12:00 PM to 3:59 PM | 91 (9.6%) | 129 (14.1%) |
| 4:00 PM to 11:59 PM | 97 (10.2%) | 56 (6.1%) |
| Total | 948 (100.0%) | 918 (100.0%) |
Housing Occupancy in Hometown
Occupancy by Ownership in Hometown
Of the total 1,907 dwellings in Hometown, owner-occupied units account for 1,421 (74.5%), while renter-occupied units make up 486 (25.5%).
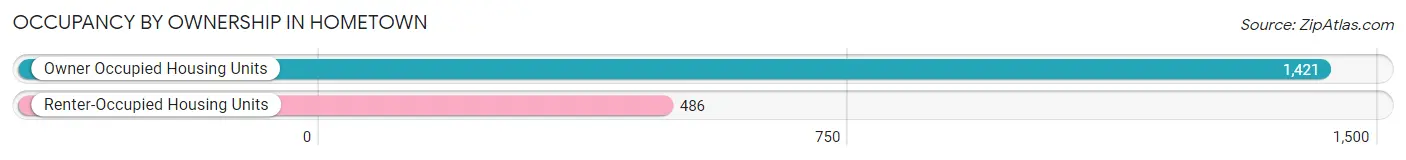
| Occupancy | # Housing Units | % Housing Units |
| Owner Occupied Housing Units | 1,421 | 74.5% |
| Renter-Occupied Housing Units | 486 | 25.5% |
| Total Occupied Housing Units | 1,907 | 100.0% |
Occupancy by Household Size in Hometown
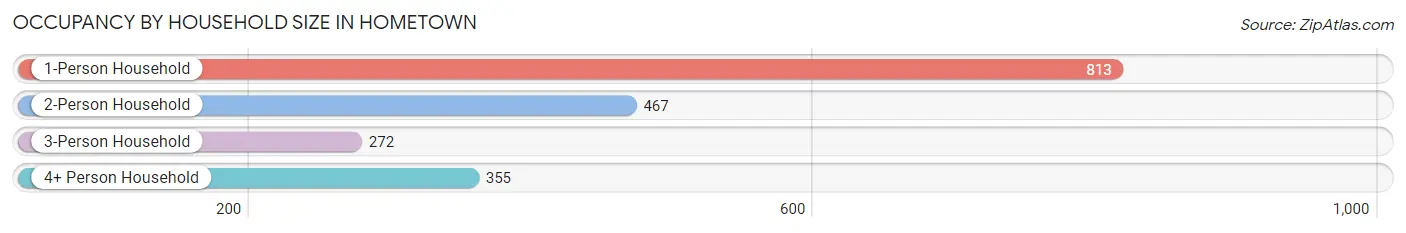
| Household Size | # Housing Units | % Housing Units |
| 1-Person Household | 813 | 42.6% |
| 2-Person Household | 467 | 24.5% |
| 3-Person Household | 272 | 14.3% |
| 4+ Person Household | 355 | 18.6% |
| Total Housing Units | 1,907 | 100.0% |
Occupancy by Ownership by Household Size in Hometown
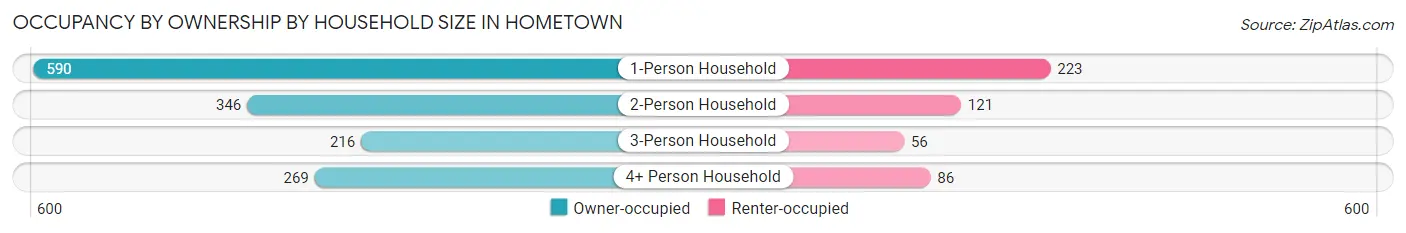
| Household Size | Owner-occupied | Renter-occupied |
| 1-Person Household | 590 (72.6%) | 223 (27.4%) |
| 2-Person Household | 346 (74.1%) | 121 (25.9%) |
| 3-Person Household | 216 (79.4%) | 56 (20.6%) |
| 4+ Person Household | 269 (75.8%) | 86 (24.2%) |
| Total Housing Units | 1,421 (74.5%) | 486 (25.5%) |
Occupancy by Educational Attainment in Hometown
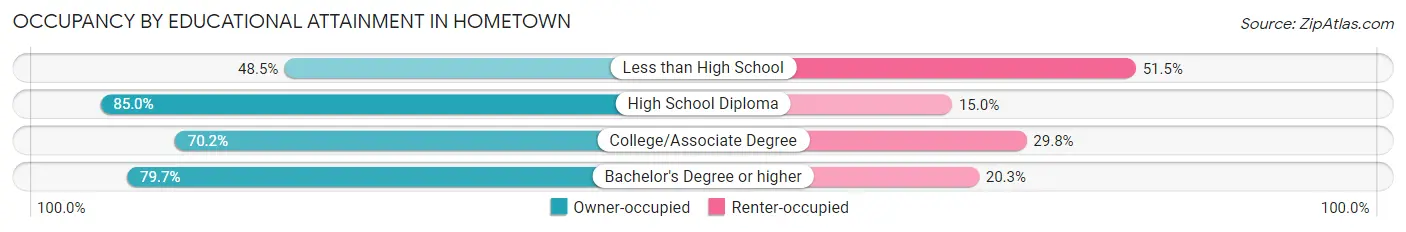
| Household Size | Owner-occupied | Renter-occupied |
| Less than High School | 100 (48.5%) | 106 (51.5%) |
| High School Diploma | 537 (85.0%) | 95 (15.0%) |
| College/Associate Degree | 502 (70.2%) | 213 (29.8%) |
| Bachelor's Degree or higher | 282 (79.7%) | 72 (20.3%) |
Occupancy by Age of Householder in Hometown
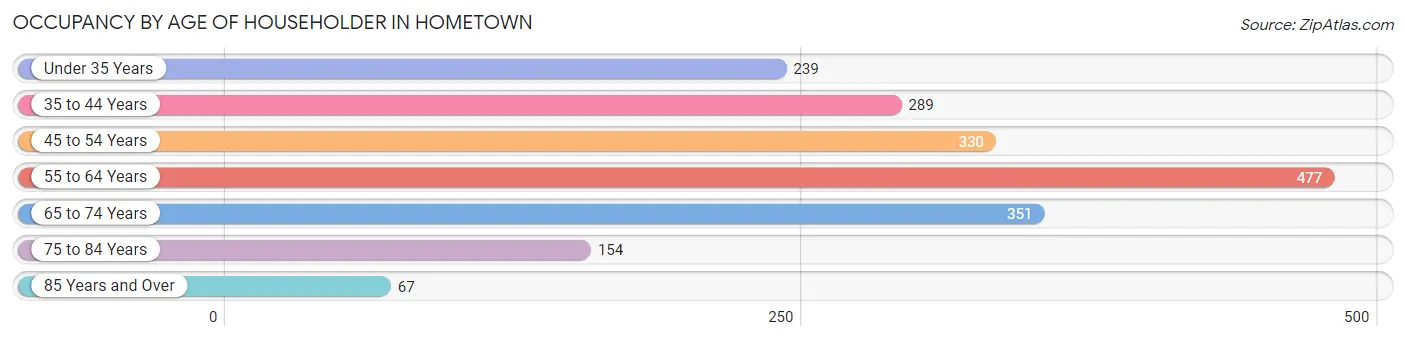
| Age Bracket | # Households | % Households |
| Under 35 Years | 239 | 12.5% |
| 35 to 44 Years | 289 | 15.1% |
| 45 to 54 Years | 330 | 17.3% |
| 55 to 64 Years | 477 | 25.0% |
| 65 to 74 Years | 351 | 18.4% |
| 75 to 84 Years | 154 | 8.1% |
| 85 Years and Over | 67 | 3.5% |
| Total | 1,907 | 100.0% |
Housing Finances in Hometown
Median Income by Occupancy in Hometown
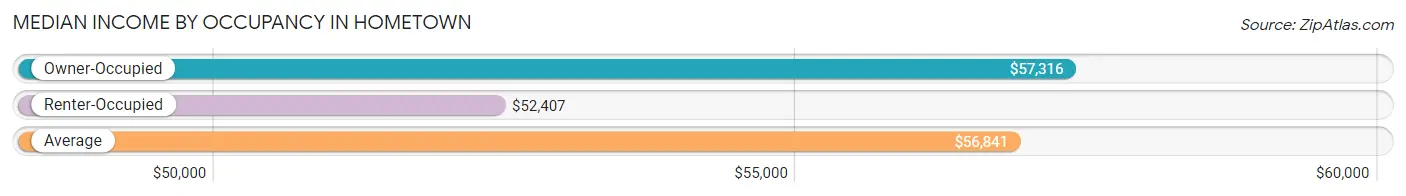
| Occupancy Type | # Households | Median Income |
| Owner-Occupied | 1,421 (74.5%) | $57,316 |
| Renter-Occupied | 486 (25.5%) | $52,407 |
| Average | 1,907 (100.0%) | $56,841 |
Occupancy by Householder Income Bracket in Hometown
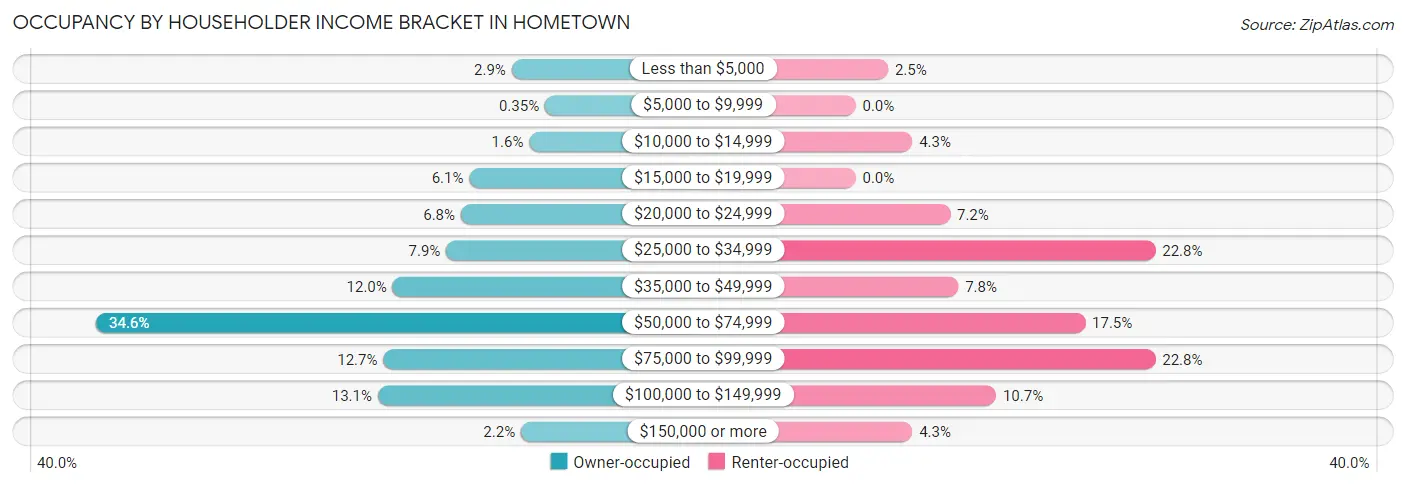
| Income Bracket | Owner-occupied | Renter-occupied |
| Less than $5,000 | 41 (2.9%) | 12 (2.5%) |
| $5,000 to $9,999 | 5 (0.4%) | 0 (0.0%) |
| $10,000 to $14,999 | 22 (1.5%) | 21 (4.3%) |
| $15,000 to $19,999 | 87 (6.1%) | 0 (0.0%) |
| $20,000 to $24,999 | 96 (6.8%) | 35 (7.2%) |
| $25,000 to $34,999 | 112 (7.9%) | 111 (22.8%) |
| $35,000 to $49,999 | 170 (12.0%) | 38 (7.8%) |
| $50,000 to $74,999 | 491 (34.5%) | 85 (17.5%) |
| $75,000 to $99,999 | 180 (12.7%) | 111 (22.8%) |
| $100,000 to $149,999 | 186 (13.1%) | 52 (10.7%) |
| $150,000 or more | 31 (2.2%) | 21 (4.3%) |
| Total | 1,421 (100.0%) | 486 (100.0%) |
Monthly Housing Cost Tiers in Hometown
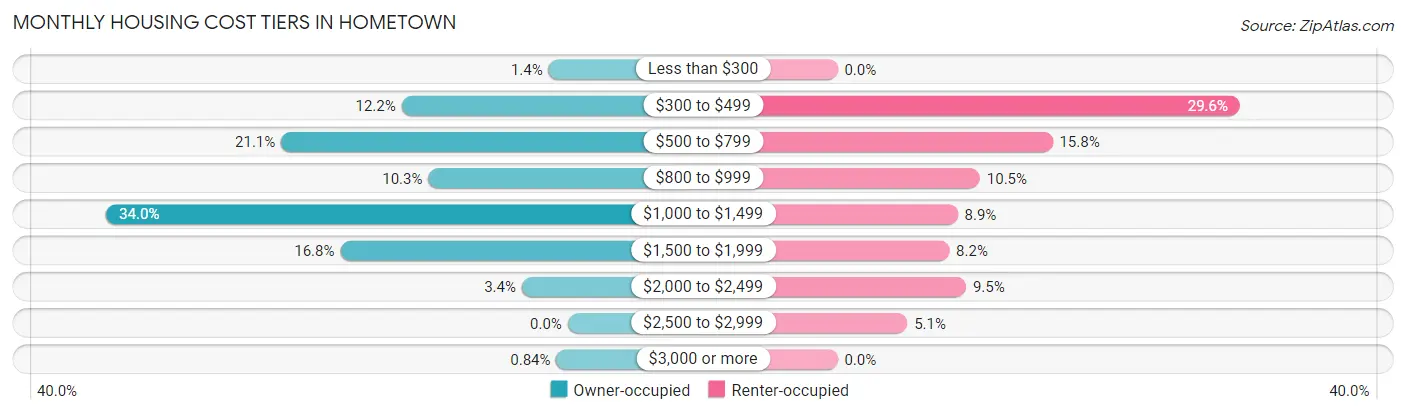
| Monthly Cost | Owner-occupied | Renter-occupied |
| Less than $300 | 20 (1.4%) | 0 (0.0%) |
| $300 to $499 | 174 (12.2%) | 144 (29.6%) |
| $500 to $799 | 300 (21.1%) | 77 (15.8%) |
| $800 to $999 | 146 (10.3%) | 51 (10.5%) |
| $1,000 to $1,499 | 483 (34.0%) | 43 (8.8%) |
| $1,500 to $1,999 | 238 (16.8%) | 40 (8.2%) |
| $2,000 to $2,499 | 48 (3.4%) | 46 (9.5%) |
| $2,500 to $2,999 | 0 (0.0%) | 25 (5.1%) |
| $3,000 or more | 12 (0.8%) | 0 (0.0%) |
| Total | 1,421 (100.0%) | 486 (100.0%) |
Physical Housing Characteristics in Hometown
Housing Structures in Hometown
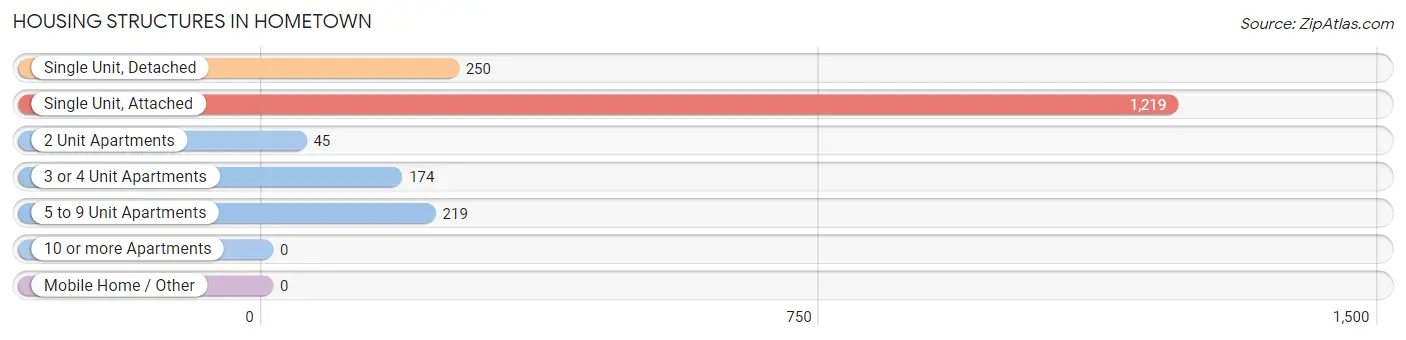
| Structure Type | # Housing Units | % Housing Units |
| Single Unit, Detached | 250 | 13.1% |
| Single Unit, Attached | 1,219 | 63.9% |
| 2 Unit Apartments | 45 | 2.4% |
| 3 or 4 Unit Apartments | 174 | 9.1% |
| 5 to 9 Unit Apartments | 219 | 11.5% |
| 10 or more Apartments | 0 | 0.0% |
| Mobile Home / Other | 0 | 0.0% |
| Total | 1,907 | 100.0% |
Housing Structures by Occupancy in Hometown
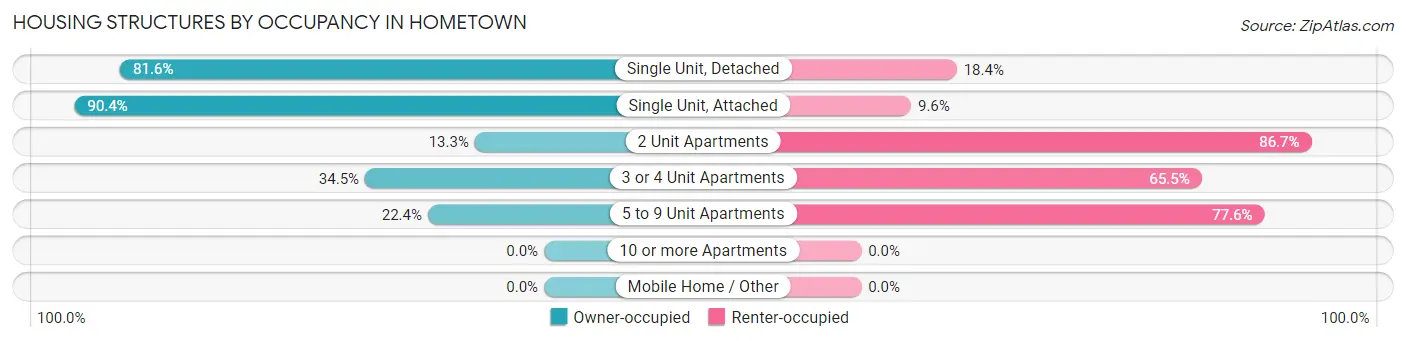
| Structure Type | Owner-occupied | Renter-occupied |
| Single Unit, Detached | 204 (81.6%) | 46 (18.4%) |
| Single Unit, Attached | 1,102 (90.4%) | 117 (9.6%) |
| 2 Unit Apartments | 6 (13.3%) | 39 (86.7%) |
| 3 or 4 Unit Apartments | 60 (34.5%) | 114 (65.5%) |
| 5 to 9 Unit Apartments | 49 (22.4%) | 170 (77.6%) |
| 10 or more Apartments | 0 (0.0%) | 0 (0.0%) |
| Mobile Home / Other | 0 (0.0%) | 0 (0.0%) |
| Total | 1,421 (74.5%) | 486 (25.5%) |
Housing Structures by Number of Rooms in Hometown
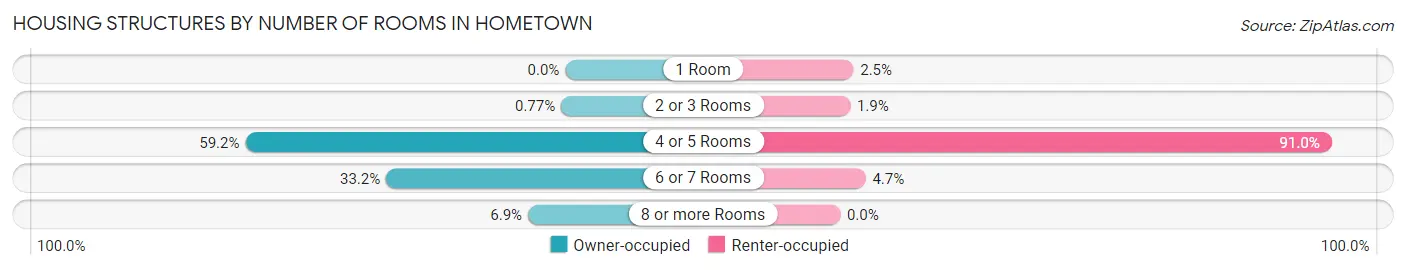
| Number of Rooms | Owner-occupied | Renter-occupied |
| 1 Room | 0 (0.0%) | 12 (2.5%) |
| 2 or 3 Rooms | 11 (0.8%) | 9 (1.8%) |
| 4 or 5 Rooms | 841 (59.2%) | 442 (90.9%) |
| 6 or 7 Rooms | 471 (33.2%) | 23 (4.7%) |
| 8 or more Rooms | 98 (6.9%) | 0 (0.0%) |
| Total | 1,421 (100.0%) | 486 (100.0%) |
Housing Structure by Heating Type in Hometown
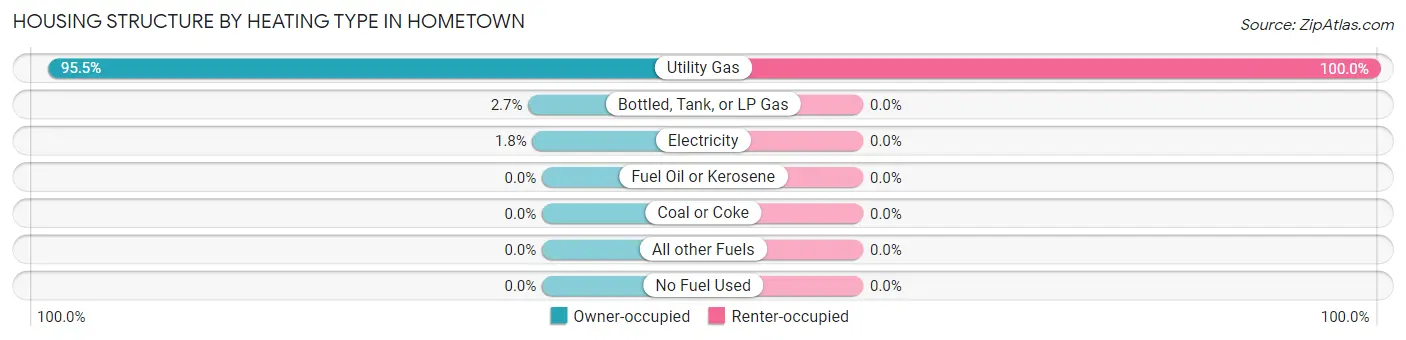
| Heating Type | Owner-occupied | Renter-occupied |
| Utility Gas | 1,357 (95.5%) | 486 (100.0%) |
| Bottled, Tank, or LP Gas | 38 (2.7%) | 0 (0.0%) |
| Electricity | 26 (1.8%) | 0 (0.0%) |
| Fuel Oil or Kerosene | 0 (0.0%) | 0 (0.0%) |
| Coal or Coke | 0 (0.0%) | 0 (0.0%) |
| All other Fuels | 0 (0.0%) | 0 (0.0%) |
| No Fuel Used | 0 (0.0%) | 0 (0.0%) |
| Total | 1,421 (100.0%) | 486 (100.0%) |
Household Vehicle Usage in Hometown
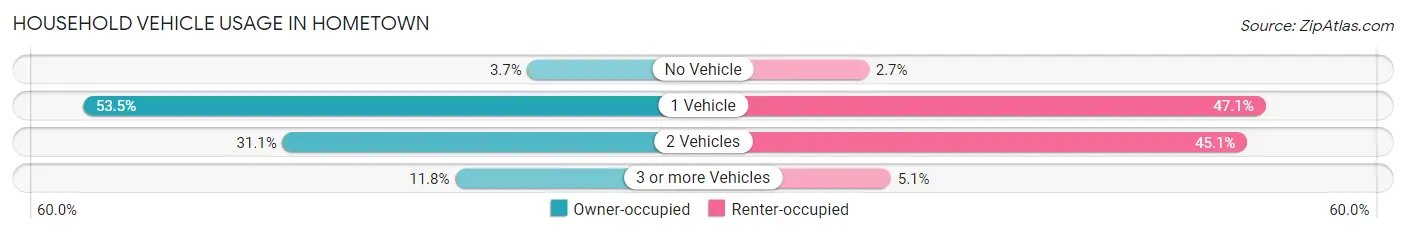
| Vehicles per Household | Owner-occupied | Renter-occupied |
| No Vehicle | 52 (3.7%) | 13 (2.7%) |
| 1 Vehicle | 760 (53.5%) | 229 (47.1%) |
| 2 Vehicles | 442 (31.1%) | 219 (45.1%) |
| 3 or more Vehicles | 167 (11.7%) | 25 (5.1%) |
| Total | 1,421 (100.0%) | 486 (100.0%) |
Real Estate & Mortgages in Hometown
Real Estate and Mortgage Overview in Hometown
| Characteristic | Without Mortgage | With Mortgage |
| Housing Units | 479 | 942 |
| Median Property Value | $132,800 | $159,700 |
| Median Household Income | $32,614 | $31 |
| Monthly Housing Costs | $548 | $12 |
| Real Estate Taxes | $2,864 | $0 |
Property Value by Mortgage Status in Hometown
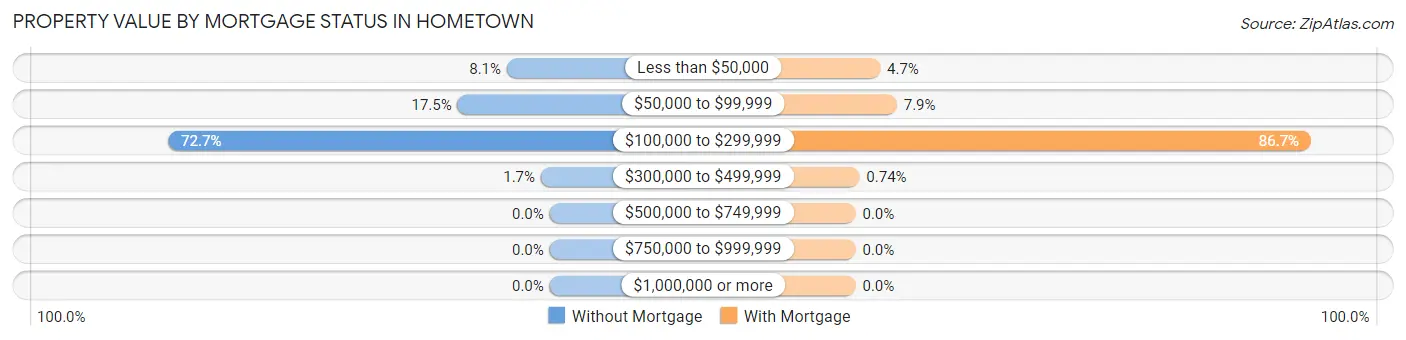
| Property Value | Without Mortgage | With Mortgage |
| Less than $50,000 | 39 (8.1%) | 44 (4.7%) |
| $50,000 to $99,999 | 84 (17.5%) | 74 (7.9%) |
| $100,000 to $299,999 | 348 (72.7%) | 817 (86.7%) |
| $300,000 to $499,999 | 8 (1.7%) | 7 (0.7%) |
| $500,000 to $749,999 | 0 (0.0%) | 0 (0.0%) |
| $750,000 to $999,999 | 0 (0.0%) | 0 (0.0%) |
| $1,000,000 or more | 0 (0.0%) | 0 (0.0%) |
| Total | 479 (100.0%) | 942 (100.0%) |
Household Income by Mortgage Status in Hometown
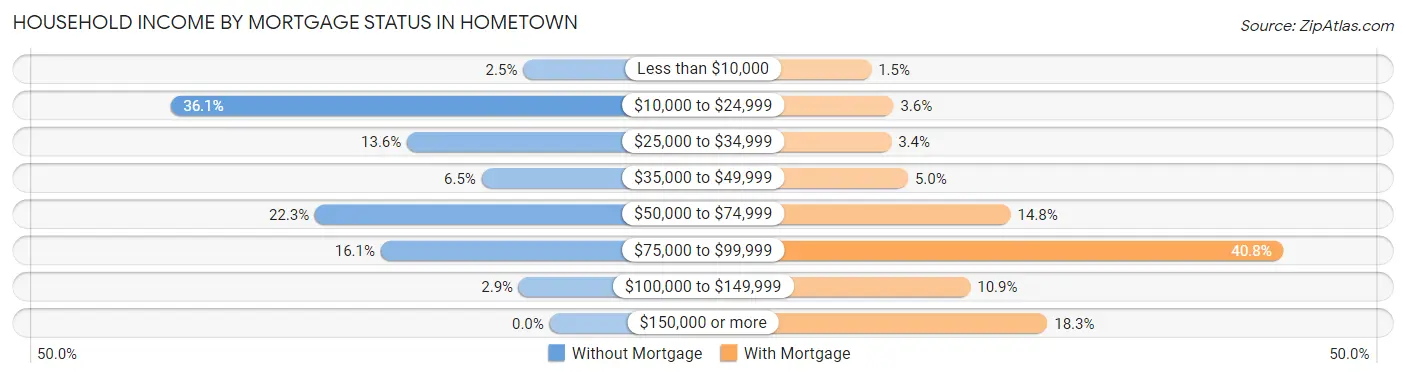
| Household Income | Without Mortgage | With Mortgage |
| Less than $10,000 | 12 (2.5%) | 14 (1.5%) |
| $10,000 to $24,999 | 173 (36.1%) | 34 (3.6%) |
| $25,000 to $34,999 | 65 (13.6%) | 32 (3.4%) |
| $35,000 to $49,999 | 31 (6.5%) | 47 (5.0%) |
| $50,000 to $74,999 | 107 (22.3%) | 139 (14.8%) |
| $75,000 to $99,999 | 77 (16.1%) | 384 (40.8%) |
| $100,000 to $149,999 | 14 (2.9%) | 103 (10.9%) |
| $150,000 or more | 0 (0.0%) | 172 (18.3%) |
| Total | 479 (100.0%) | 942 (100.0%) |
Property Value to Household Income Ratio in Hometown
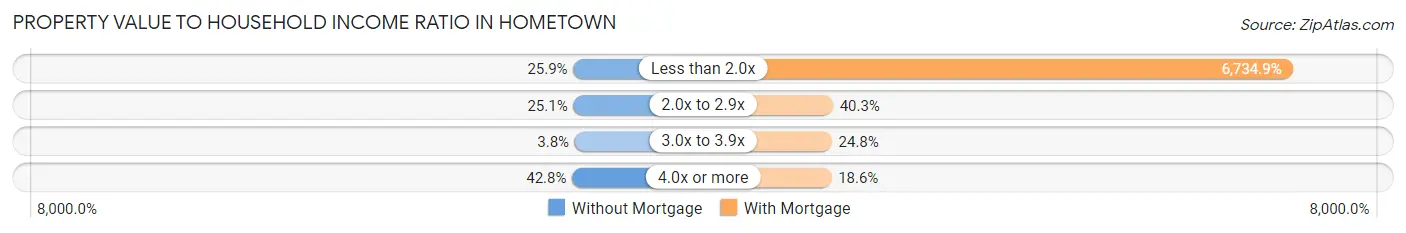
| Value-to-Income Ratio | Without Mortgage | With Mortgage |
| Less than 2.0x | 124 (25.9%) | 63,443 (6,734.9%) |
| 2.0x to 2.9x | 120 (25.1%) | 380 (40.3%) |
| 3.0x to 3.9x | 18 (3.8%) | 234 (24.8%) |
| 4.0x or more | 205 (42.8%) | 175 (18.6%) |
| Total | 479 (100.0%) | 942 (100.0%) |
Real Estate Taxes by Mortgage Status in Hometown
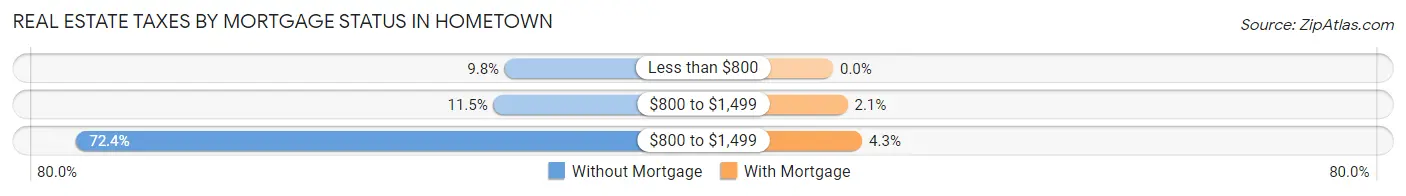
| Property Taxes | Without Mortgage | With Mortgage |
| Less than $800 | 47 (9.8%) | 0 (0.0%) |
| $800 to $1,499 | 55 (11.5%) | 20 (2.1%) |
| $800 to $1,499 | 347 (72.4%) | 40 (4.3%) |
| Total | 479 (100.0%) | 942 (100.0%) |
Health & Disability in Hometown
Health Insurance Coverage by Age in Hometown
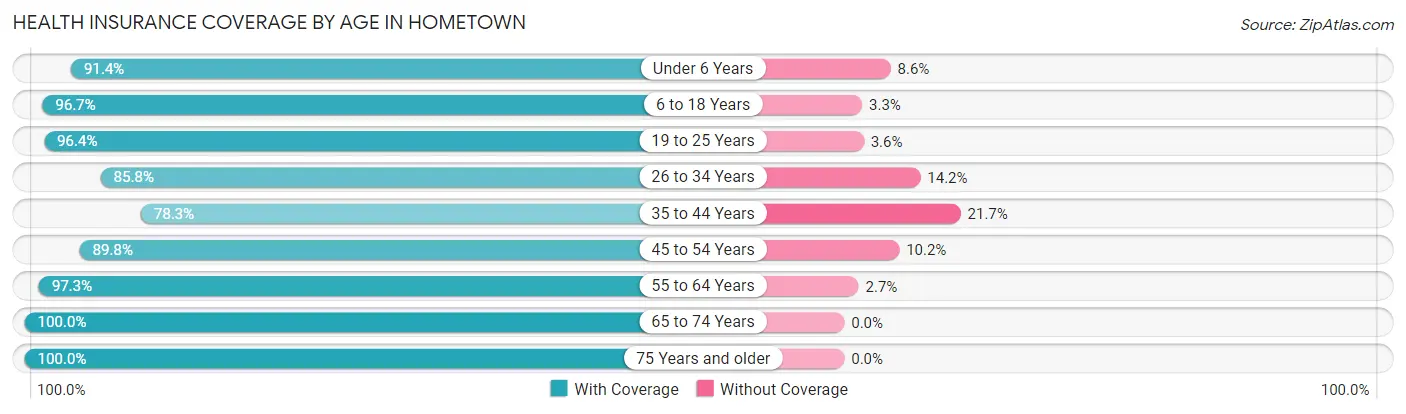
| Age Bracket | With Coverage | Without Coverage |
| Under 6 Years | 201 (91.4%) | 19 (8.6%) |
| 6 to 18 Years | 670 (96.7%) | 23 (3.3%) |
| 19 to 25 Years | 346 (96.4%) | 13 (3.6%) |
| 26 to 34 Years | 448 (85.8%) | 74 (14.2%) |
| 35 to 44 Years | 473 (78.3%) | 131 (21.7%) |
| 45 to 54 Years | 491 (89.8%) | 56 (10.2%) |
| 55 to 64 Years | 623 (97.3%) | 17 (2.7%) |
| 65 to 74 Years | 430 (100.0%) | 0 (0.0%) |
| 75 Years and older | 275 (100.0%) | 0 (0.0%) |
| Total | 3,957 (92.2%) | 333 (7.8%) |
Health Insurance Coverage by Citizenship Status in Hometown
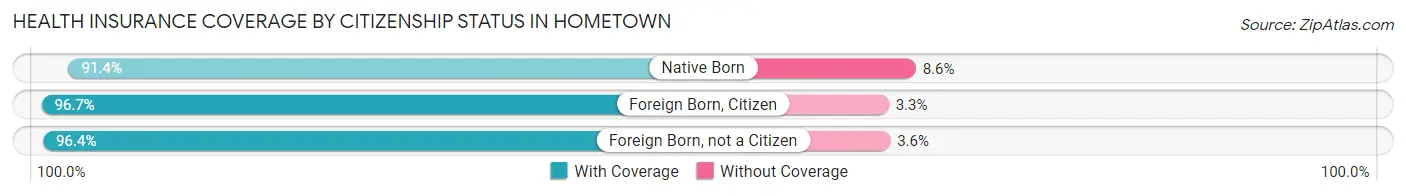
| Citizenship Status | With Coverage | Without Coverage |
| Native Born | 201 (91.4%) | 19 (8.6%) |
| Foreign Born, Citizen | 670 (96.7%) | 23 (3.3%) |
| Foreign Born, not a Citizen | 346 (96.4%) | 13 (3.6%) |
Health Insurance Coverage by Household Income in Hometown
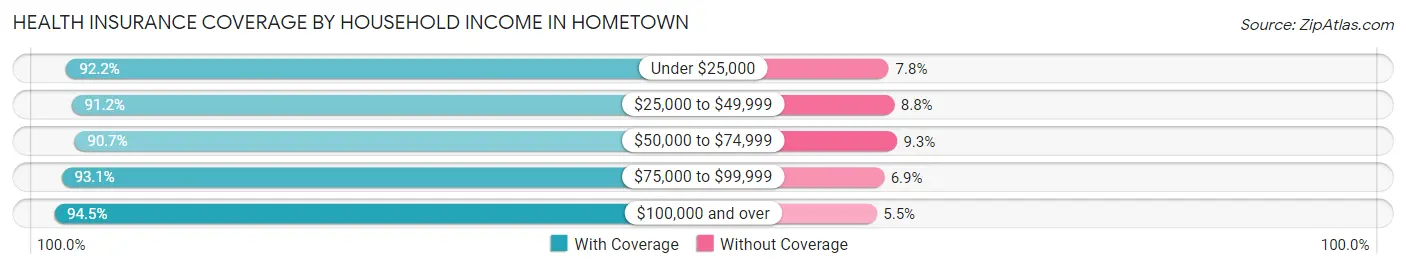
| Household Income | With Coverage | Without Coverage |
| Under $25,000 | 294 (92.2%) | 25 (7.8%) |
| $25,000 to $49,999 | 641 (91.2%) | 62 (8.8%) |
| $50,000 to $74,999 | 1,267 (90.7%) | 130 (9.3%) |
| $75,000 to $99,999 | 862 (93.1%) | 64 (6.9%) |
| $100,000 and over | 889 (94.5%) | 52 (5.5%) |
Public vs Private Health Insurance Coverage by Age in Hometown
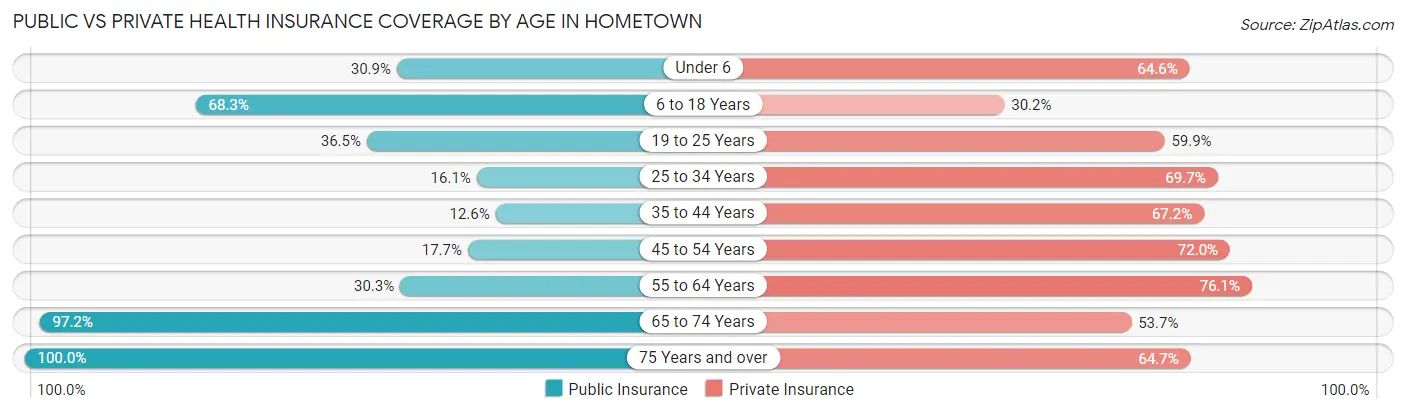
| Age Bracket | Public Insurance | Private Insurance |
| Under 6 | 68 (30.9%) | 142 (64.5%) |
| 6 to 18 Years | 473 (68.2%) | 209 (30.2%) |
| 19 to 25 Years | 131 (36.5%) | 215 (59.9%) |
| 25 to 34 Years | 84 (16.1%) | 364 (69.7%) |
| 35 to 44 Years | 76 (12.6%) | 406 (67.2%) |
| 45 to 54 Years | 97 (17.7%) | 394 (72.0%) |
| 55 to 64 Years | 194 (30.3%) | 487 (76.1%) |
| 65 to 74 Years | 418 (97.2%) | 231 (53.7%) |
| 75 Years and over | 275 (100.0%) | 178 (64.7%) |
| Total | 1,816 (42.3%) | 2,626 (61.2%) |
Disability Status by Sex by Age in Hometown
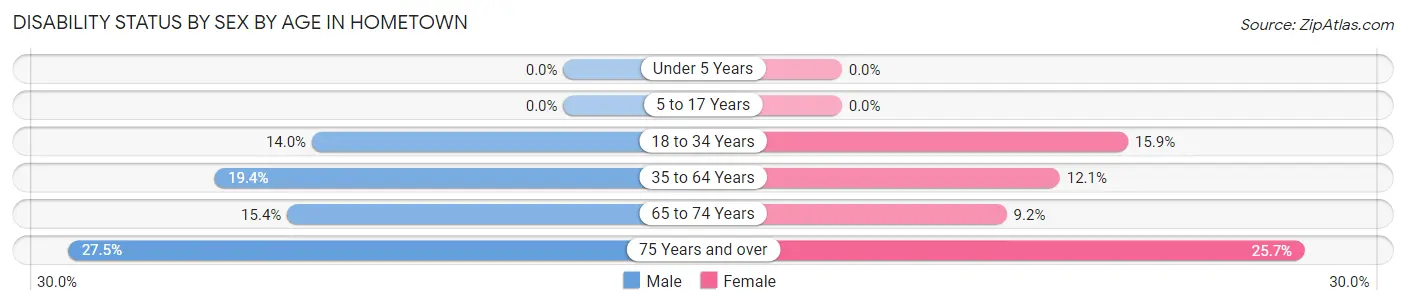
| Age Bracket | Male | Female |
| Under 5 Years | 0 (0.0%) | 0 (0.0%) |
| 5 to 17 Years | 0 (0.0%) | 0 (0.0%) |
| 18 to 34 Years | 63 (14.0%) | 77 (15.9%) |
| 35 to 64 Years | 178 (19.4%) | 106 (12.1%) |
| 65 to 74 Years | 36 (15.4%) | 18 (9.2%) |
| 75 Years and over | 19 (27.5%) | 53 (25.7%) |
Disability Class by Sex by Age in Hometown
Disability Class: Hearing Difficulty
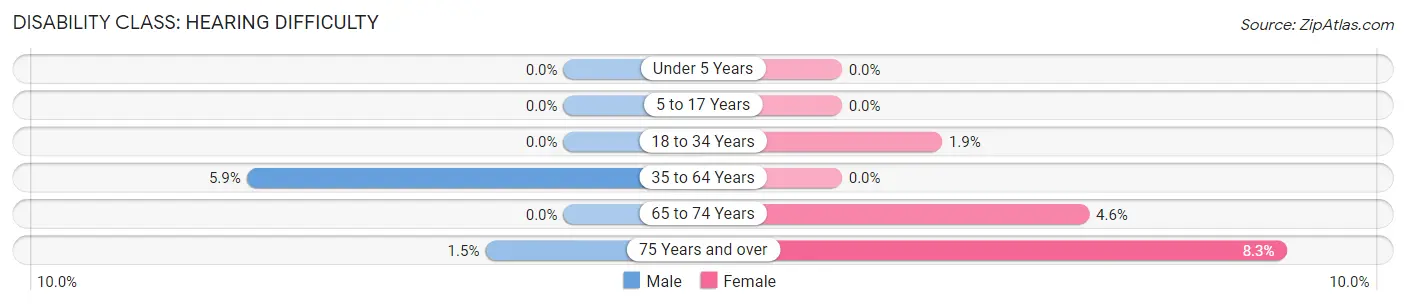
| Age Bracket | Male | Female |
| Under 5 Years | 0 (0.0%) | 0 (0.0%) |
| 5 to 17 Years | 0 (0.0%) | 0 (0.0%) |
| 18 to 34 Years | 0 (0.0%) | 9 (1.9%) |
| 35 to 64 Years | 54 (5.9%) | 0 (0.0%) |
| 65 to 74 Years | 0 (0.0%) | 9 (4.6%) |
| 75 Years and over | 1 (1.5%) | 17 (8.3%) |
Disability Class: Vision Difficulty
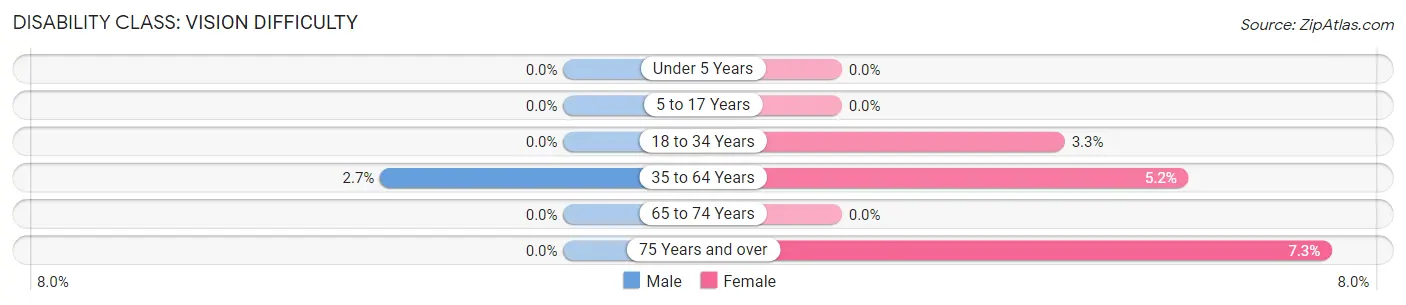
| Age Bracket | Male | Female |
| Under 5 Years | 0 (0.0%) | 0 (0.0%) |
| 5 to 17 Years | 0 (0.0%) | 0 (0.0%) |
| 18 to 34 Years | 0 (0.0%) | 16 (3.3%) |
| 35 to 64 Years | 25 (2.7%) | 45 (5.1%) |
| 65 to 74 Years | 0 (0.0%) | 0 (0.0%) |
| 75 Years and over | 0 (0.0%) | 15 (7.3%) |
Disability Class: Cognitive Difficulty
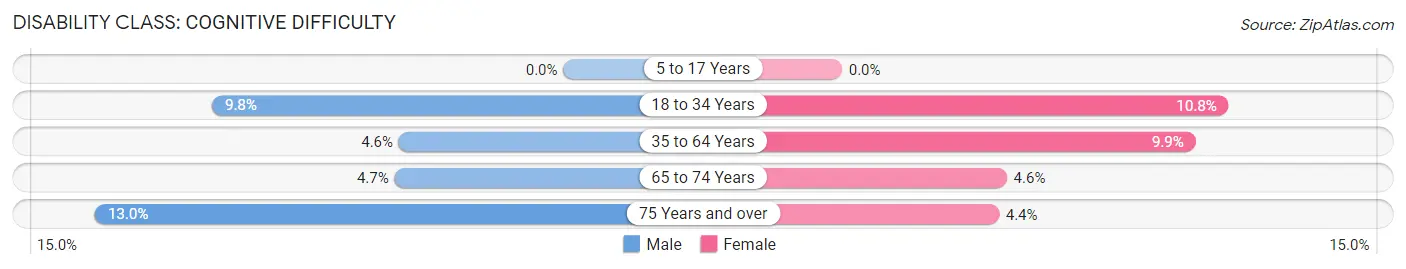
| Age Bracket | Male | Female |
| 5 to 17 Years | 0 (0.0%) | 0 (0.0%) |
| 18 to 34 Years | 44 (9.8%) | 52 (10.8%) |
| 35 to 64 Years | 42 (4.6%) | 86 (9.9%) |
| 65 to 74 Years | 11 (4.7%) | 9 (4.6%) |
| 75 Years and over | 9 (13.0%) | 9 (4.4%) |
Disability Class: Ambulatory Difficulty
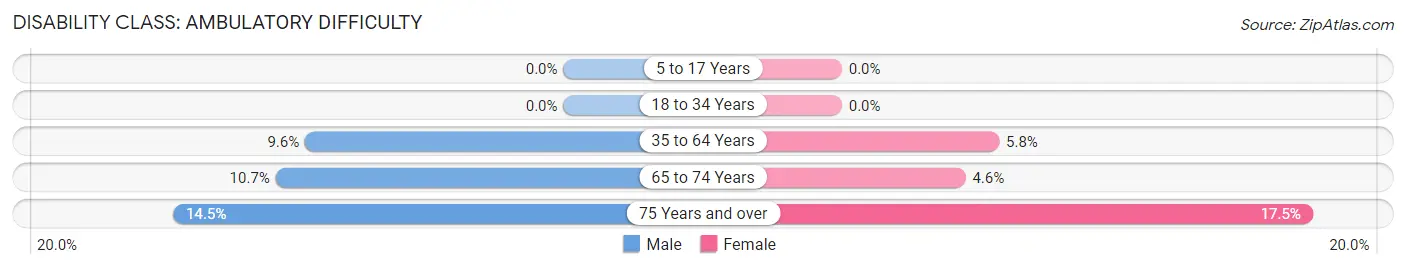
| Age Bracket | Male | Female |
| 5 to 17 Years | 0 (0.0%) | 0 (0.0%) |
| 18 to 34 Years | 0 (0.0%) | 0 (0.0%) |
| 35 to 64 Years | 88 (9.6%) | 51 (5.8%) |
| 65 to 74 Years | 25 (10.7%) | 9 (4.6%) |
| 75 Years and over | 10 (14.5%) | 36 (17.5%) |
Disability Class: Self-Care Difficulty
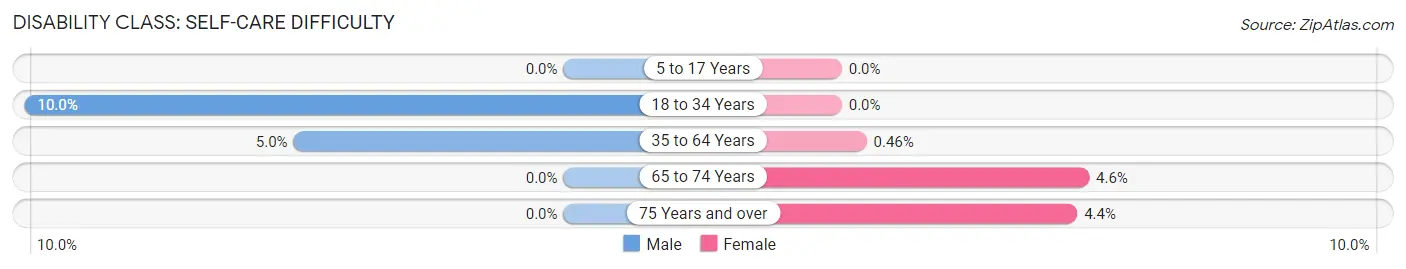
| Age Bracket | Male | Female |
| 5 to 17 Years | 0 (0.0%) | 0 (0.0%) |
| 18 to 34 Years | 45 (10.0%) | 0 (0.0%) |
| 35 to 64 Years | 46 (5.0%) | 4 (0.5%) |
| 65 to 74 Years | 0 (0.0%) | 9 (4.6%) |
| 75 Years and over | 0 (0.0%) | 9 (4.4%) |
Technology Access in Hometown
Computing Device Access in Hometown
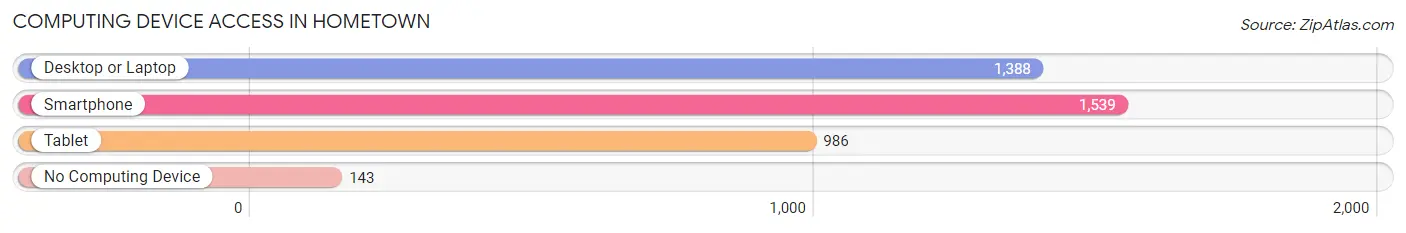
| Device Type | # Households | % Households |
| Desktop or Laptop | 1,388 | 72.8% |
| Smartphone | 1,539 | 80.7% |
| Tablet | 986 | 51.7% |
| No Computing Device | 143 | 7.5% |
| Total | 1,907 | 100.0% |
Internet Access in Hometown
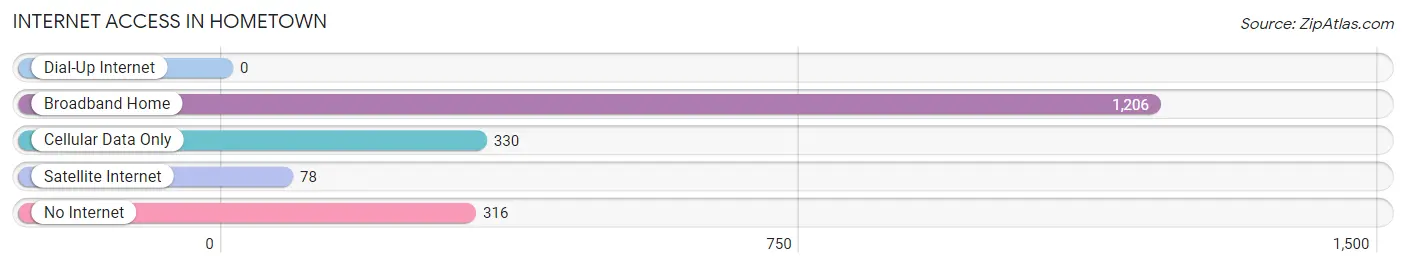
| Internet Type | # Households | % Households |
| Dial-Up Internet | 0 | 0.0% |
| Broadband Home | 1,206 | 63.2% |
| Cellular Data Only | 330 | 17.3% |
| Satellite Internet | 78 | 4.1% |
| No Internet | 316 | 16.6% |
| Total | 1,907 | 100.0% |
Hometown Summary
Hometown, IL is a small town located in the state of Illinois. It is situated in the northern part of the state, about 30 miles from the city of Chicago. The town has a population of approximately 5,000 people and is part of the Chicago metropolitan area.
History
Hometown, IL was founded in 1835 by a group of settlers from New England. The town was originally called New England, but the name was changed to Hometown in 1845. The town was a popular destination for immigrants from Europe, especially Germany, who were looking for a better life in the United States. The town grew rapidly in the late 19th and early 20th centuries, and by the 1920s it had become a bustling small town.
Geography
Hometown, IL is located in the northern part of the state, about 30 miles from the city of Chicago. The town is situated on the banks of the Fox River, which flows through the town and provides a source of recreation for the locals. The town is surrounded by rolling hills and farmland, and is home to several parks and nature preserves.
Economy
Hometown, IL is a small town with a diverse economy. The town is home to several small businesses, including restaurants, retail stores, and professional services. The town also has a thriving agricultural sector, with many local farmers growing corn, soybeans, and other crops. The town is also home to several manufacturing companies, which produce a variety of products, including furniture, clothing, and electronics.
Demographics
Hometown, IL has a population of approximately 5,000 people. The town is predominantly white, with about 75% of the population identifying as Caucasian. The town also has a significant Hispanic population, with about 15% of the population identifying as Hispanic or Latino. The town also has a small African American population, with about 5% of the population identifying as African American. The town also has a small Asian population, with about 2% of the population identifying as Asian.
Conclusion
Hometown, IL is a small town located in the northern part of the state of Illinois. The town has a population of approximately 5,000 people and is part of the Chicago metropolitan area. The town was founded in 1835 by a group of settlers from New England and has a diverse economy, with many small businesses, agricultural operations, and manufacturing companies. The town is predominantly white, with a significant Hispanic population, a small African American population, and a small Asian population.
Common Questions
What is Per Capita Income in Hometown?
Per Capita income in Hometown is $28,736.
What is the Median Family Income in Hometown?
Median Family Income in Hometown is $64,250.
What is the Median Household income in Hometown?
Median Household Income in Hometown is $56,841.
What is Income or Wage Gap in Hometown?
Income or Wage Gap in Hometown is 23.0%.
Women in Hometown earn 77.0 cents for every dollar earned by a man.
What is Inequality or Gini Index in Hometown?
Inequality or Gini Index in Hometown is 0.34.
What is the Total Population of Hometown?
Total Population of Hometown is 4,299.
What is the Total Male Population of Hometown?
Total Male Population of Hometown is 2,127.
What is the Total Female Population of Hometown?
Total Female Population of Hometown is 2,172.
What is the Ratio of Males per 100 Females in Hometown?
There are 97.93 Males per 100 Females in Hometown.
What is the Ratio of Females per 100 Males in Hometown?
There are 102.12 Females per 100 Males in Hometown.
What is the Median Population Age in Hometown?
Median Population Age in Hometown is 39.7 Years.
What is the Average Family Size in Hometown
Average Family Size in Hometown is 3.2 People.
What is the Average Household Size in Hometown
Average Household Size in Hometown is 2.2 People.
How Large is the Labor Force in Hometown?
There are 2,279 People in the Labor Forcein in Hometown.
What is the Percentage of People in the Labor Force in Hometown?
65.3% of People are in the Labor Force in Hometown.
What is the Unemployment Rate in Hometown?
Unemployment Rate in Hometown is 5.9%.