Zip Codes with the Highest Percentage of Population Employed in Legal Services & Support in Decatur, IL
RELATED REPORTS & OPTIONS
Legal Services & Support
Decatur
Compare Zip Codes
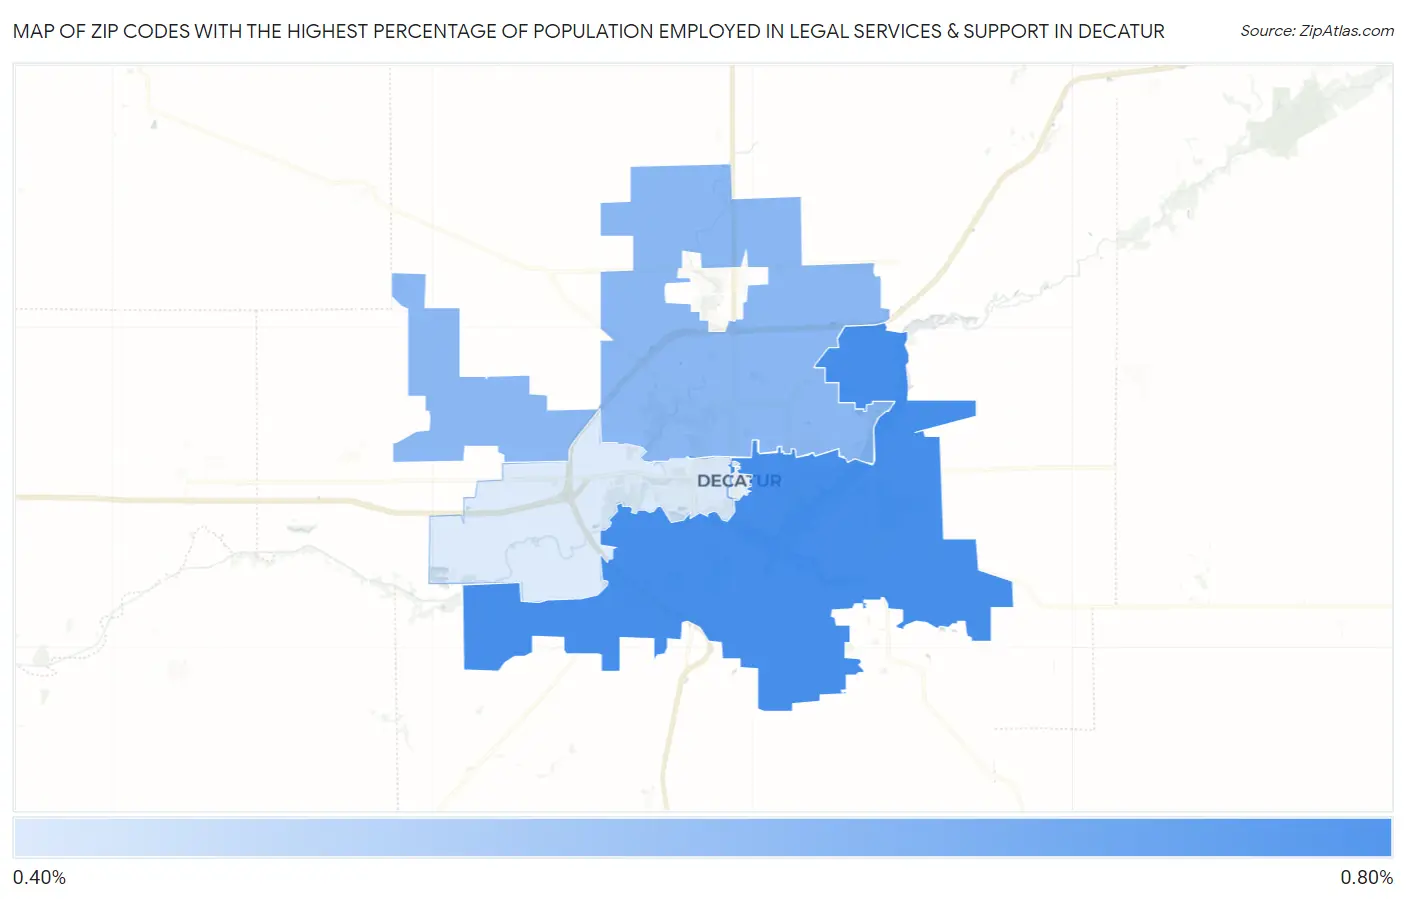
Map of Zip Codes with the Highest Percentage of Population Employed in Legal Services & Support in Decatur
0.49%
0.71%
Zip Codes with the Highest Percentage of Population Employed in Legal Services & Support in Decatur, IL
| Zip Code | % Employed | vs State | vs National | |
| 1. | 62521 | 0.71% | 1.3%(-0.642)#390 | 1.2%(-0.476)#10,332 |
| 2. | 62526 | 0.61% | 1.3%(-0.736)#437 | 1.2%(-0.571)#11,317 |
| 3. | 62522 | 0.49% | 1.3%(-0.855)#502 | 1.2%(-0.690)#12,704 |
1
Common Questions
What are the Top 3 Zip Codes with the Highest Percentage of Population Employed in Legal Services & Support in Decatur, IL?
Top 3 Zip Codes with the Highest Percentage of Population Employed in Legal Services & Support in Decatur, IL are:
What zip code has the Highest Percentage of Population Employed in Legal Services & Support in Decatur, IL?
62521 has the Highest Percentage of Population Employed in Legal Services & Support in Decatur, IL with 0.71%.
What is the Percentage of Population Employed in Legal Services & Support in Decatur, IL?
Percentage of Population Employed in Legal Services & Support in Decatur is 0.62%.
What is the Percentage of Population Employed in Legal Services & Support in Illinois?
Percentage of Population Employed in Legal Services & Support in Illinois is 1.3%.
What is the Percentage of Population Employed in Legal Services & Support in the United States?
Percentage of Population Employed in Legal Services & Support in the United States is 1.2%.