Posen, IL Map & Demographics
Posen Map
Posen Overview
$23,161
PER CAPITA INCOME
$73,281
AVG FAMILY INCOME
$60,094
AVG HOUSEHOLD INCOME
9.4%
WAGE / INCOME GAP [ % ]
90.6¢/ $1
WAGE / INCOME GAP [ $ ]
0.37
INEQUALITY / GINI INDEX
5,442
TOTAL POPULATION
2,974
MALE POPULATION
2,468
FEMALE POPULATION
120.50
MALES / 100 FEMALES
82.99
FEMALES / 100 MALES
32.2
MEDIAN AGE
3.9
AVG FAMILY SIZE
3.4
AVG HOUSEHOLD SIZE
2,956
LABOR FORCE [ PEOPLE ]
68.4%
PERCENT IN LABOR FORCE
8.2%
UNEMPLOYMENT RATE
Posen Zip Codes
Posen Area Codes
Income in Posen
Income Overview in Posen
Per Capita Income in Posen is $23,161, while median incomes of families and households are $73,281 and $60,094 respectively.
| Characteristic | Number | Measure |
| Per Capita Income | 5,442 | $23,161 |
| Median Family Income | 1,259 | $73,281 |
| Mean Family Income | 1,259 | $80,499 |
| Median Household Income | 1,607 | $60,094 |
| Mean Household Income | 1,607 | $74,426 |
| Income Deficit | 1,259 | $0 |
| Wage / Income Gap (%) | 5,442 | 9.44% |
| Wage / Income Gap ($) | 5,442 | 90.56¢ per $1 |
| Gini / Inequality Index | 5,442 | 0.37 |
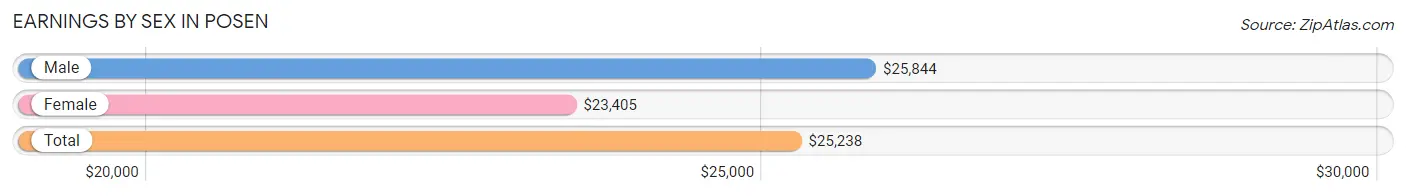
Earnings by Sex in Posen
Average Earnings in Posen are $25,238, $25,844 for men and $23,405 for women, a difference of 9.4%.
| Sex | Number | Average Earnings |
| Male | 1,795 (63.6%) | $25,844 |
| Female | 1,025 (36.3%) | $23,405 |
| Total | 2,820 (100.0%) | $25,238 |
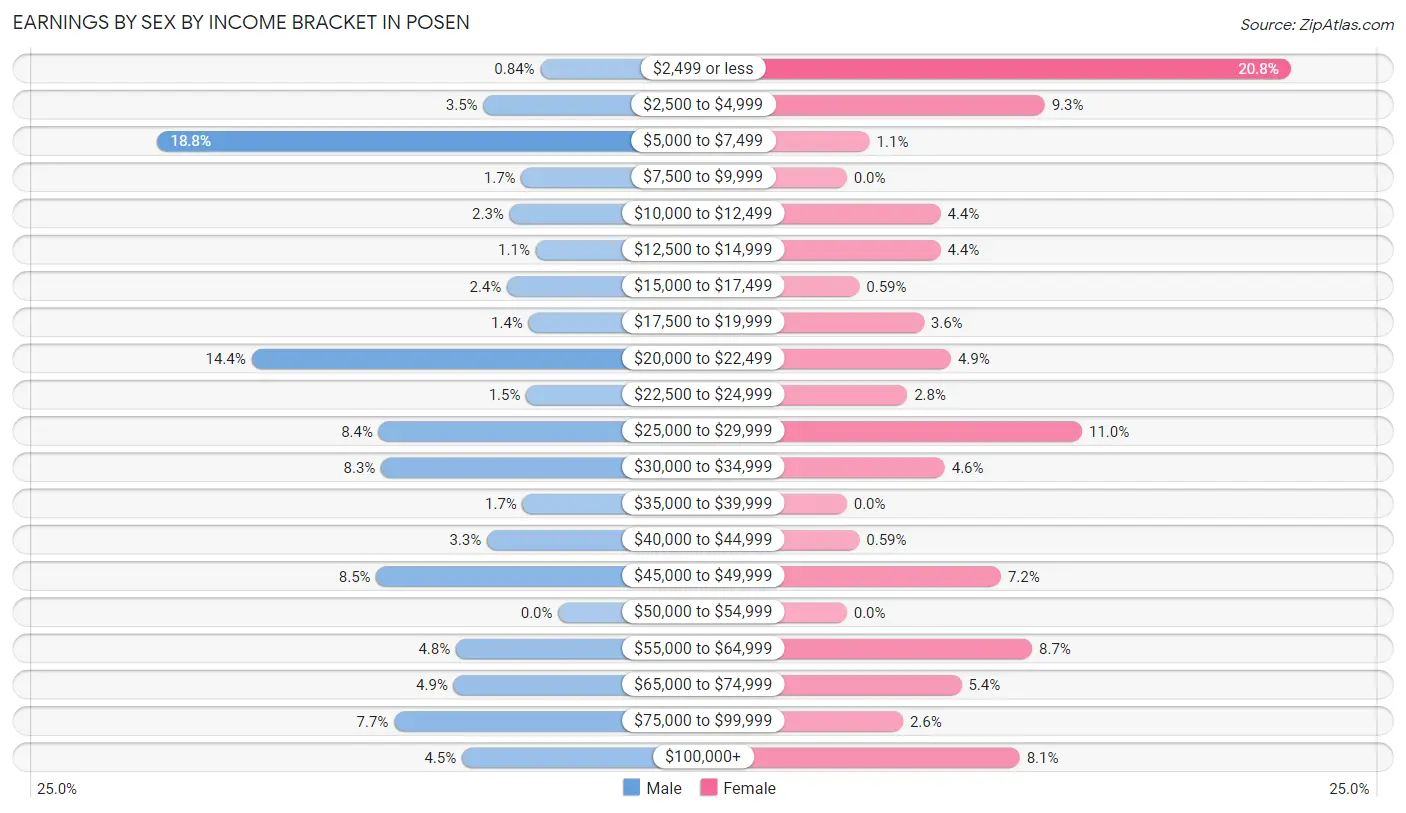
Earnings by Sex by Income Bracket in Posen
The most common earnings brackets in Posen are $5,000 to $7,499 for men (337 | 18.8%) and $2,499 or less for women (213 | 20.8%).
| Income | Male | Female |
| $2,499 or less | 15 (0.8%) | 213 (20.8%) |
| $2,500 to $4,999 | 63 (3.5%) | 95 (9.3%) |
| $5,000 to $7,499 | 337 (18.8%) | 11 (1.1%) |
| $7,500 to $9,999 | 31 (1.7%) | 0 (0.0%) |
| $10,000 to $12,499 | 41 (2.3%) | 45 (4.4%) |
| $12,500 to $14,999 | 19 (1.1%) | 45 (4.4%) |
| $15,000 to $17,499 | 43 (2.4%) | 6 (0.6%) |
| $17,500 to $19,999 | 25 (1.4%) | 37 (3.6%) |
| $20,000 to $22,499 | 258 (14.4%) | 50 (4.9%) |
| $22,500 to $24,999 | 27 (1.5%) | 29 (2.8%) |
| $25,000 to $29,999 | 151 (8.4%) | 113 (11.0%) |
| $30,000 to $34,999 | 149 (8.3%) | 47 (4.6%) |
| $35,000 to $39,999 | 30 (1.7%) | 0 (0.0%) |
| $40,000 to $44,999 | 60 (3.3%) | 6 (0.6%) |
| $45,000 to $49,999 | 153 (8.5%) | 74 (7.2%) |
| $50,000 to $54,999 | 0 (0.0%) | 0 (0.0%) |
| $55,000 to $64,999 | 86 (4.8%) | 89 (8.7%) |
| $65,000 to $74,999 | 88 (4.9%) | 55 (5.4%) |
| $75,000 to $99,999 | 138 (7.7%) | 27 (2.6%) |
| $100,000+ | 81 (4.5%) | 83 (8.1%) |
| Total | 1,795 (100.0%) | 1,025 (100.0%) |
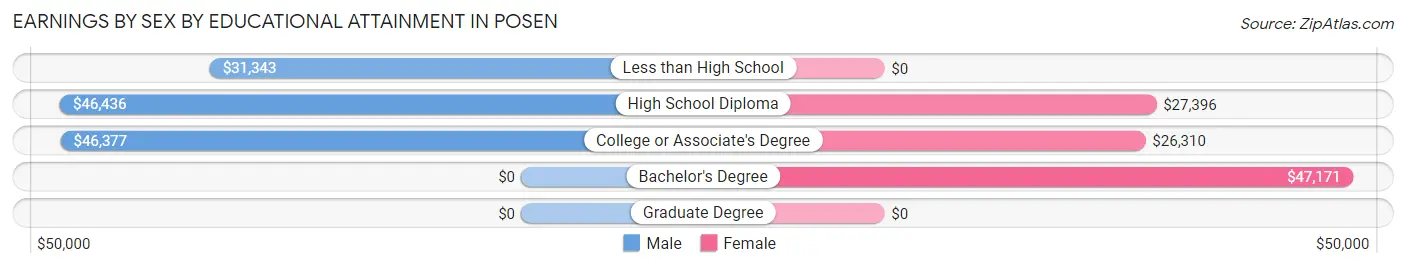
Earnings by Sex by Educational Attainment in Posen
Average earnings in Posen are $45,114 for men and $30,234 for women, a difference of 33.0%. Men with an educational attainment of high school diploma enjoy the highest average annual earnings of $46,436, while those with less than high school education earn the least with $31,343. Women with an educational attainment of bachelor's degree earn the most with the average annual earnings of $47,171, while those with college or associate's degree education have the smallest earnings of $26,310.
| Educational Attainment | Male Income | Female Income |
| Less than High School | $31,343 | $0 |
| High School Diploma | $46,436 | $27,396 |
| College or Associate's Degree | $46,377 | $26,310 |
| Bachelor's Degree | - | - |
| Graduate Degree | - | - |
| Total | $45,114 | $30,234 |
Family Income in Posen
Family Income Brackets in Posen
According to the Posen family income data, there are 337 families falling into the $75,000 to $99,999 income range, which is the most common income bracket and makes up 26.8% of all families.
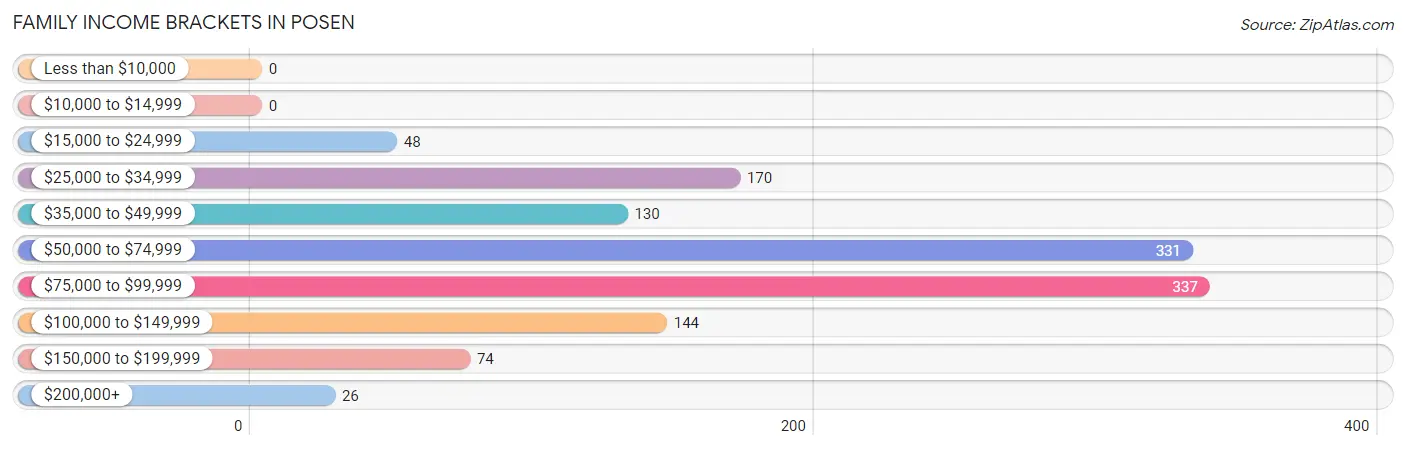
| Income Bracket | # Families | % Families |
| Less than $10,000 | 0 | 0.0% |
| $10,000 to $14,999 | 0 | 0.0% |
| $15,000 to $24,999 | 48 | 3.8% |
| $25,000 to $34,999 | 170 | 13.5% |
| $35,000 to $49,999 | 130 | 10.3% |
| $50,000 to $74,999 | 331 | 26.3% |
| $75,000 to $99,999 | 337 | 26.8% |
| $100,000 to $149,999 | 144 | 11.4% |
| $150,000 to $199,999 | 74 | 5.9% |
| $200,000+ | 26 | 2.1% |
Family Income by Famaliy Size in Posen
6-person families (138 | 11.0%) account for the highest median family income in Posen with $133,864 per family, while 2-person families (517 | 41.1%) have the highest median income of $25,954 per family member.
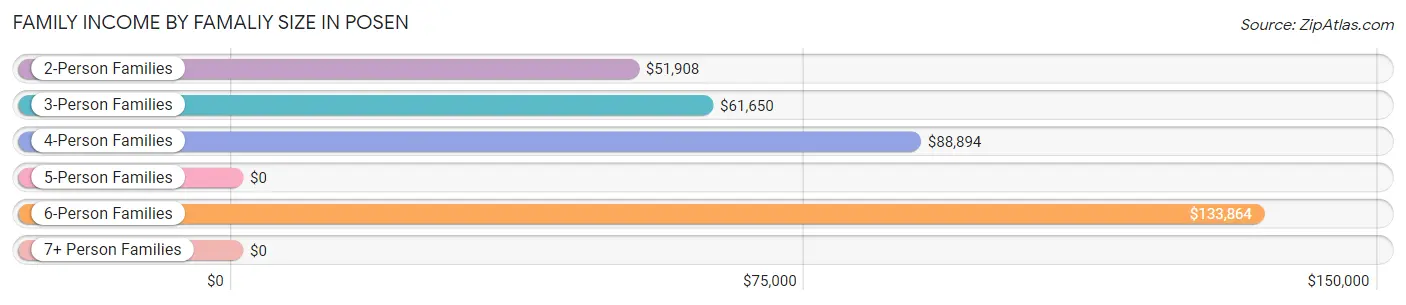
| Income Bracket | # Families | Median Income |
| 2-Person Families | 517 (41.1%) | $51,908 |
| 3-Person Families | 263 (20.9%) | $61,650 |
| 4-Person Families | 183 (14.5%) | $88,894 |
| 5-Person Families | 86 (6.8%) | $0 |
| 6-Person Families | 138 (11.0%) | $133,864 |
| 7+ Person Families | 72 (5.7%) | $0 |
| Total | 1,259 (100.0%) | $73,281 |
Family Income by Number of Earners in Posen
The median family income in Posen is $73,281, with families comprising 2 earners (329) having the highest median family income of $88,990, while families with 1 earner (298) have the lowest median family income of $47,132, accounting for 26.1% and 23.7% of families, respectively.
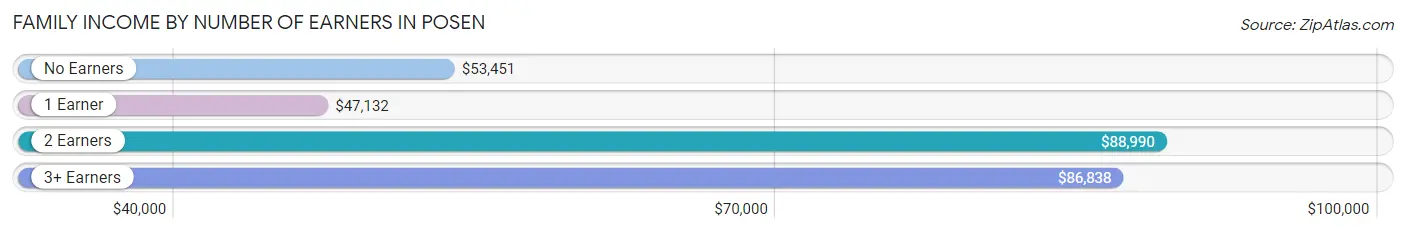
| Number of Earners | # Families | Median Income |
| No Earners | 273 (21.7%) | $53,451 |
| 1 Earner | 298 (23.7%) | $47,132 |
| 2 Earners | 329 (26.1%) | $88,990 |
| 3+ Earners | 359 (28.5%) | $86,838 |
| Total | 1,259 (100.0%) | $73,281 |
Household Income in Posen
Household Income Brackets in Posen
With 395 households falling in the category, the $75,000 to $99,999 income range is the most frequent in Posen, accounting for 24.6% of all households. In contrast, only 35 households (2.2%) fall into the $10,000 to $14,999 income bracket, making it the least populous group.
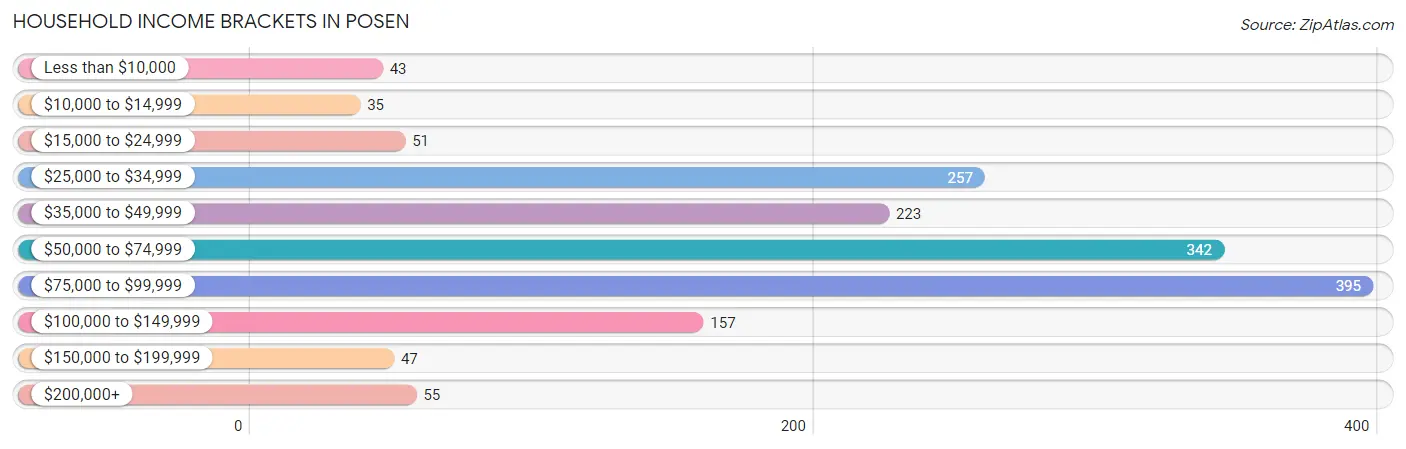
| Income Bracket | # Households | % Households |
| Less than $10,000 | 43 | 2.7% |
| $10,000 to $14,999 | 35 | 2.2% |
| $15,000 to $24,999 | 51 | 3.2% |
| $25,000 to $34,999 | 257 | 16.0% |
| $35,000 to $49,999 | 223 | 13.9% |
| $50,000 to $74,999 | 342 | 21.3% |
| $75,000 to $99,999 | 395 | 24.6% |
| $100,000 to $149,999 | 157 | 9.8% |
| $150,000 to $199,999 | 47 | 2.9% |
| $200,000+ | 55 | 3.4% |
Household Income by Householder Age in Posen
The median household income in Posen is $60,094, with the highest median household income of $85,729 found in the 45 to 64 years age bracket for the primary householder. A total of 733 households (45.6%) fall into this category. Meanwhile, the 15 to 24 years age bracket for the primary householder has the lowest median household income of $0, with 28 households (1.7%) in this group.
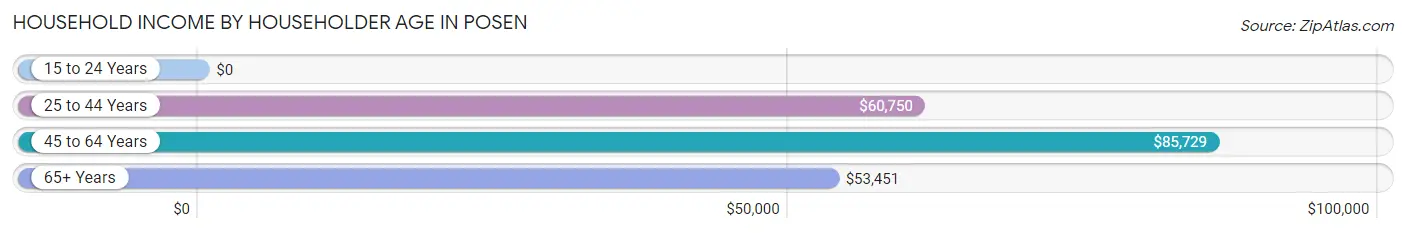
| Income Bracket | # Households | Median Income |
| 15 to 24 Years | 28 (1.7%) | $0 |
| 25 to 44 Years | 507 (31.6%) | $60,750 |
| 45 to 64 Years | 733 (45.6%) | $85,729 |
| 65+ Years | 339 (21.1%) | $53,451 |
| Total | 1,607 (100.0%) | $60,094 |
Poverty in Posen
Income Below Poverty by Sex and Age in Posen
With 4.0% poverty level for males and 5.3% for females among the residents of Posen, under 5 year old males and 12 to 14 year old females are the most vulnerable to poverty, with 25 males (10.0%) and 26 females (65.0%) in their respective age groups living below the poverty level.
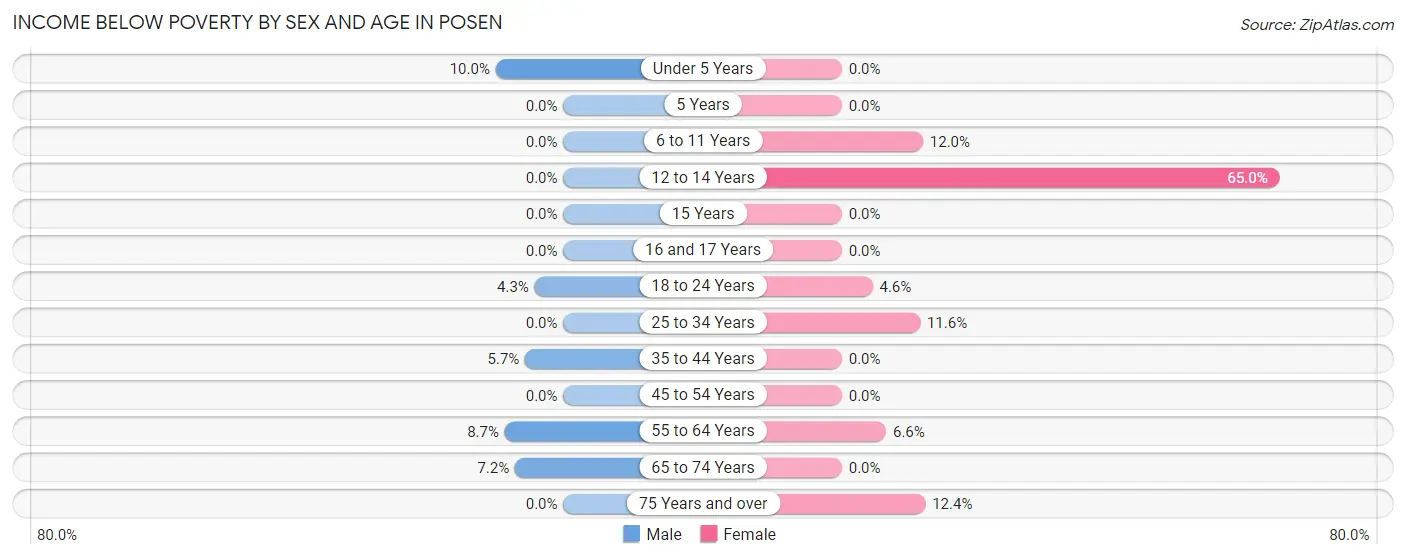
| Age Bracket | Male | Female |
| Under 5 Years | 25 (10.0%) | 0 (0.0%) |
| 5 Years | 0 (0.0%) | 0 (0.0%) |
| 6 to 11 Years | 0 (0.0%) | 26 (12.0%) |
| 12 to 14 Years | 0 (0.0%) | 26 (65.0%) |
| 15 Years | 0 (0.0%) | 0 (0.0%) |
| 16 and 17 Years | 0 (0.0%) | 0 (0.0%) |
| 18 to 24 Years | 28 (4.3%) | 14 (4.6%) |
| 25 to 34 Years | 0 (0.0%) | 36 (11.6%) |
| 35 to 44 Years | 17 (5.7%) | 0 (0.0%) |
| 45 to 54 Years | 0 (0.0%) | 0 (0.0%) |
| 55 to 64 Years | 30 (8.7%) | 14 (6.6%) |
| 65 to 74 Years | 18 (7.2%) | 0 (0.0%) |
| 75 Years and over | 0 (0.0%) | 14 (12.4%) |
| Total | 118 (4.0%) | 130 (5.3%) |
Income Above Poverty by Sex and Age in Posen
According to the poverty statistics in Posen, males aged 6 to 11 years and females aged under 5 years are the age groups that are most secure financially, with 100.0% of males and 100.0% of females in these age groups living above the poverty line.
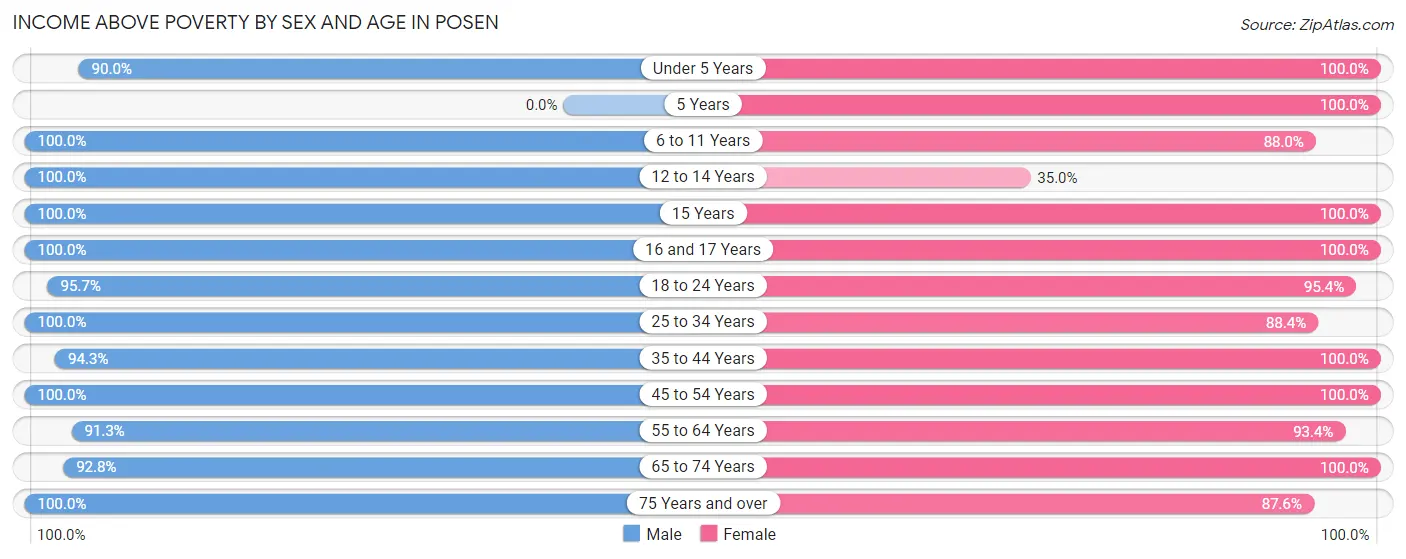
| Age Bracket | Male | Female |
| Under 5 Years | 224 (90.0%) | 153 (100.0%) |
| 5 Years | 0 (0.0%) | 73 (100.0%) |
| 6 to 11 Years | 167 (100.0%) | 190 (88.0%) |
| 12 to 14 Years | 153 (100.0%) | 14 (35.0%) |
| 15 Years | 23 (100.0%) | 32 (100.0%) |
| 16 and 17 Years | 93 (100.0%) | 113 (100.0%) |
| 18 to 24 Years | 630 (95.7%) | 293 (95.4%) |
| 25 to 34 Years | 416 (100.0%) | 274 (88.4%) |
| 35 to 44 Years | 283 (94.3%) | 182 (100.0%) |
| 45 to 54 Years | 264 (100.0%) | 616 (100.0%) |
| 55 to 64 Years | 315 (91.3%) | 199 (93.4%) |
| 65 to 74 Years | 233 (92.8%) | 100 (100.0%) |
| 75 Years and over | 40 (100.0%) | 99 (87.6%) |
| Total | 2,841 (96.0%) | 2,338 (94.7%) |
Income Below Poverty Among Married-Couple Families in Posen
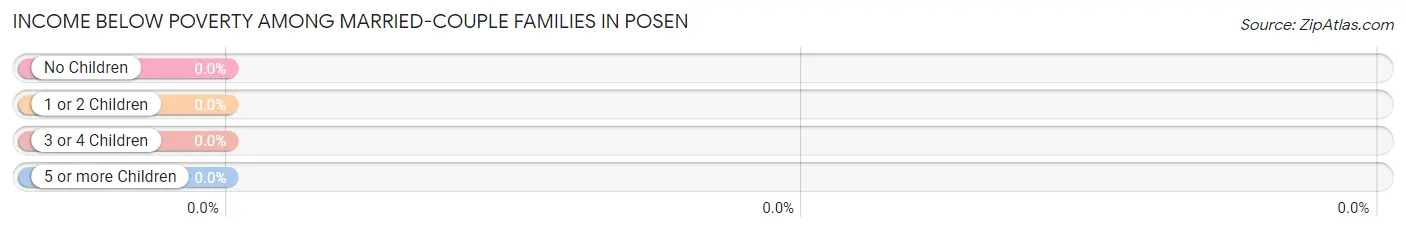
| Children | Above Poverty | Below Poverty |
| No Children | 526 (100.0%) | 0 (0.0%) |
| 1 or 2 Children | 200 (100.0%) | 0 (0.0%) |
| 3 or 4 Children | 160 (100.0%) | 0 (0.0%) |
| 5 or more Children | 0 (0.0%) | 0 (0.0%) |
| Total | 886 (100.0%) | 0 (0.0%) |
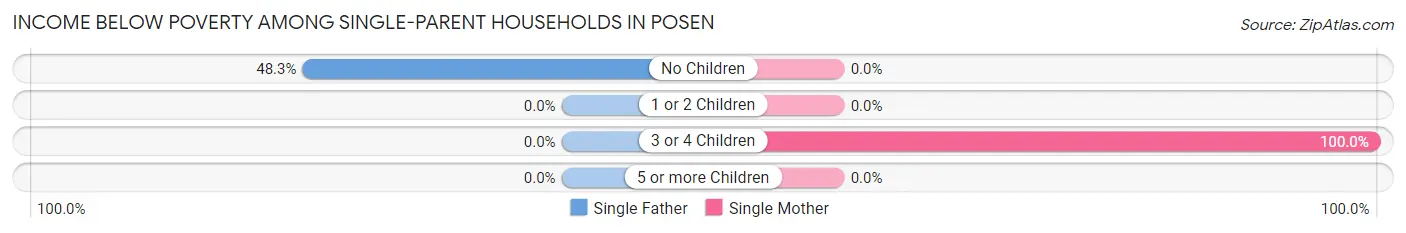
Income Below Poverty Among Single-Parent Households in Posen
According to the poverty data in Posen, 11.6% or 14 single-father households and 8.3% or 21 single-mother households are living below the poverty line. Among single-father households, those with no children have the highest poverty rate, with 14 households (48.3%) experiencing poverty. Likewise, among single-mother households, those with 3 or 4 children have the highest poverty rate, with 21 households (100.0%) falling below the poverty line.
| Children | Single Father | Single Mother |
| No Children | 14 (48.3%) | 0 (0.0%) |
| 1 or 2 Children | 0 (0.0%) | 0 (0.0%) |
| 3 or 4 Children | 0 (0.0%) | 21 (100.0%) |
| 5 or more Children | 0 (0.0%) | 0 (0.0%) |
| Total | 14 (11.6%) | 21 (8.3%) |
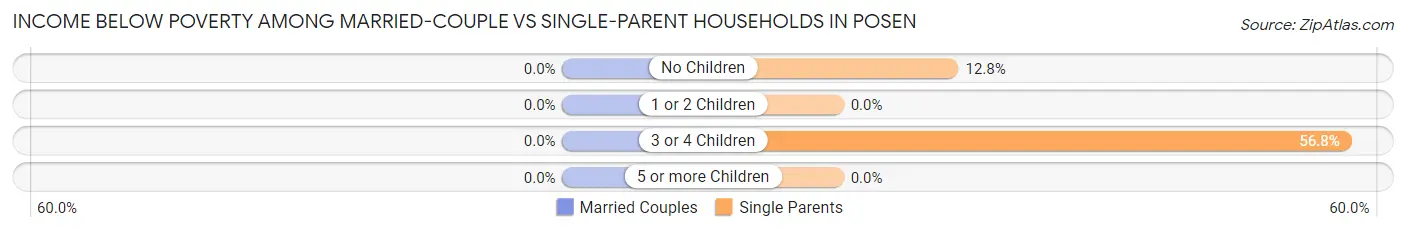
Income Below Poverty Among Married-Couple vs Single-Parent Households in Posen
| Children | Married-Couple Families | Single-Parent Households |
| No Children | 0 (0.0%) | 14 (12.8%) |
| 1 or 2 Children | 0 (0.0%) | 0 (0.0%) |
| 3 or 4 Children | 0 (0.0%) | 21 (56.8%) |
| 5 or more Children | 0 (0.0%) | 0 (0.0%) |
| Total | 0 (0.0%) | 35 (9.4%) |
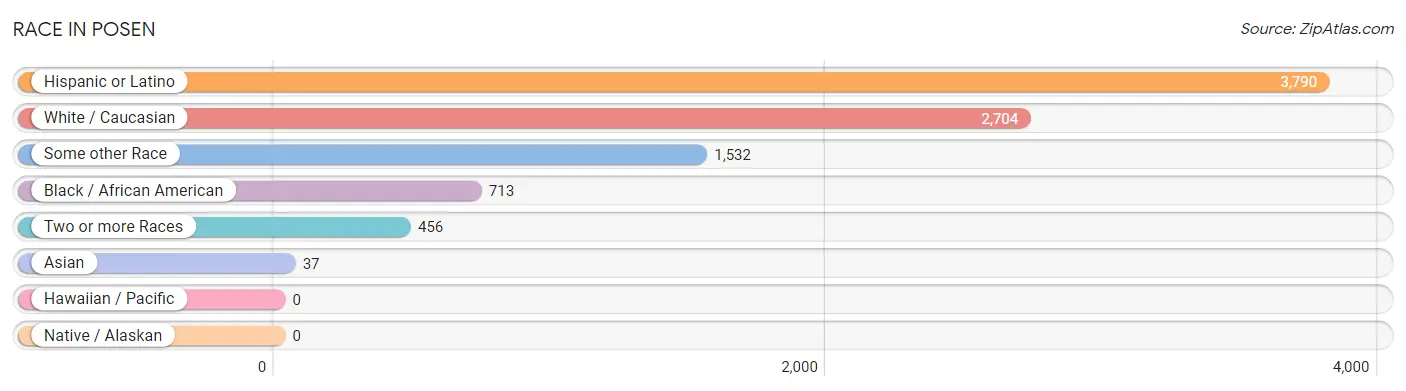
Race in Posen
The most populous races in Posen are Hispanic or Latino (3,790 | 69.6%), White / Caucasian (2,704 | 49.7%), and Some other Race (1,532 | 28.1%).
| Race | # Population | % Population |
| Asian | 37 | 0.7% |
| Black / African American | 713 | 13.1% |
| Hawaiian / Pacific | 0 | 0.0% |
| Hispanic or Latino | 3,790 | 69.6% |
| Native / Alaskan | 0 | 0.0% |
| White / Caucasian | 2,704 | 49.7% |
| Two or more Races | 456 | 8.4% |
| Some other Race | 1,532 | 28.1% |
| Total | 5,442 | 100.0% |
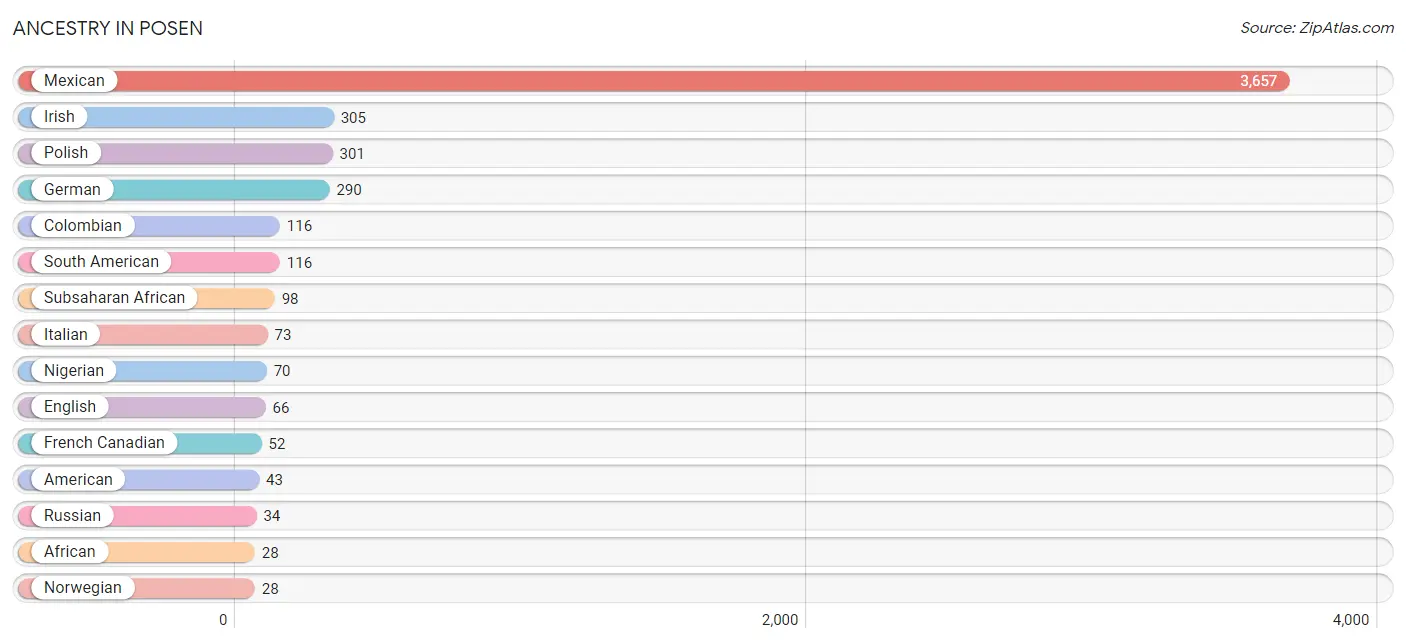
Ancestry in Posen
The most populous ancestries reported in Posen are Mexican (3,657 | 67.2%), Irish (305 | 5.6%), Polish (301 | 5.5%), German (290 | 5.3%), and Colombian (116 | 2.1%), together accounting for 85.8% of all Posen residents.
| Ancestry | # Population | % Population |
| African | 28 | 0.5% |
| American | 43 | 0.8% |
| Central American | 9 | 0.2% |
| Colombian | 116 | 2.1% |
| Eastern European | 16 | 0.3% |
| English | 66 | 1.2% |
| French | 17 | 0.3% |
| French Canadian | 52 | 1.0% |
| German | 290 | 5.3% |
| Guatemalan | 9 | 0.2% |
| Hungarian | 11 | 0.2% |
| Indian (Asian) | 15 | 0.3% |
| Irish | 305 | 5.6% |
| Italian | 73 | 1.3% |
| Korean | 22 | 0.4% |
| Lithuanian | 15 | 0.3% |
| Mexican | 3,657 | 67.2% |
| Nigerian | 70 | 1.3% |
| Northern European | 16 | 0.3% |
| Norwegian | 28 | 0.5% |
| Polish | 301 | 5.5% |
| Russian | 34 | 0.6% |
| Slovak | 13 | 0.2% |
| South American | 116 | 2.1% |
| Subsaharan African | 98 | 1.8% |
| Welsh | 13 | 0.2% | View All 26 Rows |
Immigrants in Posen
The most numerous immigrant groups reported in Posen came from Latin America (1,303 | 23.9%), Central America (1,242 | 22.8%), Mexico (1,242 | 22.8%), Africa (80 | 1.5%), and Nigeria (80 | 1.5%), together accounting for 72.5% of all Posen residents.
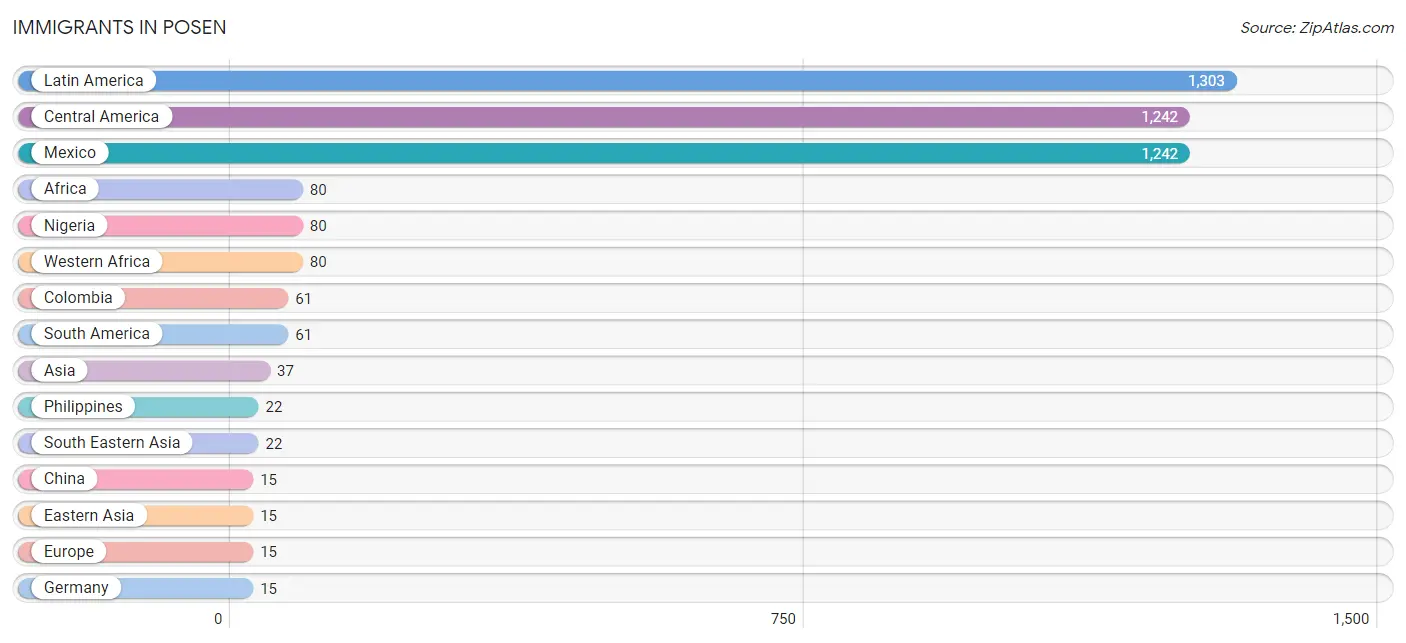
| Immigration Origin | # Population | % Population |
| Africa | 80 | 1.5% |
| Asia | 37 | 0.7% |
| Central America | 1,242 | 22.8% |
| China | 15 | 0.3% |
| Colombia | 61 | 1.1% |
| Eastern Asia | 15 | 0.3% |
| Europe | 15 | 0.3% |
| Germany | 15 | 0.3% |
| Latin America | 1,303 | 23.9% |
| Mexico | 1,242 | 22.8% |
| Nigeria | 80 | 1.5% |
| Philippines | 22 | 0.4% |
| South America | 61 | 1.1% |
| South Eastern Asia | 22 | 0.4% |
| Western Africa | 80 | 1.5% |
| Western Europe | 15 | 0.3% | View All 16 Rows |
Sex and Age in Posen
Sex and Age in Posen
The most populous age groups in Posen are 15 to 19 Years (415 | 14.0%) for men and 45 to 49 Years (329 | 13.3%) for women.
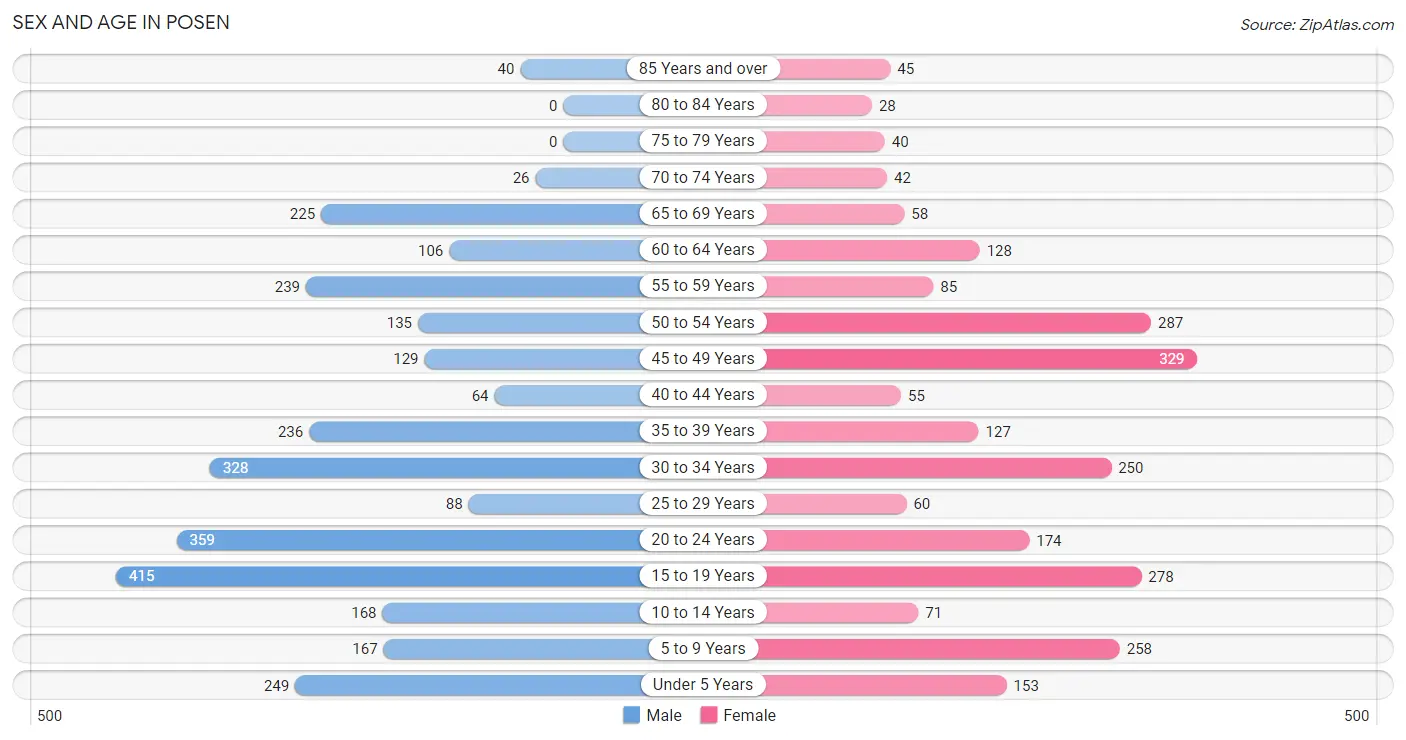
| Age Bracket | Male | Female |
| Under 5 Years | 249 (8.4%) | 153 (6.2%) |
| 5 to 9 Years | 167 (5.6%) | 258 (10.4%) |
| 10 to 14 Years | 168 (5.7%) | 71 (2.9%) |
| 15 to 19 Years | 415 (14.0%) | 278 (11.3%) |
| 20 to 24 Years | 359 (12.1%) | 174 (7.0%) |
| 25 to 29 Years | 88 (3.0%) | 60 (2.4%) |
| 30 to 34 Years | 328 (11.0%) | 250 (10.1%) |
| 35 to 39 Years | 236 (7.9%) | 127 (5.1%) |
| 40 to 44 Years | 64 (2.1%) | 55 (2.2%) |
| 45 to 49 Years | 129 (4.3%) | 329 (13.3%) |
| 50 to 54 Years | 135 (4.5%) | 287 (11.6%) |
| 55 to 59 Years | 239 (8.0%) | 85 (3.4%) |
| 60 to 64 Years | 106 (3.6%) | 128 (5.2%) |
| 65 to 69 Years | 225 (7.6%) | 58 (2.4%) |
| 70 to 74 Years | 26 (0.9%) | 42 (1.7%) |
| 75 to 79 Years | 0 (0.0%) | 40 (1.6%) |
| 80 to 84 Years | 0 (0.0%) | 28 (1.1%) |
| 85 Years and over | 40 (1.3%) | 45 (1.8%) |
| Total | 2,974 (100.0%) | 2,468 (100.0%) |
Families and Households in Posen
Median Family Size in Posen
The median family size in Posen is 3.92 persons per family, with single male/father families (121 | 9.6%) accounting for the largest median family size of 4.13 persons per family. On the other hand, single female/mother families (252 | 20.0%) represent the smallest median family size with 3.53 persons per family.
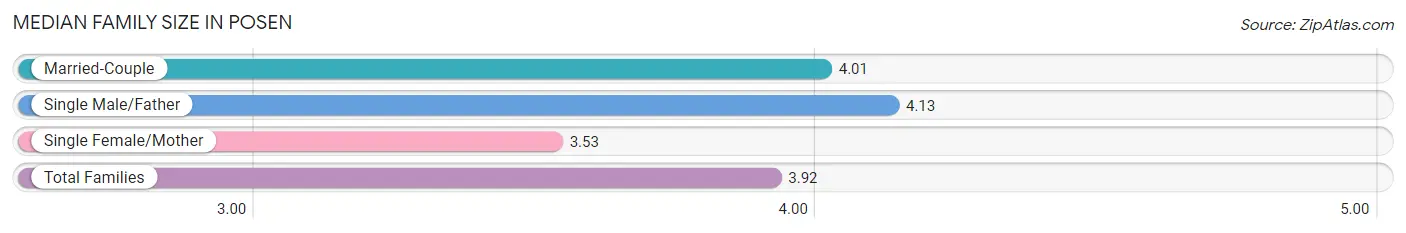
| Family Type | # Families | Family Size |
| Married-Couple | 886 (70.4%) | 4.01 |
| Single Male/Father | 121 (9.6%) | 4.13 |
| Single Female/Mother | 252 (20.0%) | 3.53 |
| Total Families | 1,259 (100.0%) | 3.92 |
Median Household Size in Posen
The median household size in Posen is 3.39 persons per household, with single male/father households (121 | 7.5%) accounting for the largest median household size of 4.26 persons per household. non-family households (348 | 21.7%) represent the smallest median household size with 1.17 persons per household.
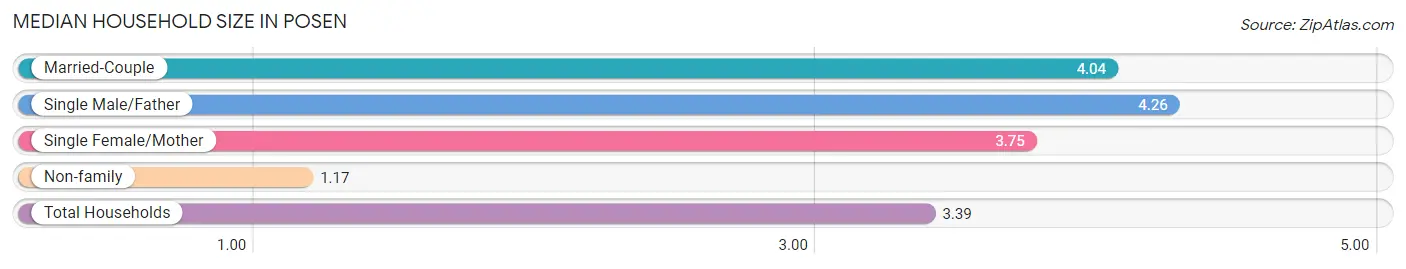
| Household Type | # Households | Household Size |
| Married-Couple | 886 (55.1%) | 4.04 |
| Single Male/Father | 121 (7.5%) | 4.26 |
| Single Female/Mother | 252 (15.7%) | 3.75 |
| Non-family | 348 (21.7%) | 1.17 |
| Total Households | 1,607 (100.0%) | 3.39 |
Household Size by Marriage Status in Posen
Out of a total of 1,607 households in Posen, 1,259 (78.3%) are family households, while 348 (21.7%) are nonfamily households. The most numerous type of family households are 2-person households, comprising 517, and the most common type of nonfamily households are 1-person households, comprising 320.
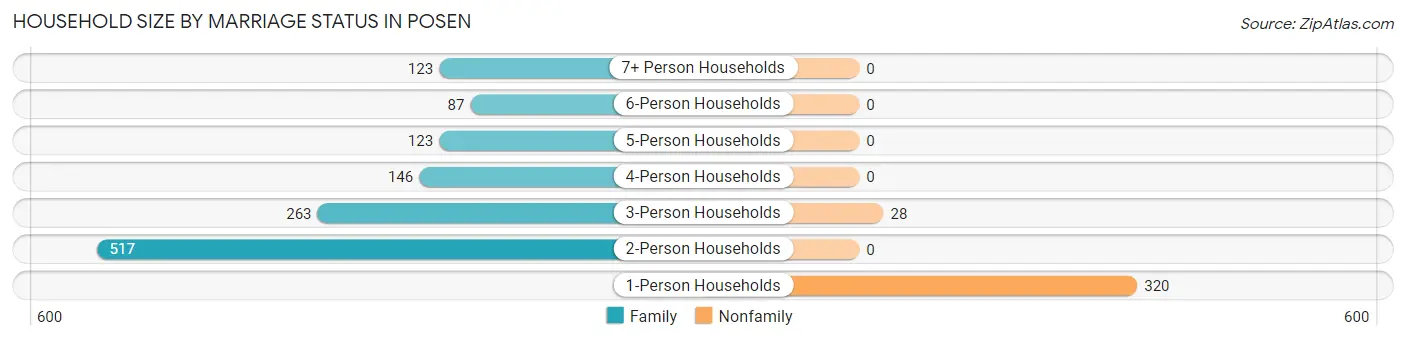
| Household Size | Family Households | Nonfamily Households |
| 1-Person Households | - | 320 (19.9%) |
| 2-Person Households | 517 (32.2%) | 0 (0.0%) |
| 3-Person Households | 263 (16.4%) | 28 (1.7%) |
| 4-Person Households | 146 (9.1%) | 0 (0.0%) |
| 5-Person Households | 123 (7.6%) | 0 (0.0%) |
| 6-Person Households | 87 (5.4%) | 0 (0.0%) |
| 7+ Person Households | 123 (7.6%) | 0 (0.0%) |
| Total | 1,259 (78.3%) | 348 (21.7%) |
Female Fertility in Posen
Fertility by Age in Posen
Average fertility rate in Posen is 50.0 births per 1,000 women. Women in the age bracket of 20 to 34 years have the highest fertility rate with 95.0 births per 1,000 women. Women in the age bracket of 20 to 34 years acount for 68.7% of all women with births.
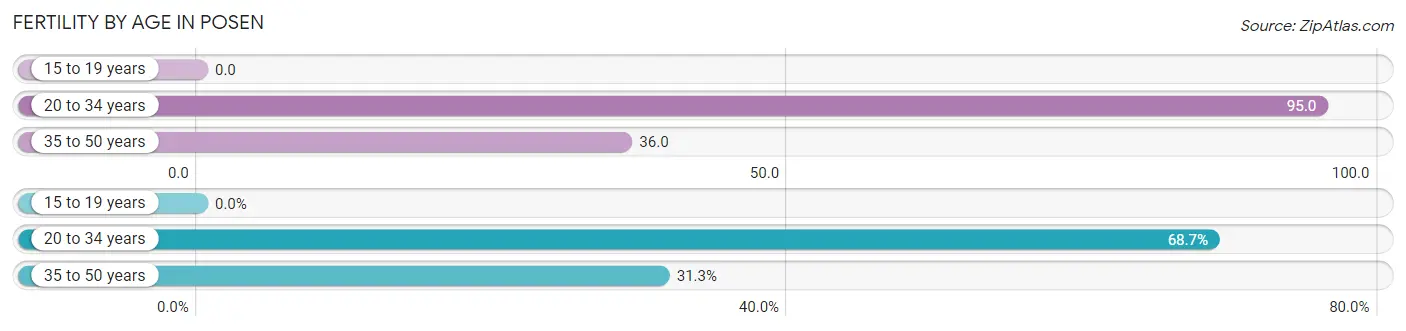
| Age Bracket | Women with Births | Births / 1,000 Women |
| 15 to 19 years | 0 (0.0%) | 0.0 |
| 20 to 34 years | 46 (68.7%) | 95.0 |
| 35 to 50 years | 21 (31.3%) | 36.0 |
| Total | 67 (100.0%) | 50.0 |
Fertility by Age by Marriage Status in Posen
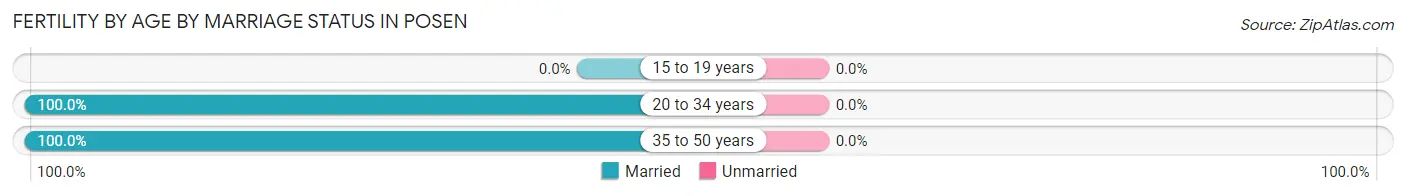
| Age Bracket | Married | Unmarried |
| 15 to 19 years | 0 (0.0%) | 0 (0.0%) |
| 20 to 34 years | 46 (100.0%) | 0 (0.0%) |
| 35 to 50 years | 21 (100.0%) | 0 (0.0%) |
| Total | 67 (100.0%) | 0 (0.0%) |
Fertility by Education in Posen
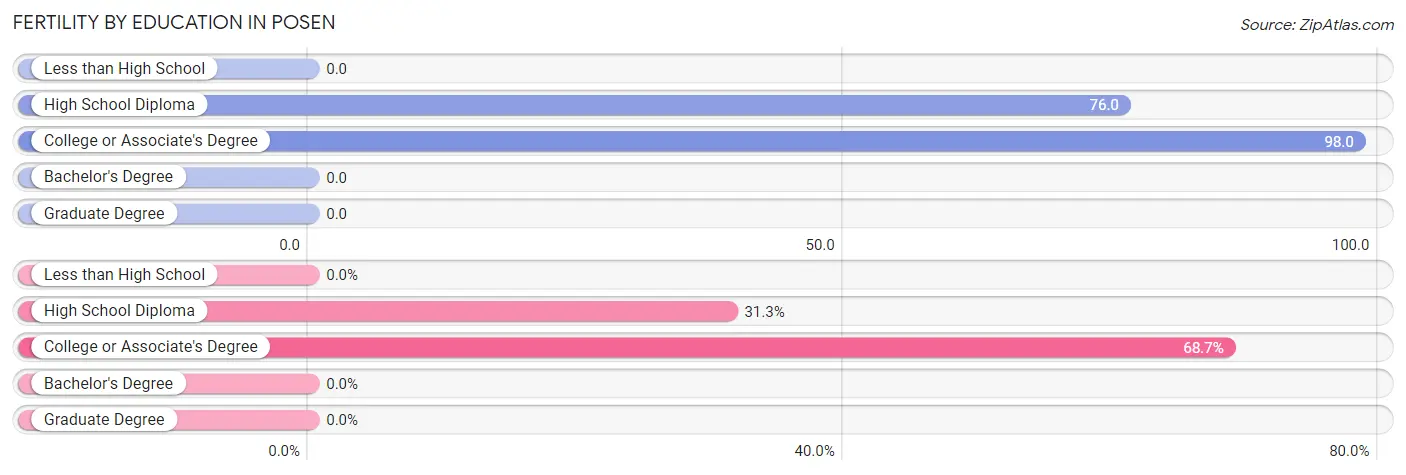
| Educational Attainment | Women with Births | Births / 1,000 Women |
| Less than High School | 0 (0.0%) | 0.0 |
| High School Diploma | 21 (31.3%) | 76.0 |
| College or Associate's Degree | 46 (68.7%) | 98.0 |
| Bachelor's Degree | 0 (0.0%) | 0.0 |
| Graduate Degree | 0 (0.0%) | 0.0 |
| Total | 67 (100.0%) | 50.0 |
Fertility by Education by Marriage Status in Posen
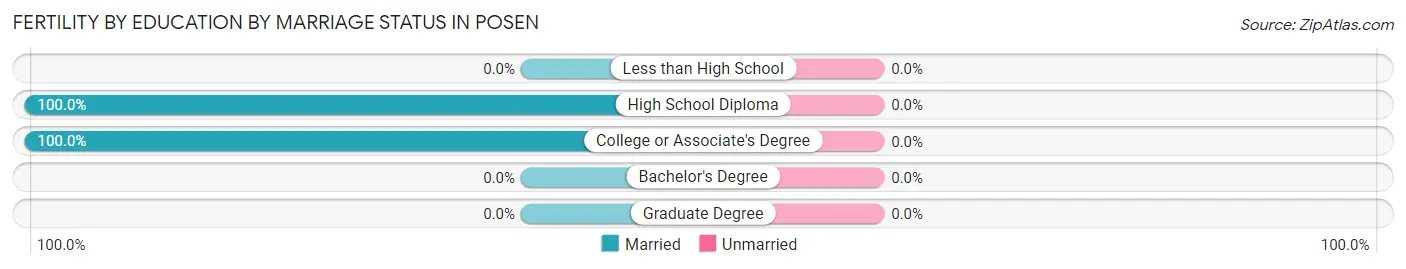
| Educational Attainment | Married | Unmarried |
| Less than High School | 0 (0.0%) | 0 (0.0%) |
| High School Diploma | 21 (100.0%) | 0 (0.0%) |
| College or Associate's Degree | 46 (100.0%) | 0 (0.0%) |
| Bachelor's Degree | 0 (0.0%) | 0 (0.0%) |
| Graduate Degree | 0 (0.0%) | 0 (0.0%) |
| Total | 67 (100.0%) | 0 (0.0%) |
Employment Characteristics in Posen
Employment by Class of Employer in Posen
Among the 2,653 employed individuals in Posen, private company employees (2,097 | 79.0%), not-for-profit organizations (276 | 10.4%), and self-employed (incorporated) (112 | 4.2%) make up the most common classes of employment.
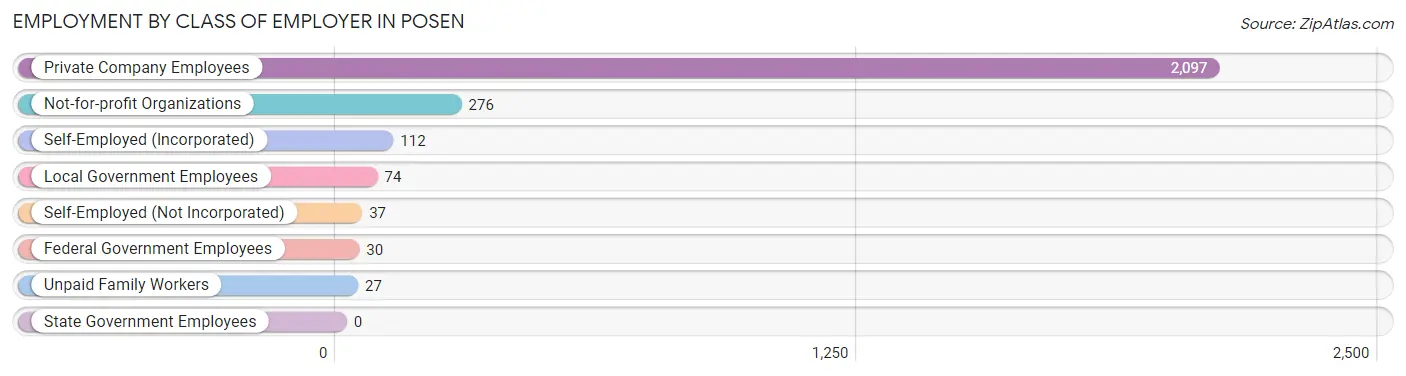
| Employer Class | # Employees | % Employees |
| Private Company Employees | 2,097 | 79.0% |
| Self-Employed (Incorporated) | 112 | 4.2% |
| Self-Employed (Not Incorporated) | 37 | 1.4% |
| Not-for-profit Organizations | 276 | 10.4% |
| Local Government Employees | 74 | 2.8% |
| State Government Employees | 0 | 0.0% |
| Federal Government Employees | 30 | 1.1% |
| Unpaid Family Workers | 27 | 1.0% |
| Total | 2,653 | 100.0% |
Employment Status by Age in Posen
According to the labor force statistics for Posen, out of the total population over 16 years of age (4,321), 68.4% or 2,956 individuals are in the labor force, with 8.2% or 242 of them unemployed. The age group with the highest labor force participation rate is 30 to 34 years, with 92.0% or 532 individuals in the labor force. Within the labor force, the 25 to 29 years age range has the highest percentage of unemployed individuals, with 33.8% or 45 of them being unemployed.
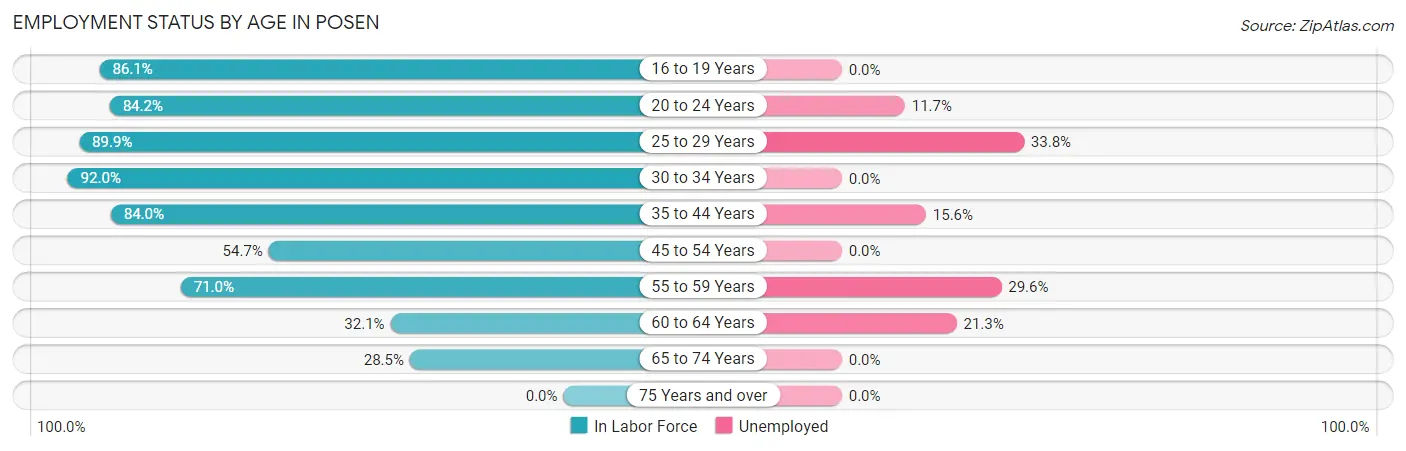
| Age Bracket | In Labor Force | Unemployed |
| 16 to 19 Years | 549 (86.1%) | 0 (0.0%) |
| 20 to 24 Years | 449 (84.2%) | 53 (11.7%) |
| 25 to 29 Years | 133 (89.9%) | 45 (33.8%) |
| 30 to 34 Years | 532 (92.0%) | 0 (0.0%) |
| 35 to 44 Years | 405 (84.0%) | 63 (15.6%) |
| 45 to 54 Years | 481 (54.7%) | 0 (0.0%) |
| 55 to 59 Years | 230 (71.0%) | 68 (29.6%) |
| 60 to 64 Years | 75 (32.1%) | 16 (21.3%) |
| 65 to 74 Years | 100 (28.5%) | 0 (0.0%) |
| 75 Years and over | 0 (0.0%) | 0 (0.0%) |
| Total | 2,956 (68.4%) | 242 (8.2%) |
Employment Status by Educational Attainment in Posen
According to labor force statistics for Posen, 70.1% of individuals (1,855) out of the total population between 25 and 64 years of age (2,646) are in the labor force, with 10.3% or 191 of them being unemployed. The group with the highest labor force participation rate are those with the educational attainment of bachelor's degree or higher, with 96.5% or 409 individuals in the labor force. Within the labor force, individuals with less than high school education have the highest percentage of unemployment, with 39.3% or 108 of them being unemployed.
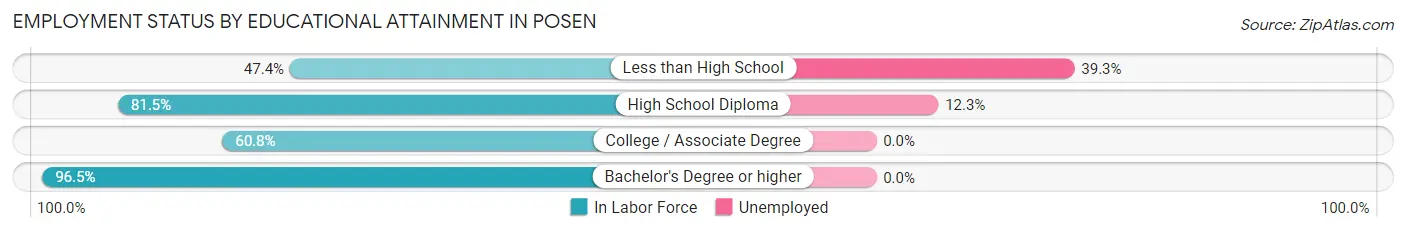
| Educational Attainment | In Labor Force | Unemployed |
| Less than High School | 275 (47.4%) | 228 (39.3%) |
| High School Diploma | 683 (81.5%) | 103 (12.3%) |
| College / Associate Degree | 489 (60.8%) | 0 (0.0%) |
| Bachelor's Degree or higher | 409 (96.5%) | 0 (0.0%) |
| Total | 1,855 (70.1%) | 273 (10.3%) |
Employment Occupations by Sex in Posen
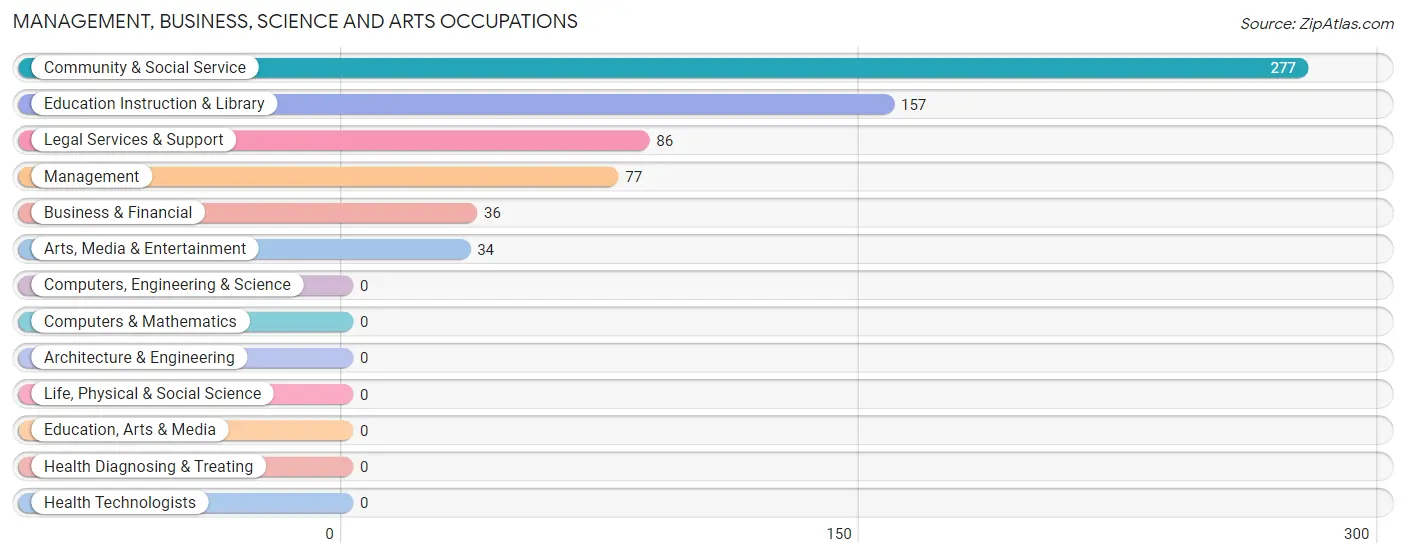
Management, Business, Science and Arts Occupations
The most common Management, Business, Science and Arts occupations in Posen are Community & Social Service (277 | 10.3%), Education Instruction & Library (157 | 5.9%), Legal Services & Support (86 | 3.2%), Management (77 | 2.9%), and Business & Financial (36 | 1.3%).
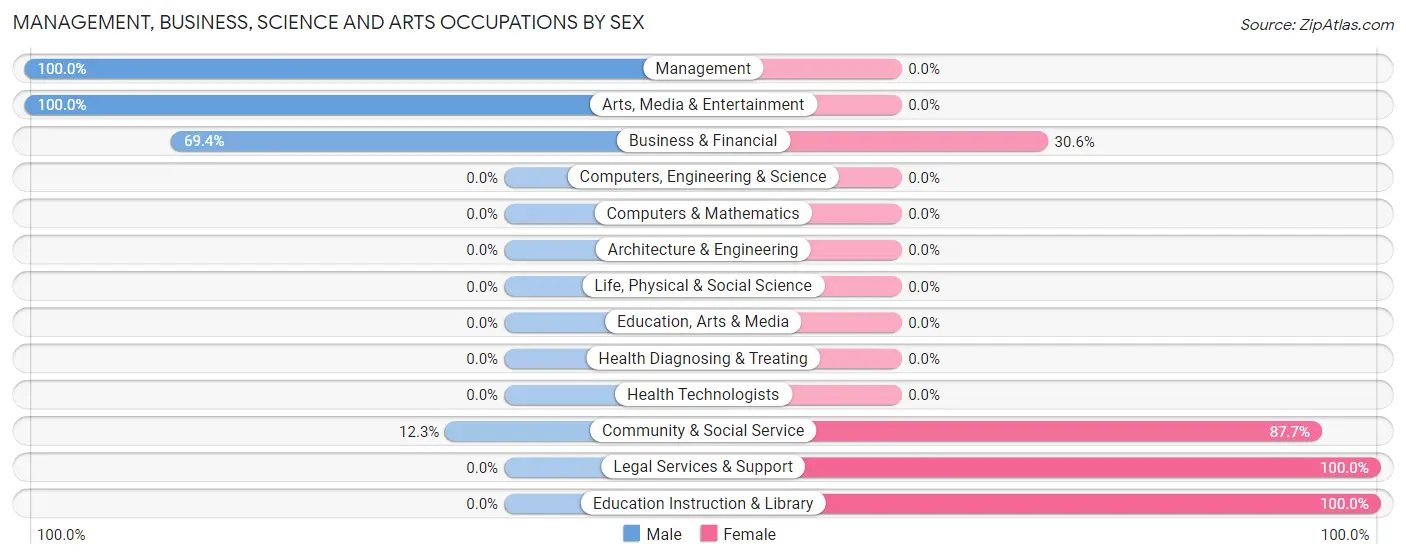
Management, Business, Science and Arts Occupations by Sex
Within the Management, Business, Science and Arts occupations in Posen, the most male-oriented occupations are Management (100.0%), Arts, Media & Entertainment (100.0%), and Business & Financial (69.4%), while the most female-oriented occupations are Legal Services & Support (100.0%), Education Instruction & Library (100.0%), and Community & Social Service (87.7%).
| Occupation | Male | Female |
| Management | 77 (100.0%) | 0 (0.0%) |
| Business & Financial | 25 (69.4%) | 11 (30.6%) |
| Computers, Engineering & Science | 0 (0.0%) | 0 (0.0%) |
| Computers & Mathematics | 0 (0.0%) | 0 (0.0%) |
| Architecture & Engineering | 0 (0.0%) | 0 (0.0%) |
| Life, Physical & Social Science | 0 (0.0%) | 0 (0.0%) |
| Community & Social Service | 34 (12.3%) | 243 (87.7%) |
| Education, Arts & Media | 0 (0.0%) | 0 (0.0%) |
| Legal Services & Support | 0 (0.0%) | 86 (100.0%) |
| Education Instruction & Library | 0 (0.0%) | 157 (100.0%) |
| Arts, Media & Entertainment | 34 (100.0%) | 0 (0.0%) |
| Health Diagnosing & Treating | 0 (0.0%) | 0 (0.0%) |
| Health Technologists | 0 (0.0%) | 0 (0.0%) |
| Total (Category) | 136 (34.9%) | 254 (65.1%) |
| Total (Overall) | 1,688 (62.9%) | 995 (37.1%) |
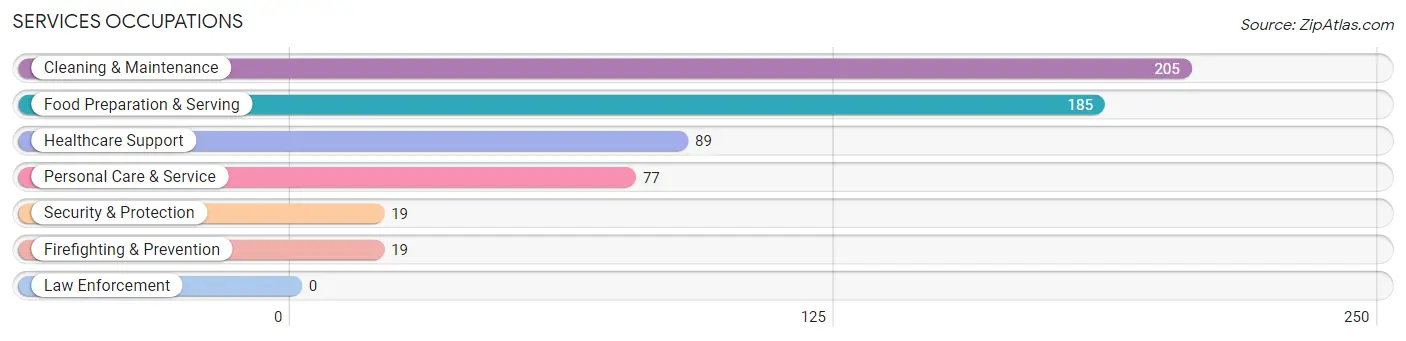
Services Occupations
The most common Services occupations in Posen are Cleaning & Maintenance (205 | 7.6%), Food Preparation & Serving (185 | 6.9%), Healthcare Support (89 | 3.3%), Personal Care & Service (77 | 2.9%), and Security & Protection (19 | 0.7%).
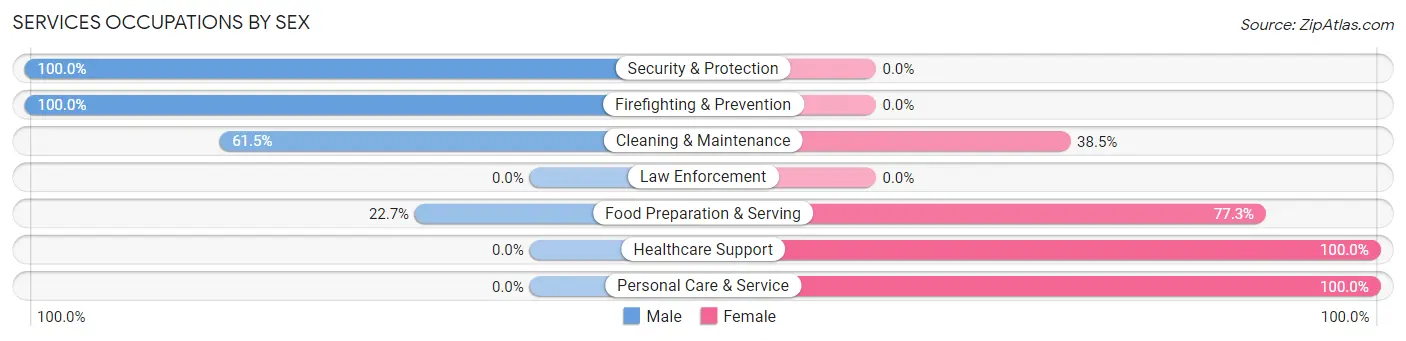
Services Occupations by Sex
Within the Services occupations in Posen, the most male-oriented occupations are Security & Protection (100.0%), Firefighting & Prevention (100.0%), and Cleaning & Maintenance (61.5%), while the most female-oriented occupations are Healthcare Support (100.0%), Personal Care & Service (100.0%), and Food Preparation & Serving (77.3%).
| Occupation | Male | Female |
| Healthcare Support | 0 (0.0%) | 89 (100.0%) |
| Security & Protection | 19 (100.0%) | 0 (0.0%) |
| Firefighting & Prevention | 19 (100.0%) | 0 (0.0%) |
| Law Enforcement | 0 (0.0%) | 0 (0.0%) |
| Food Preparation & Serving | 42 (22.7%) | 143 (77.3%) |
| Cleaning & Maintenance | 126 (61.5%) | 79 (38.5%) |
| Personal Care & Service | 0 (0.0%) | 77 (100.0%) |
| Total (Category) | 187 (32.5%) | 388 (67.5%) |
| Total (Overall) | 1,688 (62.9%) | 995 (37.1%) |
Sales and Office Occupations
The most common Sales and Office occupations in Posen are Office & Administration (241 | 9.0%), and Sales & Related (148 | 5.5%).
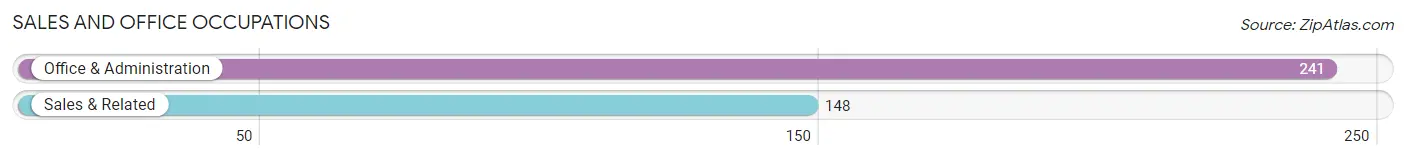
Sales and Office Occupations by Sex
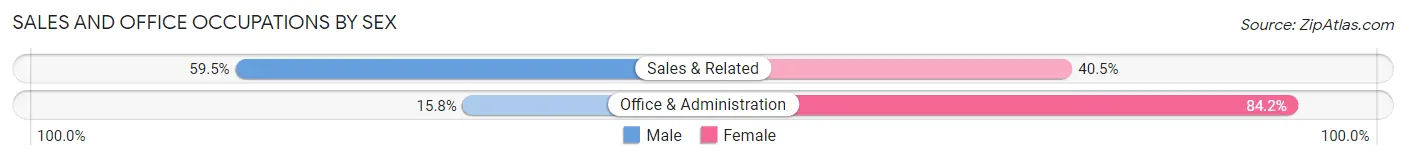
| Occupation | Male | Female |
| Sales & Related | 88 (59.5%) | 60 (40.5%) |
| Office & Administration | 38 (15.8%) | 203 (84.2%) |
| Total (Category) | 126 (32.4%) | 263 (67.6%) |
| Total (Overall) | 1,688 (62.9%) | 995 (37.1%) |
Natural Resources, Construction and Maintenance Occupations
The most common Natural Resources, Construction and Maintenance occupations in Posen are Installation, Maintenance & Repair (212 | 7.9%), Construction & Extraction (126 | 4.7%), and Farming, Fishing & Forestry (19 | 0.7%).
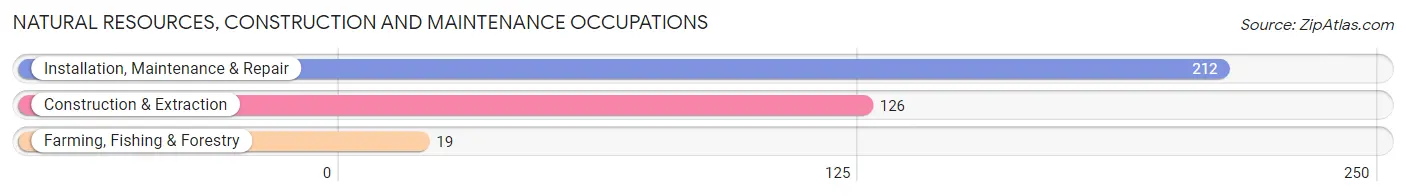
Natural Resources, Construction and Maintenance Occupations by Sex
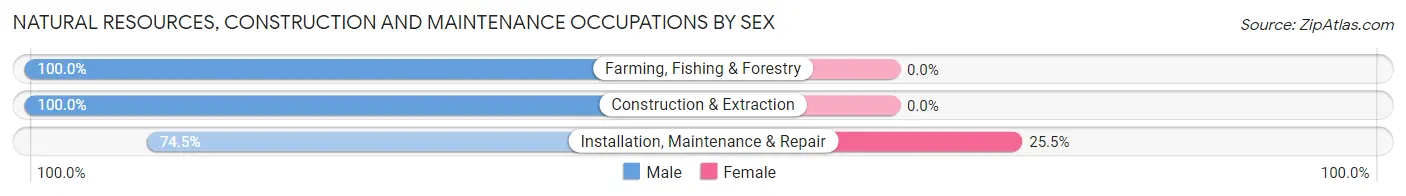
| Occupation | Male | Female |
| Farming, Fishing & Forestry | 19 (100.0%) | 0 (0.0%) |
| Construction & Extraction | 126 (100.0%) | 0 (0.0%) |
| Installation, Maintenance & Repair | 158 (74.5%) | 54 (25.5%) |
| Total (Category) | 303 (84.9%) | 54 (15.1%) |
| Total (Overall) | 1,688 (62.9%) | 995 (37.1%) |
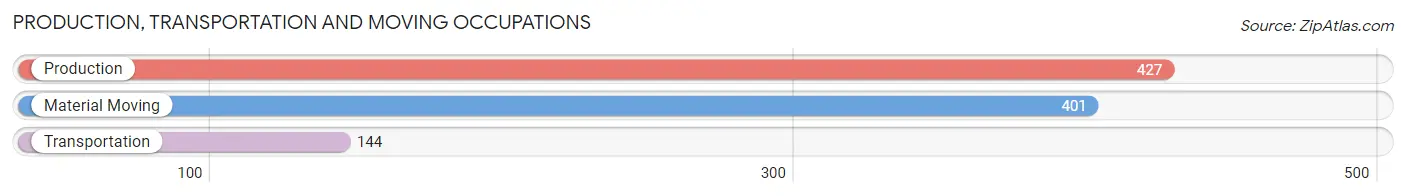
Production, Transportation and Moving Occupations
The most common Production, Transportation and Moving occupations in Posen are Production (427 | 15.9%), Material Moving (401 | 14.9%), and Transportation (144 | 5.4%).
Production, Transportation and Moving Occupations by Sex
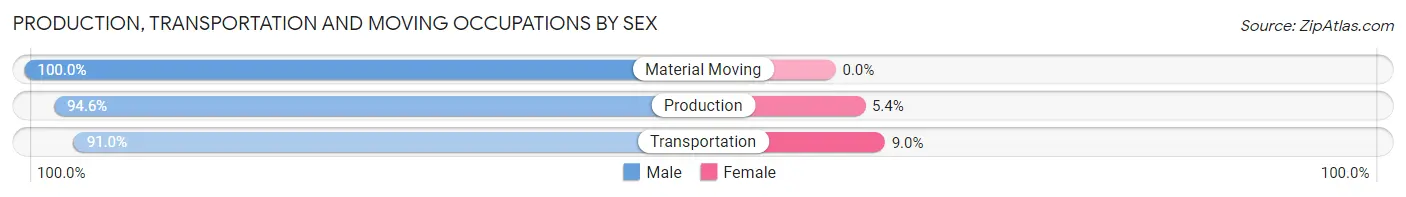
| Occupation | Male | Female |
| Production | 404 (94.6%) | 23 (5.4%) |
| Transportation | 131 (91.0%) | 13 (9.0%) |
| Material Moving | 401 (100.0%) | 0 (0.0%) |
| Total (Category) | 936 (96.3%) | 36 (3.7%) |
| Total (Overall) | 1,688 (62.9%) | 995 (37.1%) |
Employment Industries by Sex in Posen
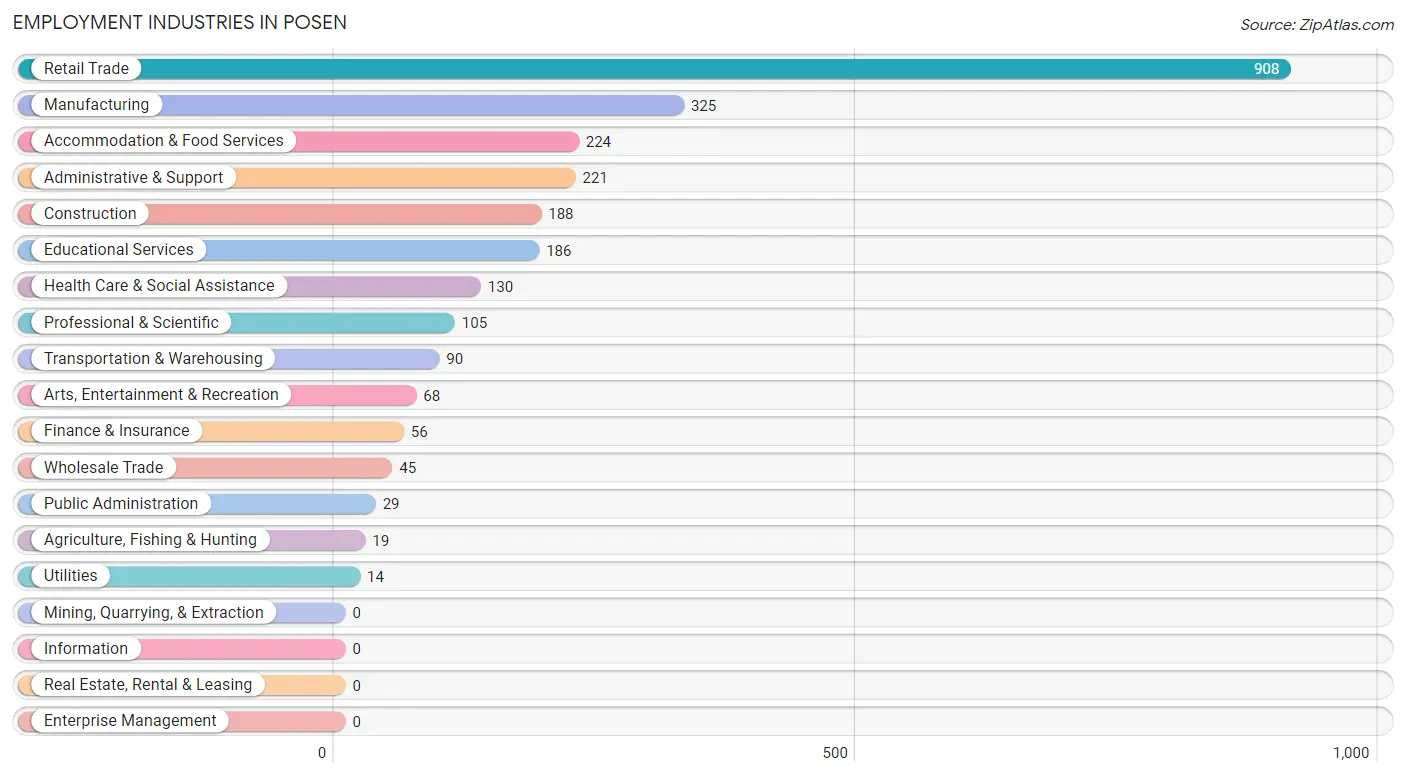
Employment Industries in Posen
The major employment industries in Posen include Retail Trade (908 | 33.8%), Manufacturing (325 | 12.1%), Accommodation & Food Services (224 | 8.4%), Administrative & Support (221 | 8.2%), and Construction (188 | 7.0%).
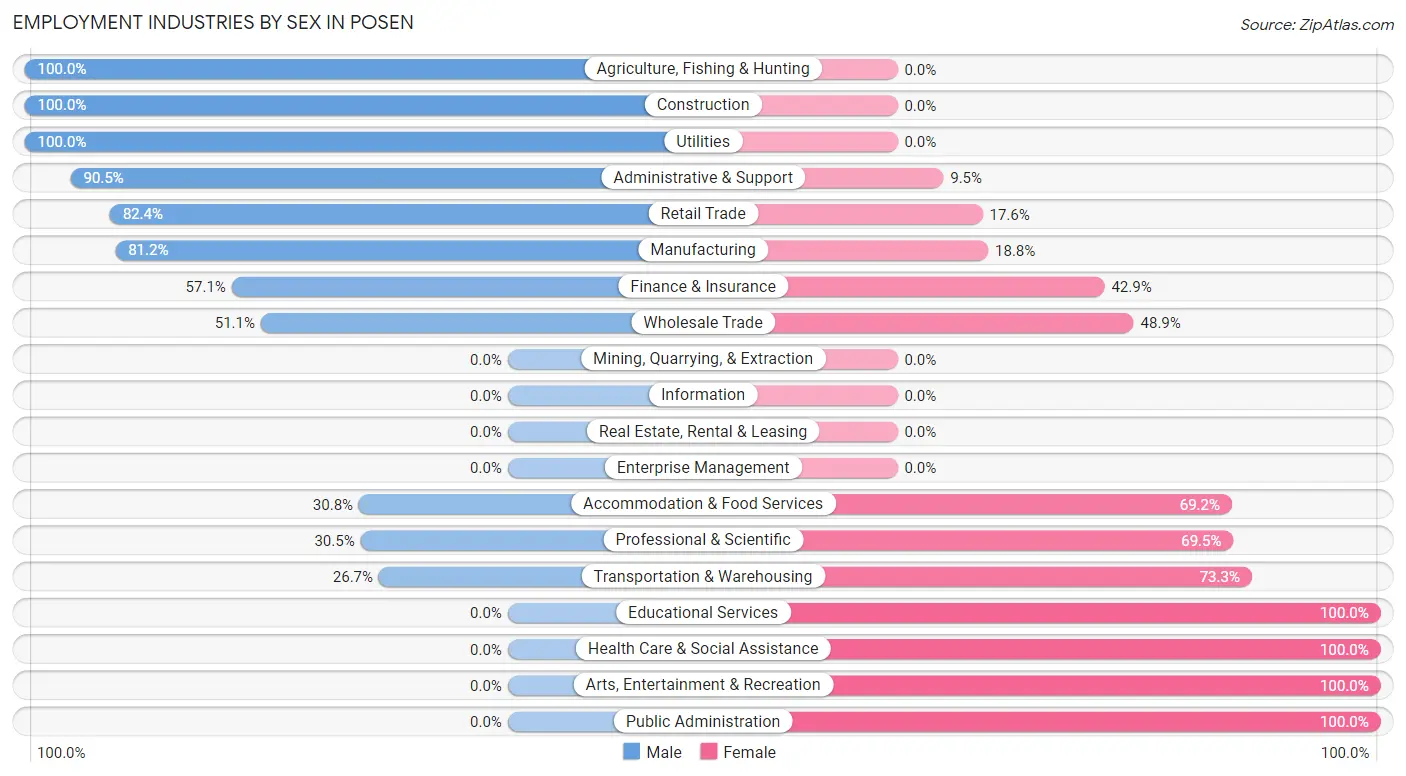
Employment Industries by Sex in Posen
The Posen industries that see more men than women are Agriculture, Fishing & Hunting (100.0%), Construction (100.0%), and Utilities (100.0%), whereas the industries that tend to have a higher number of women are Educational Services (100.0%), Health Care & Social Assistance (100.0%), and Arts, Entertainment & Recreation (100.0%).
| Industry | Male | Female |
| Agriculture, Fishing & Hunting | 19 (100.0%) | 0 (0.0%) |
| Mining, Quarrying, & Extraction | 0 (0.0%) | 0 (0.0%) |
| Construction | 188 (100.0%) | 0 (0.0%) |
| Manufacturing | 264 (81.2%) | 61 (18.8%) |
| Wholesale Trade | 23 (51.1%) | 22 (48.9%) |
| Retail Trade | 748 (82.4%) | 160 (17.6%) |
| Transportation & Warehousing | 24 (26.7%) | 66 (73.3%) |
| Utilities | 14 (100.0%) | 0 (0.0%) |
| Information | 0 (0.0%) | 0 (0.0%) |
| Finance & Insurance | 32 (57.1%) | 24 (42.9%) |
| Real Estate, Rental & Leasing | 0 (0.0%) | 0 (0.0%) |
| Professional & Scientific | 32 (30.5%) | 73 (69.5%) |
| Enterprise Management | 0 (0.0%) | 0 (0.0%) |
| Administrative & Support | 200 (90.5%) | 21 (9.5%) |
| Educational Services | 0 (0.0%) | 186 (100.0%) |
| Health Care & Social Assistance | 0 (0.0%) | 130 (100.0%) |
| Arts, Entertainment & Recreation | 0 (0.0%) | 68 (100.0%) |
| Accommodation & Food Services | 69 (30.8%) | 155 (69.2%) |
| Public Administration | 0 (0.0%) | 29 (100.0%) |
| Total | 1,688 (62.9%) | 995 (37.1%) |
Education in Posen
School Enrollment in Posen
The most common levels of schooling among the 1,461 students in Posen are high school (635 | 43.5%), elementary school (284 | 19.4%), and college / undergraduate (211 | 14.4%).
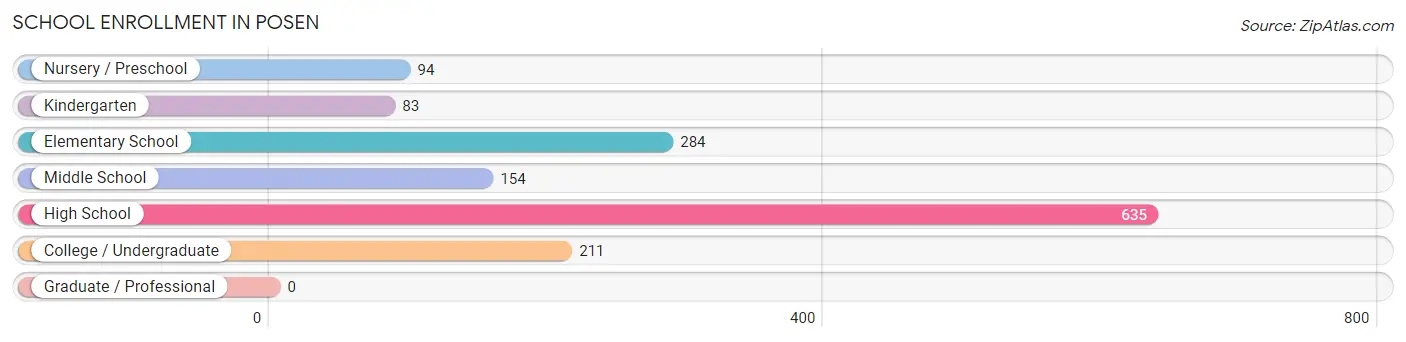
| School Level | # Students | % Students |
| Nursery / Preschool | 94 | 6.4% |
| Kindergarten | 83 | 5.7% |
| Elementary School | 284 | 19.4% |
| Middle School | 154 | 10.5% |
| High School | 635 | 43.5% |
| College / Undergraduate | 211 | 14.4% |
| Graduate / Professional | 0 | 0.0% |
| Total | 1,461 | 100.0% |
School Enrollment by Age by Funding Source in Posen
Out of a total of 1,461 students who are enrolled in schools in Posen, 156 (10.7%) attend a private institution, while the remaining 1,305 (89.3%) are enrolled in public schools. The age group of 3 to 4 year olds has the highest likelihood of being enrolled in private schools, with 21 (100.0% in the age bracket) enrolled. Conversely, the age group of 15 to 17 year olds has the lowest likelihood of being enrolled in a private school, with 261 (100.0% in the age bracket) attending a public institution.
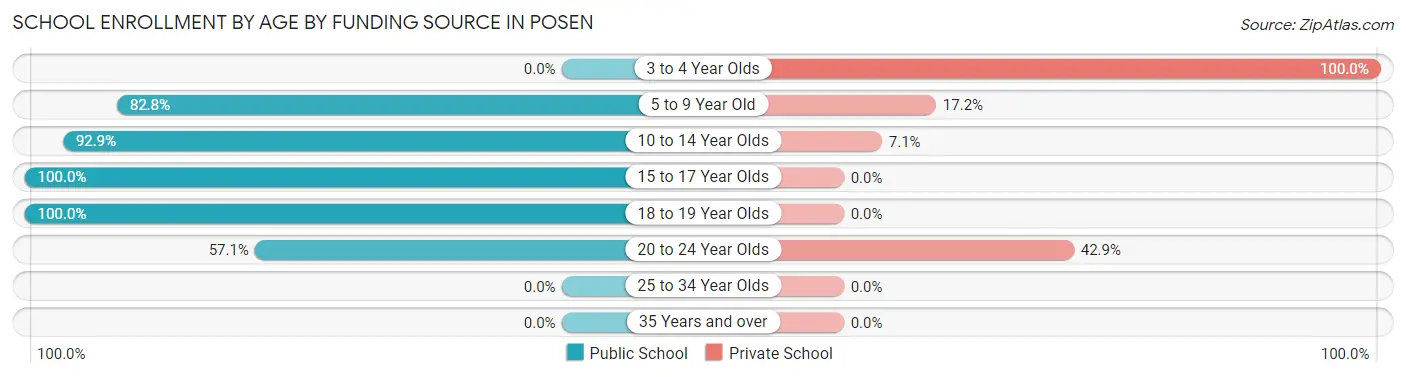
| Age Bracket | Public School | Private School |
| 3 to 4 Year Olds | 0 (0.0%) | 21 (100.0%) |
| 5 to 9 Year Old | 352 (82.8%) | 73 (17.2%) |
| 10 to 14 Year Olds | 222 (92.9%) | 17 (7.1%) |
| 15 to 17 Year Olds | 261 (100.0%) | 0 (0.0%) |
| 18 to 19 Year Olds | 410 (100.0%) | 0 (0.0%) |
| 20 to 24 Year Olds | 60 (57.1%) | 45 (42.9%) |
| 25 to 34 Year Olds | 0 (0.0%) | 0 (0.0%) |
| 35 Years and over | 0 (0.0%) | 0 (0.0%) |
| Total | 1,305 (89.3%) | 156 (10.7%) |
Educational Attainment by Field of Study in Posen
Arts & humanities (145 | 27.7%), business (103 | 19.7%), education (65 | 12.4%), science & technology (59 | 11.3%), and engineering (41 | 7.8%) are the most common fields of study among 524 individuals in Posen who have obtained a bachelor's degree or higher.
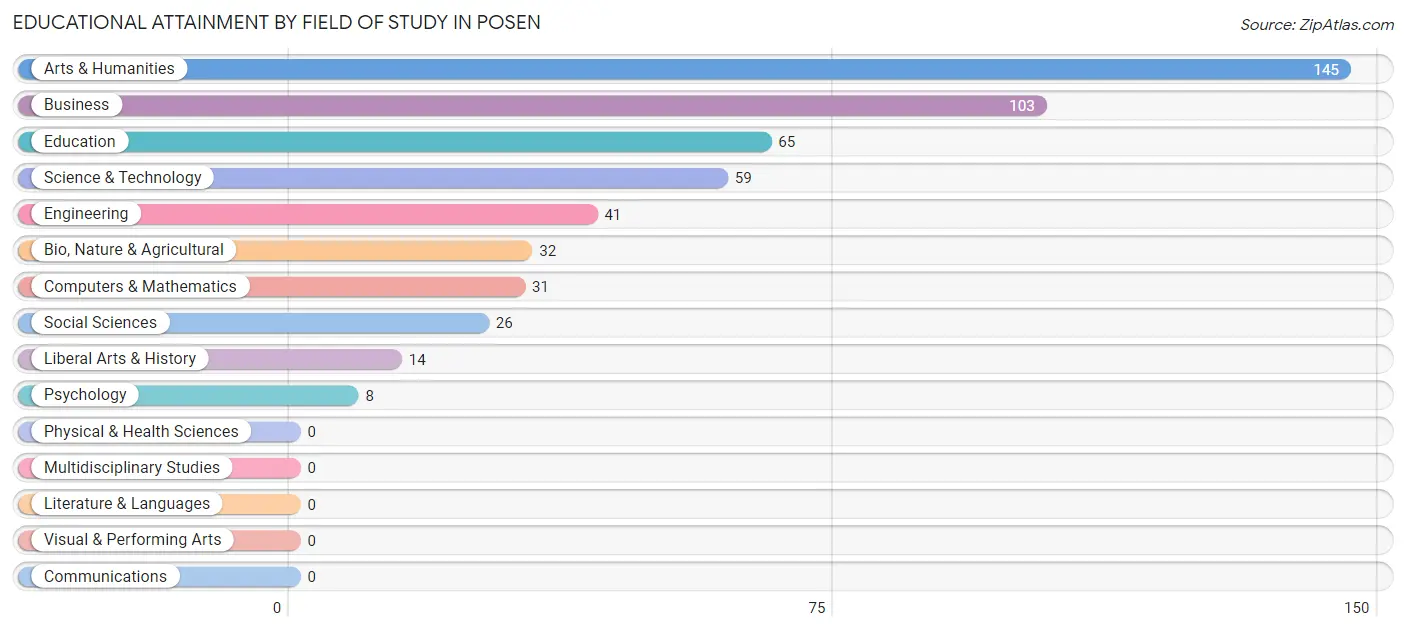
| Field of Study | # Graduates | % Graduates |
| Computers & Mathematics | 31 | 5.9% |
| Bio, Nature & Agricultural | 32 | 6.1% |
| Physical & Health Sciences | 0 | 0.0% |
| Psychology | 8 | 1.5% |
| Social Sciences | 26 | 5.0% |
| Engineering | 41 | 7.8% |
| Multidisciplinary Studies | 0 | 0.0% |
| Science & Technology | 59 | 11.3% |
| Business | 103 | 19.7% |
| Education | 65 | 12.4% |
| Literature & Languages | 0 | 0.0% |
| Liberal Arts & History | 14 | 2.7% |
| Visual & Performing Arts | 0 | 0.0% |
| Communications | 0 | 0.0% |
| Arts & Humanities | 145 | 27.7% |
| Total | 524 | 100.0% |
Transportation & Commute in Posen
Vehicle Availability by Sex in Posen
The most prevalent vehicle ownership categories in Posen are males with 3 vehicles (960, accounting for 56.3%) and females with 3 vehicles (571, making up 101.2%).
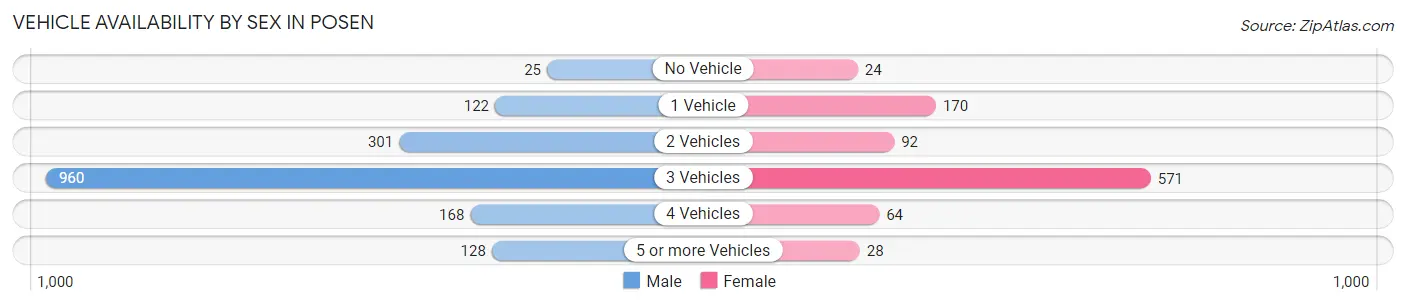
| Vehicles Available | Male | Female |
| No Vehicle | 25 (1.5%) | 24 (2.5%) |
| 1 Vehicle | 122 (7.2%) | 170 (17.9%) |
| 2 Vehicles | 301 (17.7%) | 92 (9.7%) |
| 3 Vehicles | 960 (56.3%) | 571 (60.2%) |
| 4 Vehicles | 168 (9.9%) | 64 (6.7%) |
| 5 or more Vehicles | 128 (7.5%) | 28 (2.9%) |
| Total | 1,704 (100.0%) | 949 (100.0%) |
Commute Time in Posen
The most frequently occuring commute durations in Posen are 15 to 19 minutes (807 commuters, 30.7%), 30 to 34 minutes (562 commuters, 21.4%), and 10 to 14 minutes (229 commuters, 8.7%).
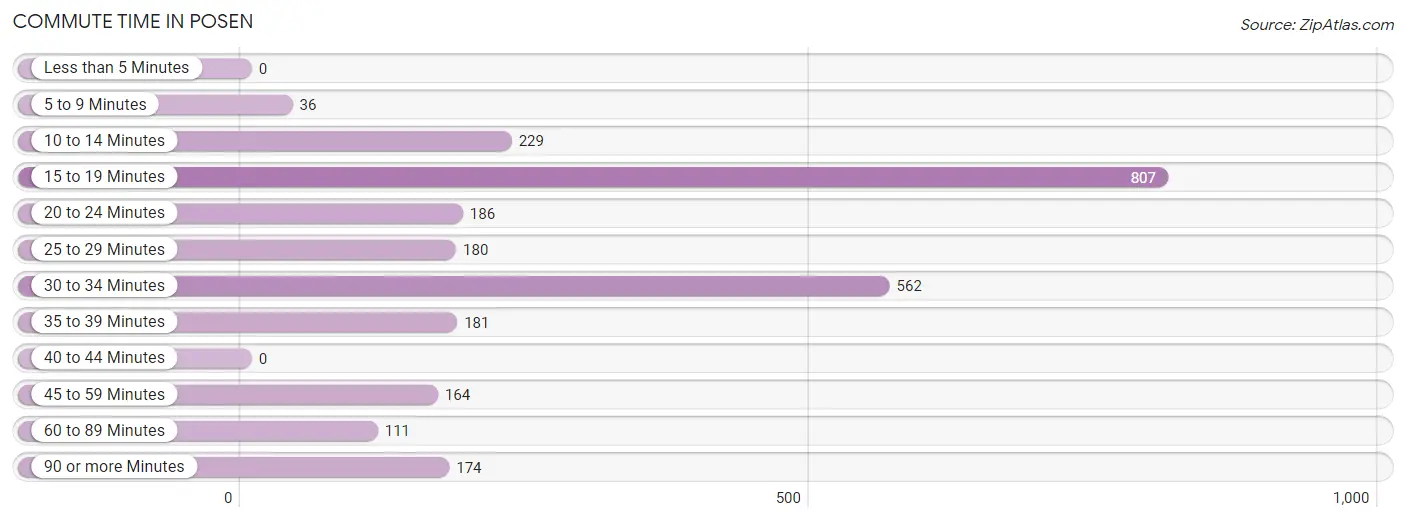
| Commute Time | # Commuters | % Commuters |
| Less than 5 Minutes | 0 | 0.0% |
| 5 to 9 Minutes | 36 | 1.4% |
| 10 to 14 Minutes | 229 | 8.7% |
| 15 to 19 Minutes | 807 | 30.7% |
| 20 to 24 Minutes | 186 | 7.1% |
| 25 to 29 Minutes | 180 | 6.8% |
| 30 to 34 Minutes | 562 | 21.4% |
| 35 to 39 Minutes | 181 | 6.9% |
| 40 to 44 Minutes | 0 | 0.0% |
| 45 to 59 Minutes | 164 | 6.2% |
| 60 to 89 Minutes | 111 | 4.2% |
| 90 or more Minutes | 174 | 6.6% |
Commute Time by Sex in Posen
The most common commute times in Posen are 15 to 19 minutes (669 commuters, 39.3%) for males and 30 to 34 minutes (274 commuters, 29.6%) for females.
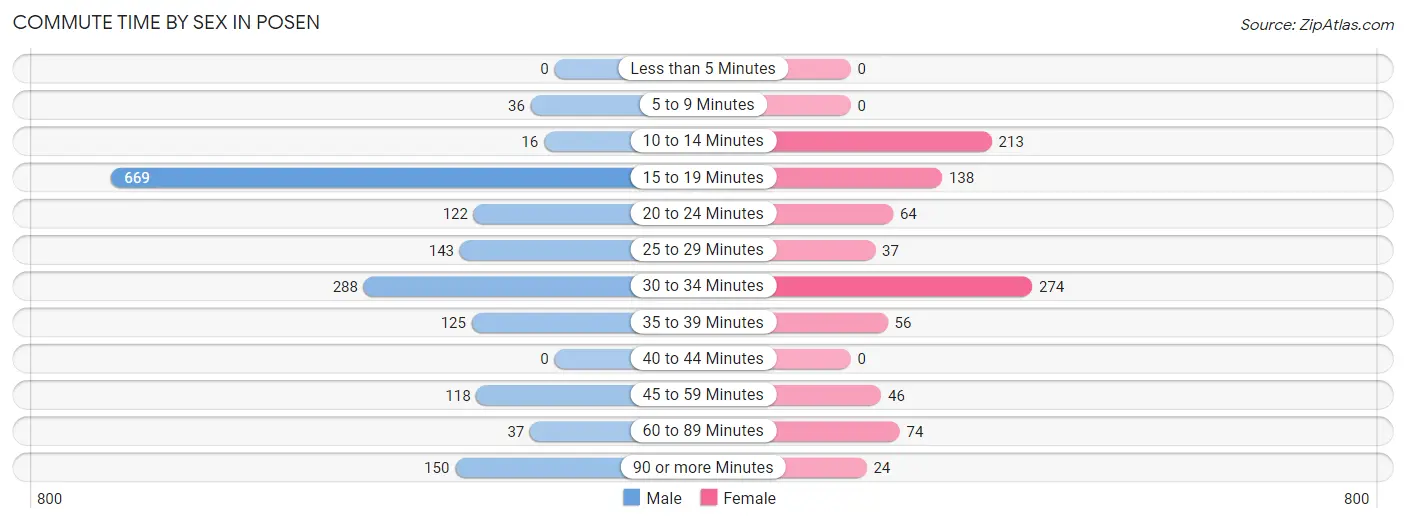
| Commute Time | Male | Female |
| Less than 5 Minutes | 0 (0.0%) | 0 (0.0%) |
| 5 to 9 Minutes | 36 (2.1%) | 0 (0.0%) |
| 10 to 14 Minutes | 16 (0.9%) | 213 (23.0%) |
| 15 to 19 Minutes | 669 (39.3%) | 138 (14.9%) |
| 20 to 24 Minutes | 122 (7.2%) | 64 (6.9%) |
| 25 to 29 Minutes | 143 (8.4%) | 37 (4.0%) |
| 30 to 34 Minutes | 288 (16.9%) | 274 (29.6%) |
| 35 to 39 Minutes | 125 (7.3%) | 56 (6.0%) |
| 40 to 44 Minutes | 0 (0.0%) | 0 (0.0%) |
| 45 to 59 Minutes | 118 (6.9%) | 46 (5.0%) |
| 60 to 89 Minutes | 37 (2.2%) | 74 (8.0%) |
| 90 or more Minutes | 150 (8.8%) | 24 (2.6%) |
Time of Departure to Work by Sex in Posen
The most frequent times of departure to work in Posen are 6:00 AM to 6:29 AM (450, 26.4%) for males and 6:30 AM to 6:59 AM (210, 22.7%) for females.
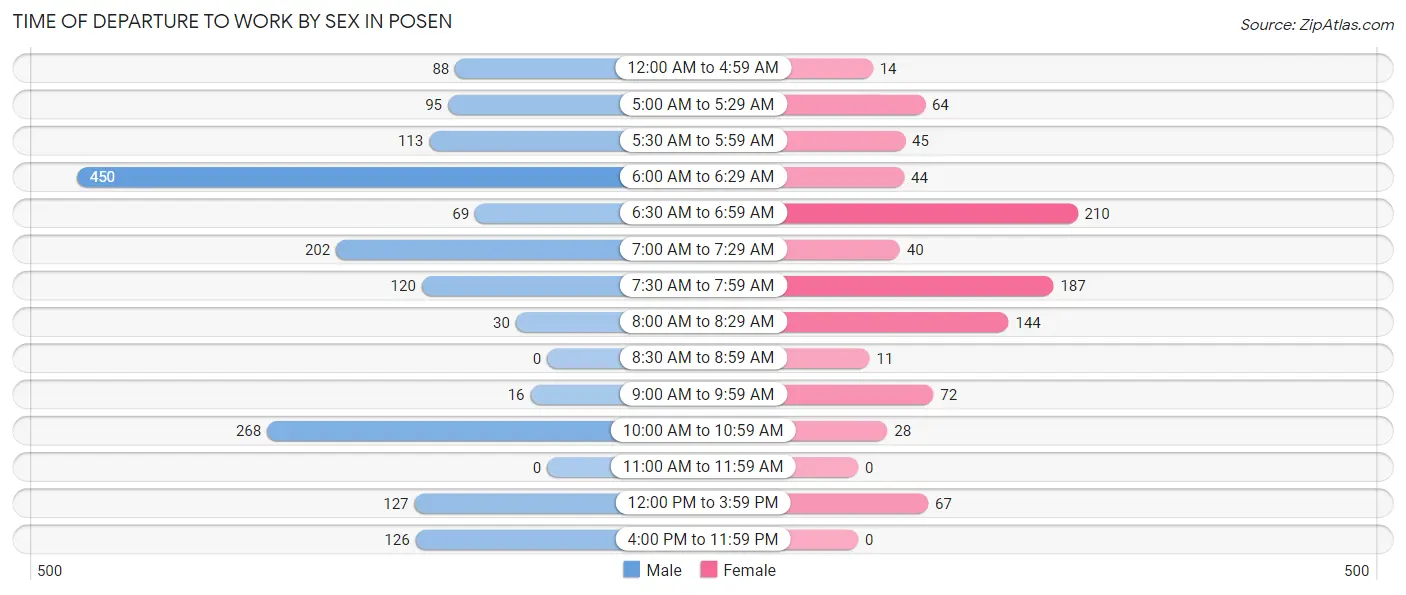
| Time of Departure | Male | Female |
| 12:00 AM to 4:59 AM | 88 (5.2%) | 14 (1.5%) |
| 5:00 AM to 5:29 AM | 95 (5.6%) | 64 (6.9%) |
| 5:30 AM to 5:59 AM | 113 (6.6%) | 45 (4.9%) |
| 6:00 AM to 6:29 AM | 450 (26.4%) | 44 (4.8%) |
| 6:30 AM to 6:59 AM | 69 (4.1%) | 210 (22.7%) |
| 7:00 AM to 7:29 AM | 202 (11.8%) | 40 (4.3%) |
| 7:30 AM to 7:59 AM | 120 (7.0%) | 187 (20.2%) |
| 8:00 AM to 8:29 AM | 30 (1.8%) | 144 (15.5%) |
| 8:30 AM to 8:59 AM | 0 (0.0%) | 11 (1.2%) |
| 9:00 AM to 9:59 AM | 16 (0.9%) | 72 (7.8%) |
| 10:00 AM to 10:59 AM | 268 (15.7%) | 28 (3.0%) |
| 11:00 AM to 11:59 AM | 0 (0.0%) | 0 (0.0%) |
| 12:00 PM to 3:59 PM | 127 (7.4%) | 67 (7.2%) |
| 4:00 PM to 11:59 PM | 126 (7.4%) | 0 (0.0%) |
| Total | 1,704 (100.0%) | 926 (100.0%) |
Housing Occupancy in Posen
Occupancy by Ownership in Posen
Of the total 1,607 dwellings in Posen, owner-occupied units account for 1,301 (81.0%), while renter-occupied units make up 306 (19.0%).
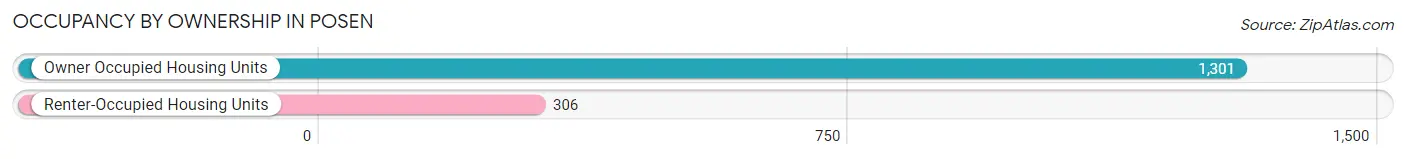
| Occupancy | # Housing Units | % Housing Units |
| Owner Occupied Housing Units | 1,301 | 81.0% |
| Renter-Occupied Housing Units | 306 | 19.0% |
| Total Occupied Housing Units | 1,607 | 100.0% |
Occupancy by Household Size in Posen
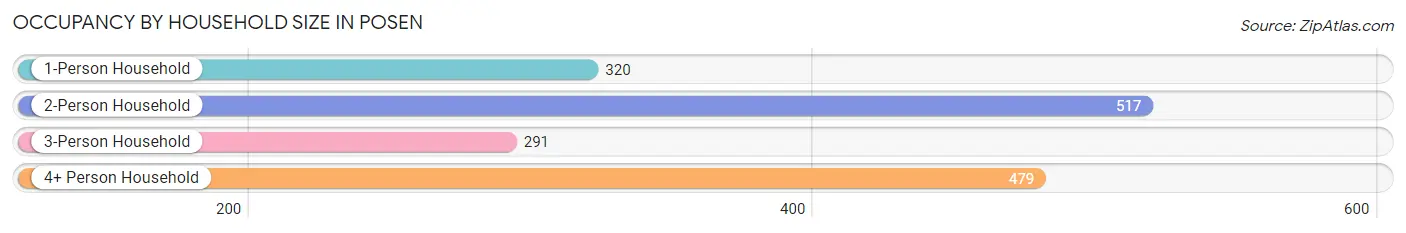
| Household Size | # Housing Units | % Housing Units |
| 1-Person Household | 320 | 19.9% |
| 2-Person Household | 517 | 32.2% |
| 3-Person Household | 291 | 18.1% |
| 4+ Person Household | 479 | 29.8% |
| Total Housing Units | 1,607 | 100.0% |
Occupancy by Ownership by Household Size in Posen
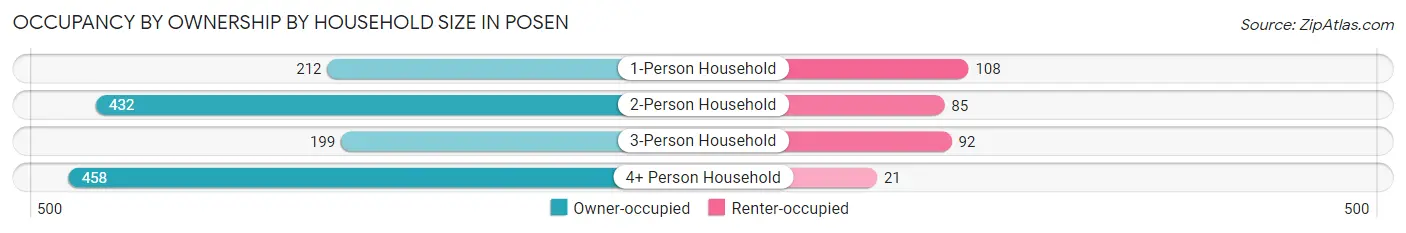
| Household Size | Owner-occupied | Renter-occupied |
| 1-Person Household | 212 (66.2%) | 108 (33.8%) |
| 2-Person Household | 432 (83.6%) | 85 (16.4%) |
| 3-Person Household | 199 (68.4%) | 92 (31.6%) |
| 4+ Person Household | 458 (95.6%) | 21 (4.4%) |
| Total Housing Units | 1,301 (81.0%) | 306 (19.0%) |
Occupancy by Educational Attainment in Posen
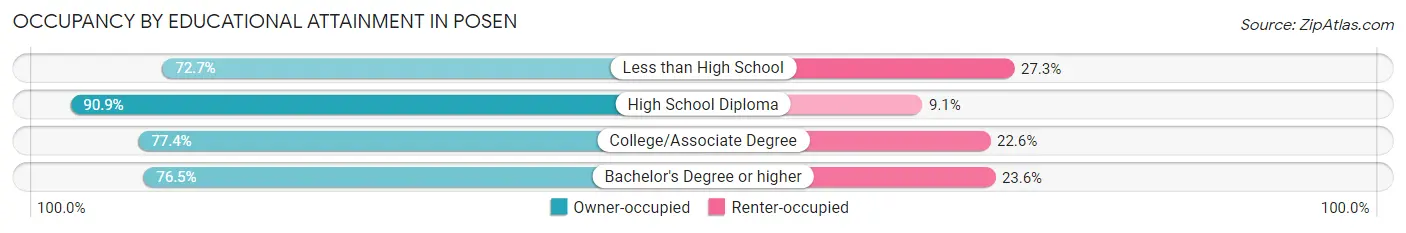
| Household Size | Owner-occupied | Renter-occupied |
| Less than High School | 250 (72.7%) | 94 (27.3%) |
| High School Diploma | 510 (90.9%) | 51 (9.1%) |
| College/Associate Degree | 343 (77.4%) | 100 (22.6%) |
| Bachelor's Degree or higher | 198 (76.4%) | 61 (23.5%) |
Occupancy by Age of Householder in Posen
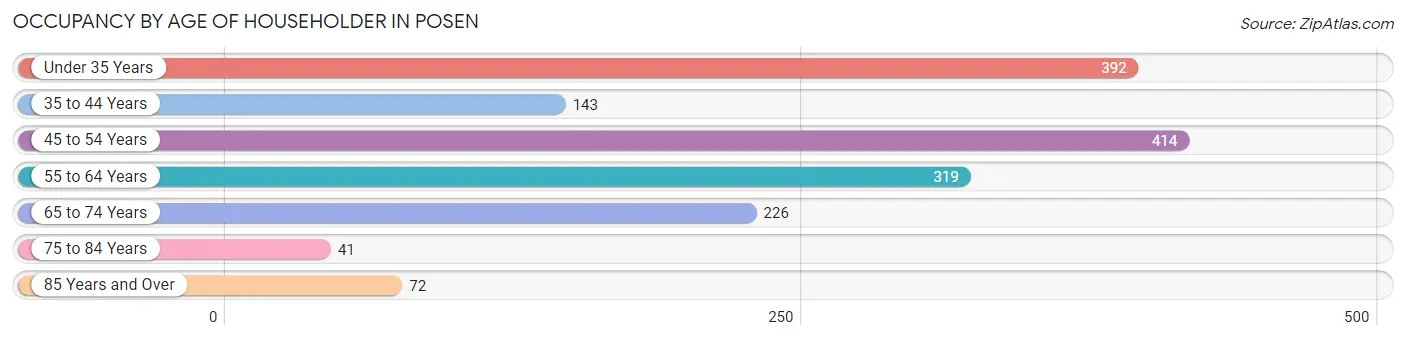
| Age Bracket | # Households | % Households |
| Under 35 Years | 392 | 24.4% |
| 35 to 44 Years | 143 | 8.9% |
| 45 to 54 Years | 414 | 25.8% |
| 55 to 64 Years | 319 | 19.9% |
| 65 to 74 Years | 226 | 14.1% |
| 75 to 84 Years | 41 | 2.5% |
| 85 Years and Over | 72 | 4.5% |
| Total | 1,607 | 100.0% |
Housing Finances in Posen
Median Income by Occupancy in Posen
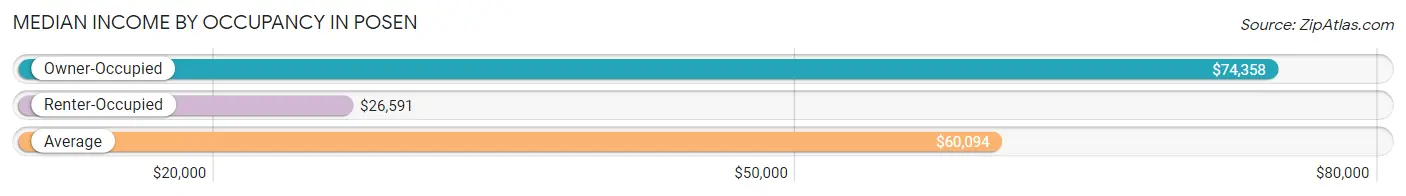
| Occupancy Type | # Households | Median Income |
| Owner-Occupied | 1,301 (81.0%) | $74,358 |
| Renter-Occupied | 306 (19.0%) | $26,591 |
| Average | 1,607 (100.0%) | $60,094 |
Occupancy by Householder Income Bracket in Posen
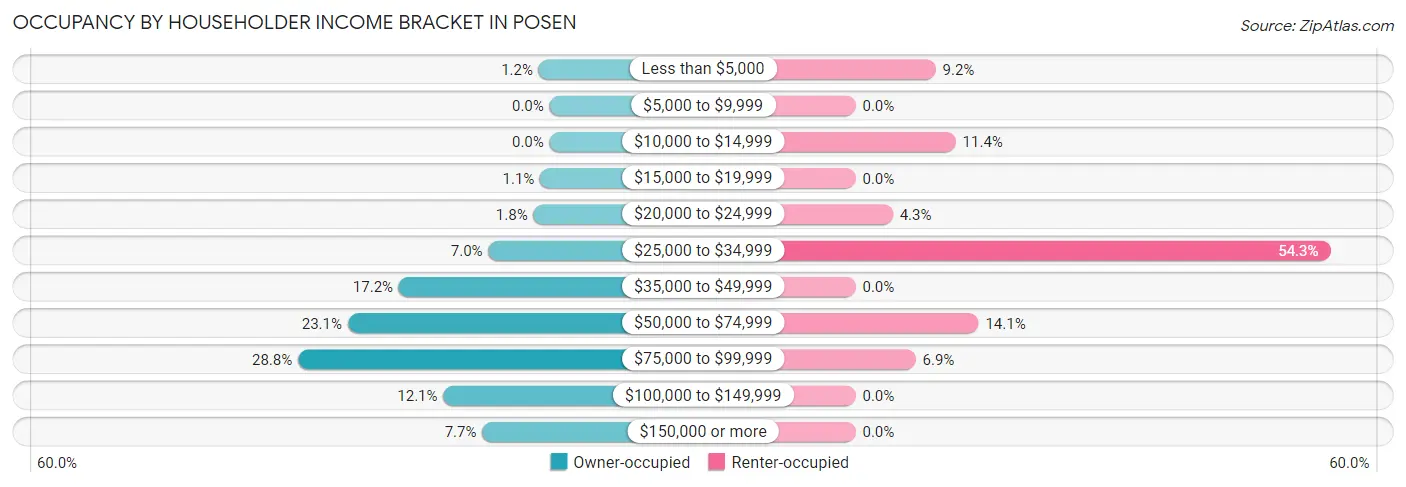
| Income Bracket | Owner-occupied | Renter-occupied |
| Less than $5,000 | 16 (1.2%) | 28 (9.1%) |
| $5,000 to $9,999 | 0 (0.0%) | 0 (0.0%) |
| $10,000 to $14,999 | 0 (0.0%) | 35 (11.4%) |
| $15,000 to $19,999 | 14 (1.1%) | 0 (0.0%) |
| $20,000 to $24,999 | 24 (1.8%) | 13 (4.3%) |
| $25,000 to $34,999 | 91 (7.0%) | 166 (54.2%) |
| $35,000 to $49,999 | 224 (17.2%) | 0 (0.0%) |
| $50,000 to $74,999 | 300 (23.1%) | 43 (14.1%) |
| $75,000 to $99,999 | 374 (28.7%) | 21 (6.9%) |
| $100,000 to $149,999 | 158 (12.1%) | 0 (0.0%) |
| $150,000 or more | 100 (7.7%) | 0 (0.0%) |
| Total | 1,301 (100.0%) | 306 (100.0%) |
Monthly Housing Cost Tiers in Posen
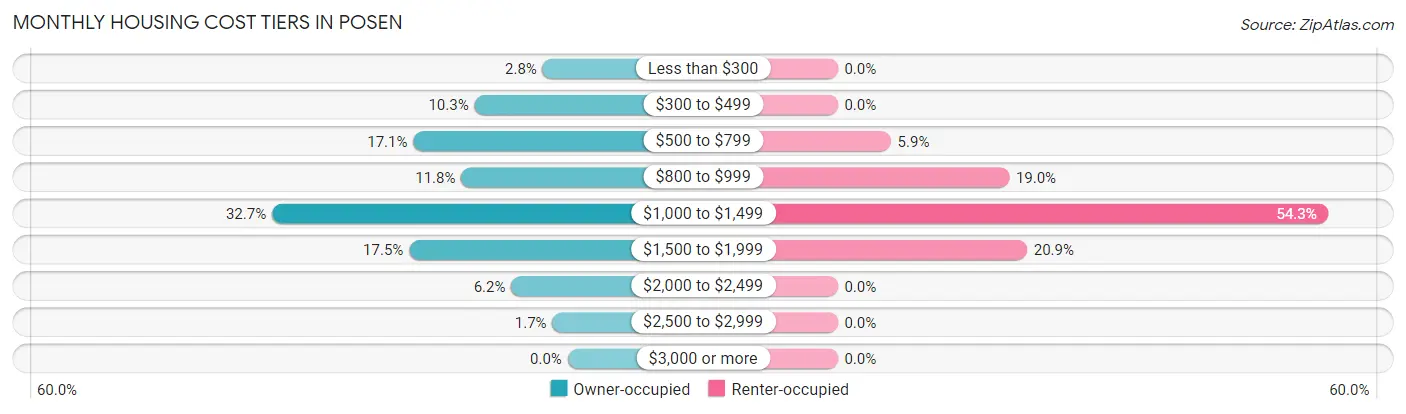
| Monthly Cost | Owner-occupied | Renter-occupied |
| Less than $300 | 36 (2.8%) | 0 (0.0%) |
| $300 to $499 | 134 (10.3%) | 0 (0.0%) |
| $500 to $799 | 222 (17.1%) | 18 (5.9%) |
| $800 to $999 | 153 (11.8%) | 58 (19.0%) |
| $1,000 to $1,499 | 425 (32.7%) | 166 (54.2%) |
| $1,500 to $1,999 | 228 (17.5%) | 64 (20.9%) |
| $2,000 to $2,499 | 81 (6.2%) | 0 (0.0%) |
| $2,500 to $2,999 | 22 (1.7%) | 0 (0.0%) |
| $3,000 or more | 0 (0.0%) | 0 (0.0%) |
| Total | 1,301 (100.0%) | 306 (100.0%) |
Physical Housing Characteristics in Posen
Housing Structures in Posen
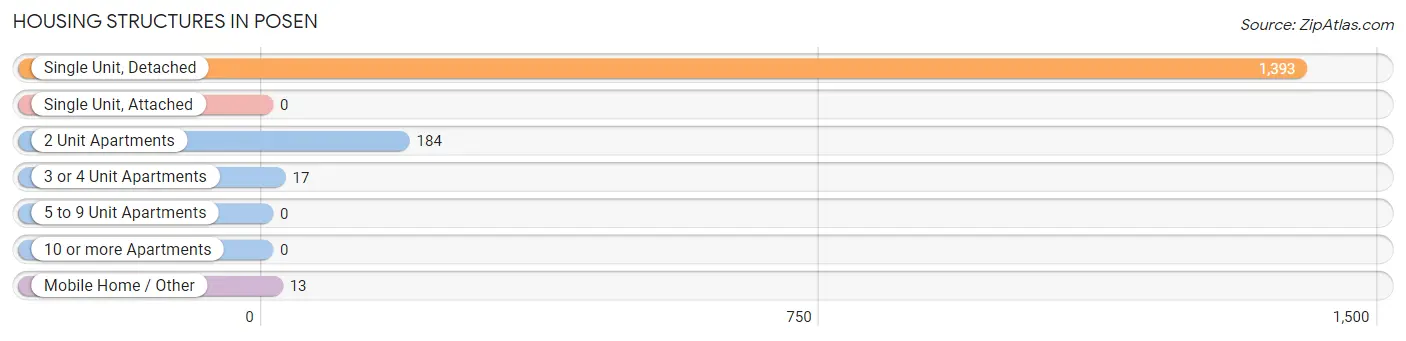
| Structure Type | # Housing Units | % Housing Units |
| Single Unit, Detached | 1,393 | 86.7% |
| Single Unit, Attached | 0 | 0.0% |
| 2 Unit Apartments | 184 | 11.5% |
| 3 or 4 Unit Apartments | 17 | 1.1% |
| 5 to 9 Unit Apartments | 0 | 0.0% |
| 10 or more Apartments | 0 | 0.0% |
| Mobile Home / Other | 13 | 0.8% |
| Total | 1,607 | 100.0% |
Housing Structures by Occupancy in Posen
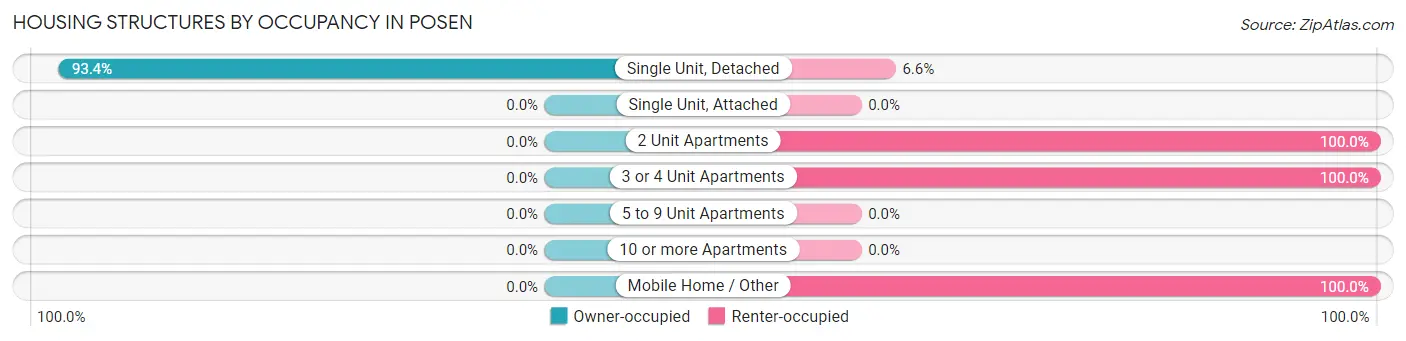
| Structure Type | Owner-occupied | Renter-occupied |
| Single Unit, Detached | 1,301 (93.4%) | 92 (6.6%) |
| Single Unit, Attached | 0 (0.0%) | 0 (0.0%) |
| 2 Unit Apartments | 0 (0.0%) | 184 (100.0%) |
| 3 or 4 Unit Apartments | 0 (0.0%) | 17 (100.0%) |
| 5 to 9 Unit Apartments | 0 (0.0%) | 0 (0.0%) |
| 10 or more Apartments | 0 (0.0%) | 0 (0.0%) |
| Mobile Home / Other | 0 (0.0%) | 13 (100.0%) |
| Total | 1,301 (81.0%) | 306 (19.0%) |
Housing Structures by Number of Rooms in Posen
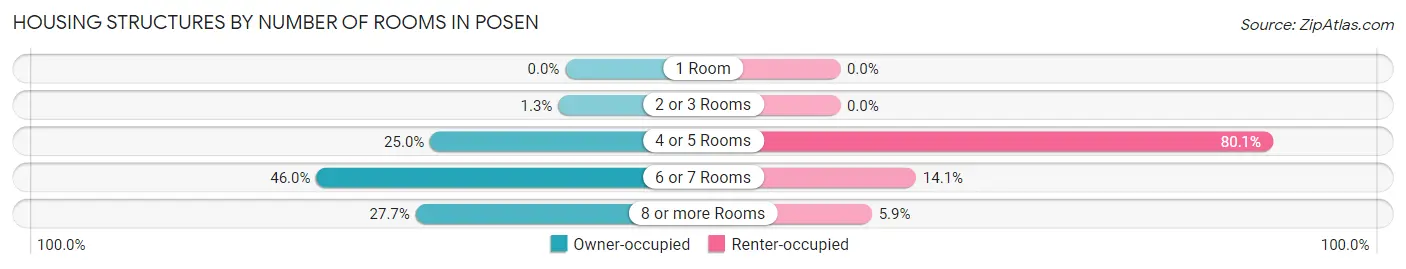
| Number of Rooms | Owner-occupied | Renter-occupied |
| 1 Room | 0 (0.0%) | 0 (0.0%) |
| 2 or 3 Rooms | 17 (1.3%) | 0 (0.0%) |
| 4 or 5 Rooms | 325 (25.0%) | 245 (80.1%) |
| 6 or 7 Rooms | 599 (46.0%) | 43 (14.1%) |
| 8 or more Rooms | 360 (27.7%) | 18 (5.9%) |
| Total | 1,301 (100.0%) | 306 (100.0%) |
Housing Structure by Heating Type in Posen
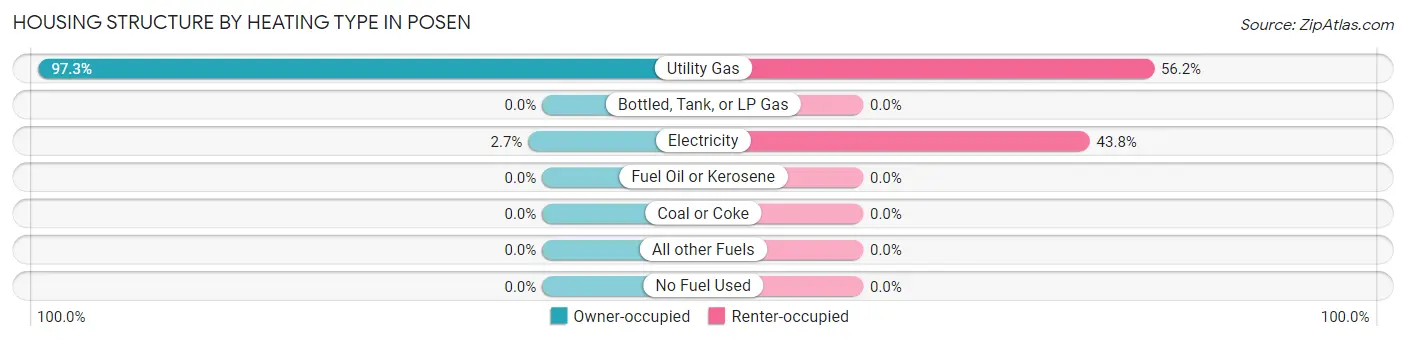
| Heating Type | Owner-occupied | Renter-occupied |
| Utility Gas | 1,266 (97.3%) | 172 (56.2%) |
| Bottled, Tank, or LP Gas | 0 (0.0%) | 0 (0.0%) |
| Electricity | 35 (2.7%) | 134 (43.8%) |
| Fuel Oil or Kerosene | 0 (0.0%) | 0 (0.0%) |
| Coal or Coke | 0 (0.0%) | 0 (0.0%) |
| All other Fuels | 0 (0.0%) | 0 (0.0%) |
| No Fuel Used | 0 (0.0%) | 0 (0.0%) |
| Total | 1,301 (100.0%) | 306 (100.0%) |
Household Vehicle Usage in Posen
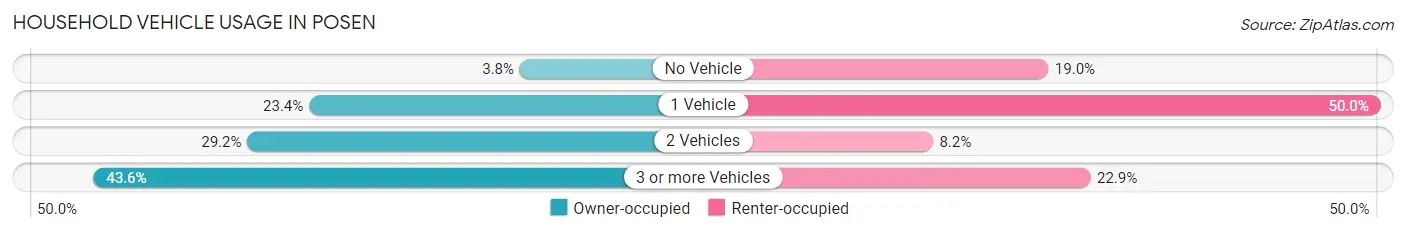
| Vehicles per Household | Owner-occupied | Renter-occupied |
| No Vehicle | 49 (3.8%) | 58 (19.0%) |
| 1 Vehicle | 305 (23.4%) | 153 (50.0%) |
| 2 Vehicles | 380 (29.2%) | 25 (8.2%) |
| 3 or more Vehicles | 567 (43.6%) | 70 (22.9%) |
| Total | 1,301 (100.0%) | 306 (100.0%) |
Real Estate & Mortgages in Posen
Real Estate and Mortgage Overview in Posen
| Characteristic | Without Mortgage | With Mortgage |
| Housing Units | 501 | 800 |
| Median Property Value | $137,500 | $160,700 |
| Median Household Income | $54,795 | $86 |
| Monthly Housing Costs | $566 | $0 |
| Real Estate Taxes | $2,744 | $0 |
Property Value by Mortgage Status in Posen
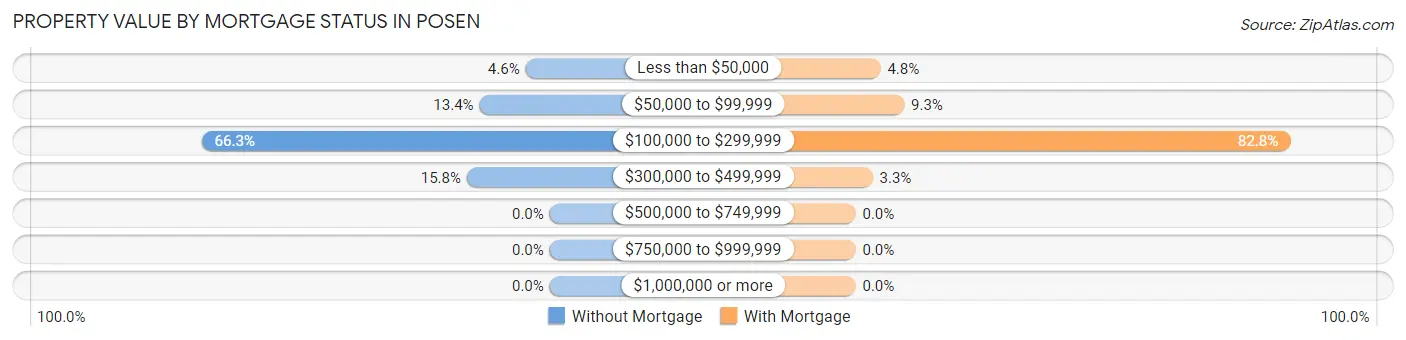
| Property Value | Without Mortgage | With Mortgage |
| Less than $50,000 | 23 (4.6%) | 38 (4.8%) |
| $50,000 to $99,999 | 67 (13.4%) | 74 (9.2%) |
| $100,000 to $299,999 | 332 (66.3%) | 662 (82.8%) |
| $300,000 to $499,999 | 79 (15.8%) | 26 (3.3%) |
| $500,000 to $749,999 | 0 (0.0%) | 0 (0.0%) |
| $750,000 to $999,999 | 0 (0.0%) | 0 (0.0%) |
| $1,000,000 or more | 0 (0.0%) | 0 (0.0%) |
| Total | 501 (100.0%) | 800 (100.0%) |
Household Income by Mortgage Status in Posen
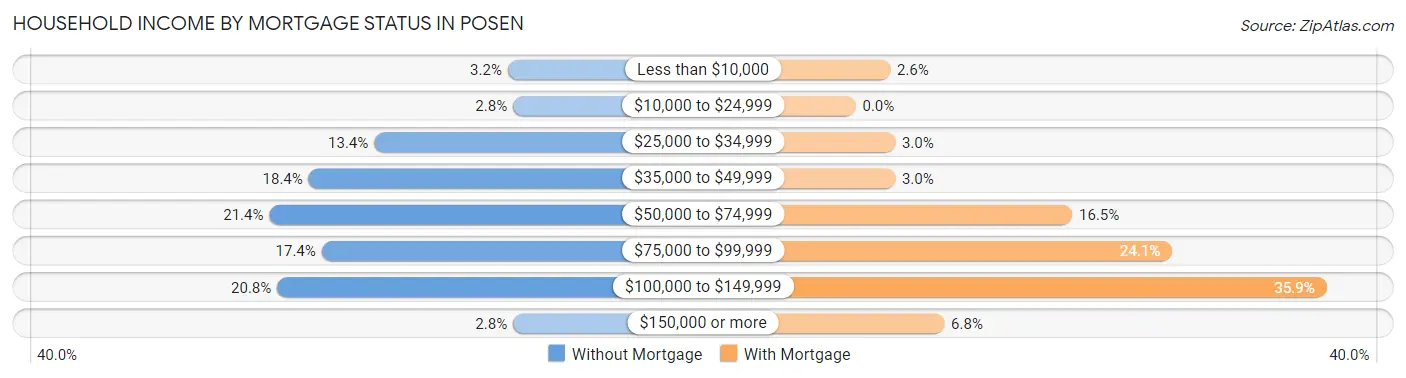
| Household Income | Without Mortgage | With Mortgage |
| Less than $10,000 | 16 (3.2%) | 21 (2.6%) |
| $10,000 to $24,999 | 14 (2.8%) | 0 (0.0%) |
| $25,000 to $34,999 | 67 (13.4%) | 24 (3.0%) |
| $35,000 to $49,999 | 92 (18.4%) | 24 (3.0%) |
| $50,000 to $74,999 | 107 (21.4%) | 132 (16.5%) |
| $75,000 to $99,999 | 87 (17.4%) | 193 (24.1%) |
| $100,000 to $149,999 | 104 (20.8%) | 287 (35.9%) |
| $150,000 or more | 14 (2.8%) | 54 (6.8%) |
| Total | 501 (100.0%) | 800 (100.0%) |
Property Value to Household Income Ratio in Posen
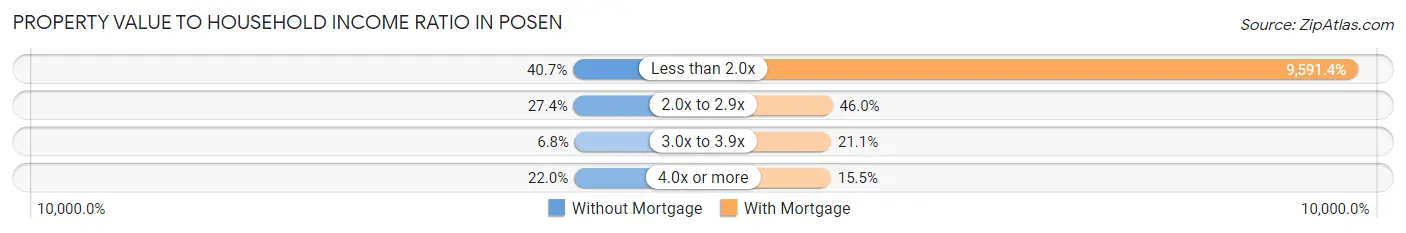
| Value-to-Income Ratio | Without Mortgage | With Mortgage |
| Less than 2.0x | 204 (40.7%) | 76,731 (9,591.4%) |
| 2.0x to 2.9x | 137 (27.4%) | 368 (46.0%) |
| 3.0x to 3.9x | 34 (6.8%) | 169 (21.1%) |
| 4.0x or more | 110 (22.0%) | 124 (15.5%) |
| Total | 501 (100.0%) | 800 (100.0%) |
Real Estate Taxes by Mortgage Status in Posen
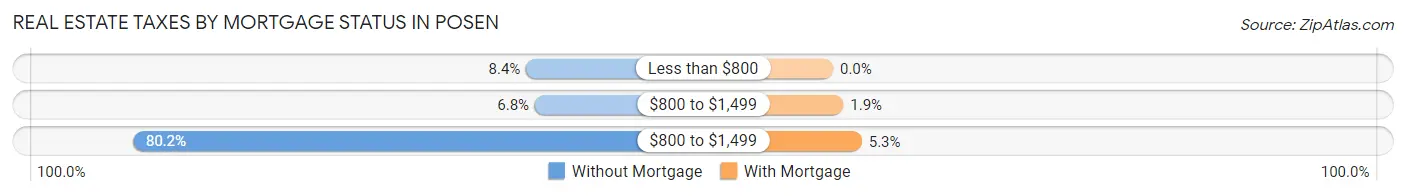
| Property Taxes | Without Mortgage | With Mortgage |
| Less than $800 | 42 (8.4%) | 0 (0.0%) |
| $800 to $1,499 | 34 (6.8%) | 15 (1.9%) |
| $800 to $1,499 | 402 (80.2%) | 42 (5.2%) |
| Total | 501 (100.0%) | 800 (100.0%) |
Health & Disability in Posen
Health Insurance Coverage by Age in Posen
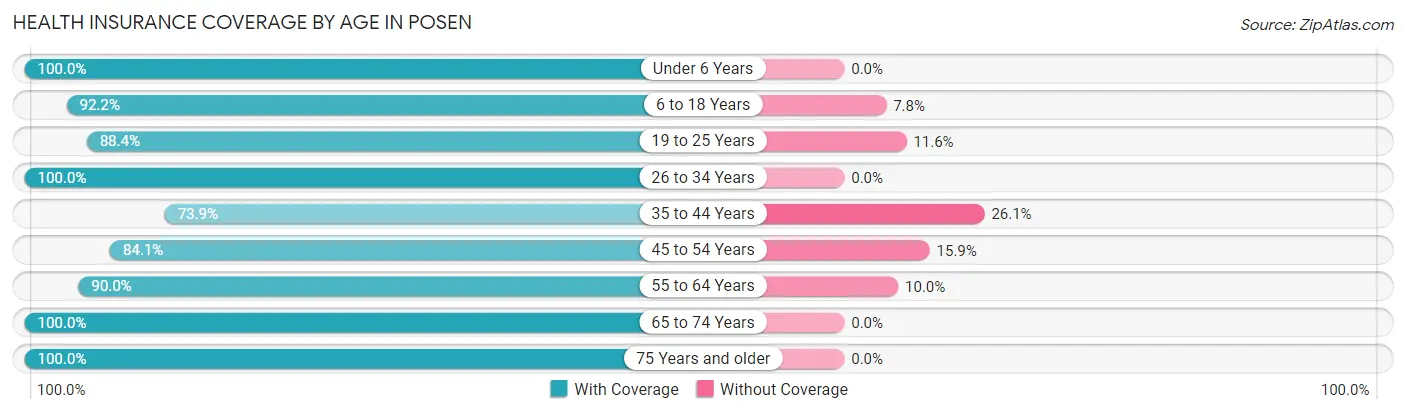
| Age Bracket | With Coverage | Without Coverage |
| Under 6 Years | 475 (100.0%) | 0 (0.0%) |
| 6 to 18 Years | 1,155 (92.2%) | 98 (7.8%) |
| 19 to 25 Years | 557 (88.4%) | 73 (11.6%) |
| 26 to 34 Years | 630 (100.0%) | 0 (0.0%) |
| 35 to 44 Years | 356 (73.9%) | 126 (26.1%) |
| 45 to 54 Years | 740 (84.1%) | 140 (15.9%) |
| 55 to 64 Years | 502 (90.0%) | 56 (10.0%) |
| 65 to 74 Years | 351 (100.0%) | 0 (0.0%) |
| 75 Years and older | 153 (100.0%) | 0 (0.0%) |
| Total | 4,919 (90.9%) | 493 (9.1%) |
Health Insurance Coverage by Citizenship Status in Posen
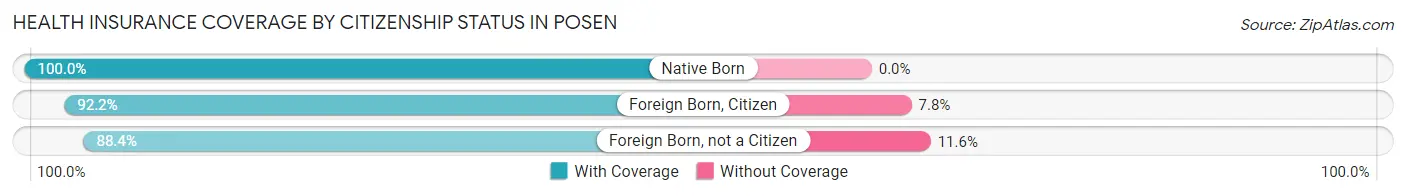
| Citizenship Status | With Coverage | Without Coverage |
| Native Born | 475 (100.0%) | 0 (0.0%) |
| Foreign Born, Citizen | 1,155 (92.2%) | 98 (7.8%) |
| Foreign Born, not a Citizen | 557 (88.4%) | 73 (11.6%) |
Health Insurance Coverage by Household Income in Posen
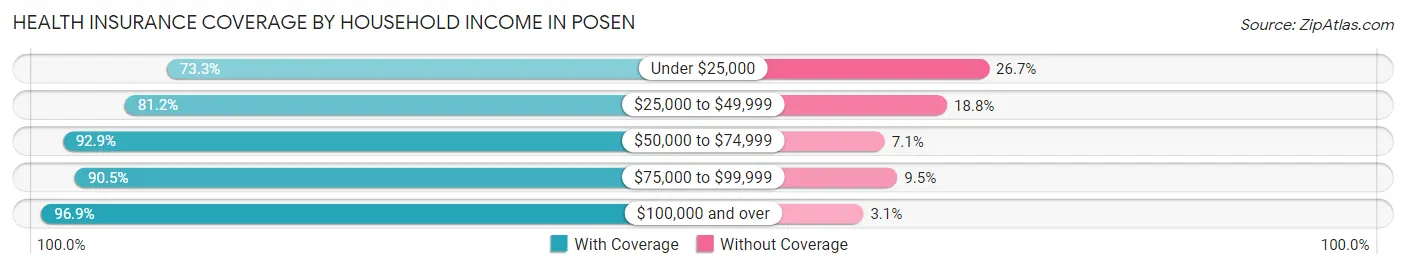
| Household Income | With Coverage | Without Coverage |
| Under $25,000 | 121 (73.3%) | 44 (26.7%) |
| $25,000 to $49,999 | 717 (81.2%) | 166 (18.8%) |
| $50,000 to $74,999 | 1,080 (92.9%) | 83 (7.1%) |
| $75,000 to $99,999 | 1,422 (90.5%) | 149 (9.5%) |
| $100,000 and over | 1,579 (96.9%) | 51 (3.1%) |
Public vs Private Health Insurance Coverage by Age in Posen
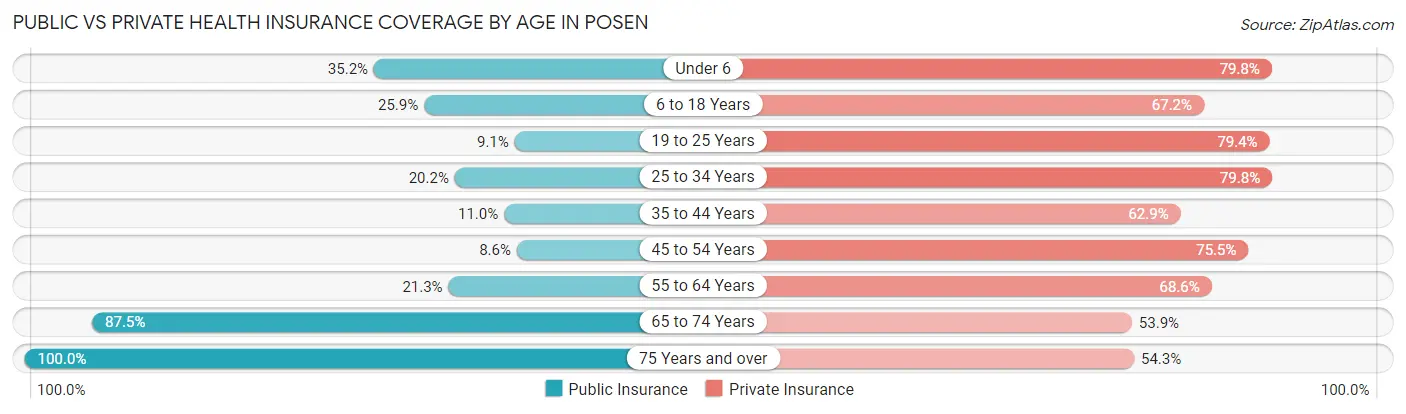
| Age Bracket | Public Insurance | Private Insurance |
| Under 6 | 167 (35.2%) | 379 (79.8%) |
| 6 to 18 Years | 324 (25.9%) | 842 (67.2%) |
| 19 to 25 Years | 57 (9.0%) | 500 (79.4%) |
| 25 to 34 Years | 127 (20.2%) | 503 (79.8%) |
| 35 to 44 Years | 53 (11.0%) | 303 (62.9%) |
| 45 to 54 Years | 76 (8.6%) | 664 (75.4%) |
| 55 to 64 Years | 119 (21.3%) | 383 (68.6%) |
| 65 to 74 Years | 307 (87.5%) | 189 (53.8%) |
| 75 Years and over | 153 (100.0%) | 83 (54.2%) |
| Total | 1,383 (25.6%) | 3,846 (71.1%) |
Disability Status by Sex by Age in Posen
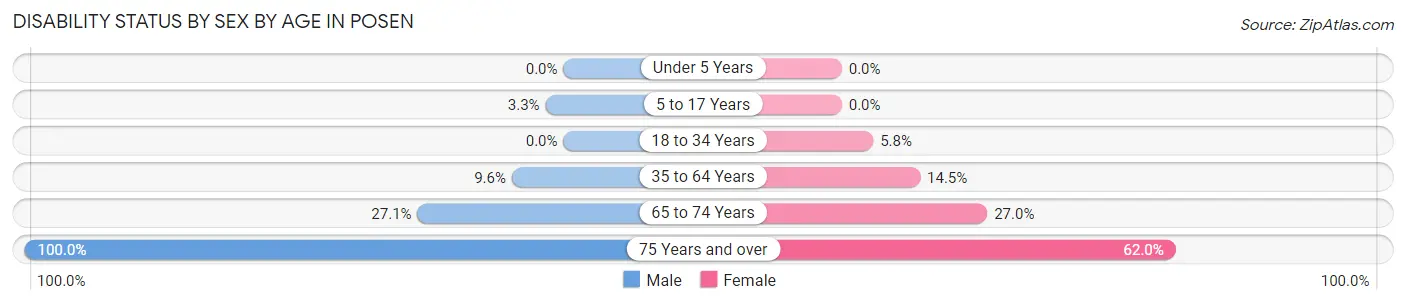
| Age Bracket | Male | Female |
| Under 5 Years | 0 (0.0%) | 0 (0.0%) |
| 5 to 17 Years | 15 (3.3%) | 0 (0.0%) |
| 18 to 34 Years | 0 (0.0%) | 36 (5.8%) |
| 35 to 64 Years | 87 (9.6%) | 147 (14.5%) |
| 65 to 74 Years | 68 (27.1%) | 27 (27.0%) |
| 75 Years and over | 40 (100.0%) | 70 (62.0%) |
Disability Class by Sex by Age in Posen
Disability Class: Hearing Difficulty
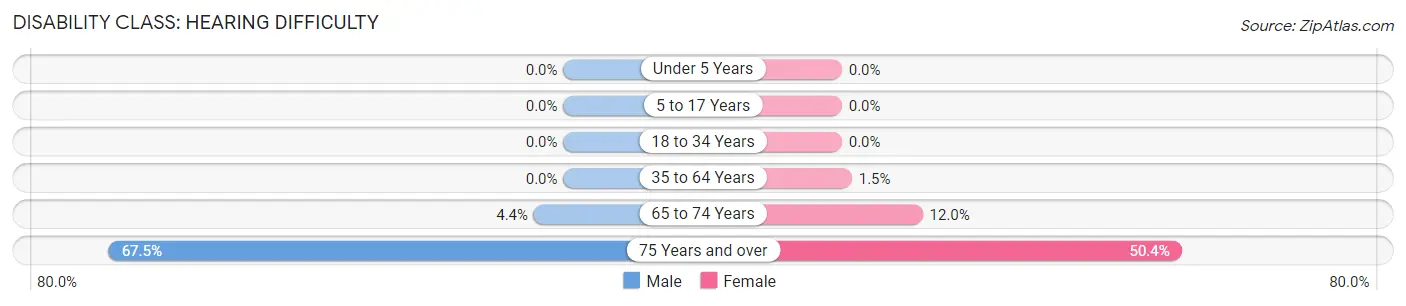
| Age Bracket | Male | Female |
| Under 5 Years | 0 (0.0%) | 0 (0.0%) |
| 5 to 17 Years | 0 (0.0%) | 0 (0.0%) |
| 18 to 34 Years | 0 (0.0%) | 0 (0.0%) |
| 35 to 64 Years | 0 (0.0%) | 15 (1.5%) |
| 65 to 74 Years | 11 (4.4%) | 12 (12.0%) |
| 75 Years and over | 27 (67.5%) | 57 (50.4%) |
Disability Class: Vision Difficulty
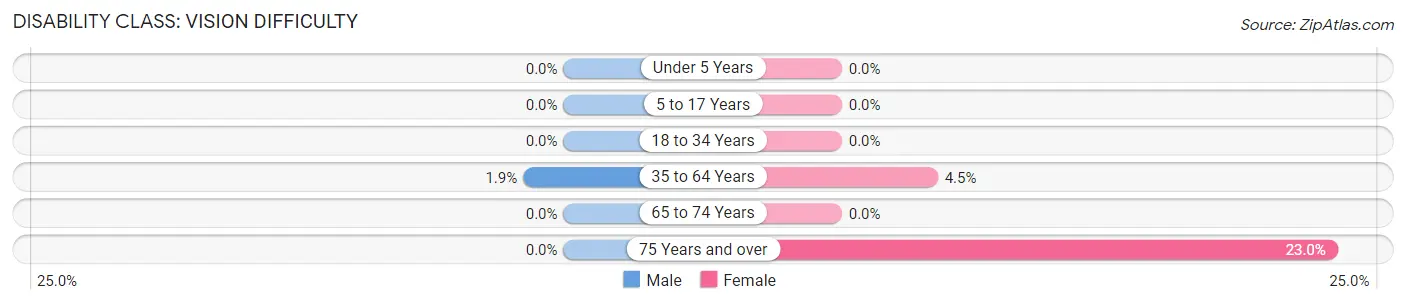
| Age Bracket | Male | Female |
| Under 5 Years | 0 (0.0%) | 0 (0.0%) |
| 5 to 17 Years | 0 (0.0%) | 0 (0.0%) |
| 18 to 34 Years | 0 (0.0%) | 0 (0.0%) |
| 35 to 64 Years | 17 (1.9%) | 45 (4.4%) |
| 65 to 74 Years | 0 (0.0%) | 0 (0.0%) |
| 75 Years and over | 0 (0.0%) | 26 (23.0%) |
Disability Class: Cognitive Difficulty
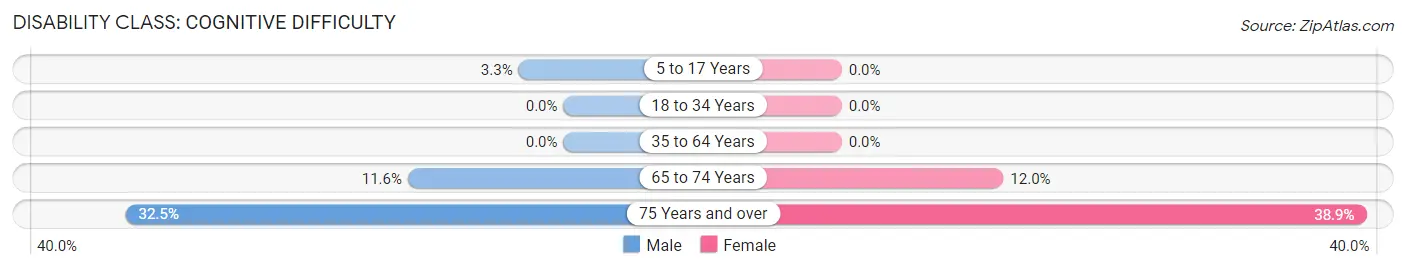
| Age Bracket | Male | Female |
| 5 to 17 Years | 15 (3.3%) | 0 (0.0%) |
| 18 to 34 Years | 0 (0.0%) | 0 (0.0%) |
| 35 to 64 Years | 0 (0.0%) | 0 (0.0%) |
| 65 to 74 Years | 29 (11.6%) | 12 (12.0%) |
| 75 Years and over | 13 (32.5%) | 44 (38.9%) |
Disability Class: Ambulatory Difficulty
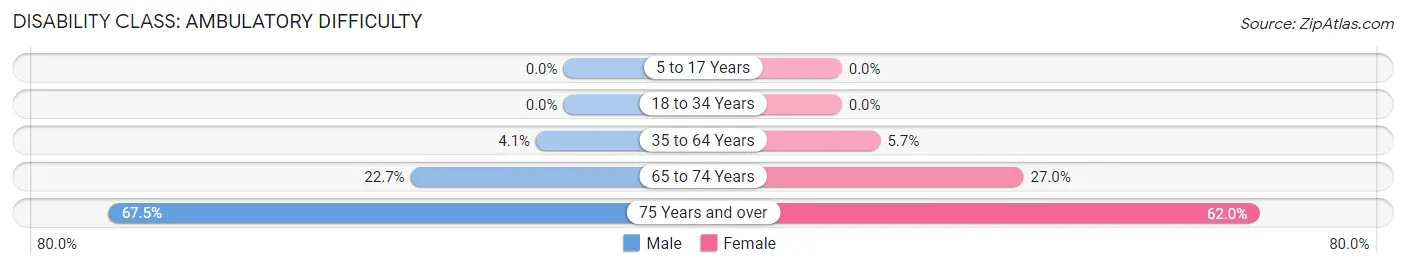
| Age Bracket | Male | Female |
| 5 to 17 Years | 0 (0.0%) | 0 (0.0%) |
| 18 to 34 Years | 0 (0.0%) | 0 (0.0%) |
| 35 to 64 Years | 37 (4.1%) | 58 (5.7%) |
| 65 to 74 Years | 57 (22.7%) | 27 (27.0%) |
| 75 Years and over | 27 (67.5%) | 70 (62.0%) |
Disability Class: Self-Care Difficulty
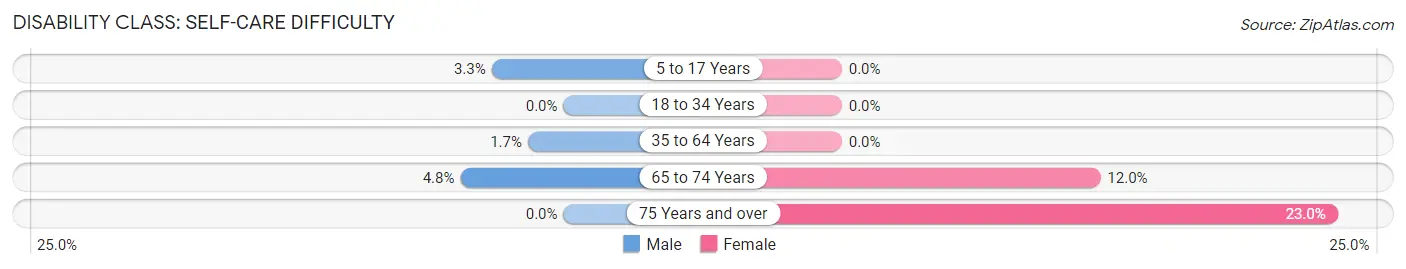
| Age Bracket | Male | Female |
| 5 to 17 Years | 15 (3.3%) | 0 (0.0%) |
| 18 to 34 Years | 0 (0.0%) | 0 (0.0%) |
| 35 to 64 Years | 15 (1.7%) | 0 (0.0%) |
| 65 to 74 Years | 12 (4.8%) | 12 (12.0%) |
| 75 Years and over | 0 (0.0%) | 26 (23.0%) |
Technology Access in Posen
Computing Device Access in Posen
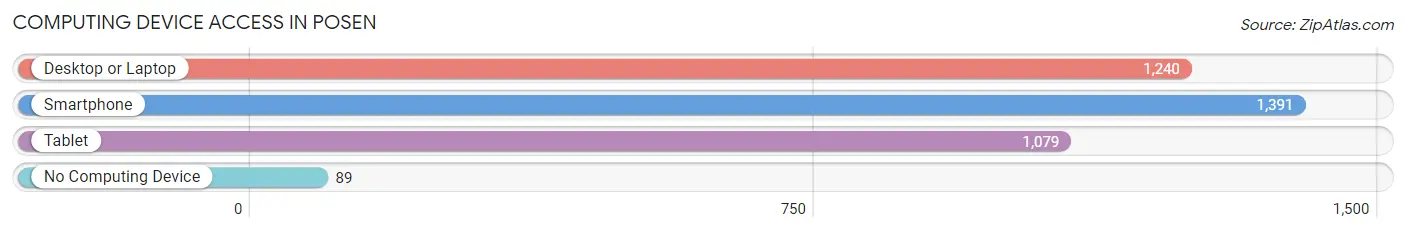
| Device Type | # Households | % Households |
| Desktop or Laptop | 1,240 | 77.2% |
| Smartphone | 1,391 | 86.6% |
| Tablet | 1,079 | 67.1% |
| No Computing Device | 89 | 5.5% |
| Total | 1,607 | 100.0% |
Internet Access in Posen
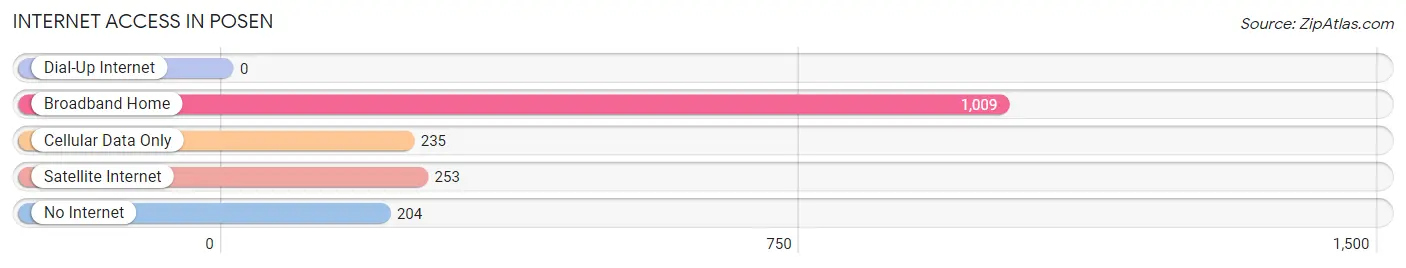
| Internet Type | # Households | % Households |
| Dial-Up Internet | 0 | 0.0% |
| Broadband Home | 1,009 | 62.8% |
| Cellular Data Only | 235 | 14.6% |
| Satellite Internet | 253 | 15.7% |
| No Internet | 204 | 12.7% |
| Total | 1,607 | 100.0% |
Posen Summary
Posen, Illinois is a small village located in Cook County, Illinois, United States. It is a part of the Chicago metropolitan area and is located approximately 25 miles southwest of the city. The village has a population of approximately 4,500 people and is home to a diverse population of people from various backgrounds.
History
Posen was founded in 1892 by a group of German immigrants who had come to the area in search of a better life. The village was named after the city of Posen, Germany, which was the hometown of many of the settlers. The village was incorporated in 1895 and has remained a small, rural community ever since.
The village was originally a farming community, with many of the settlers growing crops such as corn, wheat, and oats. As the years passed, the village began to grow and develop, and by the early 1900s, it had become a thriving community with a variety of businesses and services.
Geography
Posen is located in Cook County, Illinois, approximately 25 miles southwest of Chicago. The village is situated on the banks of the Des Plaines River and is surrounded by a number of small towns and villages. The village is located in a flat, open area and is bordered by the towns of Blue Island, Robbins, and Midlothian.
The village has a total area of 1.2 square miles, all of which is land. The village is located at an elevation of 645 feet above sea level.
Economy
The economy of Posen is largely based on agriculture and manufacturing. The village is home to a number of small businesses, including a number of farms, a few small manufacturing plants, and a few retail stores. The village also has a number of restaurants and bars, as well as a few small hotels.
The village is also home to a number of small industrial parks, which provide employment for many of the residents. The village is also home to a number of small businesses, such as auto repair shops, beauty salons, and other services.
Demographics
As of the 2010 census, the population of Posen was 4,500. The village is home to a diverse population of people from various backgrounds. The racial makeup of the village was 79.3% White, 11.2% African American, 0.3% Native American, 0.7% Asian, 0.1% Pacific Islander, and 8.4% from other races. Hispanic or Latino of any race were 16.3% of the population.
The median household income in Posen was $45,000, and the median family income was $50,000. The per capita income for the village was $20,000. About 11.2% of families and 13.3% of the population were below the poverty line, including 17.2% of those under age 18 and 8.3% of those age 65 or over.
Posen is a small, rural village with a diverse population and a strong economy. The village has a long history of providing a safe and comfortable home for its residents, and it continues to be a great place to live and work.
Common Questions
What is Per Capita Income in Posen?
Per Capita income in Posen is $23,161.
What is the Median Family Income in Posen?
Median Family Income in Posen is $73,281.
What is the Median Household income in Posen?
Median Household Income in Posen is $60,094.
What is Income or Wage Gap in Posen?
Income or Wage Gap in Posen is 9.4%.
Women in Posen earn 90.6 cents for every dollar earned by a man.
What is Inequality or Gini Index in Posen?
Inequality or Gini Index in Posen is 0.37.
What is the Total Population of Posen?
Total Population of Posen is 5,442.
What is the Total Male Population of Posen?
Total Male Population of Posen is 2,974.
What is the Total Female Population of Posen?
Total Female Population of Posen is 2,468.
What is the Ratio of Males per 100 Females in Posen?
There are 120.50 Males per 100 Females in Posen.
What is the Ratio of Females per 100 Males in Posen?
There are 82.99 Females per 100 Males in Posen.
What is the Median Population Age in Posen?
Median Population Age in Posen is 32.2 Years.
What is the Average Family Size in Posen
Average Family Size in Posen is 3.9 People.
What is the Average Household Size in Posen
Average Household Size in Posen is 3.4 People.
How Large is the Labor Force in Posen?
There are 2,956 People in the Labor Forcein in Posen.
What is the Percentage of People in the Labor Force in Posen?
68.4% of People are in the Labor Force in Posen.
What is the Unemployment Rate in Posen?
Unemployment Rate in Posen is 8.2%.