Forest Park, IL Map & Demographics
Forest Park Map
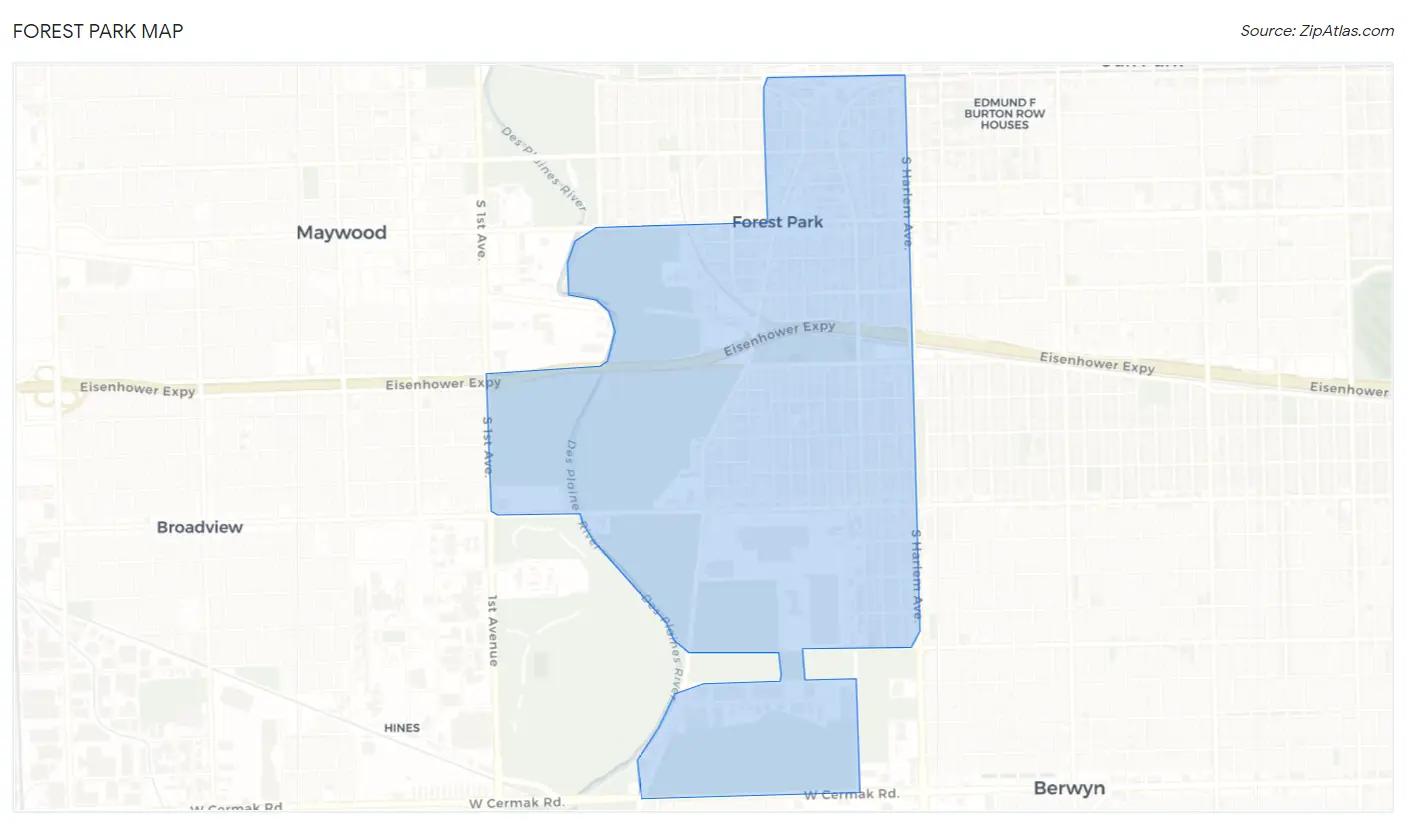
Forest Park Overview
$54,017
PER CAPITA INCOME
$113,622
AVG FAMILY INCOME
$78,625
AVG HOUSEHOLD INCOME
0.2%
WAGE / INCOME GAP [ % ]
99.8¢/ $1
WAGE / INCOME GAP [ $ ]
$16,931
FAMILY INCOME DEFICIT
0.47
INEQUALITY / GINI INDEX
14,165
TOTAL POPULATION
6,705
MALE POPULATION
7,460
FEMALE POPULATION
89.88
MALES / 100 FEMALES
111.26
FEMALES / 100 MALES
42.2
MEDIAN AGE
2.7
AVG FAMILY SIZE
1.9
AVG HOUSEHOLD SIZE
8,526
LABOR FORCE [ PEOPLE ]
68.5%
PERCENT IN LABOR FORCE
4.9%
UNEMPLOYMENT RATE
Forest Park Zip Codes
Income in Forest Park
Income Overview in Forest Park
Per Capita Income in Forest Park is $54,017, while median incomes of families and households are $113,622 and $78,625 respectively.
| Characteristic | Number | Measure |
| Per Capita Income | 14,165 | $54,017 |
| Median Family Income | 3,287 | $113,622 |
| Mean Family Income | 3,287 | $144,415 |
| Median Household Income | 7,328 | $78,625 |
| Mean Household Income | 7,328 | $103,197 |
| Income Deficit | 3,287 | $16,931 |
| Wage / Income Gap (%) | 14,165 | 0.23% |
| Wage / Income Gap ($) | 14,165 | 99.77¢ per $1 |
| Gini / Inequality Index | 14,165 | 0.47 |
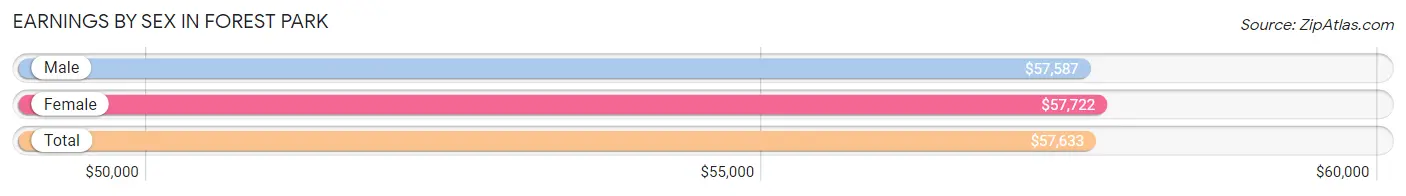
Earnings by Sex in Forest Park
Average Earnings in Forest Park are $57,633, $57,587 for men and $57,722 for women, a difference of 0.2%.
| Sex | Number | Average Earnings |
| Male | 4,377 (48.9%) | $57,587 |
| Female | 4,567 (51.1%) | $57,722 |
| Total | 8,944 (100.0%) | $57,633 |
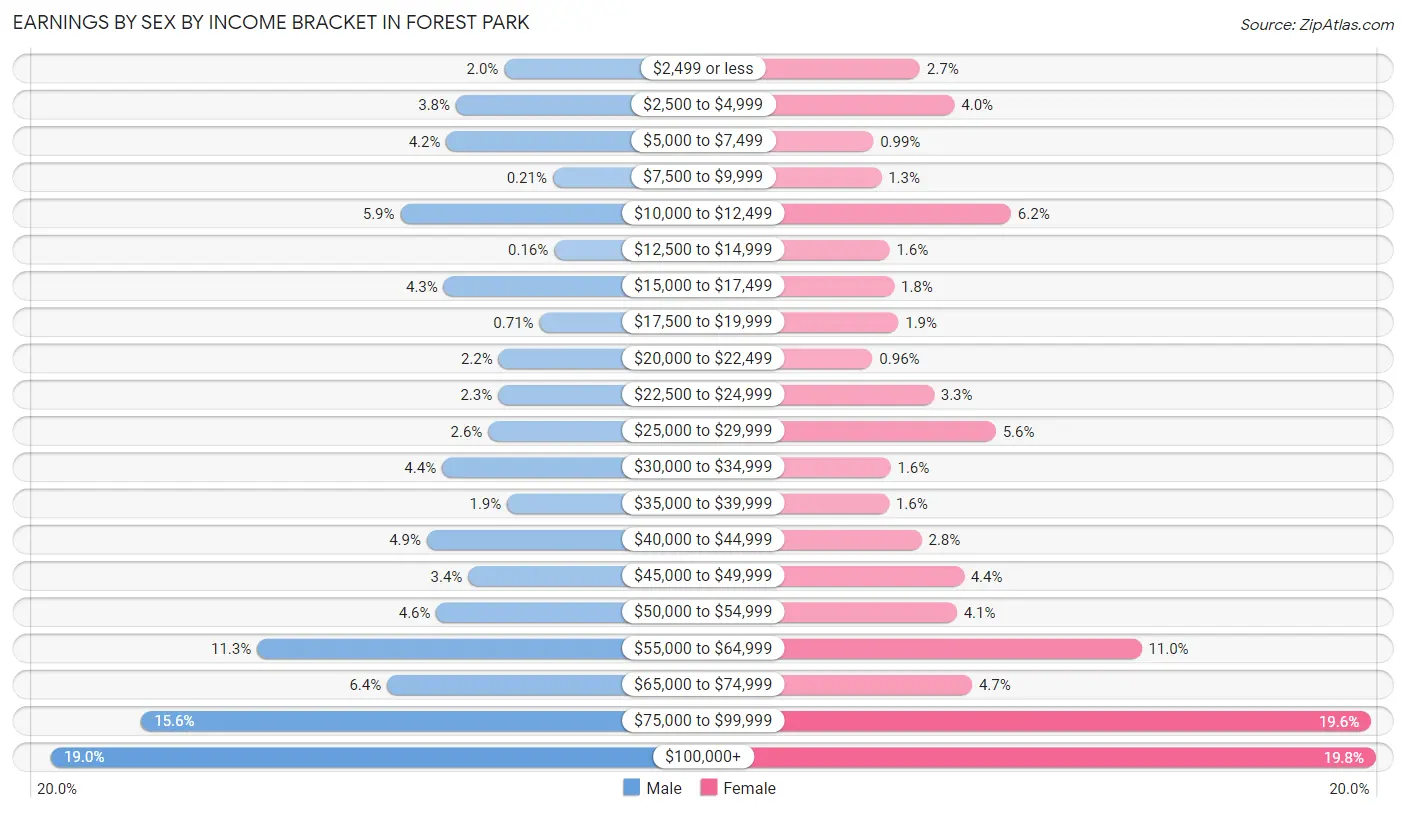
Earnings by Sex by Income Bracket in Forest Park
The most common earnings brackets in Forest Park are $100,000+ for men (832 | 19.0%) and $100,000+ for women (905 | 19.8%).
| Income | Male | Female |
| $2,499 or less | 89 (2.0%) | 125 (2.7%) |
| $2,500 to $4,999 | 168 (3.8%) | 184 (4.0%) |
| $5,000 to $7,499 | 184 (4.2%) | 45 (1.0%) |
| $7,500 to $9,999 | 9 (0.2%) | 59 (1.3%) |
| $10,000 to $12,499 | 259 (5.9%) | 281 (6.1%) |
| $12,500 to $14,999 | 7 (0.2%) | 73 (1.6%) |
| $15,000 to $17,499 | 188 (4.3%) | 81 (1.8%) |
| $17,500 to $19,999 | 31 (0.7%) | 88 (1.9%) |
| $20,000 to $22,499 | 98 (2.2%) | 44 (1.0%) |
| $22,500 to $24,999 | 99 (2.3%) | 149 (3.3%) |
| $25,000 to $29,999 | 115 (2.6%) | 255 (5.6%) |
| $30,000 to $34,999 | 191 (4.4%) | 75 (1.6%) |
| $35,000 to $39,999 | 84 (1.9%) | 72 (1.6%) |
| $40,000 to $44,999 | 216 (4.9%) | 128 (2.8%) |
| $45,000 to $49,999 | 148 (3.4%) | 200 (4.4%) |
| $50,000 to $54,999 | 200 (4.6%) | 188 (4.1%) |
| $55,000 to $64,999 | 494 (11.3%) | 504 (11.0%) |
| $65,000 to $74,999 | 281 (6.4%) | 214 (4.7%) |
| $75,000 to $99,999 | 684 (15.6%) | 897 (19.6%) |
| $100,000+ | 832 (19.0%) | 905 (19.8%) |
| Total | 4,377 (100.0%) | 4,567 (100.0%) |
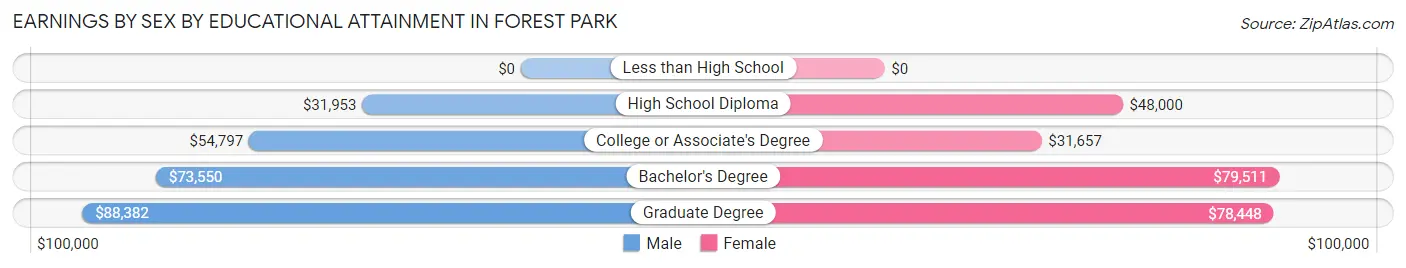
Earnings by Sex by Educational Attainment in Forest Park
Average earnings in Forest Park are $59,313 for men and $63,100 for women, a difference of 6.0%. Men with an educational attainment of graduate degree enjoy the highest average annual earnings of $88,382, while those with high school diploma education earn the least with $31,953. Women with an educational attainment of bachelor's degree earn the most with the average annual earnings of $79,511, while those with college or associate's degree education have the smallest earnings of $31,657.
| Educational Attainment | Male Income | Female Income |
| Less than High School | - | - |
| High School Diploma | $31,953 | $48,000 |
| College or Associate's Degree | $54,797 | $31,657 |
| Bachelor's Degree | $73,550 | $79,511 |
| Graduate Degree | $88,382 | $78,448 |
| Total | $59,313 | $63,100 |
Family Income in Forest Park
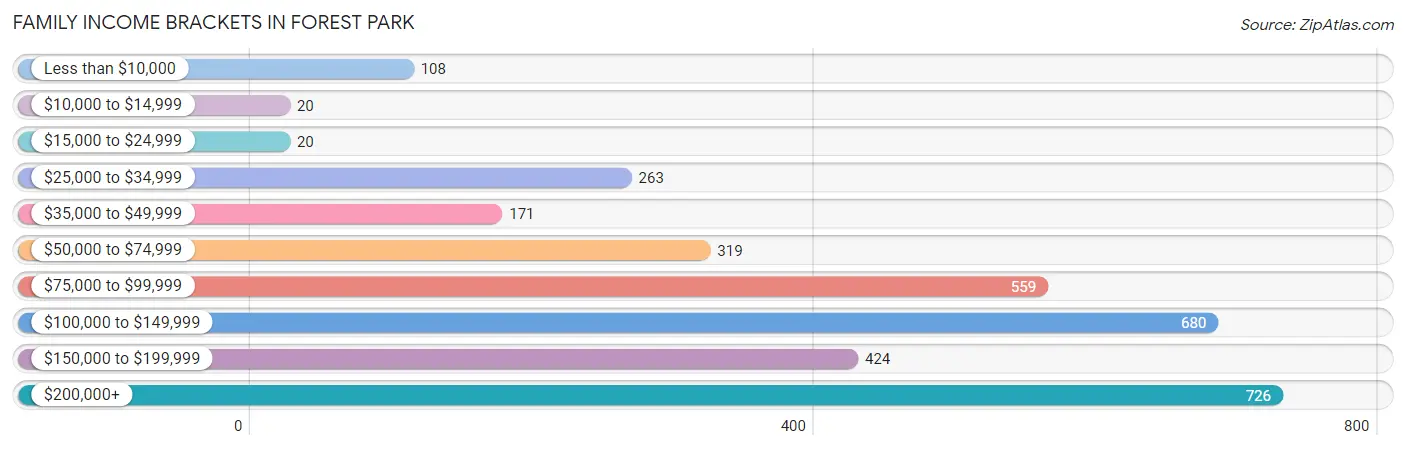
Family Income Brackets in Forest Park
According to the Forest Park family income data, there are 726 families falling into the $200,000+ income range, which is the most common income bracket and makes up 22.1% of all families. Conversely, the $10,000 to $14,999 income bracket is the least frequent group with only 20 families (0.6%) belonging to this category.
| Income Bracket | # Families | % Families |
| Less than $10,000 | 108 | 3.3% |
| $10,000 to $14,999 | 20 | 0.6% |
| $15,000 to $24,999 | 20 | 0.6% |
| $25,000 to $34,999 | 263 | 8.0% |
| $35,000 to $49,999 | 171 | 5.2% |
| $50,000 to $74,999 | 319 | 9.7% |
| $75,000 to $99,999 | 559 | 17.0% |
| $100,000 to $149,999 | 680 | 20.7% |
| $150,000 to $199,999 | 424 | 12.9% |
| $200,000+ | 726 | 22.1% |
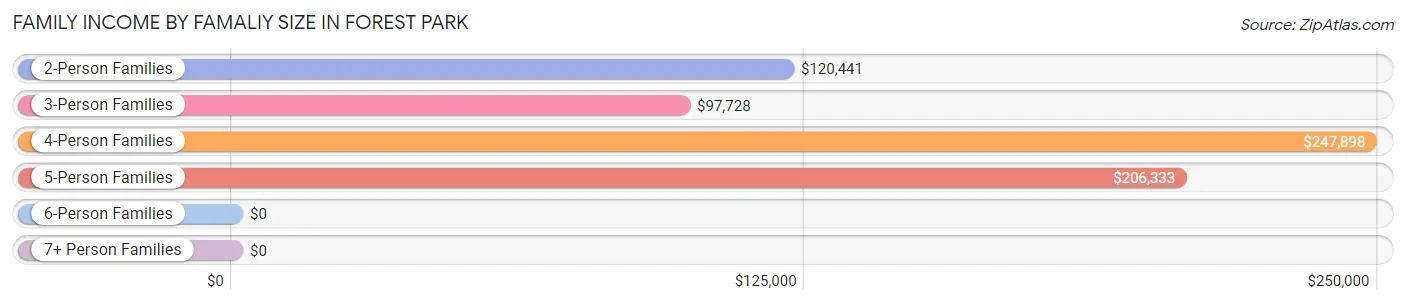
Family Income by Famaliy Size in Forest Park
4-person families (273 | 8.3%) account for the highest median family income in Forest Park with $247,898 per family, while 4-person families (273 | 8.3%) have the highest median income of $61,974 per family member.
| Income Bracket | # Families | Median Income |
| 2-Person Families | 1,946 (59.2%) | $120,441 |
| 3-Person Families | 929 (28.3%) | $97,728 |
| 4-Person Families | 273 (8.3%) | $247,898 |
| 5-Person Families | 132 (4.0%) | $206,333 |
| 6-Person Families | 7 (0.2%) | $0 |
| 7+ Person Families | 0 (0.0%) | $0 |
| Total | 3,287 (100.0%) | $113,622 |
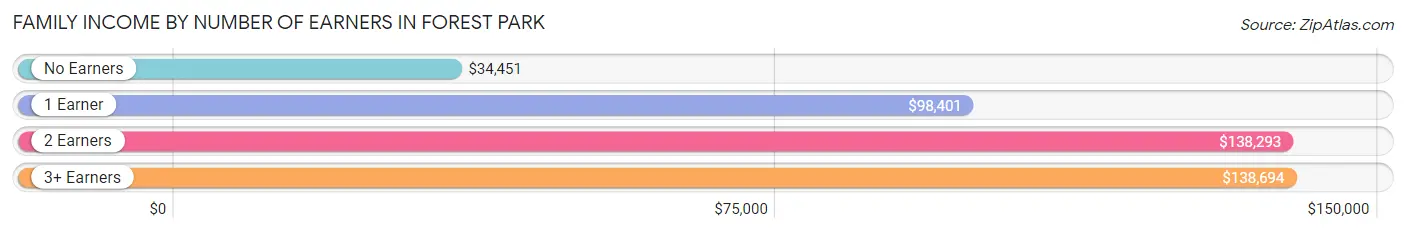
Family Income by Number of Earners in Forest Park
The median family income in Forest Park is $113,622, with families comprising 3+ earners (232) having the highest median family income of $138,694, while families with no earners (361) have the lowest median family income of $34,451, accounting for 7.1% and 11.0% of families, respectively.
| Number of Earners | # Families | Median Income |
| No Earners | 361 (11.0%) | $34,451 |
| 1 Earner | 881 (26.8%) | $98,401 |
| 2 Earners | 1,813 (55.2%) | $138,293 |
| 3+ Earners | 232 (7.1%) | $138,694 |
| Total | 3,287 (100.0%) | $113,622 |
Household Income in Forest Park
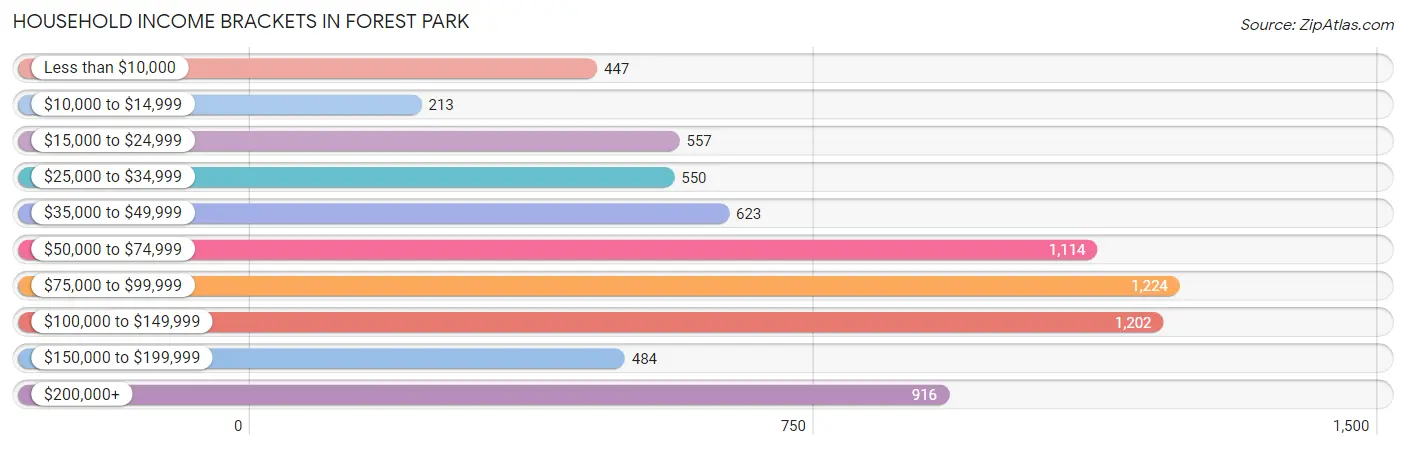
Household Income Brackets in Forest Park
With 1,224 households falling in the category, the $75,000 to $99,999 income range is the most frequent in Forest Park, accounting for 16.7% of all households. In contrast, only 213 households (2.9%) fall into the $10,000 to $14,999 income bracket, making it the least populous group.
| Income Bracket | # Households | % Households |
| Less than $10,000 | 447 | 6.1% |
| $10,000 to $14,999 | 213 | 2.9% |
| $15,000 to $24,999 | 557 | 7.6% |
| $25,000 to $34,999 | 550 | 7.5% |
| $35,000 to $49,999 | 623 | 8.5% |
| $50,000 to $74,999 | 1,114 | 15.2% |
| $75,000 to $99,999 | 1,224 | 16.7% |
| $100,000 to $149,999 | 1,202 | 16.4% |
| $150,000 to $199,999 | 484 | 6.6% |
| $200,000+ | 916 | 12.5% |
Household Income by Householder Age in Forest Park
The median household income in Forest Park is $78,625, with the highest median household income of $91,250 found in the 25 to 44 years age bracket for the primary householder. A total of 2,466 households (33.7%) fall into this category. Meanwhile, the 15 to 24 years age bracket for the primary householder has the lowest median household income of $0, with 260 households (3.5%) in this group.
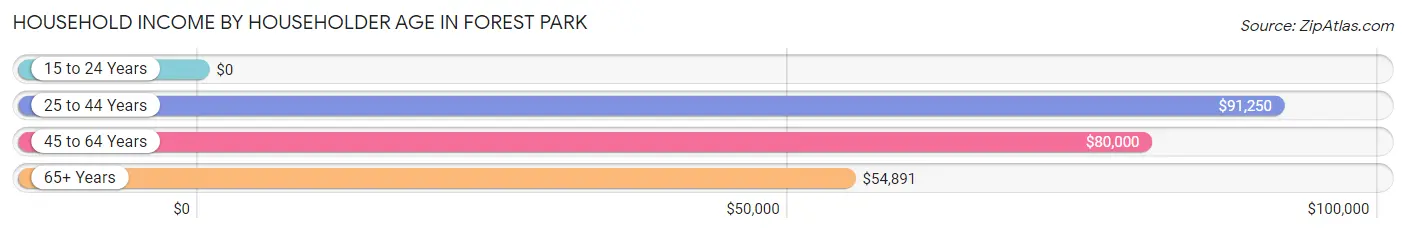
| Income Bracket | # Households | Median Income |
| 15 to 24 Years | 260 (3.5%) | $0 |
| 25 to 44 Years | 2,466 (33.7%) | $91,250 |
| 45 to 64 Years | 2,804 (38.3%) | $80,000 |
| 65+ Years | 1,798 (24.5%) | $54,891 |
| Total | 7,328 (100.0%) | $78,625 |
Poverty in Forest Park
Income Below Poverty by Sex and Age in Forest Park
With 10.8% poverty level for males and 11.8% for females among the residents of Forest Park, 18 to 24 year old males and 12 to 14 year old females are the most vulnerable to poverty, with 171 males (32.1%) and 46 females (52.9%) in their respective age groups living below the poverty level.
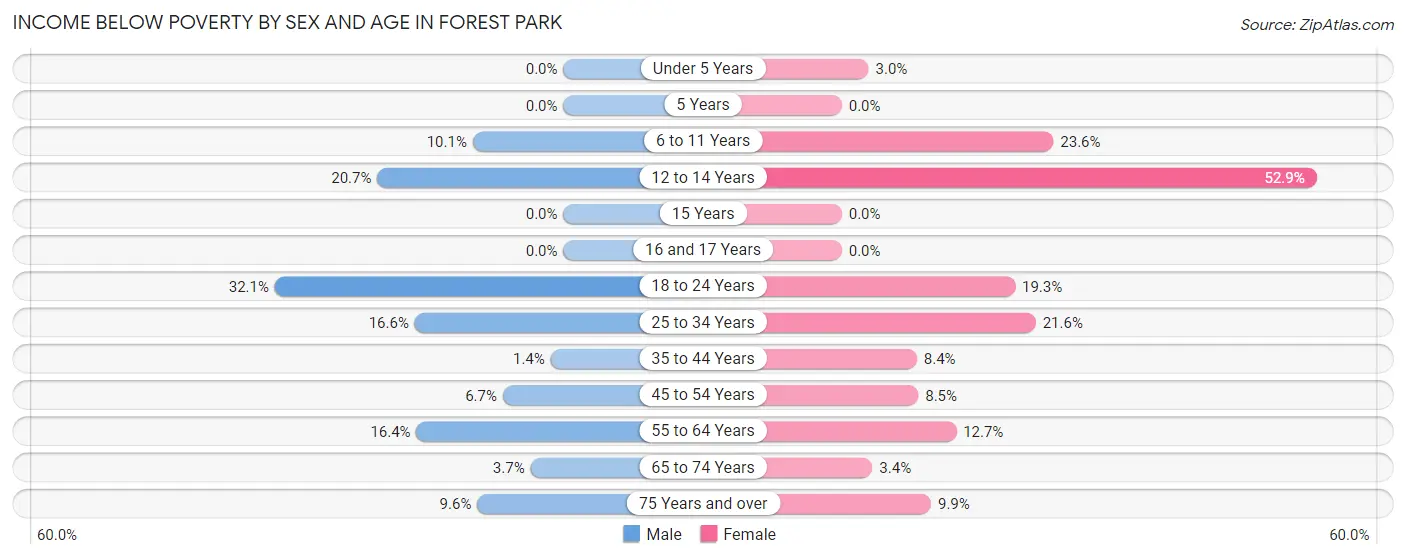
| Age Bracket | Male | Female |
| Under 5 Years | 0 (0.0%) | 14 (3.0%) |
| 5 Years | 0 (0.0%) | 0 (0.0%) |
| 6 to 11 Years | 22 (10.1%) | 82 (23.6%) |
| 12 to 14 Years | 46 (20.7%) | 46 (52.9%) |
| 15 Years | 0 (0.0%) | 0 (0.0%) |
| 16 and 17 Years | 0 (0.0%) | 0 (0.0%) |
| 18 to 24 Years | 171 (32.1%) | 65 (19.3%) |
| 25 to 34 Years | 187 (16.6%) | 254 (21.6%) |
| 35 to 44 Years | 18 (1.4%) | 93 (8.4%) |
| 45 to 54 Years | 48 (6.7%) | 84 (8.5%) |
| 55 to 64 Years | 162 (16.4%) | 161 (12.7%) |
| 65 to 74 Years | 25 (3.7%) | 34 (3.4%) |
| 75 Years and over | 35 (9.6%) | 36 (9.9%) |
| Total | 714 (10.8%) | 869 (11.8%) |
Income Above Poverty by Sex and Age in Forest Park
According to the poverty statistics in Forest Park, males aged under 5 years and females aged 5 years are the age groups that are most secure financially, with 100.0% of males and 100.0% of females in these age groups living above the poverty line.
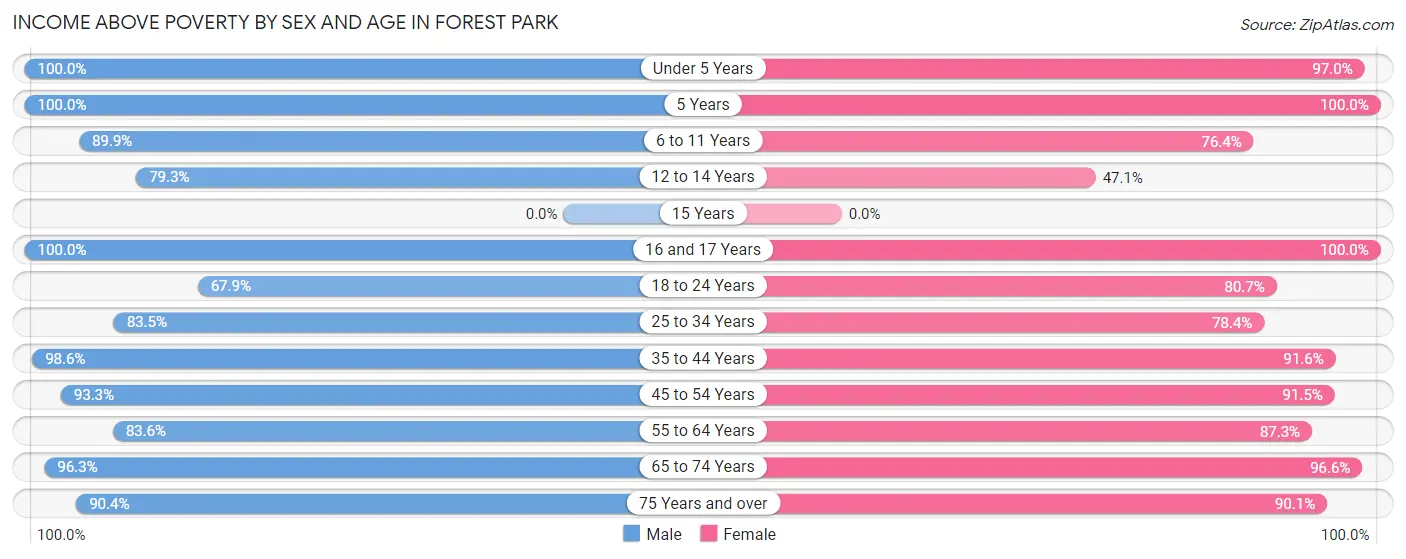
| Age Bracket | Male | Female |
| Under 5 Years | 265 (100.0%) | 456 (97.0%) |
| 5 Years | 88 (100.0%) | 17 (100.0%) |
| 6 to 11 Years | 196 (89.9%) | 266 (76.4%) |
| 12 to 14 Years | 176 (79.3%) | 41 (47.1%) |
| 15 Years | 0 (0.0%) | 0 (0.0%) |
| 16 and 17 Years | 110 (100.0%) | 200 (100.0%) |
| 18 to 24 Years | 361 (67.9%) | 272 (80.7%) |
| 25 to 34 Years | 943 (83.5%) | 922 (78.4%) |
| 35 to 44 Years | 1,249 (98.6%) | 1,020 (91.6%) |
| 45 to 54 Years | 664 (93.3%) | 902 (91.5%) |
| 55 to 64 Years | 828 (83.6%) | 1,103 (87.3%) |
| 65 to 74 Years | 658 (96.3%) | 963 (96.6%) |
| 75 Years and over | 330 (90.4%) | 326 (90.1%) |
| Total | 5,868 (89.1%) | 6,488 (88.2%) |
Income Below Poverty Among Married-Couple Families in Forest Park
The poverty statistics for married-couple families in Forest Park show that 3.4% or 68 of the total 1,976 families live below the poverty line. Families with 1 or 2 children have the highest poverty rate of 3.7%, comprising of 19 families. On the other hand, families with 3 or 4 children have the lowest poverty rate of 0.0%, which includes 0 families.
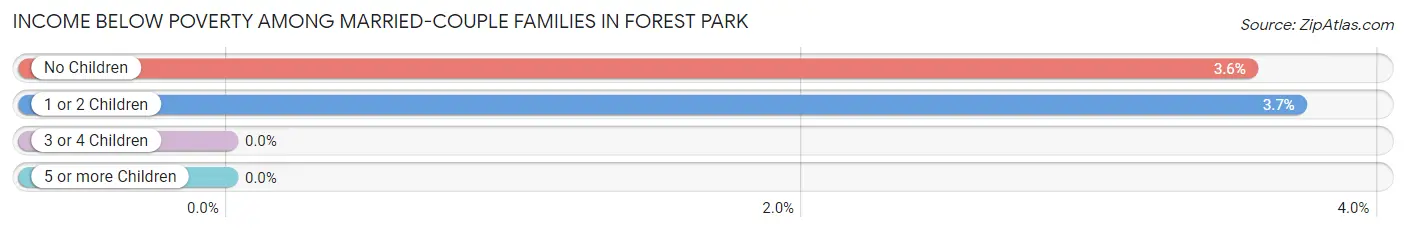
| Children | Above Poverty | Below Poverty |
| No Children | 1,333 (96.5%) | 49 (3.5%) |
| 1 or 2 Children | 492 (96.3%) | 19 (3.7%) |
| 3 or 4 Children | 83 (100.0%) | 0 (0.0%) |
| 5 or more Children | 0 (0.0%) | 0 (0.0%) |
| Total | 1,908 (96.6%) | 68 (3.4%) |
Income Below Poverty Among Single-Parent Households in Forest Park
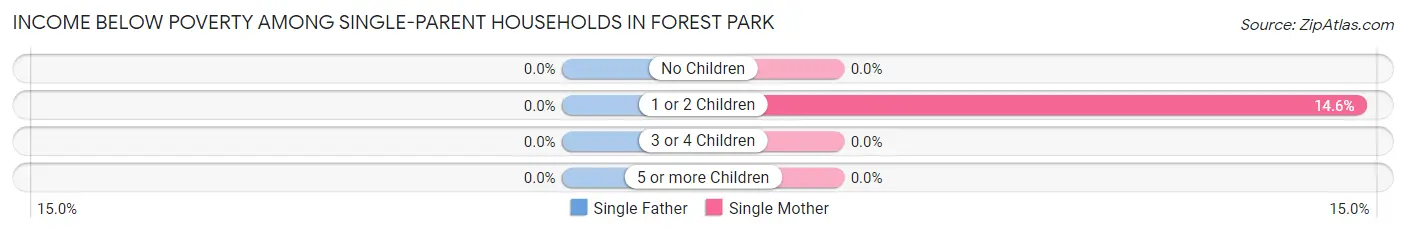
| Children | Single Father | Single Mother |
| No Children | 0 (0.0%) | 0 (0.0%) |
| 1 or 2 Children | 0 (0.0%) | 79 (14.6%) |
| 3 or 4 Children | 0 (0.0%) | 0 (0.0%) |
| 5 or more Children | 0 (0.0%) | 0 (0.0%) |
| Total | 0 (0.0%) | 79 (7.3%) |
Income Below Poverty Among Married-Couple vs Single-Parent Households in Forest Park
The poverty data for Forest Park shows that 68 of the married-couple family households (3.4%) and 79 of the single-parent households (6.0%) are living below the poverty level. Within the married-couple family households, those with 1 or 2 children have the highest poverty rate, with 19 households (3.7%) falling below the poverty line. Among the single-parent households, those with 1 or 2 children have the highest poverty rate, with 79 household (11.8%) living below poverty.
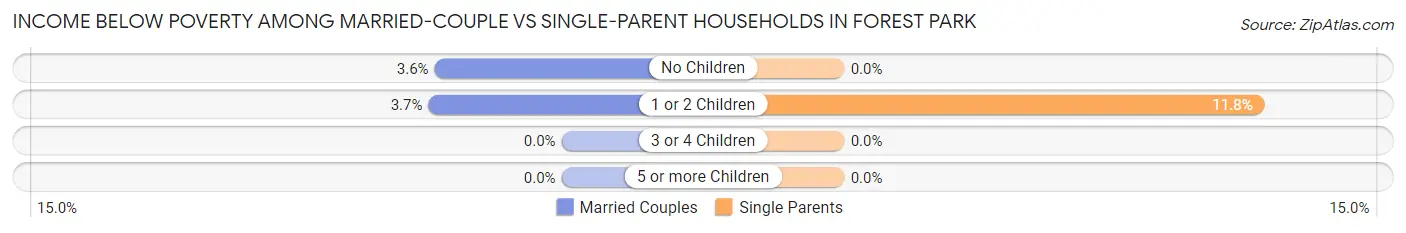
| Children | Married-Couple Families | Single-Parent Households |
| No Children | 49 (3.5%) | 0 (0.0%) |
| 1 or 2 Children | 19 (3.7%) | 79 (11.8%) |
| 3 or 4 Children | 0 (0.0%) | 0 (0.0%) |
| 5 or more Children | 0 (0.0%) | 0 (0.0%) |
| Total | 68 (3.4%) | 79 (6.0%) |
Race in Forest Park
The most populous races in Forest Park are White / Caucasian (7,884 | 55.7%), Black / African American (3,578 | 25.3%), and Hispanic or Latino (1,340 | 9.5%).
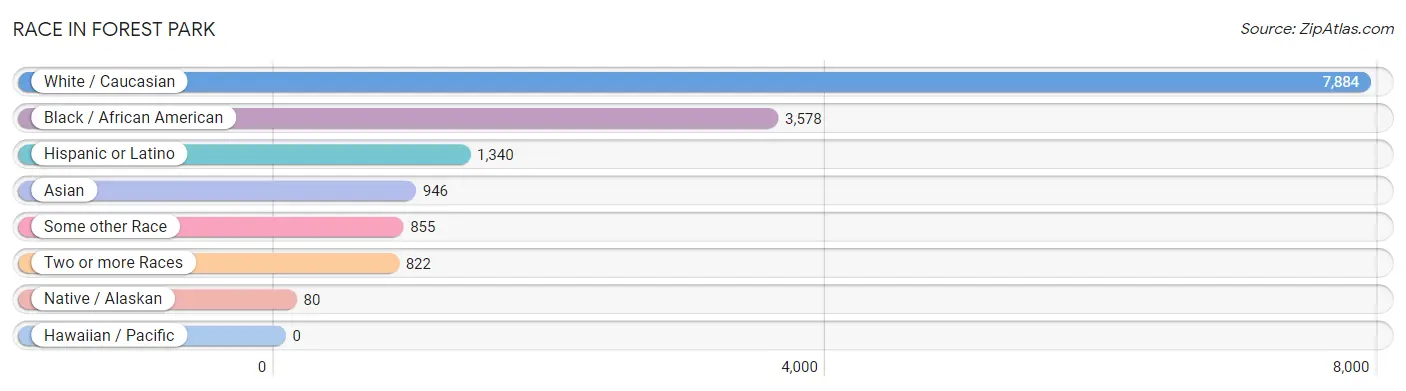
| Race | # Population | % Population |
| Asian | 946 | 6.7% |
| Black / African American | 3,578 | 25.3% |
| Hawaiian / Pacific | 0 | 0.0% |
| Hispanic or Latino | 1,340 | 9.5% |
| Native / Alaskan | 80 | 0.6% |
| White / Caucasian | 7,884 | 55.7% |
| Two or more Races | 822 | 5.8% |
| Some other Race | 855 | 6.0% |
| Total | 14,165 | 100.0% |
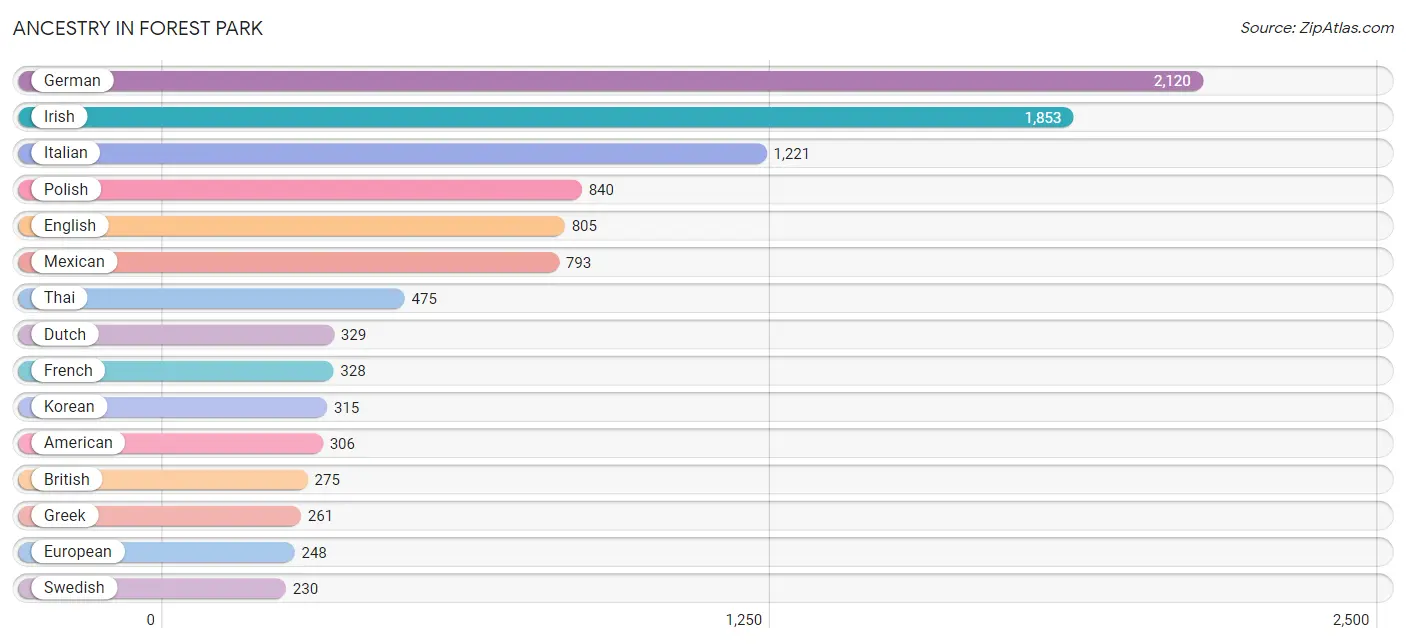
Ancestry in Forest Park
The most populous ancestries reported in Forest Park are German (2,120 | 15.0%), Irish (1,853 | 13.1%), Italian (1,221 | 8.6%), Polish (840 | 5.9%), and English (805 | 5.7%), together accounting for 48.3% of all Forest Park residents.
| Ancestry | # Population | % Population |
| African | 99 | 0.7% |
| American | 306 | 2.2% |
| Arab | 75 | 0.5% |
| Austrian | 6 | 0.0% |
| Belgian | 98 | 0.7% |
| Bhutanese | 5 | 0.0% |
| British | 275 | 1.9% |
| Burmese | 35 | 0.3% |
| Canadian | 129 | 0.9% |
| Central American | 58 | 0.4% |
| Central American Indian | 24 | 0.2% |
| Cherokee | 91 | 0.6% |
| Chilean | 11 | 0.1% |
| Chippewa | 24 | 0.2% |
| Colombian | 12 | 0.1% |
| Croatian | 52 | 0.4% |
| Czech | 181 | 1.3% |
| Czechoslovakian | 41 | 0.3% |
| Danish | 157 | 1.1% |
| Dominican | 70 | 0.5% |
| Dutch | 329 | 2.3% |
| Dutch West Indian | 1 | 0.0% |
| Eastern European | 15 | 0.1% |
| Ecuadorian | 31 | 0.2% |
| Egyptian | 12 | 0.1% |
| English | 805 | 5.7% |
| European | 248 | 1.8% |
| Finnish | 191 | 1.3% |
| French | 328 | 2.3% |
| French Canadian | 10 | 0.1% |
| German | 2,120 | 15.0% |
| Greek | 261 | 1.8% |
| Guatemalan | 58 | 0.4% |
| Haitian | 5 | 0.0% |
| Hungarian | 34 | 0.2% |
| Indian (Asian) | 97 | 0.7% |
| Iranian | 61 | 0.4% |
| Iraqi | 12 | 0.1% |
| Irish | 1,853 | 13.1% |
| Italian | 1,221 | 8.6% |
| Jamaican | 73 | 0.5% |
| Korean | 315 | 2.2% |
| Latvian | 11 | 0.1% |
| Lebanese | 10 | 0.1% |
| Lithuanian | 27 | 0.2% |
| Mexican | 793 | 5.6% |
| Navajo | 68 | 0.5% |
| Nigerian | 16 | 0.1% |
| Northern European | 75 | 0.5% |
| Norwegian | 183 | 1.3% |
| Pakistani | 9 | 0.1% |
| Palestinian | 5 | 0.0% |
| Peruvian | 114 | 0.8% |
| Polish | 840 | 5.9% |
| Puerto Rican | 165 | 1.2% |
| Romanian | 41 | 0.3% |
| Russian | 34 | 0.2% |
| Scotch-Irish | 100 | 0.7% |
| Scottish | 134 | 0.9% |
| Serbian | 9 | 0.1% |
| Slavic | 9 | 0.1% |
| Slovak | 35 | 0.3% |
| South American | 168 | 1.2% |
| Spaniard | 41 | 0.3% |
| Spanish | 45 | 0.3% |
| Sri Lankan | 73 | 0.5% |
| Subsaharan African | 211 | 1.5% |
| Sudanese | 39 | 0.3% |
| Swedish | 230 | 1.6% |
| Swiss | 34 | 0.2% |
| Syrian | 29 | 0.2% |
| Thai | 475 | 3.4% |
| Ukrainian | 82 | 0.6% |
| Welsh | 154 | 1.1% | View All 74 Rows |
Immigrants in Forest Park
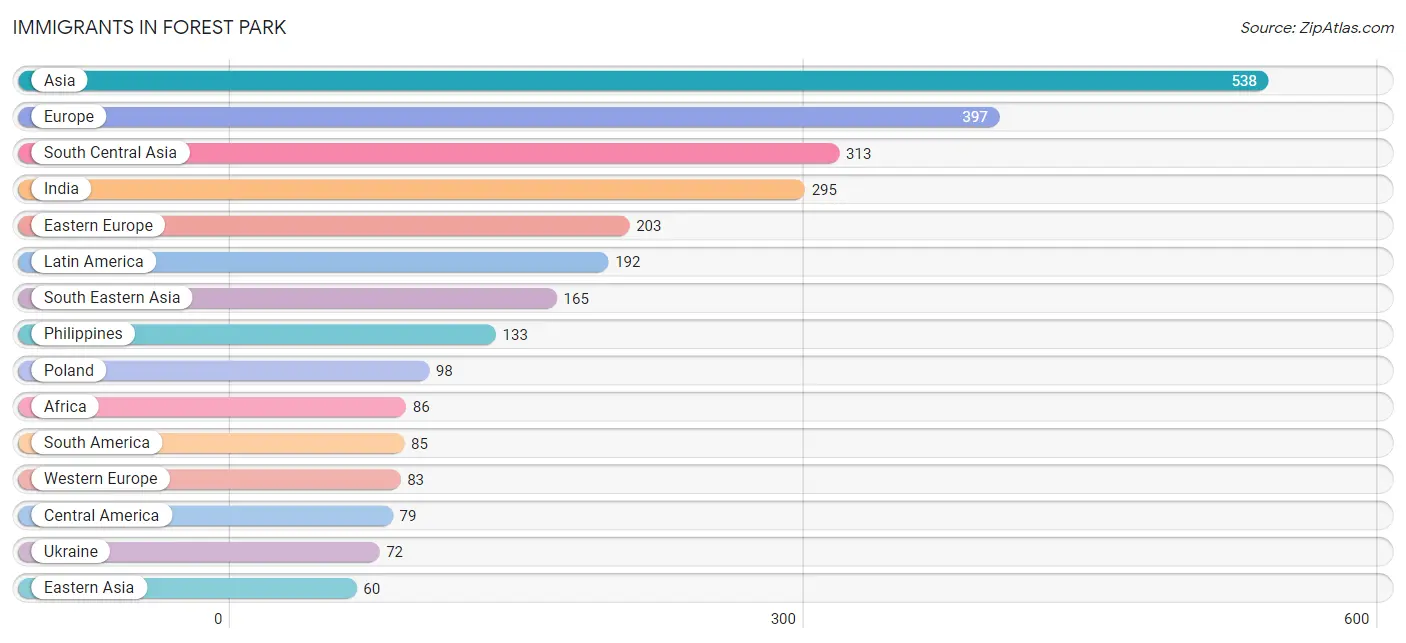
The most numerous immigrant groups reported in Forest Park came from Asia (538 | 3.8%), Europe (397 | 2.8%), South Central Asia (313 | 2.2%), India (295 | 2.1%), and Eastern Europe (203 | 1.4%), together accounting for 12.3% of all Forest Park residents.
| Immigration Origin | # Population | % Population |
| Africa | 86 | 0.6% |
| Asia | 538 | 3.8% |
| Canada | 47 | 0.3% |
| Caribbean | 28 | 0.2% |
| Central America | 79 | 0.6% |
| China | 44 | 0.3% |
| Czechoslovakia | 20 | 0.1% |
| Denmark | 17 | 0.1% |
| Eastern Asia | 60 | 0.4% |
| Eastern Europe | 203 | 1.4% |
| Ecuador | 31 | 0.2% |
| Egypt | 7 | 0.1% |
| England | 19 | 0.1% |
| Europe | 397 | 2.8% |
| France | 1 | 0.0% |
| Germany | 26 | 0.2% |
| Greece | 54 | 0.4% |
| Guatemala | 45 | 0.3% |
| Haiti | 5 | 0.0% |
| India | 295 | 2.1% |
| Iran | 18 | 0.1% |
| Ireland | 21 | 0.2% |
| Jamaica | 23 | 0.2% |
| Korea | 16 | 0.1% |
| Latin America | 192 | 1.4% |
| Mexico | 34 | 0.2% |
| Middle Africa | 28 | 0.2% |
| Netherlands | 56 | 0.4% |
| Northern Africa | 58 | 0.4% |
| Northern Europe | 57 | 0.4% |
| Peru | 54 | 0.4% |
| Philippines | 133 | 0.9% |
| Poland | 98 | 0.7% |
| Romania | 13 | 0.1% |
| South America | 85 | 0.6% |
| South Central Asia | 313 | 2.2% |
| South Eastern Asia | 165 | 1.2% |
| Southern Europe | 54 | 0.4% |
| Sudan | 39 | 0.3% |
| Thailand | 9 | 0.1% |
| Ukraine | 72 | 0.5% |
| Vietnam | 23 | 0.2% |
| Western Europe | 83 | 0.6% | View All 43 Rows |
Sex and Age in Forest Park
Sex and Age in Forest Park
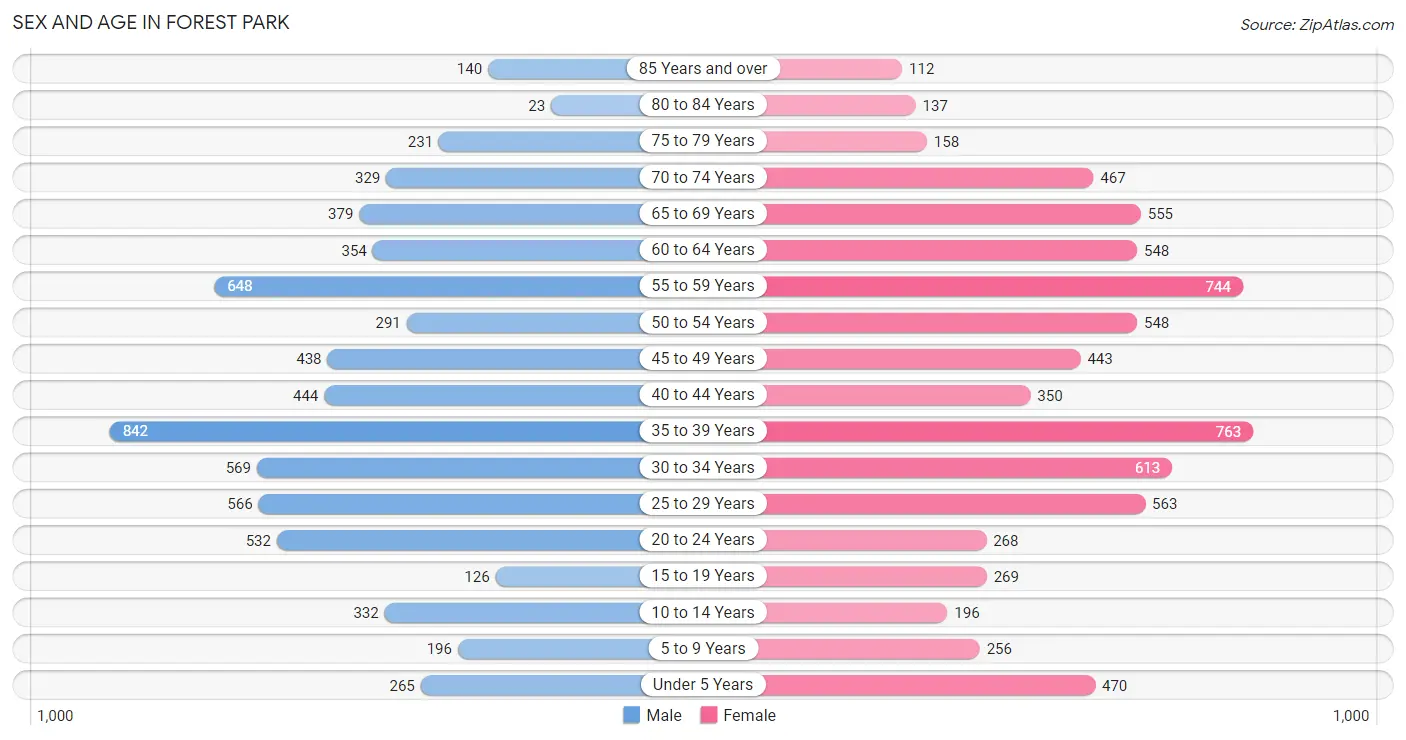
The most populous age groups in Forest Park are 35 to 39 Years (842 | 12.6%) for men and 35 to 39 Years (763 | 10.2%) for women.
| Age Bracket | Male | Female |
| Under 5 Years | 265 (4.0%) | 470 (6.3%) |
| 5 to 9 Years | 196 (2.9%) | 256 (3.4%) |
| 10 to 14 Years | 332 (5.0%) | 196 (2.6%) |
| 15 to 19 Years | 126 (1.9%) | 269 (3.6%) |
| 20 to 24 Years | 532 (7.9%) | 268 (3.6%) |
| 25 to 29 Years | 566 (8.4%) | 563 (7.5%) |
| 30 to 34 Years | 569 (8.5%) | 613 (8.2%) |
| 35 to 39 Years | 842 (12.6%) | 763 (10.2%) |
| 40 to 44 Years | 444 (6.6%) | 350 (4.7%) |
| 45 to 49 Years | 438 (6.5%) | 443 (5.9%) |
| 50 to 54 Years | 291 (4.3%) | 548 (7.3%) |
| 55 to 59 Years | 648 (9.7%) | 744 (10.0%) |
| 60 to 64 Years | 354 (5.3%) | 548 (7.3%) |
| 65 to 69 Years | 379 (5.7%) | 555 (7.4%) |
| 70 to 74 Years | 329 (4.9%) | 467 (6.3%) |
| 75 to 79 Years | 231 (3.5%) | 158 (2.1%) |
| 80 to 84 Years | 23 (0.3%) | 137 (1.8%) |
| 85 Years and over | 140 (2.1%) | 112 (1.5%) |
| Total | 6,705 (100.0%) | 7,460 (100.0%) |
Families and Households in Forest Park
Median Family Size in Forest Park
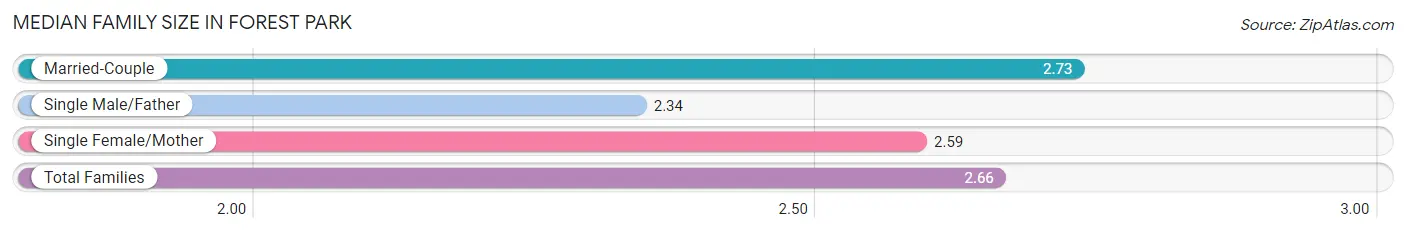
The median family size in Forest Park is 2.66 persons per family, with married-couple families (1,976 | 60.1%) accounting for the largest median family size of 2.73 persons per family. On the other hand, single male/father families (233 | 7.1%) represent the smallest median family size with 2.34 persons per family.
| Family Type | # Families | Family Size |
| Married-Couple | 1,976 (60.1%) | 2.73 |
| Single Male/Father | 233 (7.1%) | 2.34 |
| Single Female/Mother | 1,078 (32.8%) | 2.59 |
| Total Families | 3,287 (100.0%) | 2.66 |
Median Household Size in Forest Park
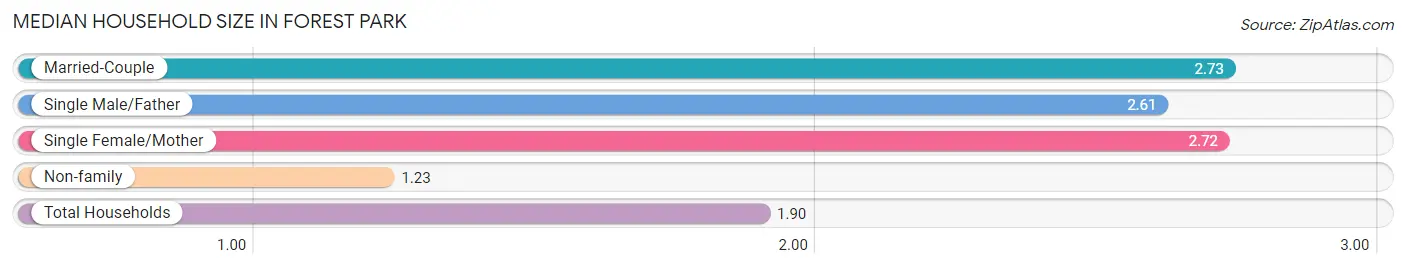
The median household size in Forest Park is 1.90 persons per household, with married-couple households (1,976 | 27.0%) accounting for the largest median household size of 2.73 persons per household. non-family households (4,041 | 55.1%) represent the smallest median household size with 1.23 persons per household.
| Household Type | # Households | Household Size |
| Married-Couple | 1,976 (27.0%) | 2.73 |
| Single Male/Father | 233 (3.2%) | 2.61 |
| Single Female/Mother | 1,078 (14.7%) | 2.72 |
| Non-family | 4,041 (55.1%) | 1.23 |
| Total Households | 7,328 (100.0%) | 1.90 |
Household Size by Marriage Status in Forest Park
Out of a total of 7,328 households in Forest Park, 3,287 (44.9%) are family households, while 4,041 (55.1%) are nonfamily households. The most numerous type of family households are 2-person households, comprising 1,779, and the most common type of nonfamily households are 1-person households, comprising 3,468.
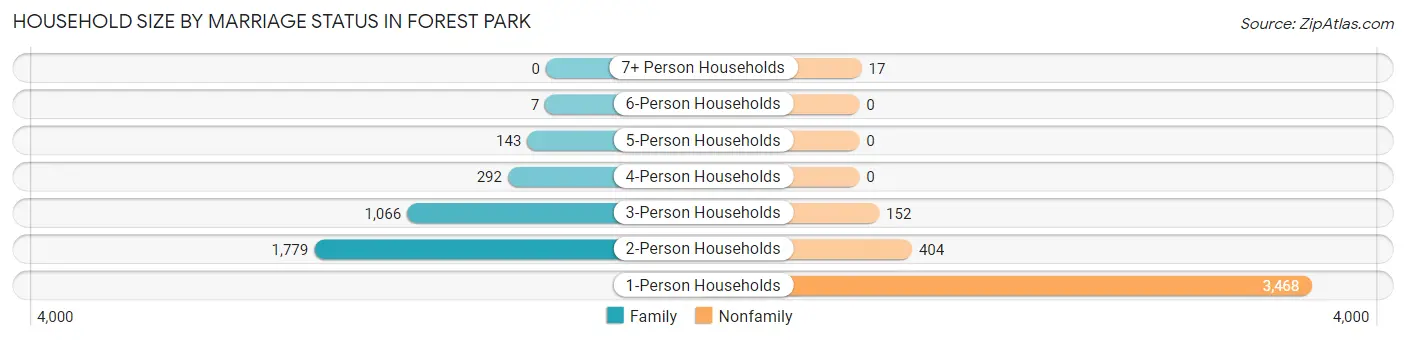
| Household Size | Family Households | Nonfamily Households |
| 1-Person Households | - | 3,468 (47.3%) |
| 2-Person Households | 1,779 (24.3%) | 404 (5.5%) |
| 3-Person Households | 1,066 (14.5%) | 152 (2.1%) |
| 4-Person Households | 292 (4.0%) | 0 (0.0%) |
| 5-Person Households | 143 (1.9%) | 0 (0.0%) |
| 6-Person Households | 7 (0.1%) | 0 (0.0%) |
| 7+ Person Households | 0 (0.0%) | 17 (0.2%) |
| Total | 3,287 (44.9%) | 4,041 (55.1%) |
Female Fertility in Forest Park
Fertility by Age in Forest Park
Average fertility rate in Forest Park is 67.0 births per 1,000 women. Women in the age bracket of 35 to 50 years have the highest fertility rate with 97.0 births per 1,000 women. Women in the age bracket of 35 to 50 years acount for 69.6% of all women with births.
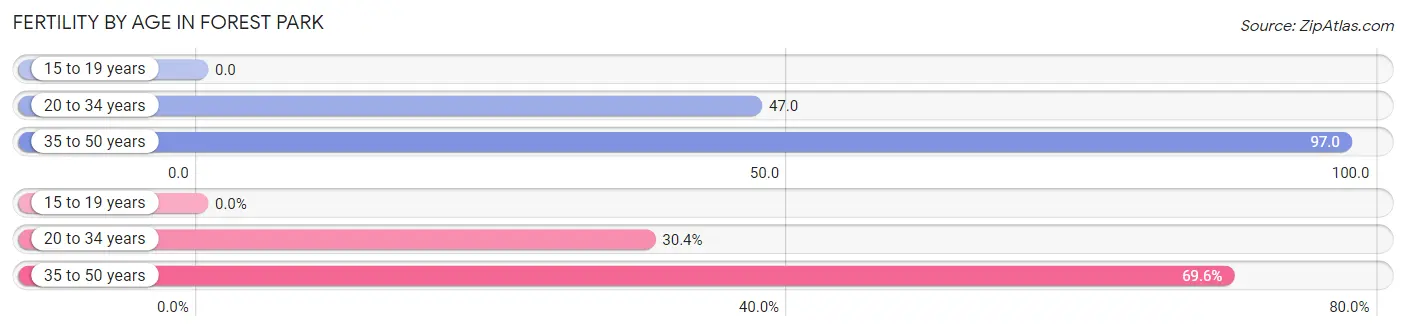
| Age Bracket | Women with Births | Births / 1,000 Women |
| 15 to 19 years | 0 (0.0%) | 0.0 |
| 20 to 34 years | 68 (30.4%) | 47.0 |
| 35 to 50 years | 156 (69.6%) | 97.0 |
| Total | 224 (100.0%) | 67.0 |
Fertility by Age by Marriage Status in Forest Park
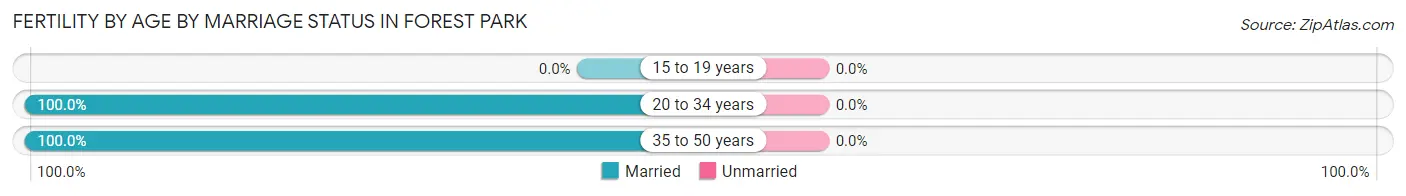
| Age Bracket | Married | Unmarried |
| 15 to 19 years | 0 (0.0%) | 0 (0.0%) |
| 20 to 34 years | 68 (100.0%) | 0 (0.0%) |
| 35 to 50 years | 156 (100.0%) | 0 (0.0%) |
| Total | 224 (100.0%) | 0 (0.0%) |
Fertility by Education in Forest Park
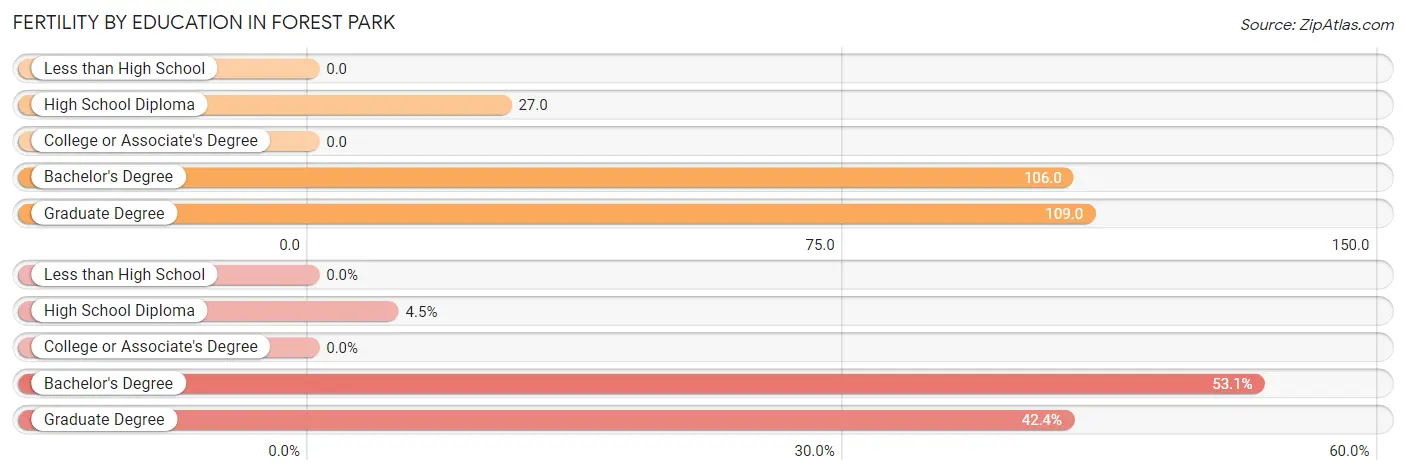
| Educational Attainment | Women with Births | Births / 1,000 Women |
| Less than High School | 0 (0.0%) | 0.0 |
| High School Diploma | 10 (4.5%) | 27.0 |
| College or Associate's Degree | 0 (0.0%) | 0.0 |
| Bachelor's Degree | 119 (53.1%) | 106.0 |
| Graduate Degree | 95 (42.4%) | 109.0 |
| Total | 224 (100.0%) | 67.0 |
Fertility by Education by Marriage Status in Forest Park
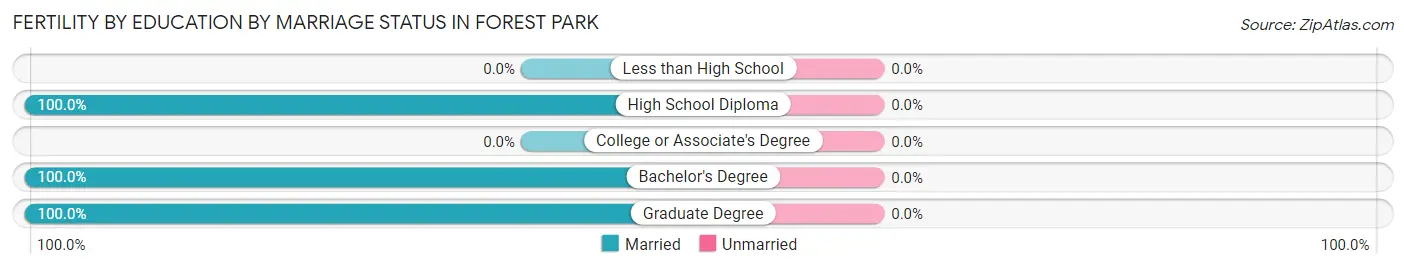
| Educational Attainment | Married | Unmarried |
| Less than High School | 0 (0.0%) | 0 (0.0%) |
| High School Diploma | 10 (100.0%) | 0 (0.0%) |
| College or Associate's Degree | 0 (0.0%) | 0 (0.0%) |
| Bachelor's Degree | 119 (100.0%) | 0 (0.0%) |
| Graduate Degree | 95 (100.0%) | 0 (0.0%) |
| Total | 224 (100.0%) | 0 (0.0%) |
Employment Characteristics in Forest Park
Employment by Class of Employer in Forest Park
Among the 8,017 employed individuals in Forest Park, private company employees (5,062 | 63.1%), not-for-profit organizations (938 | 11.7%), and self-employed (not incorporated) (503 | 6.3%) make up the most common classes of employment.
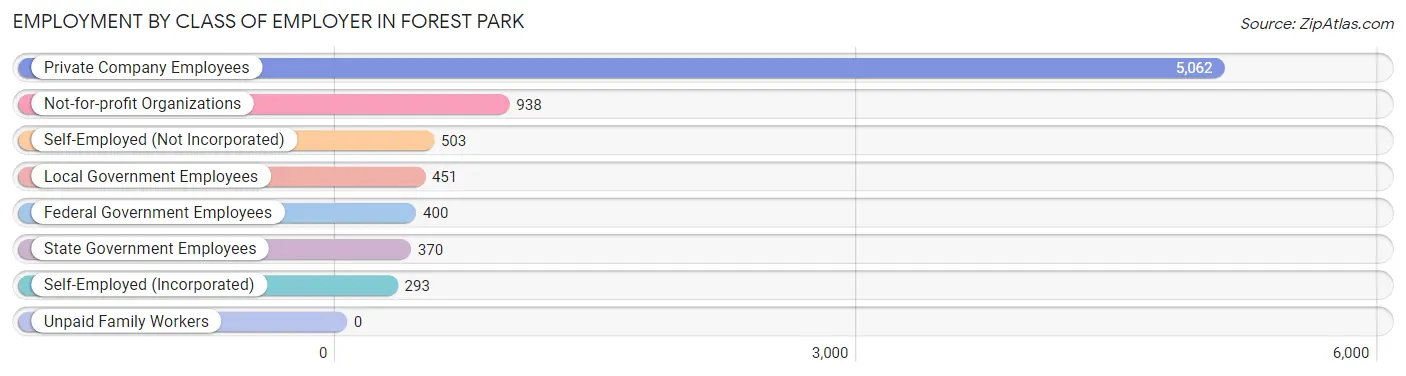
| Employer Class | # Employees | % Employees |
| Private Company Employees | 5,062 | 63.1% |
| Self-Employed (Incorporated) | 293 | 3.6% |
| Self-Employed (Not Incorporated) | 503 | 6.3% |
| Not-for-profit Organizations | 938 | 11.7% |
| Local Government Employees | 451 | 5.6% |
| State Government Employees | 370 | 4.6% |
| Federal Government Employees | 400 | 5.0% |
| Unpaid Family Workers | 0 | 0.0% |
| Total | 8,017 | 100.0% |
Employment Status by Age in Forest Park
According to the labor force statistics for Forest Park, out of the total population over 16 years of age (12,447), 68.5% or 8,526 individuals are in the labor force, with 4.9% or 418 of them unemployed. The age group with the highest labor force participation rate is 35 to 44 years, with 90.5% or 2,171 individuals in the labor force. Within the labor force, the 75 years and over age range has the highest percentage of unemployed individuals, with 21.3% or 19 of them being unemployed.
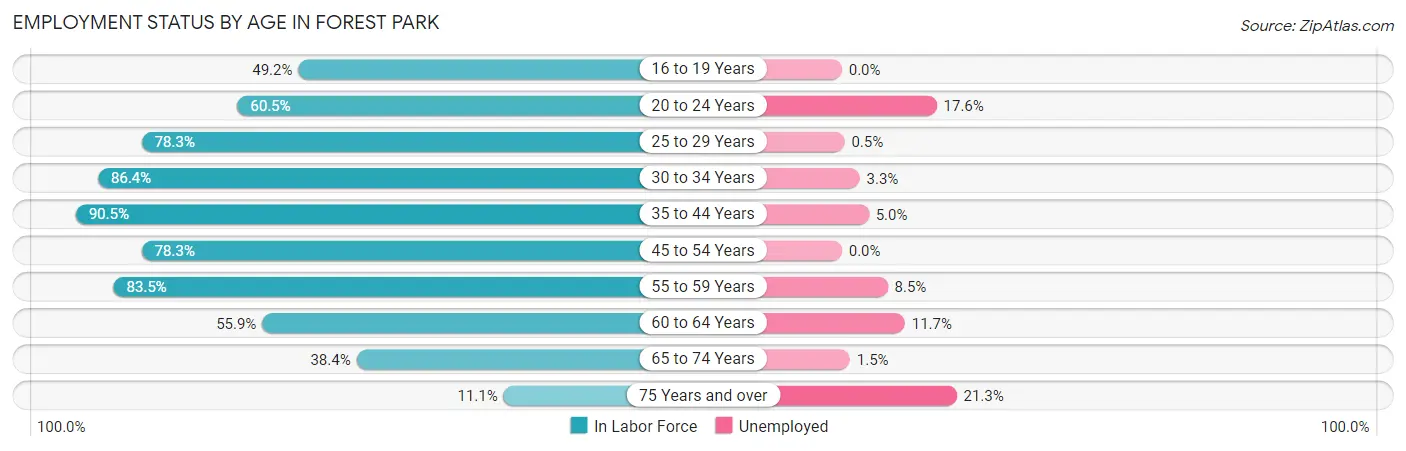
| Age Bracket | In Labor Force | Unemployed |
| 16 to 19 Years | 193 (49.2%) | 0 (0.0%) |
| 20 to 24 Years | 484 (60.5%) | 85 (17.6%) |
| 25 to 29 Years | 884 (78.3%) | 4 (0.5%) |
| 30 to 34 Years | 1,021 (86.4%) | 34 (3.3%) |
| 35 to 44 Years | 2,171 (90.5%) | 109 (5.0%) |
| 45 to 54 Years | 1,347 (78.3%) | 0 (0.0%) |
| 55 to 59 Years | 1,162 (83.5%) | 99 (8.5%) |
| 60 to 64 Years | 504 (55.9%) | 59 (11.7%) |
| 65 to 74 Years | 664 (38.4%) | 10 (1.5%) |
| 75 Years and over | 89 (11.1%) | 19 (21.3%) |
| Total | 8,526 (68.5%) | 418 (4.9%) |
Employment Status by Educational Attainment in Forest Park
According to labor force statistics for Forest Park, 81.3% of individuals (7,093) out of the total population between 25 and 64 years of age (8,724) are in the labor force, with 4.3% or 305 of them being unemployed. The group with the highest labor force participation rate are those with the educational attainment of bachelor's degree or higher, with 89.0% or 4,339 individuals in the labor force. Within the labor force, individuals with high school diploma education have the highest percentage of unemployment, with 10.9% or 89 of them being unemployed.
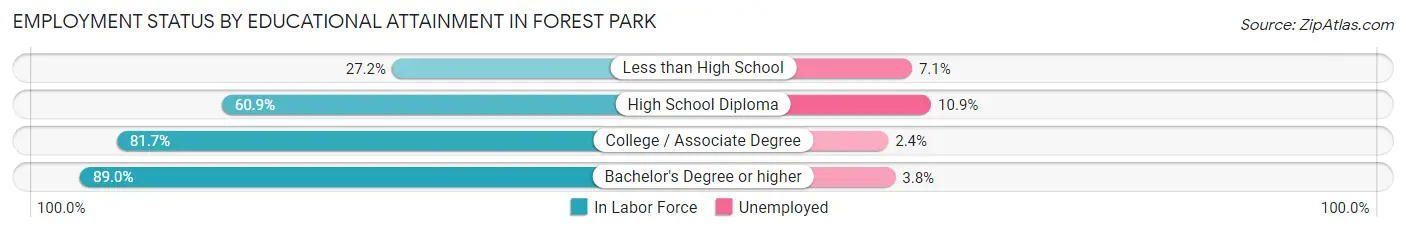
| Educational Attainment | In Labor Force | Unemployed |
| Less than High School | 56 (27.2%) | 15 (7.1%) |
| High School Diploma | 817 (60.9%) | 146 (10.9%) |
| College / Associate Degree | 1,881 (81.7%) | 55 (2.4%) |
| Bachelor's Degree or higher | 4,339 (89.0%) | 185 (3.8%) |
| Total | 7,093 (81.3%) | 375 (4.3%) |
Employment Occupations by Sex in Forest Park
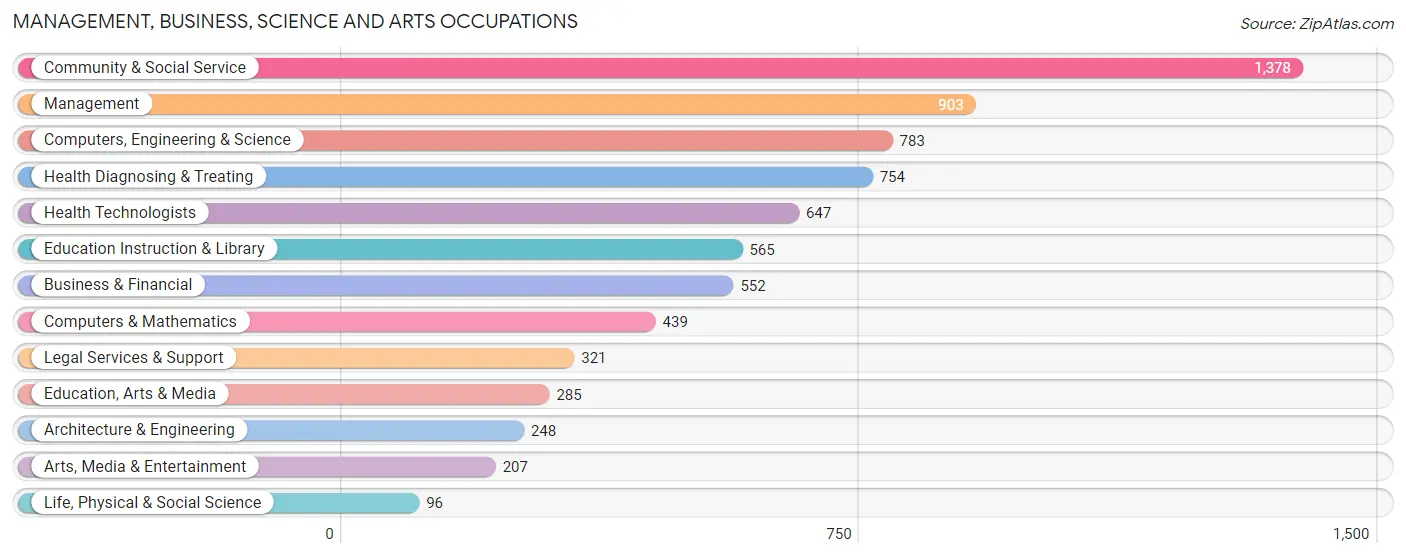
Management, Business, Science and Arts Occupations
The most common Management, Business, Science and Arts occupations in Forest Park are Community & Social Service (1,378 | 17.0%), Management (903 | 11.1%), Computers, Engineering & Science (783 | 9.7%), Health Diagnosing & Treating (754 | 9.3%), and Health Technologists (647 | 8.0%).
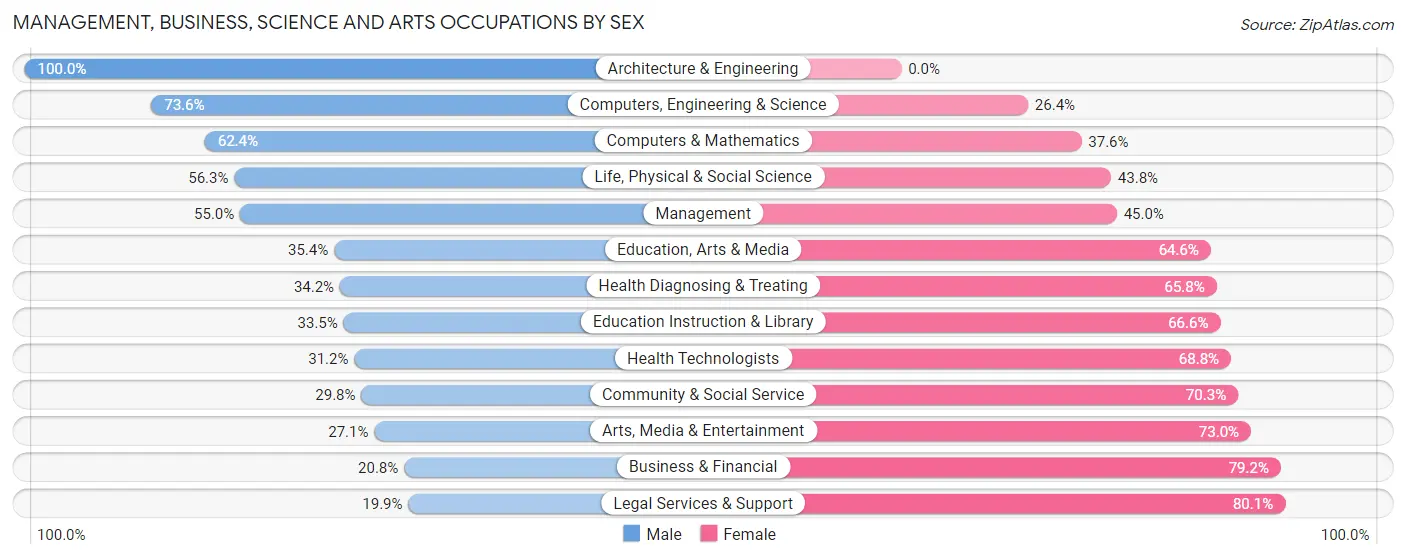
Management, Business, Science and Arts Occupations by Sex
Within the Management, Business, Science and Arts occupations in Forest Park, the most male-oriented occupations are Architecture & Engineering (100.0%), Computers, Engineering & Science (73.6%), and Computers & Mathematics (62.4%), while the most female-oriented occupations are Legal Services & Support (80.1%), Business & Financial (79.2%), and Arts, Media & Entertainment (73.0%).
| Occupation | Male | Female |
| Management | 497 (55.0%) | 406 (45.0%) |
| Business & Financial | 115 (20.8%) | 437 (79.2%) |
| Computers, Engineering & Science | 576 (73.6%) | 207 (26.4%) |
| Computers & Mathematics | 274 (62.4%) | 165 (37.6%) |
| Architecture & Engineering | 248 (100.0%) | 0 (0.0%) |
| Life, Physical & Social Science | 54 (56.2%) | 42 (43.8%) |
| Community & Social Service | 410 (29.7%) | 968 (70.3%) |
| Education, Arts & Media | 101 (35.4%) | 184 (64.6%) |
| Legal Services & Support | 64 (19.9%) | 257 (80.1%) |
| Education Instruction & Library | 189 (33.5%) | 376 (66.5%) |
| Arts, Media & Entertainment | 56 (27.1%) | 151 (73.0%) |
| Health Diagnosing & Treating | 258 (34.2%) | 496 (65.8%) |
| Health Technologists | 202 (31.2%) | 445 (68.8%) |
| Total (Category) | 1,856 (42.5%) | 2,514 (57.5%) |
| Total (Overall) | 4,025 (49.7%) | 4,078 (50.3%) |
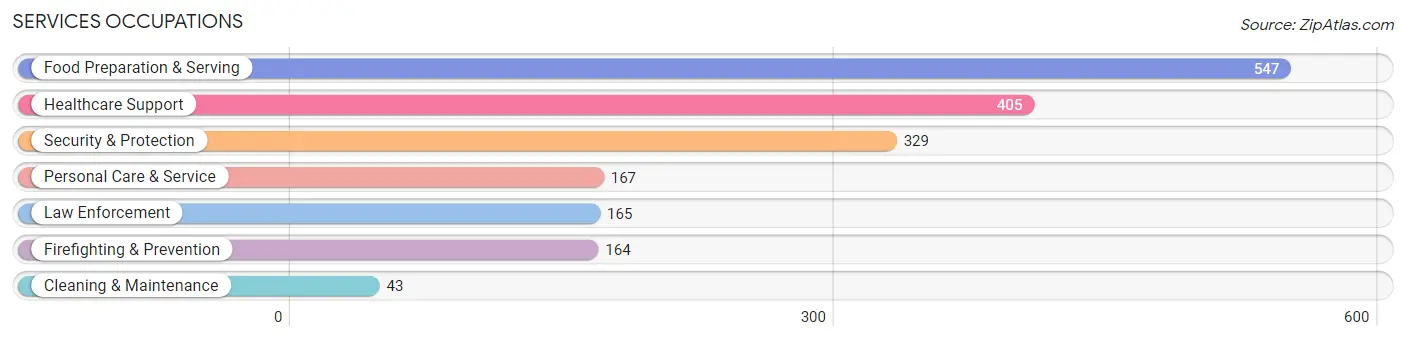
Services Occupations
The most common Services occupations in Forest Park are Food Preparation & Serving (547 | 6.8%), Healthcare Support (405 | 5.0%), Security & Protection (329 | 4.1%), Personal Care & Service (167 | 2.1%), and Law Enforcement (165 | 2.0%).
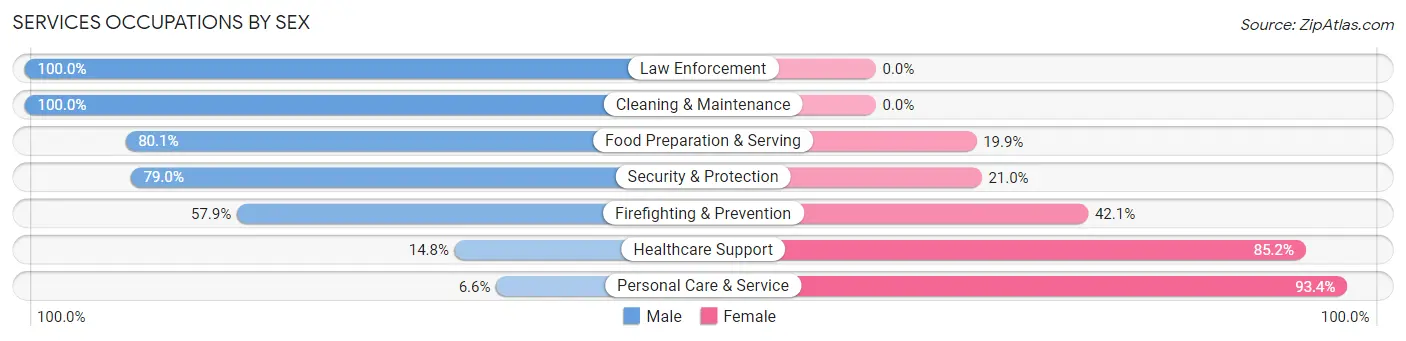
Services Occupations by Sex
Within the Services occupations in Forest Park, the most male-oriented occupations are Law Enforcement (100.0%), Cleaning & Maintenance (100.0%), and Food Preparation & Serving (80.1%), while the most female-oriented occupations are Personal Care & Service (93.4%), Healthcare Support (85.2%), and Firefighting & Prevention (42.1%).
| Occupation | Male | Female |
| Healthcare Support | 60 (14.8%) | 345 (85.2%) |
| Security & Protection | 260 (79.0%) | 69 (21.0%) |
| Firefighting & Prevention | 95 (57.9%) | 69 (42.1%) |
| Law Enforcement | 165 (100.0%) | 0 (0.0%) |
| Food Preparation & Serving | 438 (80.1%) | 109 (19.9%) |
| Cleaning & Maintenance | 43 (100.0%) | 0 (0.0%) |
| Personal Care & Service | 11 (6.6%) | 156 (93.4%) |
| Total (Category) | 812 (54.5%) | 679 (45.5%) |
| Total (Overall) | 4,025 (49.7%) | 4,078 (50.3%) |
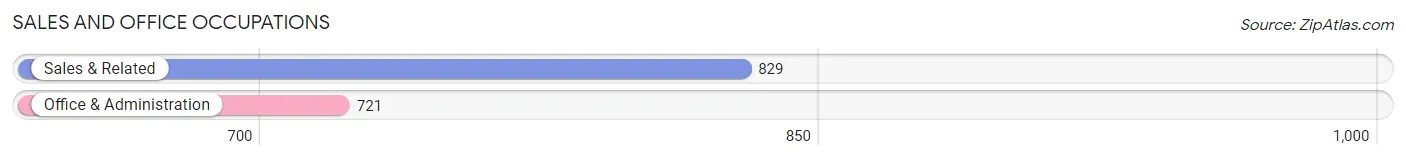
Sales and Office Occupations
The most common Sales and Office occupations in Forest Park are Sales & Related (829 | 10.2%), and Office & Administration (721 | 8.9%).
Sales and Office Occupations by Sex
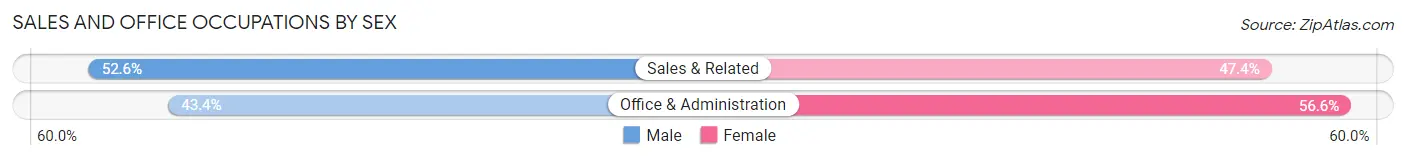
| Occupation | Male | Female |
| Sales & Related | 436 (52.6%) | 393 (47.4%) |
| Office & Administration | 313 (43.4%) | 408 (56.6%) |
| Total (Category) | 749 (48.3%) | 801 (51.7%) |
| Total (Overall) | 4,025 (49.7%) | 4,078 (50.3%) |
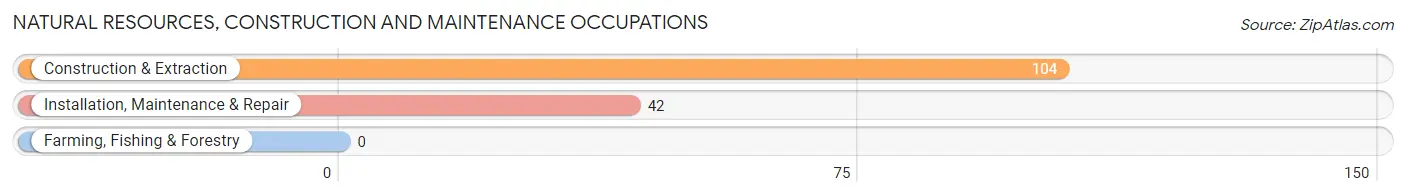
Natural Resources, Construction and Maintenance Occupations
The most common Natural Resources, Construction and Maintenance occupations in Forest Park are Construction & Extraction (104 | 1.3%), and Installation, Maintenance & Repair (42 | 0.5%).
Natural Resources, Construction and Maintenance Occupations by Sex
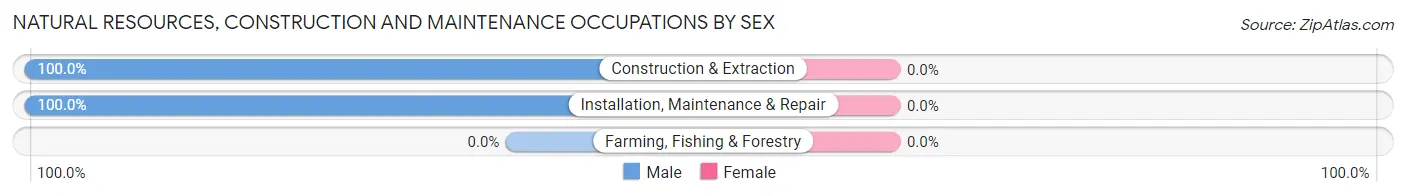
| Occupation | Male | Female |
| Farming, Fishing & Forestry | 0 (0.0%) | 0 (0.0%) |
| Construction & Extraction | 104 (100.0%) | 0 (0.0%) |
| Installation, Maintenance & Repair | 42 (100.0%) | 0 (0.0%) |
| Total (Category) | 146 (100.0%) | 0 (0.0%) |
| Total (Overall) | 4,025 (49.7%) | 4,078 (50.3%) |
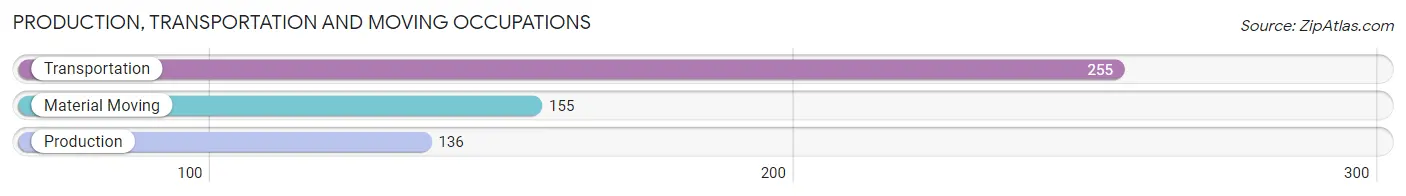
Production, Transportation and Moving Occupations
The most common Production, Transportation and Moving occupations in Forest Park are Transportation (255 | 3.2%), Material Moving (155 | 1.9%), and Production (136 | 1.7%).
Production, Transportation and Moving Occupations by Sex
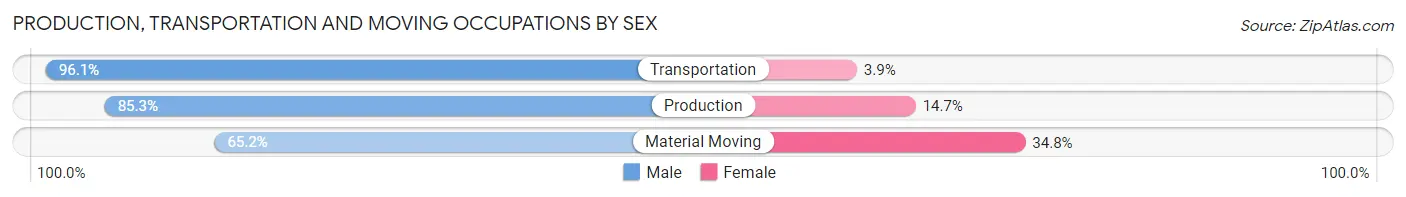
| Occupation | Male | Female |
| Production | 116 (85.3%) | 20 (14.7%) |
| Transportation | 245 (96.1%) | 10 (3.9%) |
| Material Moving | 101 (65.2%) | 54 (34.8%) |
| Total (Category) | 462 (84.6%) | 84 (15.4%) |
| Total (Overall) | 4,025 (49.7%) | 4,078 (50.3%) |
Employment Industries by Sex in Forest Park
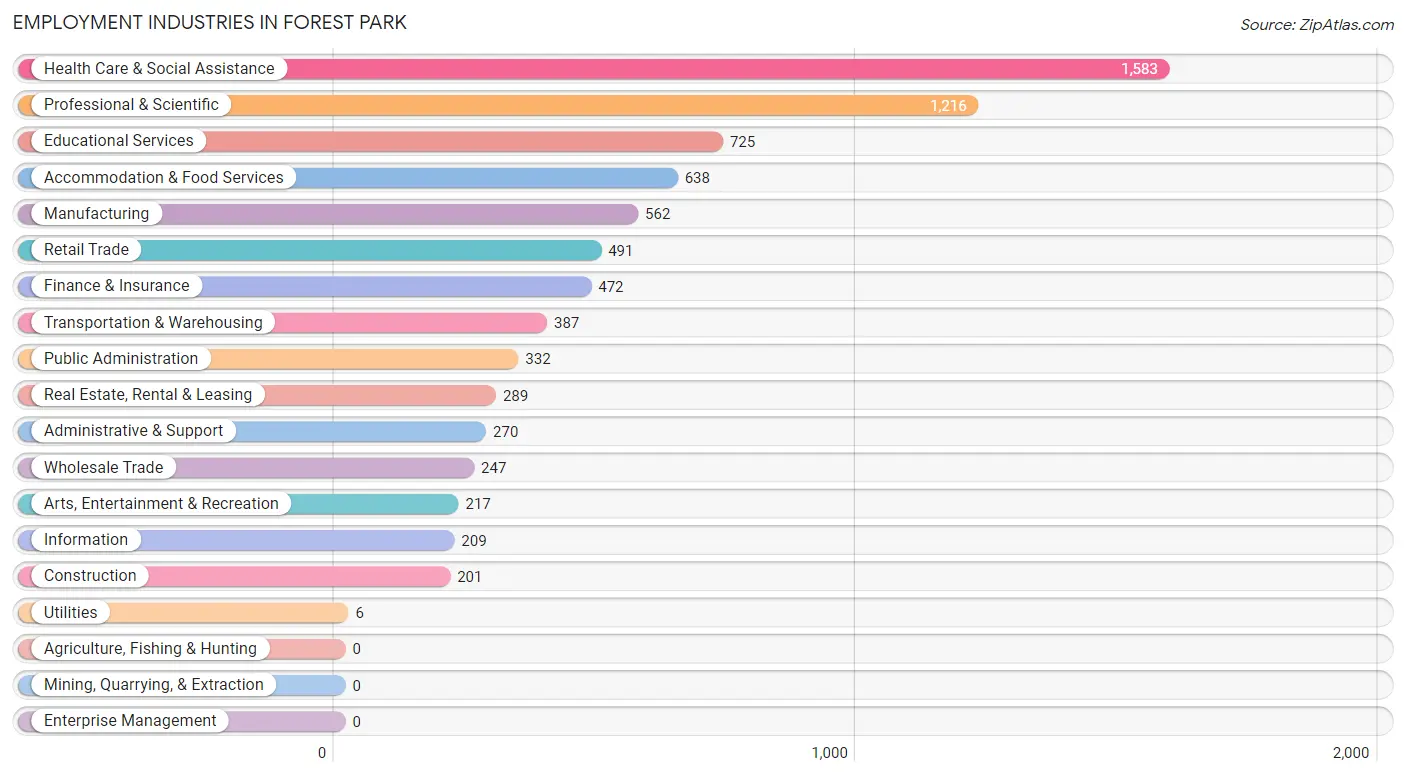
Employment Industries in Forest Park
The major employment industries in Forest Park include Health Care & Social Assistance (1,583 | 19.5%), Professional & Scientific (1,216 | 15.0%), Educational Services (725 | 8.9%), Accommodation & Food Services (638 | 7.9%), and Manufacturing (562 | 6.9%).
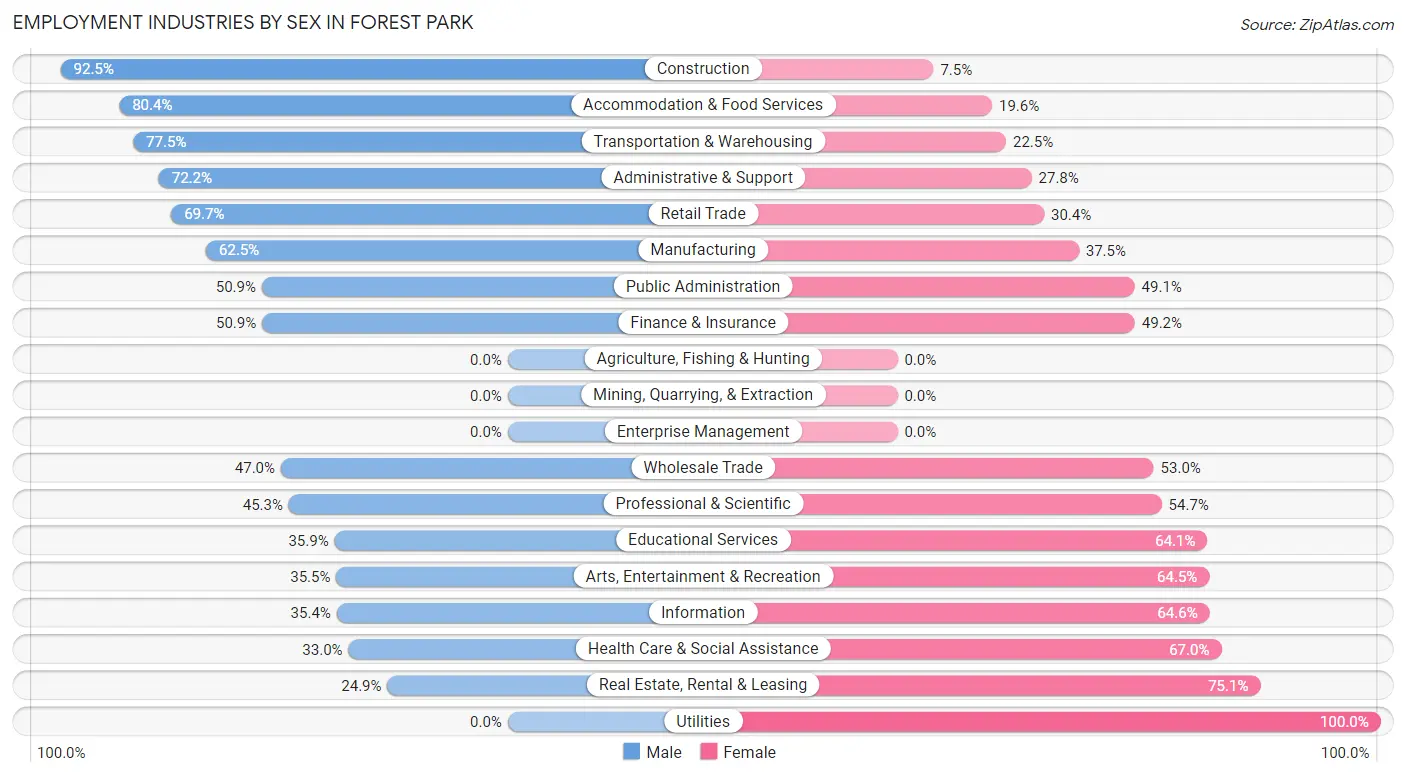
Employment Industries by Sex in Forest Park
The Forest Park industries that see more men than women are Construction (92.5%), Accommodation & Food Services (80.4%), and Transportation & Warehousing (77.5%), whereas the industries that tend to have a higher number of women are Utilities (100.0%), Real Estate, Rental & Leasing (75.1%), and Health Care & Social Assistance (67.0%).
| Industry | Male | Female |
| Agriculture, Fishing & Hunting | 0 (0.0%) | 0 (0.0%) |
| Mining, Quarrying, & Extraction | 0 (0.0%) | 0 (0.0%) |
| Construction | 186 (92.5%) | 15 (7.5%) |
| Manufacturing | 351 (62.5%) | 211 (37.5%) |
| Wholesale Trade | 116 (47.0%) | 131 (53.0%) |
| Retail Trade | 342 (69.7%) | 149 (30.3%) |
| Transportation & Warehousing | 300 (77.5%) | 87 (22.5%) |
| Utilities | 0 (0.0%) | 6 (100.0%) |
| Information | 74 (35.4%) | 135 (64.6%) |
| Finance & Insurance | 240 (50.8%) | 232 (49.1%) |
| Real Estate, Rental & Leasing | 72 (24.9%) | 217 (75.1%) |
| Professional & Scientific | 551 (45.3%) | 665 (54.7%) |
| Enterprise Management | 0 (0.0%) | 0 (0.0%) |
| Administrative & Support | 195 (72.2%) | 75 (27.8%) |
| Educational Services | 260 (35.9%) | 465 (64.1%) |
| Health Care & Social Assistance | 522 (33.0%) | 1,061 (67.0%) |
| Arts, Entertainment & Recreation | 77 (35.5%) | 140 (64.5%) |
| Accommodation & Food Services | 513 (80.4%) | 125 (19.6%) |
| Public Administration | 169 (50.9%) | 163 (49.1%) |
| Total | 4,025 (49.7%) | 4,078 (50.3%) |
Education in Forest Park
School Enrollment in Forest Park
The most common levels of schooling among the 2,416 students in Forest Park are college / undergraduate (619 | 25.6%), high school (471 | 19.5%), and graduate / professional (441 | 18.2%).
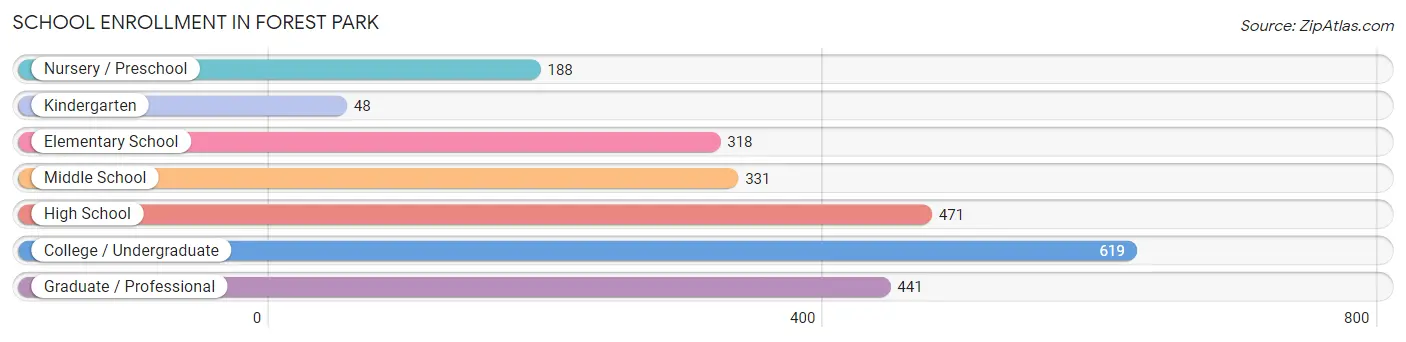
| School Level | # Students | % Students |
| Nursery / Preschool | 188 | 7.8% |
| Kindergarten | 48 | 2.0% |
| Elementary School | 318 | 13.2% |
| Middle School | 331 | 13.7% |
| High School | 471 | 19.5% |
| College / Undergraduate | 619 | 25.6% |
| Graduate / Professional | 441 | 18.2% |
| Total | 2,416 | 100.0% |
School Enrollment by Age by Funding Source in Forest Park
Out of a total of 2,416 students who are enrolled in schools in Forest Park, 952 (39.4%) attend a private institution, while the remaining 1,464 (60.6%) are enrolled in public schools. The age group of 18 to 19 year olds has the highest likelihood of being enrolled in private schools, with 7 (100.0% in the age bracket) enrolled. Conversely, the age group of 10 to 14 year olds has the lowest likelihood of being enrolled in a private school, with 414 (83.8% in the age bracket) attending a public institution.
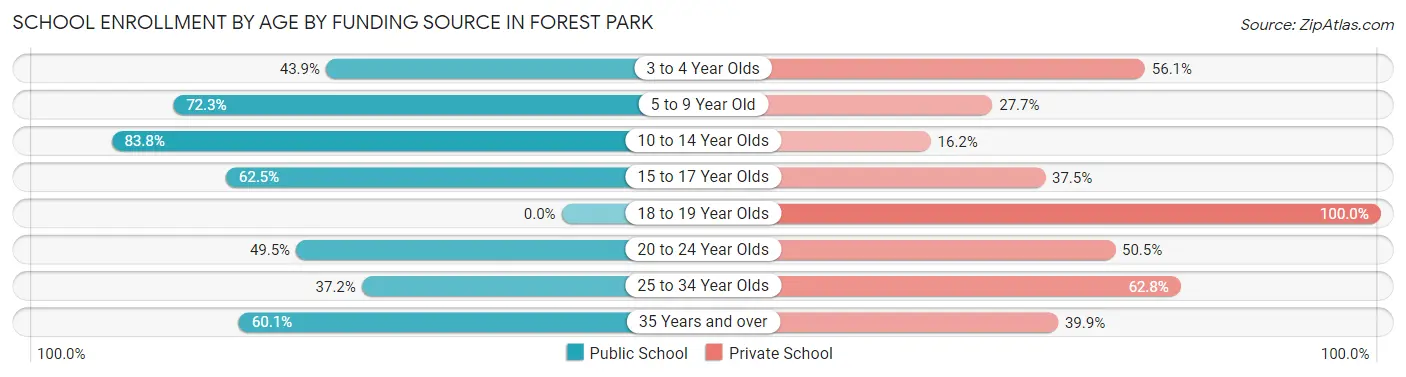
| Age Bracket | Public School | Private School |
| 3 to 4 Year Olds | 54 (43.9%) | 69 (56.1%) |
| 5 to 9 Year Old | 282 (72.3%) | 108 (27.7%) |
| 10 to 14 Year Olds | 414 (83.8%) | 80 (16.2%) |
| 15 to 17 Year Olds | 200 (62.5%) | 120 (37.5%) |
| 18 to 19 Year Olds | 0 (0.0%) | 7 (100.0%) |
| 20 to 24 Year Olds | 229 (49.5%) | 234 (50.5%) |
| 25 to 34 Year Olds | 140 (37.2%) | 236 (62.8%) |
| 35 Years and over | 146 (60.1%) | 97 (39.9%) |
| Total | 1,464 (60.6%) | 952 (39.4%) |
Educational Attainment by Field of Study in Forest Park
Business (1,160 | 17.9%), science & technology (638 | 9.9%), arts & humanities (567 | 8.8%), education (533 | 8.2%), and social sciences (519 | 8.0%) are the most common fields of study among 6,469 individuals in Forest Park who have obtained a bachelor's degree or higher.
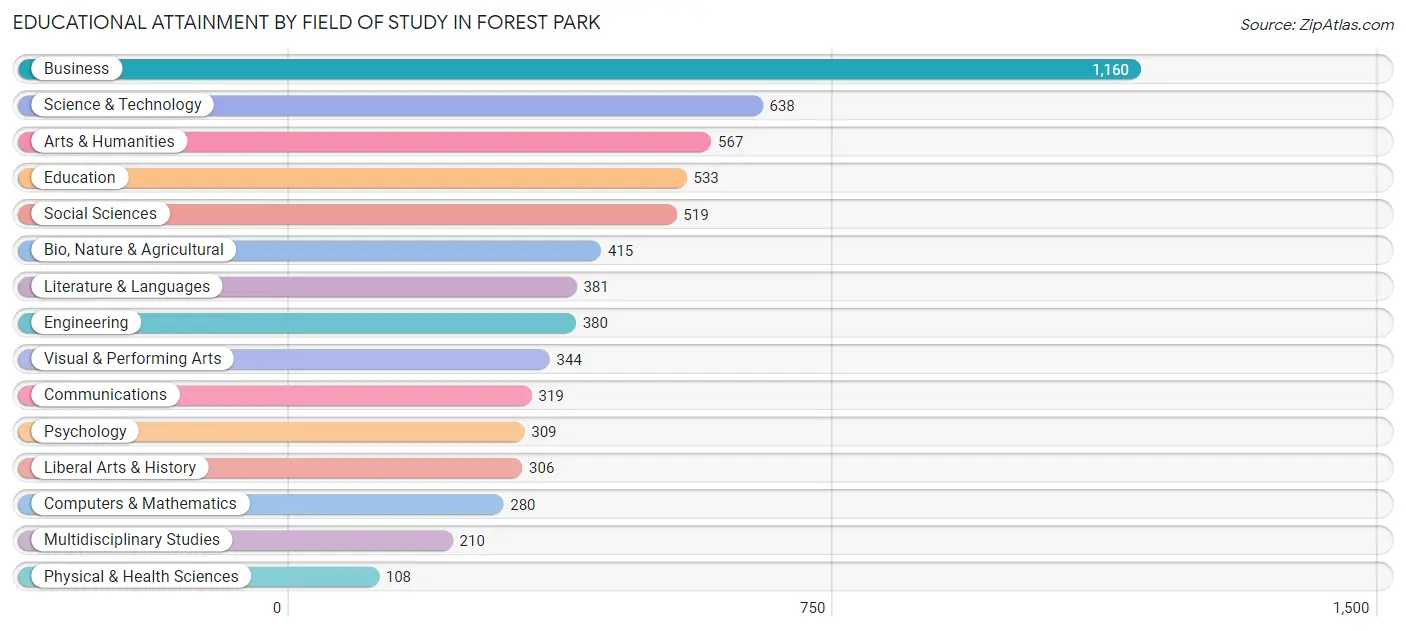
| Field of Study | # Graduates | % Graduates |
| Computers & Mathematics | 280 | 4.3% |
| Bio, Nature & Agricultural | 415 | 6.4% |
| Physical & Health Sciences | 108 | 1.7% |
| Psychology | 309 | 4.8% |
| Social Sciences | 519 | 8.0% |
| Engineering | 380 | 5.9% |
| Multidisciplinary Studies | 210 | 3.3% |
| Science & Technology | 638 | 9.9% |
| Business | 1,160 | 17.9% |
| Education | 533 | 8.2% |
| Literature & Languages | 381 | 5.9% |
| Liberal Arts & History | 306 | 4.7% |
| Visual & Performing Arts | 344 | 5.3% |
| Communications | 319 | 4.9% |
| Arts & Humanities | 567 | 8.8% |
| Total | 6,469 | 100.0% |
Transportation & Commute in Forest Park
Vehicle Availability by Sex in Forest Park
The most prevalent vehicle ownership categories in Forest Park are males with 1 vehicle (1,849, accounting for 46.5%) and females with 1 vehicle (1,943, making up 45.8%).
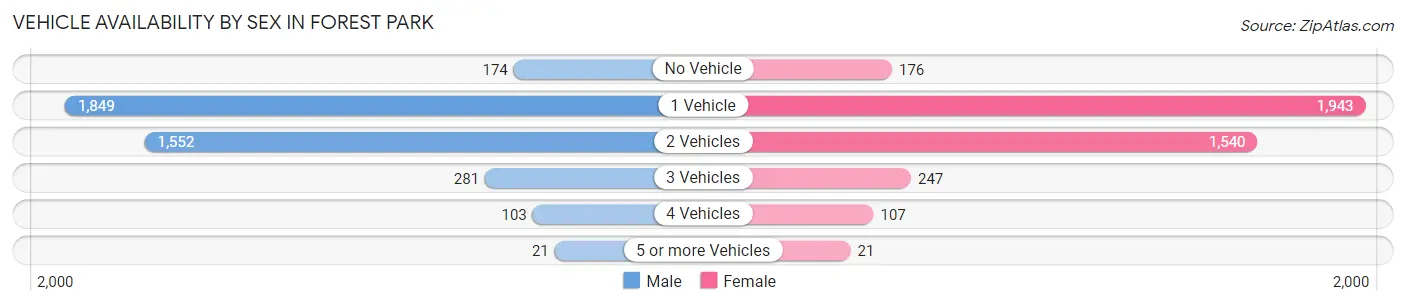
| Vehicles Available | Male | Female |
| No Vehicle | 174 (4.4%) | 176 (4.4%) |
| 1 Vehicle | 1,849 (46.5%) | 1,943 (48.2%) |
| 2 Vehicles | 1,552 (39.0%) | 1,540 (38.2%) |
| 3 Vehicles | 281 (7.1%) | 247 (6.1%) |
| 4 Vehicles | 103 (2.6%) | 107 (2.6%) |
| 5 or more Vehicles | 21 (0.5%) | 21 (0.5%) |
| Total | 3,980 (100.0%) | 4,034 (100.0%) |
Commute Time in Forest Park
The most frequently occuring commute durations in Forest Park are 30 to 34 minutes (1,094 commuters, 16.6%), 45 to 59 minutes (987 commuters, 14.9%), and 20 to 24 minutes (816 commuters, 12.4%).
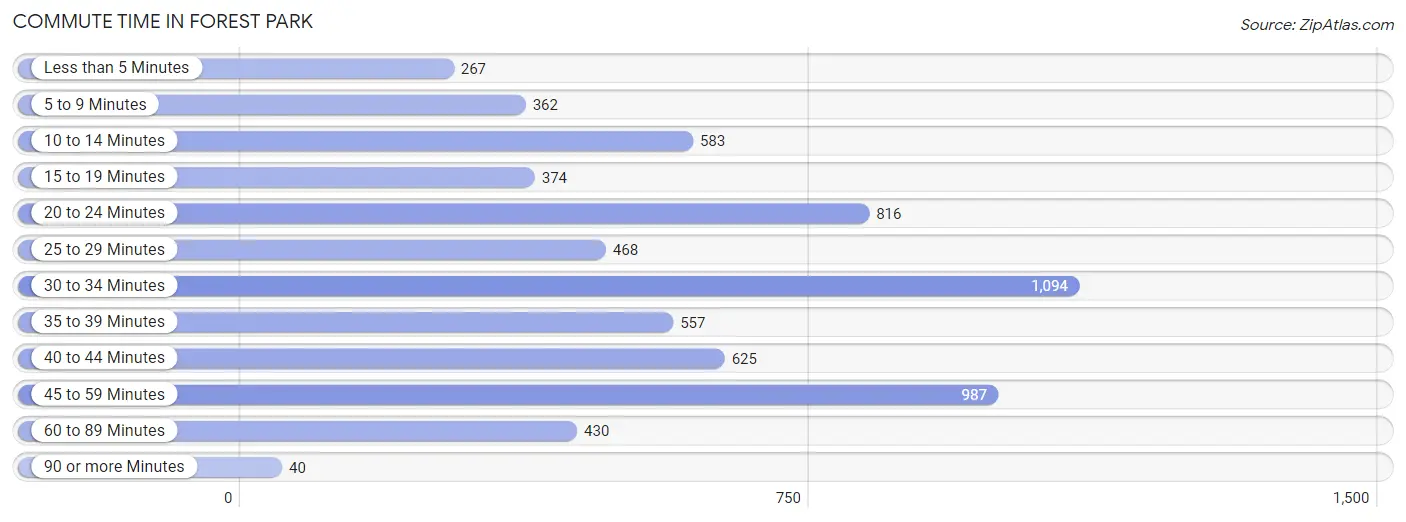
| Commute Time | # Commuters | % Commuters |
| Less than 5 Minutes | 267 | 4.0% |
| 5 to 9 Minutes | 362 | 5.5% |
| 10 to 14 Minutes | 583 | 8.8% |
| 15 to 19 Minutes | 374 | 5.7% |
| 20 to 24 Minutes | 816 | 12.4% |
| 25 to 29 Minutes | 468 | 7.1% |
| 30 to 34 Minutes | 1,094 | 16.6% |
| 35 to 39 Minutes | 557 | 8.4% |
| 40 to 44 Minutes | 625 | 9.5% |
| 45 to 59 Minutes | 987 | 14.9% |
| 60 to 89 Minutes | 430 | 6.5% |
| 90 or more Minutes | 40 | 0.6% |
Commute Time by Sex in Forest Park
The most common commute times in Forest Park are 45 to 59 minutes (521 commuters, 15.9%) for males and 30 to 34 minutes (604 commuters, 18.1%) for females.
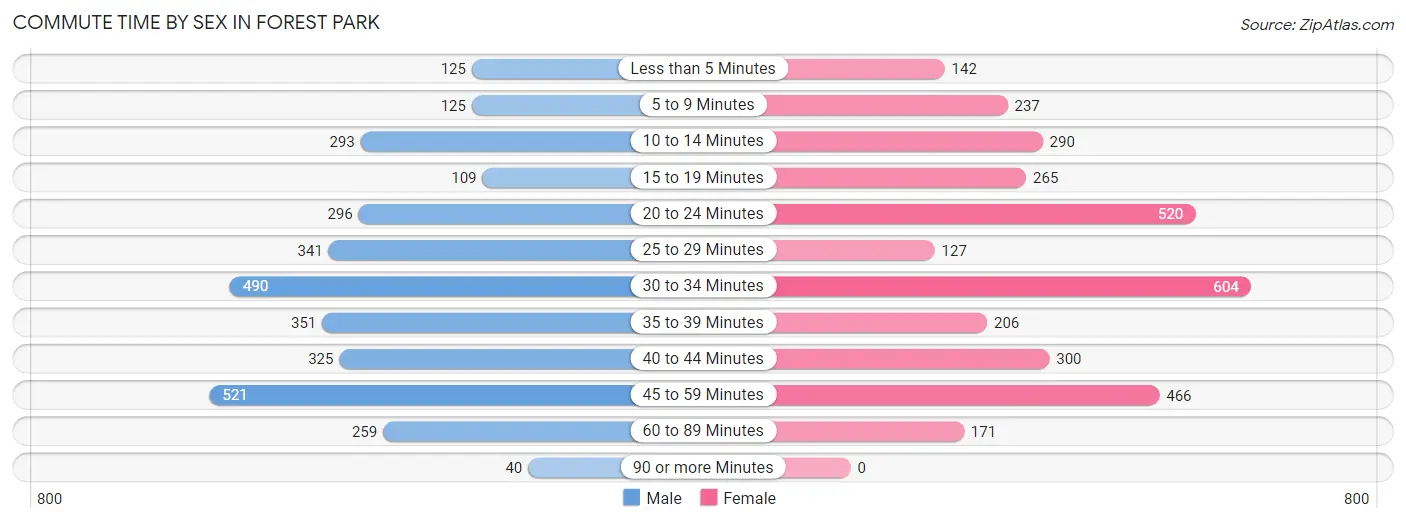
| Commute Time | Male | Female |
| Less than 5 Minutes | 125 (3.8%) | 142 (4.3%) |
| 5 to 9 Minutes | 125 (3.8%) | 237 (7.1%) |
| 10 to 14 Minutes | 293 (8.9%) | 290 (8.7%) |
| 15 to 19 Minutes | 109 (3.3%) | 265 (8.0%) |
| 20 to 24 Minutes | 296 (9.0%) | 520 (15.6%) |
| 25 to 29 Minutes | 341 (10.4%) | 127 (3.8%) |
| 30 to 34 Minutes | 490 (15.0%) | 604 (18.1%) |
| 35 to 39 Minutes | 351 (10.7%) | 206 (6.2%) |
| 40 to 44 Minutes | 325 (9.9%) | 300 (9.0%) |
| 45 to 59 Minutes | 521 (15.9%) | 466 (14.0%) |
| 60 to 89 Minutes | 259 (7.9%) | 171 (5.1%) |
| 90 or more Minutes | 40 (1.2%) | 0 (0.0%) |
Time of Departure to Work by Sex in Forest Park
The most frequent times of departure to work in Forest Park are 8:00 AM to 8:29 AM (628, 19.2%) for males and 7:00 AM to 7:29 AM (524, 15.8%) for females.
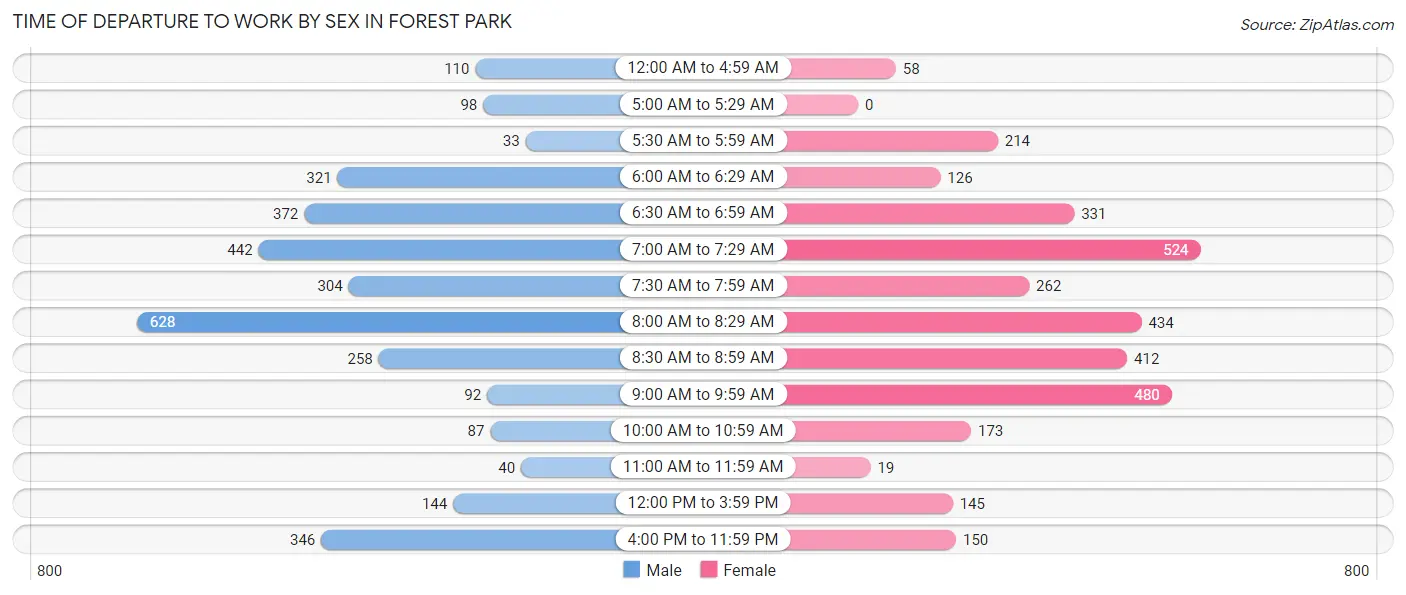
| Time of Departure | Male | Female |
| 12:00 AM to 4:59 AM | 110 (3.4%) | 58 (1.7%) |
| 5:00 AM to 5:29 AM | 98 (3.0%) | 0 (0.0%) |
| 5:30 AM to 5:59 AM | 33 (1.0%) | 214 (6.4%) |
| 6:00 AM to 6:29 AM | 321 (9.8%) | 126 (3.8%) |
| 6:30 AM to 6:59 AM | 372 (11.4%) | 331 (10.0%) |
| 7:00 AM to 7:29 AM | 442 (13.5%) | 524 (15.8%) |
| 7:30 AM to 7:59 AM | 304 (9.3%) | 262 (7.9%) |
| 8:00 AM to 8:29 AM | 628 (19.2%) | 434 (13.0%) |
| 8:30 AM to 8:59 AM | 258 (7.9%) | 412 (12.4%) |
| 9:00 AM to 9:59 AM | 92 (2.8%) | 480 (14.4%) |
| 10:00 AM to 10:59 AM | 87 (2.7%) | 173 (5.2%) |
| 11:00 AM to 11:59 AM | 40 (1.2%) | 19 (0.6%) |
| 12:00 PM to 3:59 PM | 144 (4.4%) | 145 (4.4%) |
| 4:00 PM to 11:59 PM | 346 (10.6%) | 150 (4.5%) |
| Total | 3,275 (100.0%) | 3,328 (100.0%) |
Housing Occupancy in Forest Park
Occupancy by Ownership in Forest Park
Of the total 7,328 dwellings in Forest Park, owner-occupied units account for 4,044 (55.2%), while renter-occupied units make up 3,284 (44.8%).
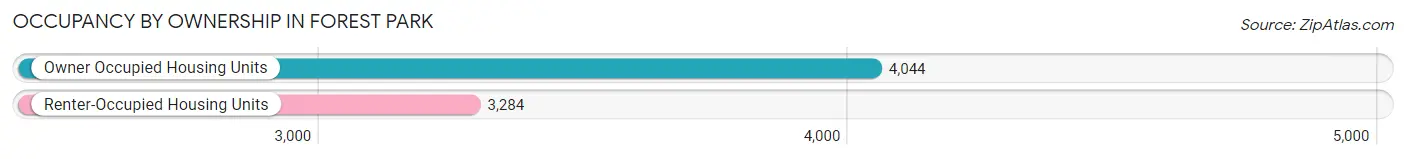
| Occupancy | # Housing Units | % Housing Units |
| Owner Occupied Housing Units | 4,044 | 55.2% |
| Renter-Occupied Housing Units | 3,284 | 44.8% |
| Total Occupied Housing Units | 7,328 | 100.0% |
Occupancy by Household Size in Forest Park
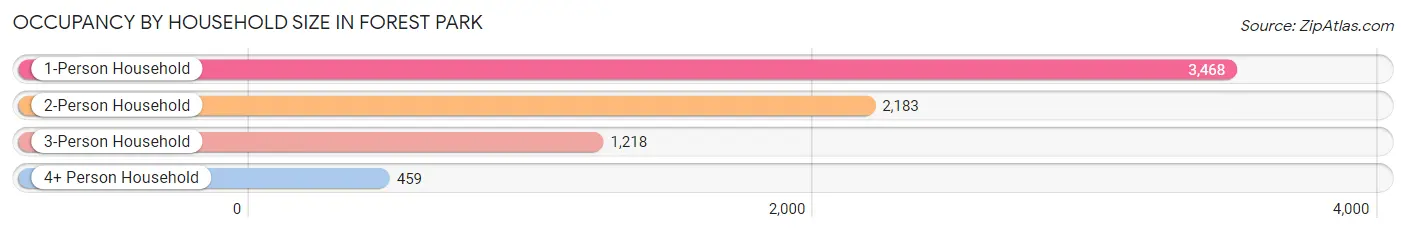
| Household Size | # Housing Units | % Housing Units |
| 1-Person Household | 3,468 | 47.3% |
| 2-Person Household | 2,183 | 29.8% |
| 3-Person Household | 1,218 | 16.6% |
| 4+ Person Household | 459 | 6.3% |
| Total Housing Units | 7,328 | 100.0% |
Occupancy by Ownership by Household Size in Forest Park

| Household Size | Owner-occupied | Renter-occupied |
| 1-Person Household | 1,645 (47.4%) | 1,823 (52.6%) |
| 2-Person Household | 1,262 (57.8%) | 921 (42.2%) |
| 3-Person Household | 733 (60.2%) | 485 (39.8%) |
| 4+ Person Household | 404 (88.0%) | 55 (12.0%) |
| Total Housing Units | 4,044 (55.2%) | 3,284 (44.8%) |
Occupancy by Educational Attainment in Forest Park
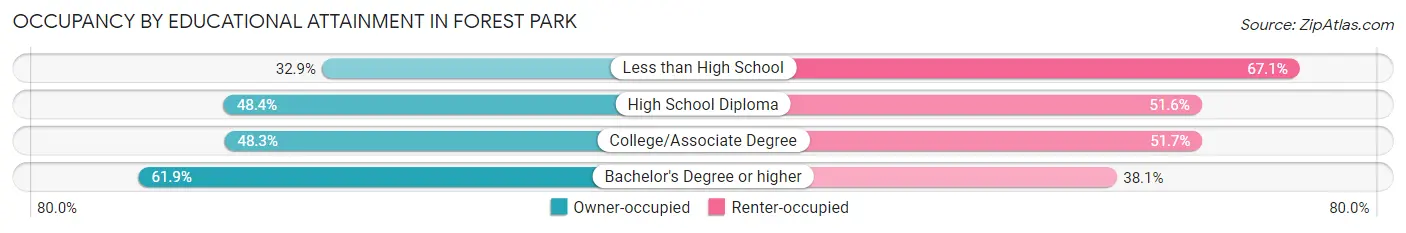
| Household Size | Owner-occupied | Renter-occupied |
| Less than High School | 46 (32.9%) | 94 (67.1%) |
| High School Diploma | 586 (48.4%) | 625 (51.6%) |
| College/Associate Degree | 1,022 (48.3%) | 1,095 (51.7%) |
| Bachelor's Degree or higher | 2,390 (61.9%) | 1,470 (38.1%) |
Occupancy by Age of Householder in Forest Park
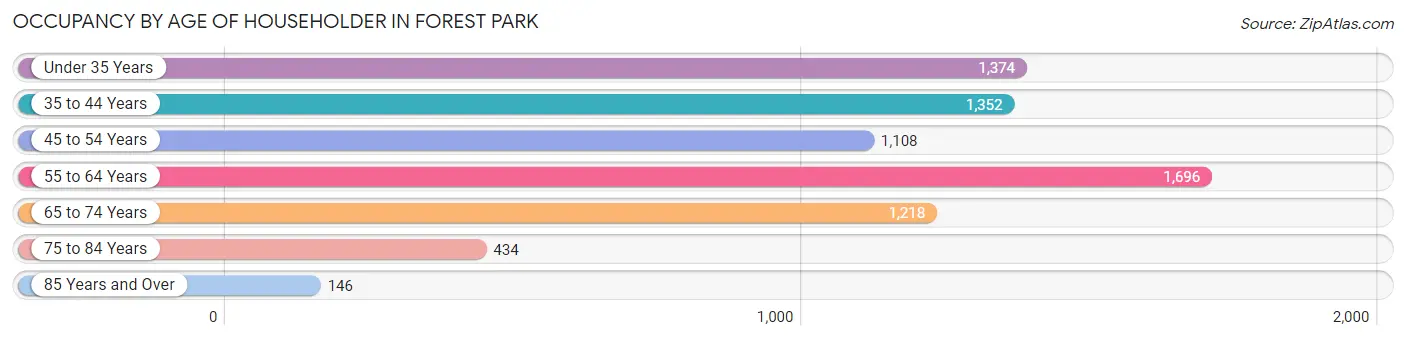
| Age Bracket | # Households | % Households |
| Under 35 Years | 1,374 | 18.8% |
| 35 to 44 Years | 1,352 | 18.4% |
| 45 to 54 Years | 1,108 | 15.1% |
| 55 to 64 Years | 1,696 | 23.1% |
| 65 to 74 Years | 1,218 | 16.6% |
| 75 to 84 Years | 434 | 5.9% |
| 85 Years and Over | 146 | 2.0% |
| Total | 7,328 | 100.0% |
Housing Finances in Forest Park
Median Income by Occupancy in Forest Park
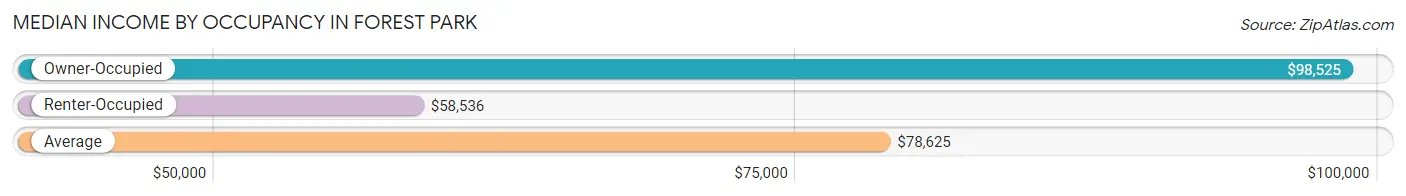
| Occupancy Type | # Households | Median Income |
| Owner-Occupied | 4,044 (55.2%) | $98,525 |
| Renter-Occupied | 3,284 (44.8%) | $58,536 |
| Average | 7,328 (100.0%) | $78,625 |
Occupancy by Householder Income Bracket in Forest Park
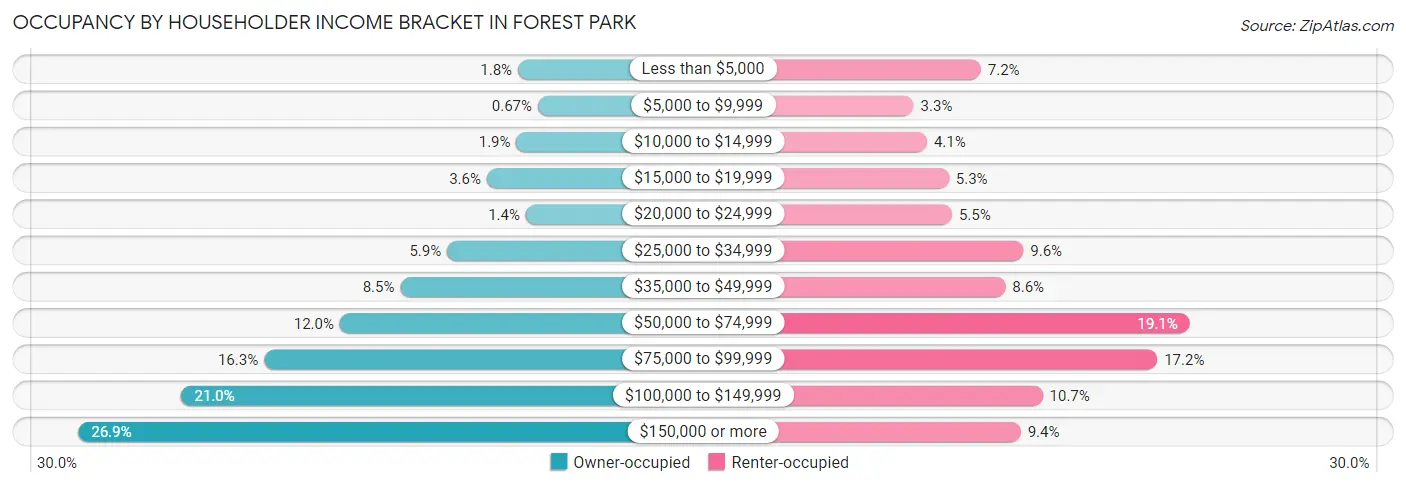
| Income Bracket | Owner-occupied | Renter-occupied |
| Less than $5,000 | 73 (1.8%) | 235 (7.2%) |
| $5,000 to $9,999 | 27 (0.7%) | 109 (3.3%) |
| $10,000 to $14,999 | 77 (1.9%) | 134 (4.1%) |
| $15,000 to $19,999 | 145 (3.6%) | 175 (5.3%) |
| $20,000 to $24,999 | 55 (1.4%) | 181 (5.5%) |
| $25,000 to $34,999 | 237 (5.9%) | 315 (9.6%) |
| $35,000 to $49,999 | 345 (8.5%) | 281 (8.6%) |
| $50,000 to $74,999 | 485 (12.0%) | 627 (19.1%) |
| $75,000 to $99,999 | 660 (16.3%) | 566 (17.2%) |
| $100,000 to $149,999 | 851 (21.0%) | 351 (10.7%) |
| $150,000 or more | 1,089 (26.9%) | 310 (9.4%) |
| Total | 4,044 (100.0%) | 3,284 (100.0%) |
Monthly Housing Cost Tiers in Forest Park
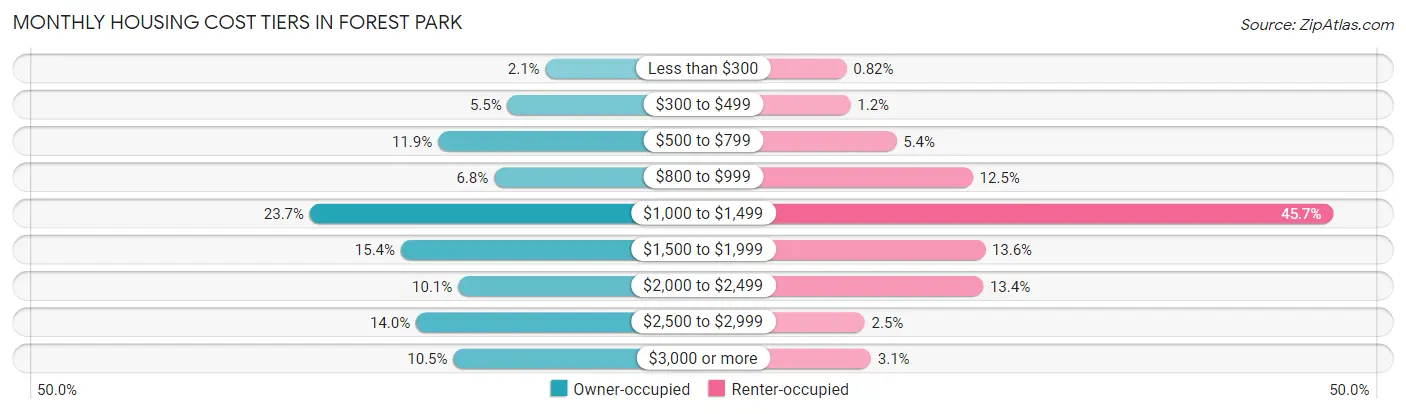
| Monthly Cost | Owner-occupied | Renter-occupied |
| Less than $300 | 83 (2.1%) | 27 (0.8%) |
| $300 to $499 | 224 (5.5%) | 39 (1.2%) |
| $500 to $799 | 483 (11.9%) | 178 (5.4%) |
| $800 to $999 | 274 (6.8%) | 409 (12.4%) |
| $1,000 to $1,499 | 960 (23.7%) | 1,499 (45.7%) |
| $1,500 to $1,999 | 621 (15.4%) | 446 (13.6%) |
| $2,000 to $2,499 | 408 (10.1%) | 440 (13.4%) |
| $2,500 to $2,999 | 565 (14.0%) | 82 (2.5%) |
| $3,000 or more | 426 (10.5%) | 101 (3.1%) |
| Total | 4,044 (100.0%) | 3,284 (100.0%) |
Physical Housing Characteristics in Forest Park
Housing Structures in Forest Park
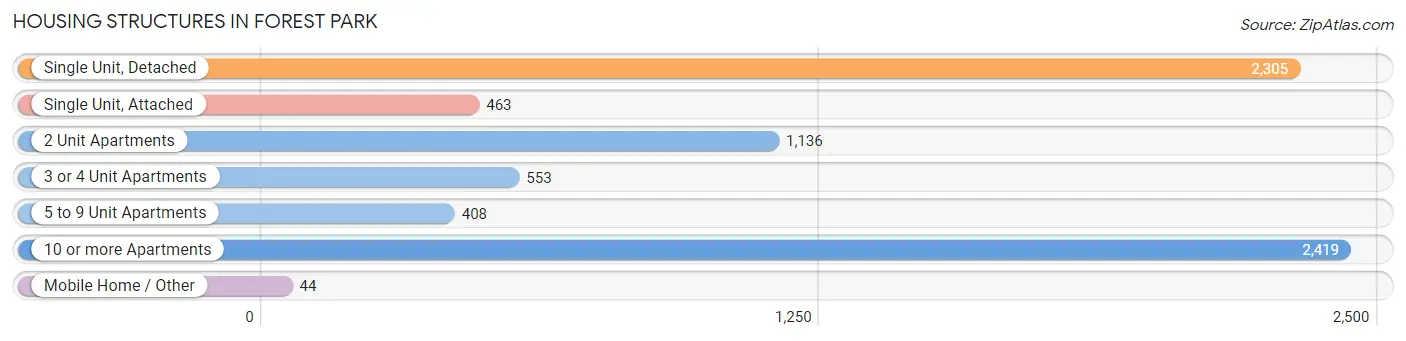
| Structure Type | # Housing Units | % Housing Units |
| Single Unit, Detached | 2,305 | 31.5% |
| Single Unit, Attached | 463 | 6.3% |
| 2 Unit Apartments | 1,136 | 15.5% |
| 3 or 4 Unit Apartments | 553 | 7.5% |
| 5 to 9 Unit Apartments | 408 | 5.6% |
| 10 or more Apartments | 2,419 | 33.0% |
| Mobile Home / Other | 44 | 0.6% |
| Total | 7,328 | 100.0% |
Housing Structures by Occupancy in Forest Park
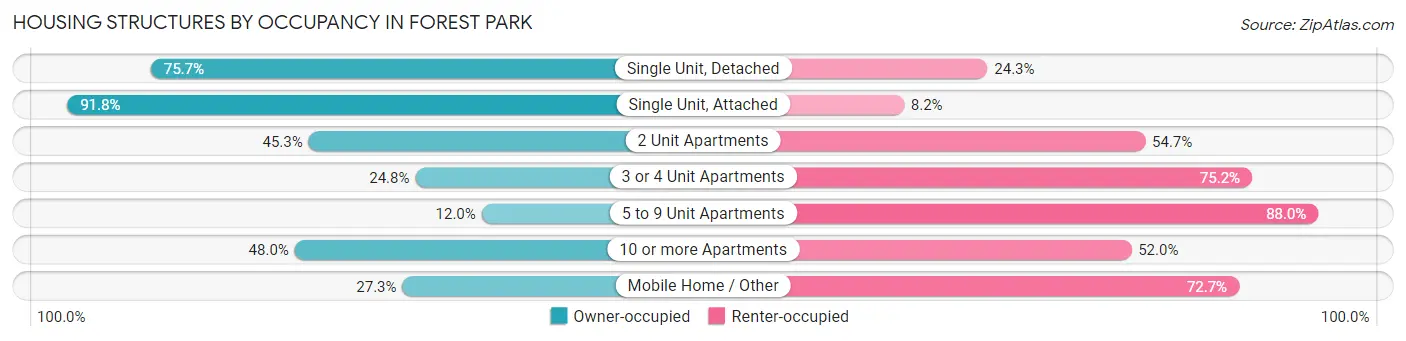
| Structure Type | Owner-occupied | Renter-occupied |
| Single Unit, Detached | 1,745 (75.7%) | 560 (24.3%) |
| Single Unit, Attached | 425 (91.8%) | 38 (8.2%) |
| 2 Unit Apartments | 515 (45.3%) | 621 (54.7%) |
| 3 or 4 Unit Apartments | 137 (24.8%) | 416 (75.2%) |
| 5 to 9 Unit Apartments | 49 (12.0%) | 359 (88.0%) |
| 10 or more Apartments | 1,161 (48.0%) | 1,258 (52.0%) |
| Mobile Home / Other | 12 (27.3%) | 32 (72.7%) |
| Total | 4,044 (55.2%) | 3,284 (44.8%) |
Housing Structures by Number of Rooms in Forest Park
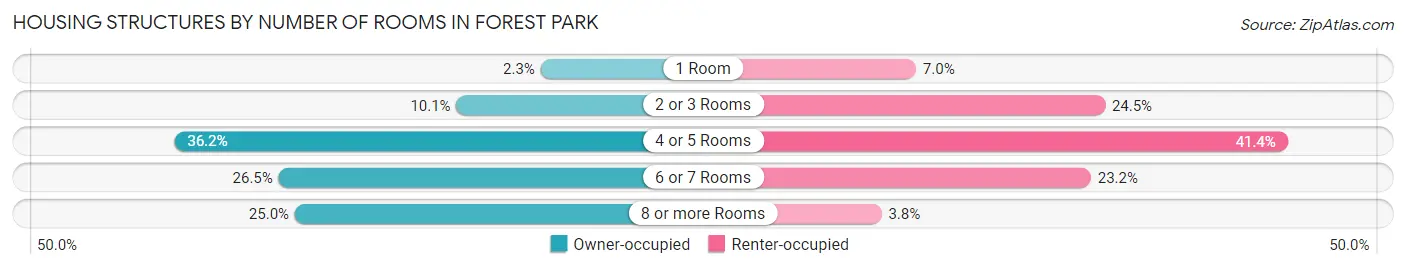
| Number of Rooms | Owner-occupied | Renter-occupied |
| 1 Room | 92 (2.3%) | 231 (7.0%) |
| 2 or 3 Rooms | 407 (10.1%) | 805 (24.5%) |
| 4 or 5 Rooms | 1,462 (36.1%) | 1,360 (41.4%) |
| 6 or 7 Rooms | 1,072 (26.5%) | 762 (23.2%) |
| 8 or more Rooms | 1,011 (25.0%) | 126 (3.8%) |
| Total | 4,044 (100.0%) | 3,284 (100.0%) |
Housing Structure by Heating Type in Forest Park
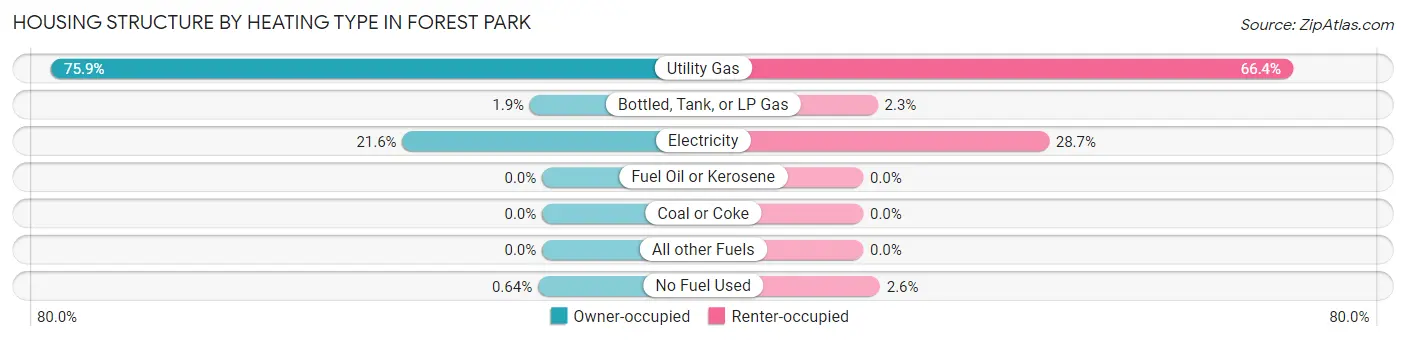
| Heating Type | Owner-occupied | Renter-occupied |
| Utility Gas | 3,069 (75.9%) | 2,182 (66.4%) |
| Bottled, Tank, or LP Gas | 76 (1.9%) | 74 (2.2%) |
| Electricity | 873 (21.6%) | 943 (28.7%) |
| Fuel Oil or Kerosene | 0 (0.0%) | 0 (0.0%) |
| Coal or Coke | 0 (0.0%) | 0 (0.0%) |
| All other Fuels | 0 (0.0%) | 0 (0.0%) |
| No Fuel Used | 26 (0.6%) | 85 (2.6%) |
| Total | 4,044 (100.0%) | 3,284 (100.0%) |
Household Vehicle Usage in Forest Park
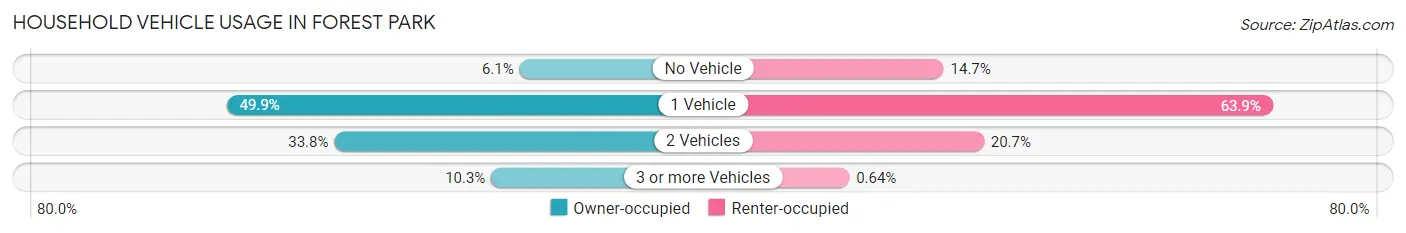
| Vehicles per Household | Owner-occupied | Renter-occupied |
| No Vehicle | 246 (6.1%) | 484 (14.7%) |
| 1 Vehicle | 2,016 (49.8%) | 2,098 (63.9%) |
| 2 Vehicles | 1,365 (33.8%) | 681 (20.7%) |
| 3 or more Vehicles | 417 (10.3%) | 21 (0.6%) |
| Total | 4,044 (100.0%) | 3,284 (100.0%) |
Real Estate & Mortgages in Forest Park
Real Estate and Mortgage Overview in Forest Park
| Characteristic | Without Mortgage | With Mortgage |
| Housing Units | 1,401 | 2,643 |
| Median Property Value | $227,900 | $299,100 |
| Median Household Income | $71,290 | $820 |
| Monthly Housing Costs | $784 | $414 |
| Real Estate Taxes | $5,311 | $44 |
Property Value by Mortgage Status in Forest Park
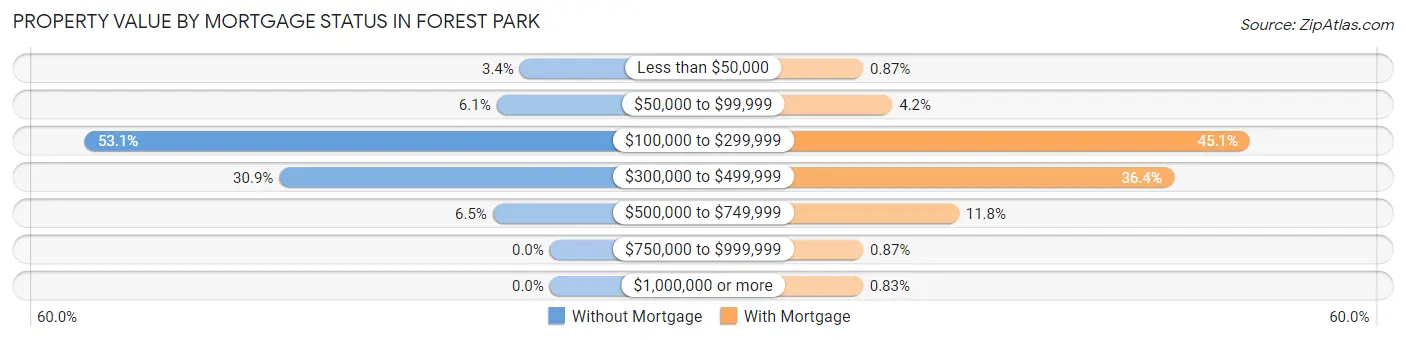
| Property Value | Without Mortgage | With Mortgage |
| Less than $50,000 | 48 (3.4%) | 23 (0.9%) |
| $50,000 to $99,999 | 85 (6.1%) | 111 (4.2%) |
| $100,000 to $299,999 | 744 (53.1%) | 1,191 (45.1%) |
| $300,000 to $499,999 | 433 (30.9%) | 961 (36.4%) |
| $500,000 to $749,999 | 91 (6.5%) | 312 (11.8%) |
| $750,000 to $999,999 | 0 (0.0%) | 23 (0.9%) |
| $1,000,000 or more | 0 (0.0%) | 22 (0.8%) |
| Total | 1,401 (100.0%) | 2,643 (100.0%) |
Household Income by Mortgage Status in Forest Park
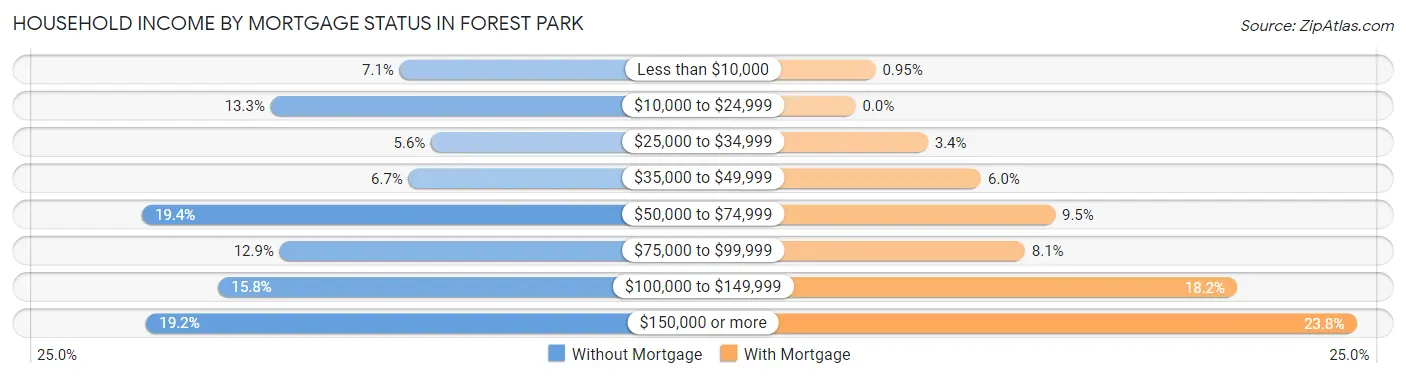
| Household Income | Without Mortgage | With Mortgage |
| Less than $10,000 | 100 (7.1%) | 25 (0.9%) |
| $10,000 to $24,999 | 186 (13.3%) | 0 (0.0%) |
| $25,000 to $34,999 | 79 (5.6%) | 91 (3.4%) |
| $35,000 to $49,999 | 94 (6.7%) | 158 (6.0%) |
| $50,000 to $74,999 | 272 (19.4%) | 251 (9.5%) |
| $75,000 to $99,999 | 180 (12.9%) | 213 (8.1%) |
| $100,000 to $149,999 | 221 (15.8%) | 480 (18.2%) |
| $150,000 or more | 269 (19.2%) | 630 (23.8%) |
| Total | 1,401 (100.0%) | 2,643 (100.0%) |
Property Value to Household Income Ratio in Forest Park
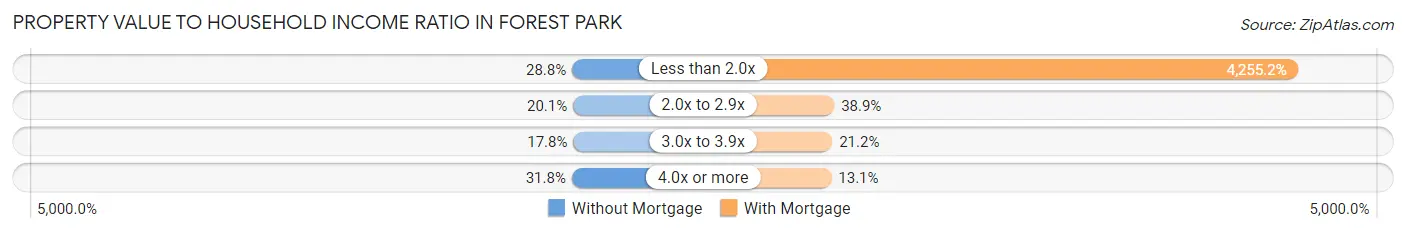
| Value-to-Income Ratio | Without Mortgage | With Mortgage |
| Less than 2.0x | 403 (28.8%) | 112,465 (4,255.2%) |
| 2.0x to 2.9x | 281 (20.1%) | 1,027 (38.9%) |
| 3.0x to 3.9x | 250 (17.8%) | 561 (21.2%) |
| 4.0x or more | 445 (31.8%) | 347 (13.1%) |
| Total | 1,401 (100.0%) | 2,643 (100.0%) |
Real Estate Taxes by Mortgage Status in Forest Park
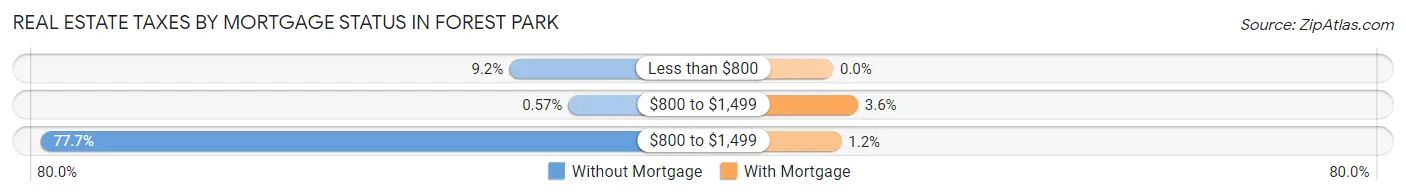
| Property Taxes | Without Mortgage | With Mortgage |
| Less than $800 | 129 (9.2%) | 0 (0.0%) |
| $800 to $1,499 | 8 (0.6%) | 96 (3.6%) |
| $800 to $1,499 | 1,088 (77.7%) | 32 (1.2%) |
| Total | 1,401 (100.0%) | 2,643 (100.0%) |
Health & Disability in Forest Park
Health Insurance Coverage by Age in Forest Park
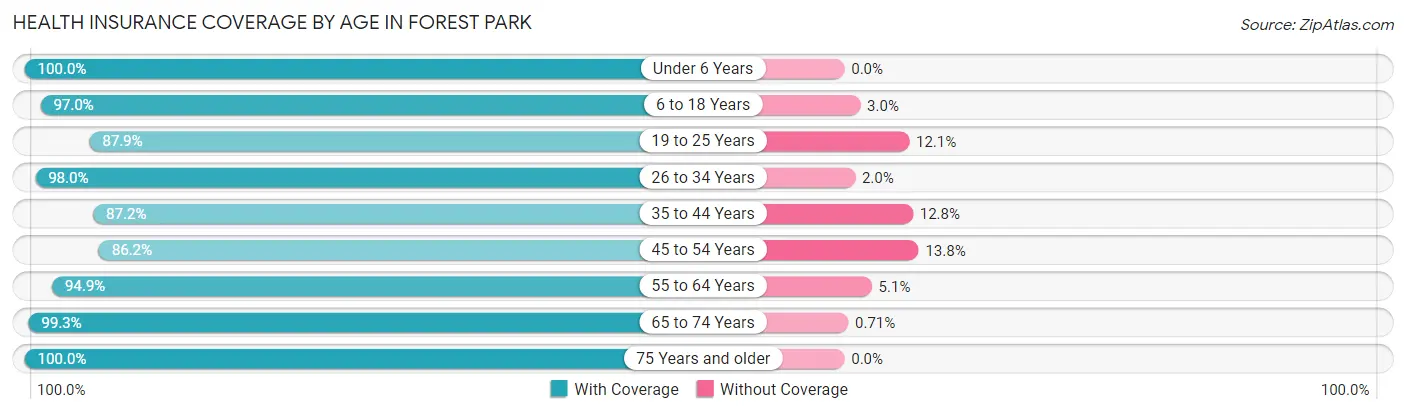
| Age Bracket | With Coverage | Without Coverage |
| Under 6 Years | 840 (100.0%) | 0 (0.0%) |
| 6 to 18 Years | 1,213 (97.0%) | 37 (3.0%) |
| 19 to 25 Years | 837 (87.9%) | 115 (12.1%) |
| 26 to 34 Years | 2,115 (98.0%) | 43 (2.0%) |
| 35 to 44 Years | 2,076 (87.2%) | 304 (12.8%) |
| 45 to 54 Years | 1,463 (86.2%) | 235 (13.8%) |
| 55 to 64 Years | 2,139 (94.9%) | 115 (5.1%) |
| 65 to 74 Years | 1,668 (99.3%) | 12 (0.7%) |
| 75 Years and older | 727 (100.0%) | 0 (0.0%) |
| Total | 13,078 (93.8%) | 861 (6.2%) |
Health Insurance Coverage by Citizenship Status in Forest Park
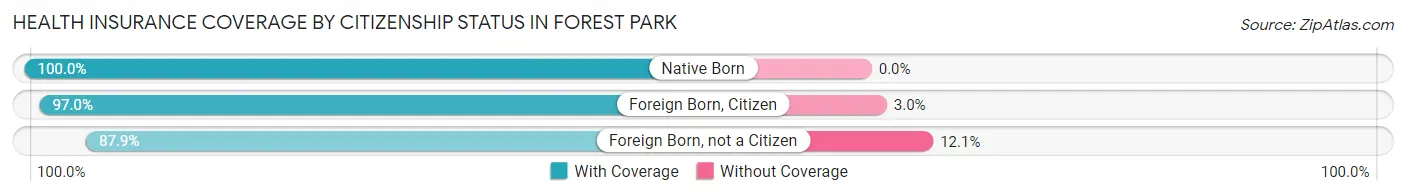
| Citizenship Status | With Coverage | Without Coverage |
| Native Born | 840 (100.0%) | 0 (0.0%) |
| Foreign Born, Citizen | 1,213 (97.0%) | 37 (3.0%) |
| Foreign Born, not a Citizen | 837 (87.9%) | 115 (12.1%) |
Health Insurance Coverage by Household Income in Forest Park
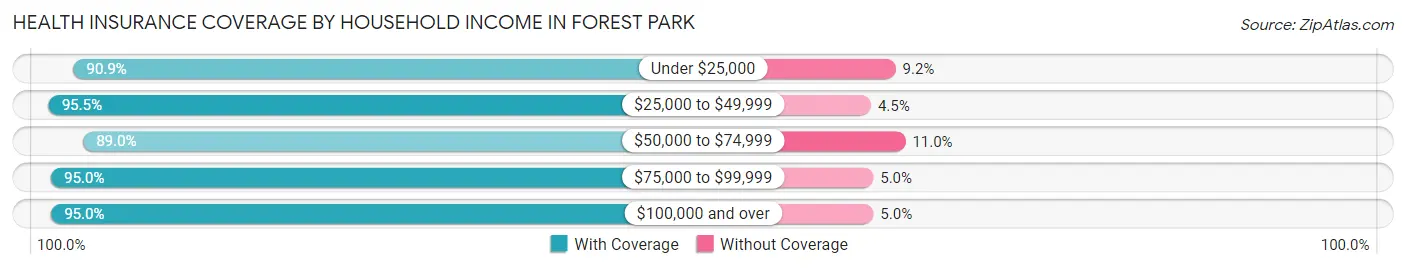
| Household Income | With Coverage | Without Coverage |
| Under $25,000 | 1,459 (90.8%) | 147 (9.1%) |
| $25,000 to $49,999 | 1,666 (95.5%) | 79 (4.5%) |
| $50,000 to $74,999 | 1,612 (89.0%) | 199 (11.0%) |
| $75,000 to $99,999 | 2,225 (95.0%) | 116 (5.0%) |
| $100,000 and over | 6,072 (95.0%) | 319 (5.0%) |
Public vs Private Health Insurance Coverage by Age in Forest Park
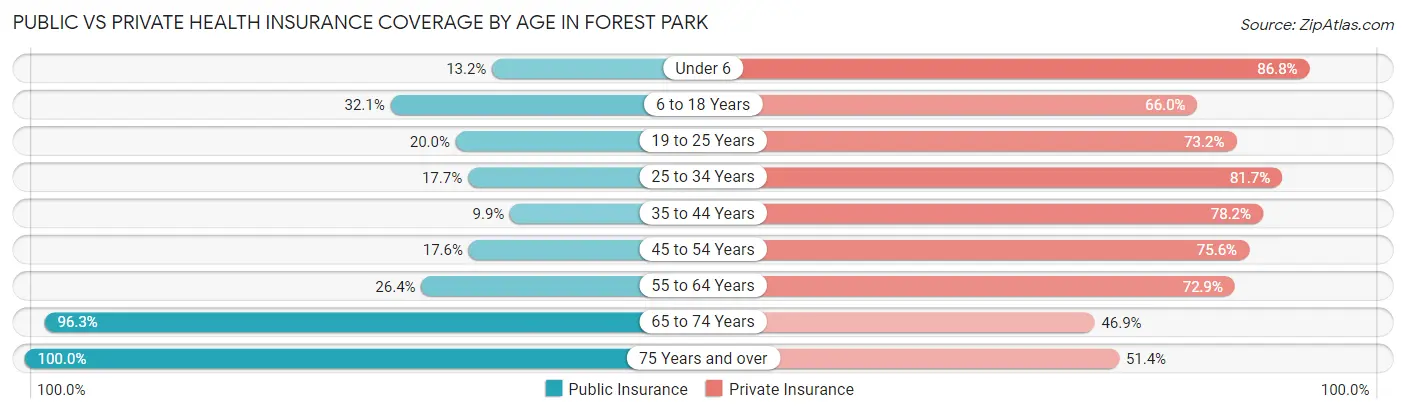
| Age Bracket | Public Insurance | Private Insurance |
| Under 6 | 111 (13.2%) | 729 (86.8%) |
| 6 to 18 Years | 401 (32.1%) | 825 (66.0%) |
| 19 to 25 Years | 190 (20.0%) | 697 (73.2%) |
| 25 to 34 Years | 382 (17.7%) | 1,763 (81.7%) |
| 35 to 44 Years | 235 (9.9%) | 1,860 (78.1%) |
| 45 to 54 Years | 298 (17.5%) | 1,283 (75.6%) |
| 55 to 64 Years | 594 (26.4%) | 1,644 (72.9%) |
| 65 to 74 Years | 1,618 (96.3%) | 788 (46.9%) |
| 75 Years and over | 727 (100.0%) | 374 (51.4%) |
| Total | 4,556 (32.7%) | 9,963 (71.5%) |
Disability Status by Sex by Age in Forest Park
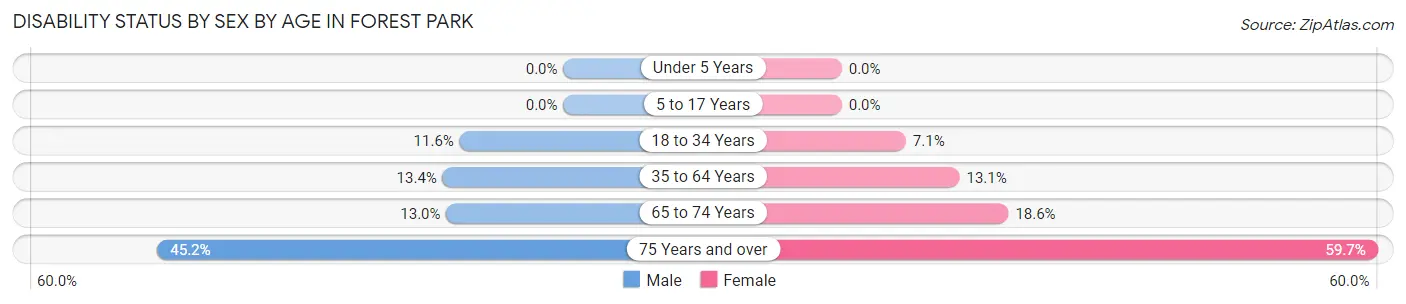
| Age Bracket | Male | Female |
| Under 5 Years | 0 (0.0%) | 0 (0.0%) |
| 5 to 17 Years | 0 (0.0%) | 0 (0.0%) |
| 18 to 34 Years | 192 (11.6%) | 108 (7.1%) |
| 35 to 64 Years | 399 (13.4%) | 441 (13.1%) |
| 65 to 74 Years | 89 (13.0%) | 185 (18.6%) |
| 75 Years and over | 165 (45.2%) | 216 (59.7%) |
Disability Class by Sex by Age in Forest Park
Disability Class: Hearing Difficulty
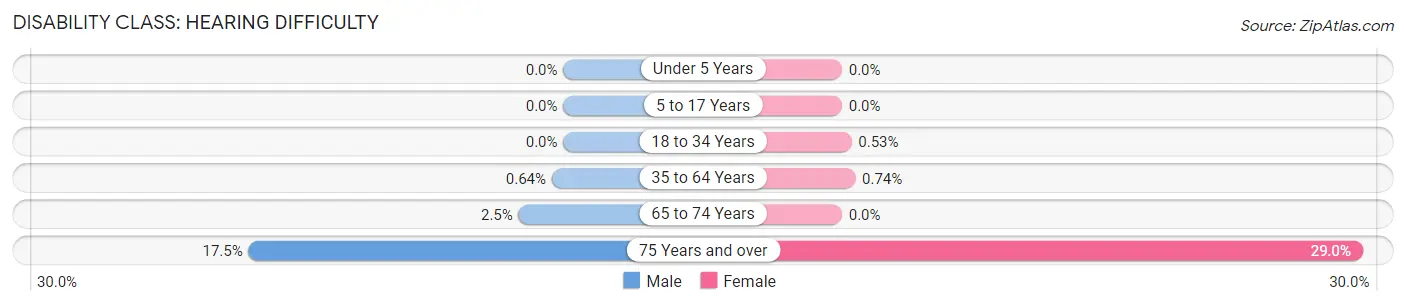
| Age Bracket | Male | Female |
| Under 5 Years | 0 (0.0%) | 0 (0.0%) |
| 5 to 17 Years | 0 (0.0%) | 0 (0.0%) |
| 18 to 34 Years | 0 (0.0%) | 8 (0.5%) |
| 35 to 64 Years | 19 (0.6%) | 25 (0.7%) |
| 65 to 74 Years | 17 (2.5%) | 0 (0.0%) |
| 75 Years and over | 64 (17.5%) | 105 (29.0%) |
Disability Class: Vision Difficulty
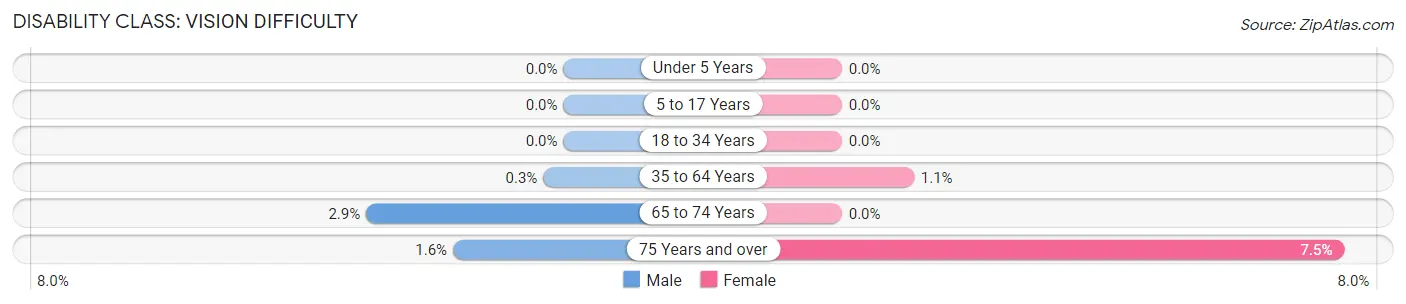
| Age Bracket | Male | Female |
| Under 5 Years | 0 (0.0%) | 0 (0.0%) |
| 5 to 17 Years | 0 (0.0%) | 0 (0.0%) |
| 18 to 34 Years | 0 (0.0%) | 0 (0.0%) |
| 35 to 64 Years | 9 (0.3%) | 36 (1.1%) |
| 65 to 74 Years | 20 (2.9%) | 0 (0.0%) |
| 75 Years and over | 6 (1.6%) | 27 (7.5%) |
Disability Class: Cognitive Difficulty
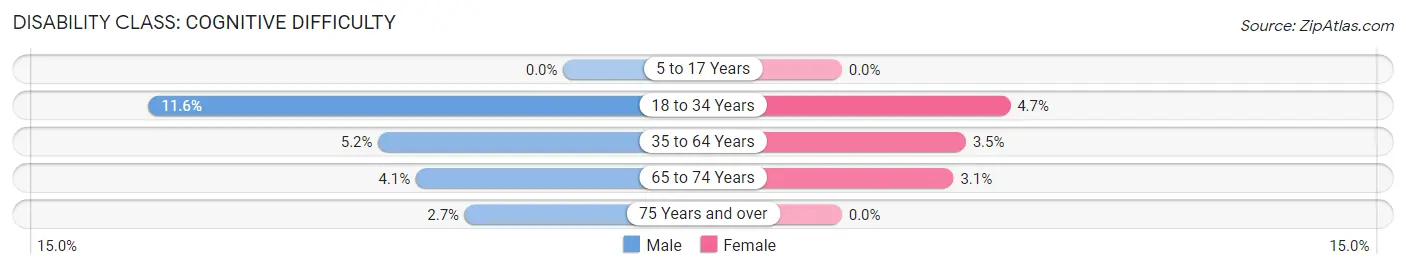
| Age Bracket | Male | Female |
| 5 to 17 Years | 0 (0.0%) | 0 (0.0%) |
| 18 to 34 Years | 192 (11.6%) | 71 (4.7%) |
| 35 to 64 Years | 153 (5.1%) | 116 (3.5%) |
| 65 to 74 Years | 28 (4.1%) | 31 (3.1%) |
| 75 Years and over | 10 (2.7%) | 0 (0.0%) |
Disability Class: Ambulatory Difficulty
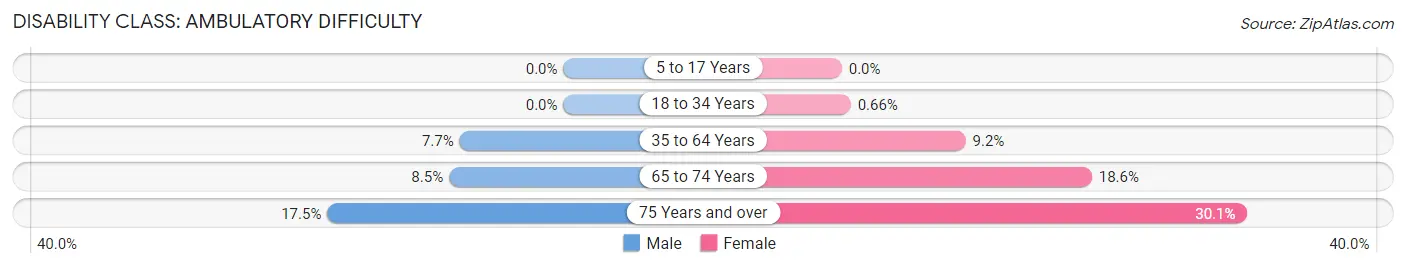
| Age Bracket | Male | Female |
| 5 to 17 Years | 0 (0.0%) | 0 (0.0%) |
| 18 to 34 Years | 0 (0.0%) | 10 (0.7%) |
| 35 to 64 Years | 229 (7.7%) | 309 (9.2%) |
| 65 to 74 Years | 58 (8.5%) | 185 (18.6%) |
| 75 Years and over | 64 (17.5%) | 109 (30.1%) |
Disability Class: Self-Care Difficulty
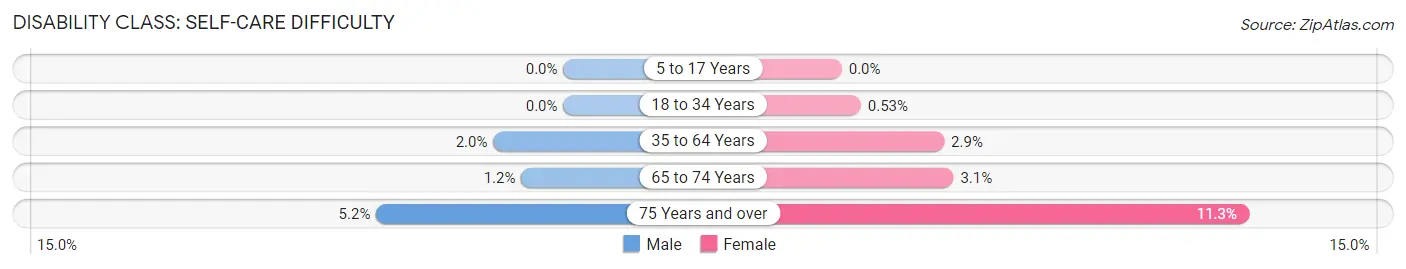
| Age Bracket | Male | Female |
| 5 to 17 Years | 0 (0.0%) | 0 (0.0%) |
| 18 to 34 Years | 0 (0.0%) | 8 (0.5%) |
| 35 to 64 Years | 58 (1.9%) | 96 (2.9%) |
| 65 to 74 Years | 8 (1.2%) | 31 (3.1%) |
| 75 Years and over | 19 (5.2%) | 41 (11.3%) |
Technology Access in Forest Park
Computing Device Access in Forest Park
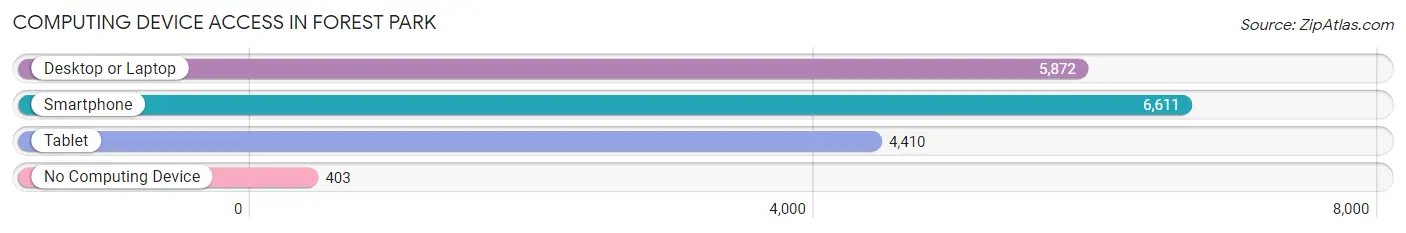
| Device Type | # Households | % Households |
| Desktop or Laptop | 5,872 | 80.1% |
| Smartphone | 6,611 | 90.2% |
| Tablet | 4,410 | 60.2% |
| No Computing Device | 403 | 5.5% |
| Total | 7,328 | 100.0% |
Internet Access in Forest Park
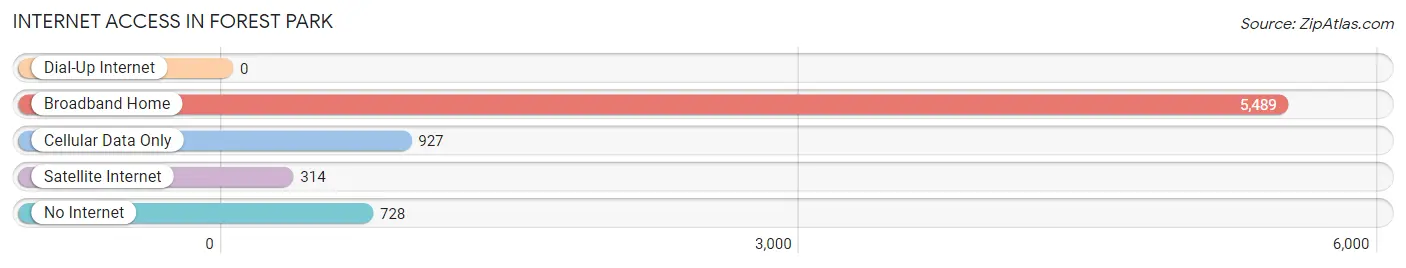
| Internet Type | # Households | % Households |
| Dial-Up Internet | 0 | 0.0% |
| Broadband Home | 5,489 | 74.9% |
| Cellular Data Only | 927 | 12.7% |
| Satellite Internet | 314 | 4.3% |
| No Internet | 728 | 9.9% |
| Total | 7,328 | 100.0% |
Forest Park Summary
Forest Park is a village located in Cook County, Illinois, United States. It is a suburb of Chicago, located approximately 10 miles west of the city's downtown. As of the 2010 census, the village had a population of 14,167.
History
The area that is now Forest Park was originally inhabited by the Potawatomi Native Americans. In 1851, the first settlers arrived in the area, and the village was officially incorporated in 1856. The village was named after a grove of trees located near the original town site.
In the late 19th century, Forest Park was a popular destination for Chicagoans looking to escape the city. The village was home to several resorts, including the Forest Park Hotel, which was built in 1876. The hotel was destroyed by a fire in 1891, but was rebuilt and remained in operation until the 1920s.
In the early 20th century, Forest Park experienced a period of rapid growth. The village was annexed by the city of Chicago in 1914, and the population increased from 1,800 in 1910 to over 10,000 by 1930.
Geography
Forest Park is located in Cook County, Illinois, approximately 10 miles west of downtown Chicago. The village is situated on the Des Plaines River, and is bordered by the city of Chicago to the east, the village of Oak Park to the south, and the village of River Forest to the west.
The village has a total area of 2.3 square miles, all of which is land. The terrain is mostly flat, with some rolling hills in the northern part of the village.
Economy
Forest Park is primarily a residential community, but it is also home to a number of businesses and industries. The village is home to several large employers, including the Forest Park Medical Center, the Forest Park Public Library, and the Forest Park Post Office.
The village is also home to a number of small businesses, including restaurants, retail stores, and professional services. The village is also home to a number of industrial businesses, including a printing company, a metal fabrication company, and a plastics manufacturer.
Demographics
As of the 2010 census, the village had a population of 14,167. The racial makeup of the village was 79.3% White, 11.2% African American, 0.3% Native American, 2.2% Asian, and 6.9% from other races. Hispanic or Latino of any race were 11.7% of the population.
The median household income in the village was $50,945, and the median family income was $62,917. The per capita income in the village was $27,945. About 8.3% of families and 10.3% of the population were below the poverty line, including 14.2% of those under age 18 and 6.2% of those age 65 or over.
Common Questions
What is Per Capita Income in Forest Park?
Per Capita income in Forest Park is $54,017.
What is the Median Family Income in Forest Park?
Median Family Income in Forest Park is $113,622.
What is the Median Household income in Forest Park?
Median Household Income in Forest Park is $78,625.
What is Income or Wage Gap in Forest Park?
Income or Wage Gap in Forest Park is 0.2%.
Women in Forest Park earn 99.8 cents for every dollar earned by a man.
What is Family Income Deficit in Forest Park?
Family Income Deficit in Forest Park is $16,931.
Families that are below poverty line in Forest Park earn $16,931 less on average than the poverty threshold level.
What is Inequality or Gini Index in Forest Park?
Inequality or Gini Index in Forest Park is 0.47.
What is the Total Population of Forest Park?
Total Population of Forest Park is 14,165.
What is the Total Male Population of Forest Park?
Total Male Population of Forest Park is 6,705.
What is the Total Female Population of Forest Park?
Total Female Population of Forest Park is 7,460.
What is the Ratio of Males per 100 Females in Forest Park?
There are 89.88 Males per 100 Females in Forest Park.
What is the Ratio of Females per 100 Males in Forest Park?
There are 111.26 Females per 100 Males in Forest Park.
What is the Median Population Age in Forest Park?
Median Population Age in Forest Park is 42.2 Years.
What is the Average Family Size in Forest Park
Average Family Size in Forest Park is 2.7 People.
What is the Average Household Size in Forest Park
Average Household Size in Forest Park is 1.9 People.
How Large is the Labor Force in Forest Park?
There are 8,526 People in the Labor Forcein in Forest Park.
What is the Percentage of People in the Labor Force in Forest Park?
68.5% of People are in the Labor Force in Forest Park.
What is the Unemployment Rate in Forest Park?
Unemployment Rate in Forest Park is 4.9%.