Bluford, IL Map & Demographics
Bluford Map
Bluford Overview
$28,024
PER CAPITA INCOME
$62,083
AVG FAMILY INCOME
$59,688
AVG HOUSEHOLD INCOME
13.5%
WAGE / INCOME GAP [ % ]
86.5¢/ $1
WAGE / INCOME GAP [ $ ]
$10,655
FAMILY INCOME DEFICIT
0.39
INEQUALITY / GINI INDEX
555
TOTAL POPULATION
258
MALE POPULATION
297
FEMALE POPULATION
86.87
MALES / 100 FEMALES
115.12
FEMALES / 100 MALES
38.3
MEDIAN AGE
2.7
AVG FAMILY SIZE
2.4
AVG HOUSEHOLD SIZE
308
LABOR FORCE [ PEOPLE ]
67.0%
PERCENT IN LABOR FORCE
6.8%
UNEMPLOYMENT RATE
Bluford Zip Codes
Bluford Area Codes
Income in Bluford
Income Overview in Bluford
Per Capita Income in Bluford is $28,024, while median incomes of families and households are $62,083 and $59,688 respectively.
| Characteristic | Number | Measure |
| Per Capita Income | 555 | $28,024 |
| Median Family Income | 183 | $62,083 |
| Mean Family Income | 183 | $77,070 |
| Median Household Income | 232 | $59,688 |
| Mean Household Income | 232 | $68,724 |
| Income Deficit | 183 | $10,655 |
| Wage / Income Gap (%) | 555 | 13.46% |
| Wage / Income Gap ($) | 555 | 86.54¢ per $1 |
| Gini / Inequality Index | 555 | 0.39 |
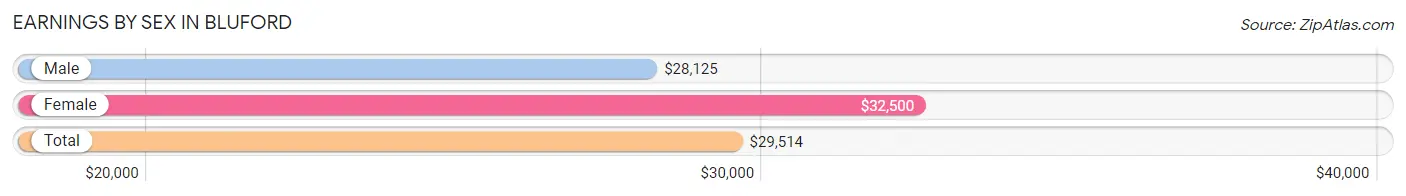
Earnings by Sex in Bluford
Average Earnings in Bluford are $29,514, $28,125 for men and $32,500 for women, a difference of 13.5%.
| Sex | Number | Average Earnings |
| Male | 151 (48.5%) | $28,125 |
| Female | 160 (51.4%) | $32,500 |
| Total | 311 (100.0%) | $29,514 |
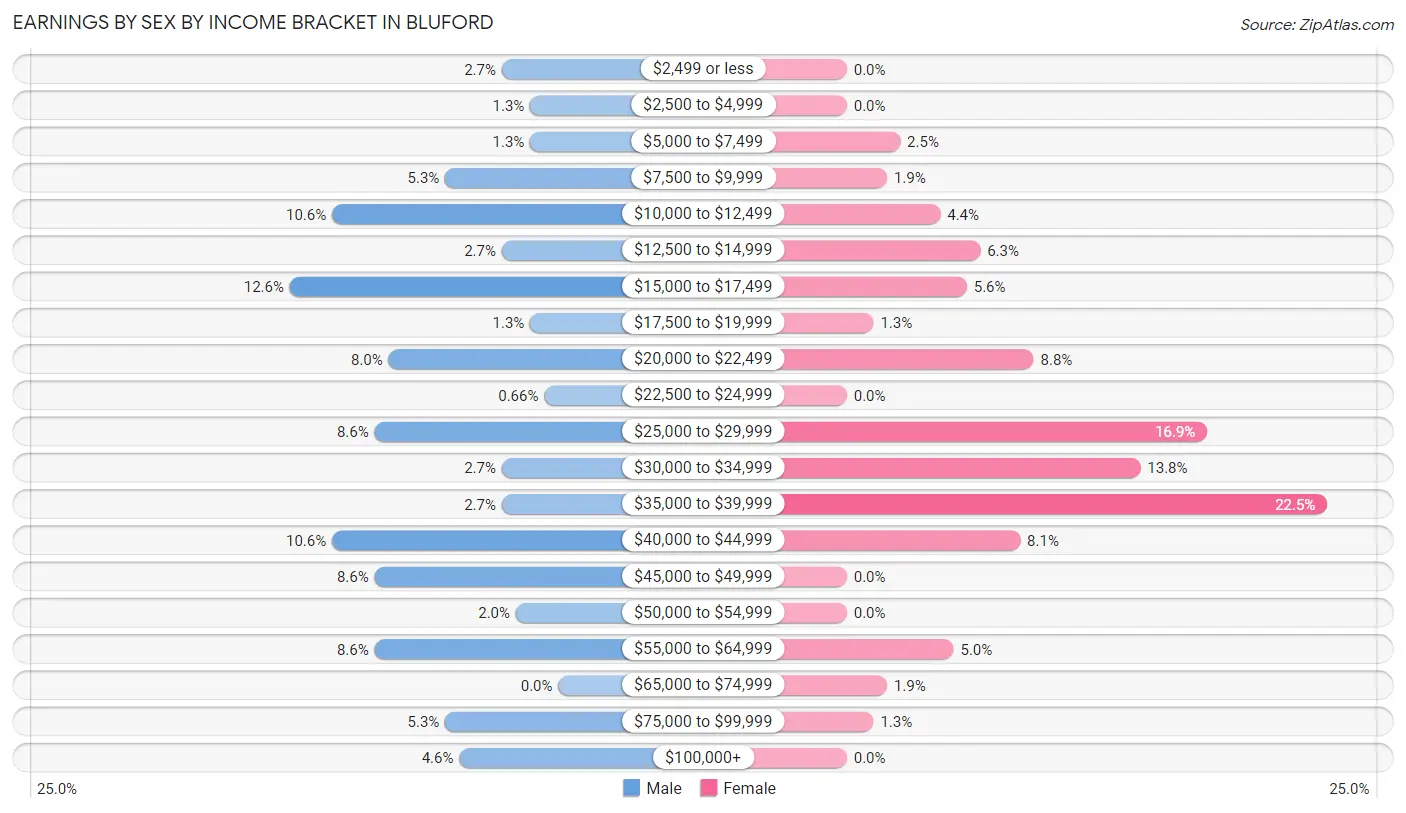
Earnings by Sex by Income Bracket in Bluford
The most common earnings brackets in Bluford are $15,000 to $17,499 for men (19 | 12.6%) and $35,000 to $39,999 for women (36 | 22.5%).
| Income | Male | Female |
| $2,499 or less | 4 (2.6%) | 0 (0.0%) |
| $2,500 to $4,999 | 2 (1.3%) | 0 (0.0%) |
| $5,000 to $7,499 | 2 (1.3%) | 4 (2.5%) |
| $7,500 to $9,999 | 8 (5.3%) | 3 (1.9%) |
| $10,000 to $12,499 | 16 (10.6%) | 7 (4.4%) |
| $12,500 to $14,999 | 4 (2.6%) | 10 (6.2%) |
| $15,000 to $17,499 | 19 (12.6%) | 9 (5.6%) |
| $17,500 to $19,999 | 2 (1.3%) | 2 (1.3%) |
| $20,000 to $22,499 | 12 (8.0%) | 14 (8.7%) |
| $22,500 to $24,999 | 1 (0.7%) | 0 (0.0%) |
| $25,000 to $29,999 | 13 (8.6%) | 27 (16.9%) |
| $30,000 to $34,999 | 4 (2.6%) | 22 (13.8%) |
| $35,000 to $39,999 | 4 (2.6%) | 36 (22.5%) |
| $40,000 to $44,999 | 16 (10.6%) | 13 (8.1%) |
| $45,000 to $49,999 | 13 (8.6%) | 0 (0.0%) |
| $50,000 to $54,999 | 3 (2.0%) | 0 (0.0%) |
| $55,000 to $64,999 | 13 (8.6%) | 8 (5.0%) |
| $65,000 to $74,999 | 0 (0.0%) | 3 (1.9%) |
| $75,000 to $99,999 | 8 (5.3%) | 2 (1.3%) |
| $100,000+ | 7 (4.6%) | 0 (0.0%) |
| Total | 151 (100.0%) | 160 (100.0%) |
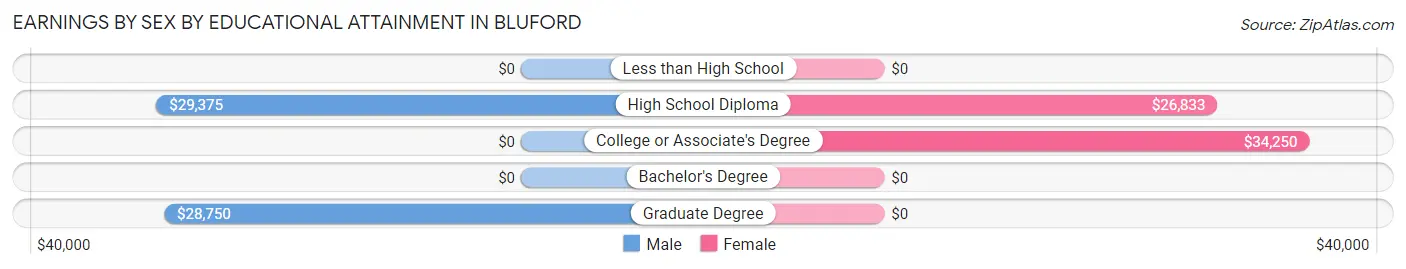
Earnings by Sex by Educational Attainment in Bluford
Average earnings in Bluford are $30,000 for men and $32,750 for women, a difference of 8.4%. Men with an educational attainment of high school diploma enjoy the highest average annual earnings of $29,375, while those with graduate degree education earn the least with $28,750. Women with an educational attainment of college or associate's degree earn the most with the average annual earnings of $34,250, while those with high school diploma education have the smallest earnings of $26,833.
| Educational Attainment | Male Income | Female Income |
| Less than High School | - | - |
| High School Diploma | $29,375 | $26,833 |
| College or Associate's Degree | - | - |
| Bachelor's Degree | - | - |
| Graduate Degree | $28,750 | $0 |
| Total | $30,000 | $32,750 |
Family Income in Bluford
Family Income Brackets in Bluford
According to the Bluford family income data, there are 59 families falling into the $50,000 to $74,999 income range, which is the most common income bracket and makes up 32.2% of all families. Conversely, the $10,000 to $14,999 income bracket is the least frequent group with only 3 families (1.6%) belonging to this category.
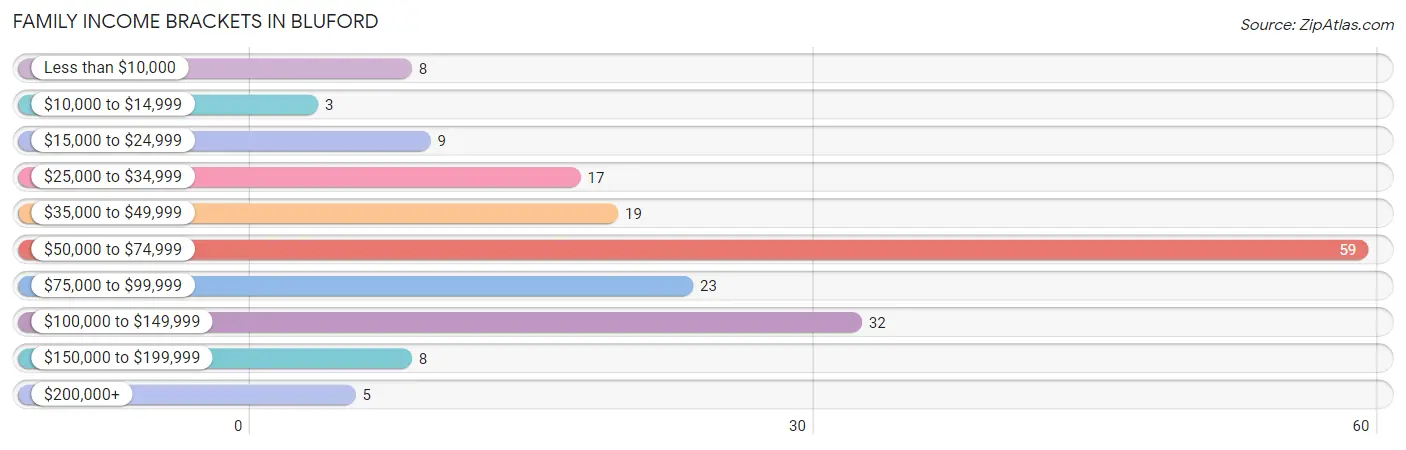
| Income Bracket | # Families | % Families |
| Less than $10,000 | 8 | 4.4% |
| $10,000 to $14,999 | 3 | 1.6% |
| $15,000 to $24,999 | 9 | 4.9% |
| $25,000 to $34,999 | 17 | 9.3% |
| $35,000 to $49,999 | 19 | 10.4% |
| $50,000 to $74,999 | 59 | 32.2% |
| $75,000 to $99,999 | 23 | 12.6% |
| $100,000 to $149,999 | 32 | 17.5% |
| $150,000 to $199,999 | 8 | 4.4% |
| $200,000+ | 5 | 2.7% |
Family Income by Famaliy Size in Bluford
4-person families (28 | 15.3%) account for the highest median family income in Bluford with $67,500 per family, while 2-person families (97 | 53.0%) have the highest median income of $32,812 per family member.
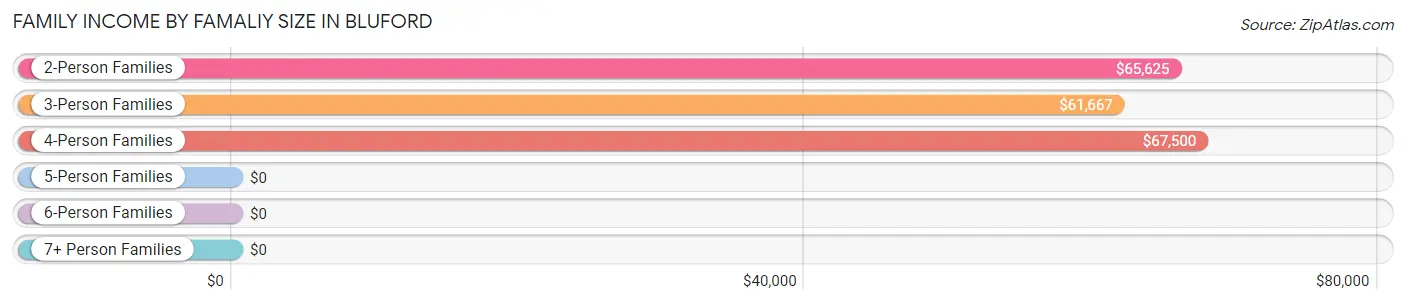
| Income Bracket | # Families | Median Income |
| 2-Person Families | 97 (53.0%) | $65,625 |
| 3-Person Families | 54 (29.5%) | $61,667 |
| 4-Person Families | 28 (15.3%) | $67,500 |
| 5-Person Families | 3 (1.6%) | $0 |
| 6-Person Families | 1 (0.5%) | $0 |
| 7+ Person Families | 0 (0.0%) | $0 |
| Total | 183 (100.0%) | $62,083 |
Family Income by Number of Earners in Bluford
The median family income in Bluford is $62,083, with families comprising 3+ earners (21) having the highest median family income of $88,125, while families with 1 earner (55) have the lowest median family income of $41,750, accounting for 11.5% and 30.0% of families, respectively.
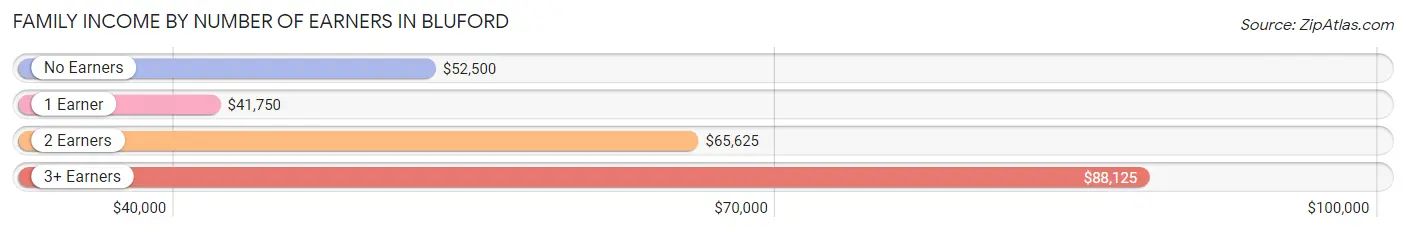
| Number of Earners | # Families | Median Income |
| No Earners | 32 (17.5%) | $52,500 |
| 1 Earner | 55 (30.0%) | $41,750 |
| 2 Earners | 75 (41.0%) | $65,625 |
| 3+ Earners | 21 (11.5%) | $88,125 |
| Total | 183 (100.0%) | $62,083 |
Household Income in Bluford
Household Income Brackets in Bluford
With 61 households falling in the category, the $50,000 to $74,999 income range is the most frequent in Bluford, accounting for 26.3% of all households. In contrast, only 5 households (2.2%) fall into the $200,000+ income bracket, making it the least populous group.
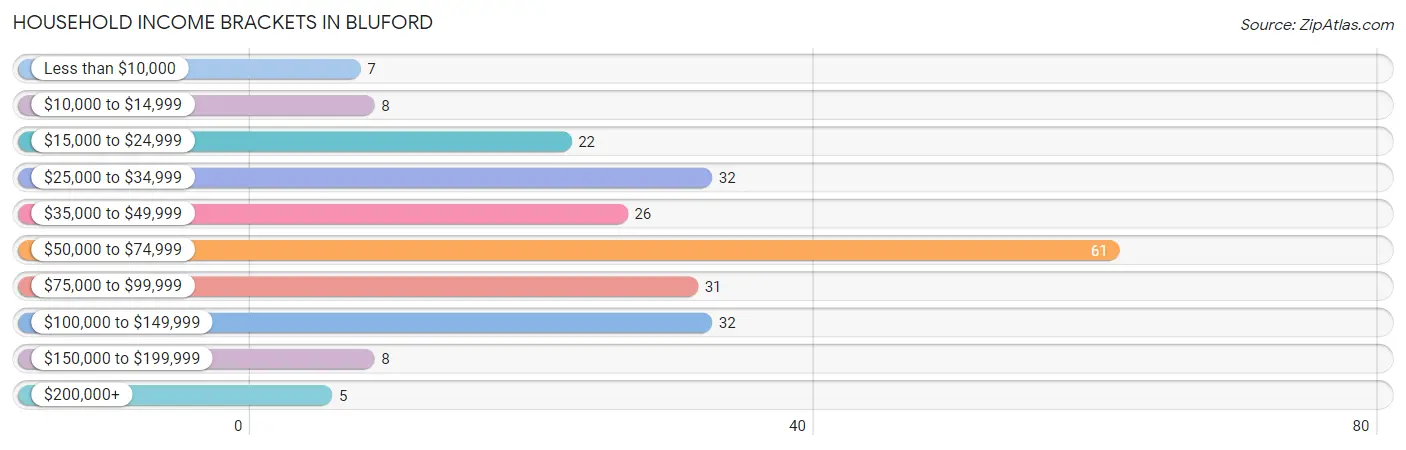
| Income Bracket | # Households | % Households |
| Less than $10,000 | 7 | 3.0% |
| $10,000 to $14,999 | 8 | 3.4% |
| $15,000 to $24,999 | 22 | 9.5% |
| $25,000 to $34,999 | 32 | 13.8% |
| $35,000 to $49,999 | 26 | 11.2% |
| $50,000 to $74,999 | 61 | 26.3% |
| $75,000 to $99,999 | 31 | 13.4% |
| $100,000 to $149,999 | 32 | 13.8% |
| $150,000 to $199,999 | 8 | 3.4% |
| $200,000+ | 5 | 2.2% |
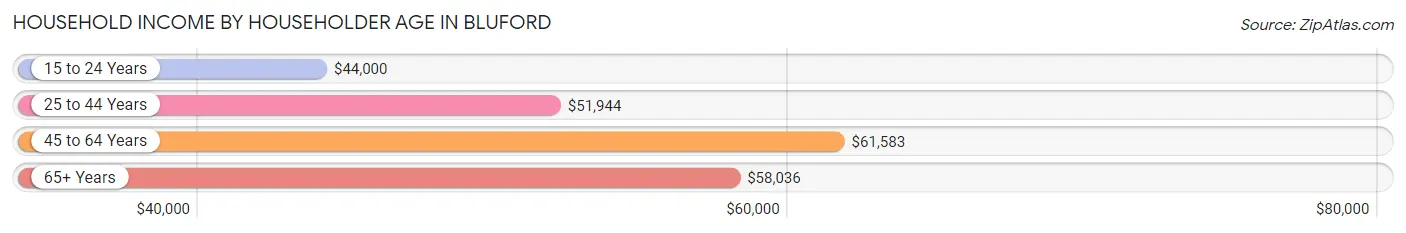
Household Income by Householder Age in Bluford
The median household income in Bluford is $59,688, with the highest median household income of $61,583 found in the 45 to 64 years age bracket for the primary householder. A total of 81 households (34.9%) fall into this category. Meanwhile, the 15 to 24 years age bracket for the primary householder has the lowest median household income of $44,000, with 10 households (4.3%) in this group.
| Income Bracket | # Households | Median Income |
| 15 to 24 Years | 10 (4.3%) | $44,000 |
| 25 to 44 Years | 68 (29.3%) | $51,944 |
| 45 to 64 Years | 81 (34.9%) | $61,583 |
| 65+ Years | 73 (31.5%) | $58,036 |
| Total | 232 (100.0%) | $59,688 |
Poverty in Bluford
Income Below Poverty by Sex and Age in Bluford
With 20.9% poverty level for males and 6.4% for females among the residents of Bluford, 18 to 24 year old males and 16 and 17 year old females are the most vulnerable to poverty, with 21 males (52.5%) and 4 females (40.0%) in their respective age groups living below the poverty level.
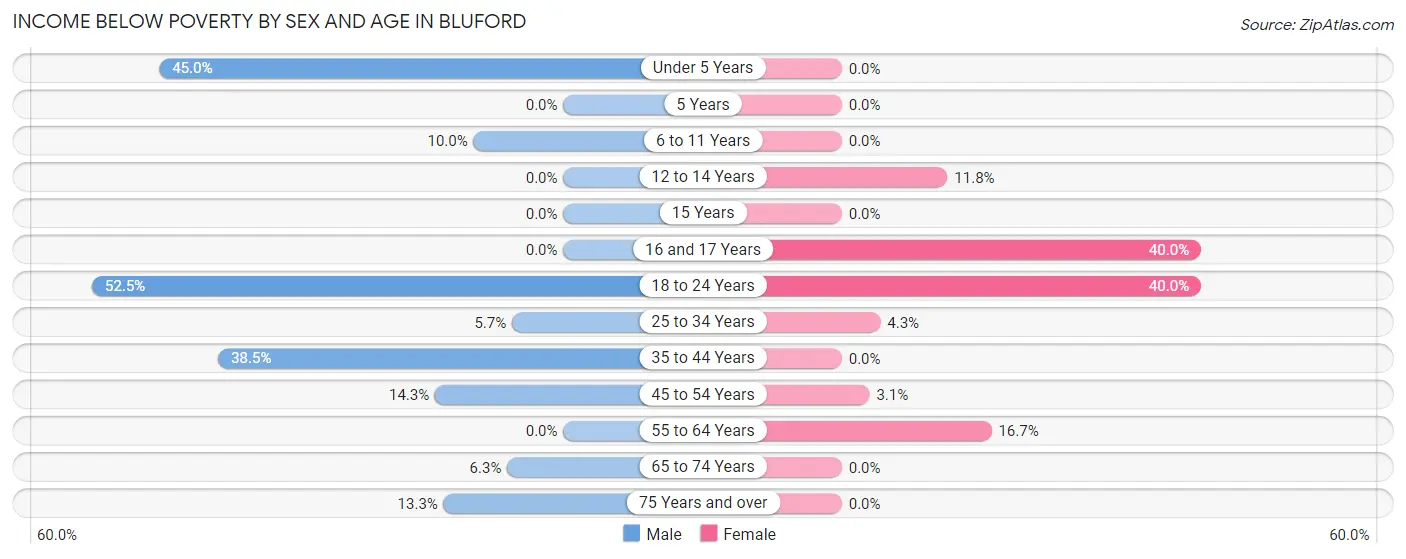
| Age Bracket | Male | Female |
| Under 5 Years | 9 (45.0%) | 0 (0.0%) |
| 5 Years | 0 (0.0%) | 0 (0.0%) |
| 6 to 11 Years | 2 (10.0%) | 0 (0.0%) |
| 12 to 14 Years | 0 (0.0%) | 2 (11.8%) |
| 15 Years | 0 (0.0%) | 0 (0.0%) |
| 16 and 17 Years | 0 (0.0%) | 4 (40.0%) |
| 18 to 24 Years | 21 (52.5%) | 6 (40.0%) |
| 25 to 34 Years | 2 (5.7%) | 3 (4.3%) |
| 35 to 44 Years | 10 (38.5%) | 0 (0.0%) |
| 45 to 54 Years | 4 (14.3%) | 2 (3.1%) |
| 55 to 64 Years | 0 (0.0%) | 2 (16.7%) |
| 65 to 74 Years | 2 (6.2%) | 0 (0.0%) |
| 75 Years and over | 4 (13.3%) | 0 (0.0%) |
| Total | 54 (20.9%) | 19 (6.4%) |
Income Above Poverty by Sex and Age in Bluford
According to the poverty statistics in Bluford, males aged 12 to 14 years and females aged under 5 years are the age groups that are most secure financially, with 100.0% of males and 100.0% of females in these age groups living above the poverty line.
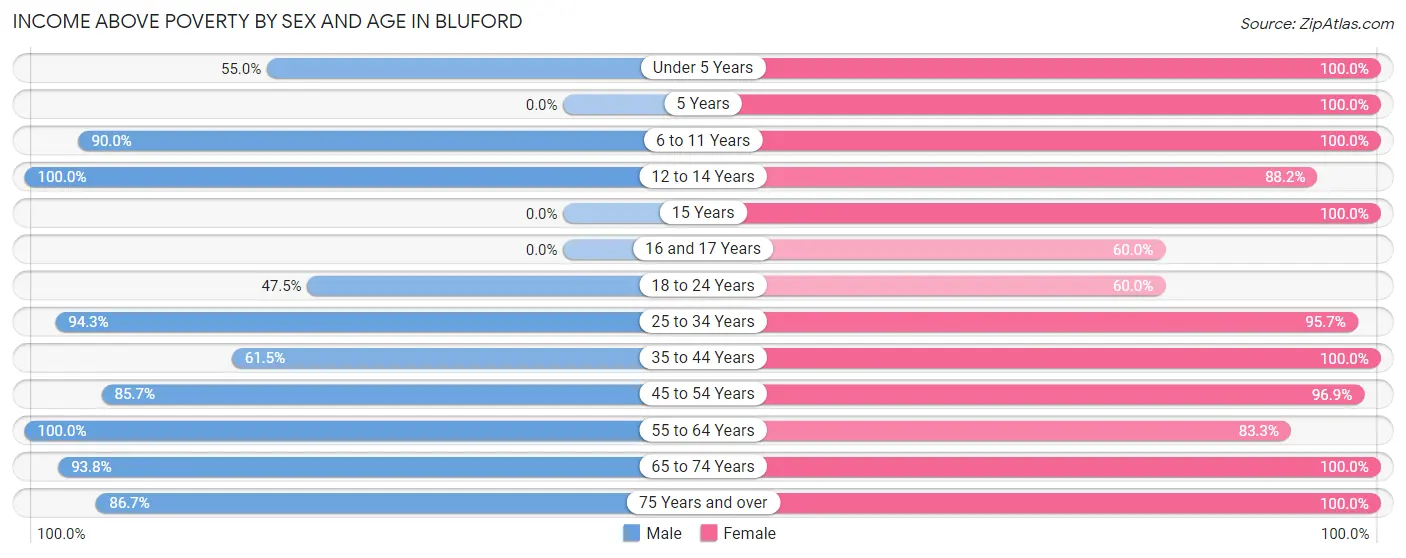
| Age Bracket | Male | Female |
| Under 5 Years | 11 (55.0%) | 11 (100.0%) |
| 5 Years | 0 (0.0%) | 2 (100.0%) |
| 6 to 11 Years | 18 (90.0%) | 22 (100.0%) |
| 12 to 14 Years | 1 (100.0%) | 15 (88.2%) |
| 15 Years | 0 (0.0%) | 2 (100.0%) |
| 16 and 17 Years | 0 (0.0%) | 6 (60.0%) |
| 18 to 24 Years | 19 (47.5%) | 9 (60.0%) |
| 25 to 34 Years | 33 (94.3%) | 67 (95.7%) |
| 35 to 44 Years | 16 (61.5%) | 16 (100.0%) |
| 45 to 54 Years | 24 (85.7%) | 63 (96.9%) |
| 55 to 64 Years | 26 (100.0%) | 10 (83.3%) |
| 65 to 74 Years | 30 (93.8%) | 41 (100.0%) |
| 75 Years and over | 26 (86.7%) | 14 (100.0%) |
| Total | 204 (79.1%) | 278 (93.6%) |
Income Below Poverty Among Married-Couple Families in Bluford
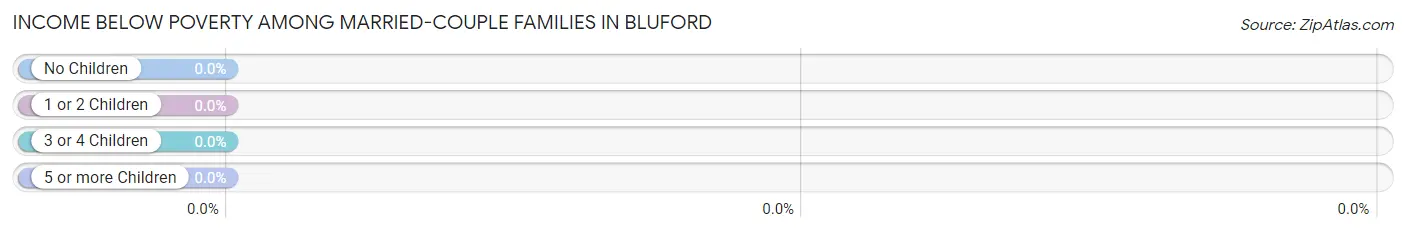
| Children | Above Poverty | Below Poverty |
| No Children | 92 (100.0%) | 0 (0.0%) |
| 1 or 2 Children | 17 (100.0%) | 0 (0.0%) |
| 3 or 4 Children | 1 (100.0%) | 0 (0.0%) |
| 5 or more Children | 0 (0.0%) | 0 (0.0%) |
| Total | 110 (100.0%) | 0 (0.0%) |
Income Below Poverty Among Single-Parent Households in Bluford
According to the poverty data in Bluford, 61.9% or 13 single-father households and 13.5% or 7 single-mother households are living below the poverty line. Among single-father households, those with 1 or 2 children have the highest poverty rate, with 9 households (69.2%) experiencing poverty. Likewise, among single-mother households, those with 3 or 4 children have the highest poverty rate, with 3 households (23.1%) falling below the poverty line.
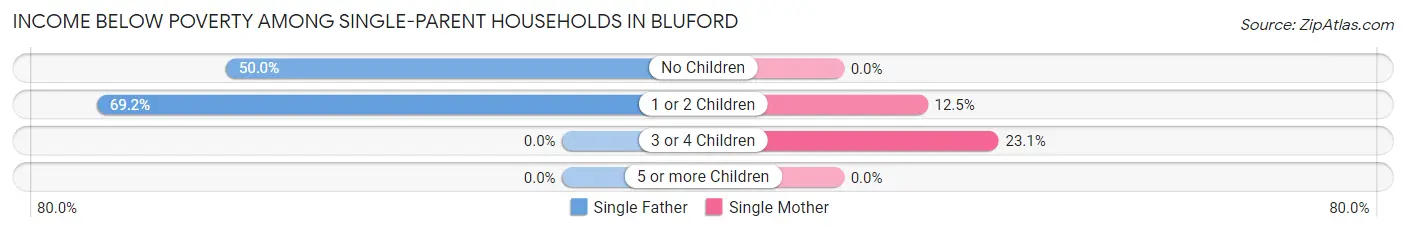
| Children | Single Father | Single Mother |
| No Children | 4 (50.0%) | 0 (0.0%) |
| 1 or 2 Children | 9 (69.2%) | 4 (12.5%) |
| 3 or 4 Children | 0 (0.0%) | 3 (23.1%) |
| 5 or more Children | 0 (0.0%) | 0 (0.0%) |
| Total | 13 (61.9%) | 7 (13.5%) |
Income Below Poverty Among Married-Couple vs Single-Parent Households in Bluford
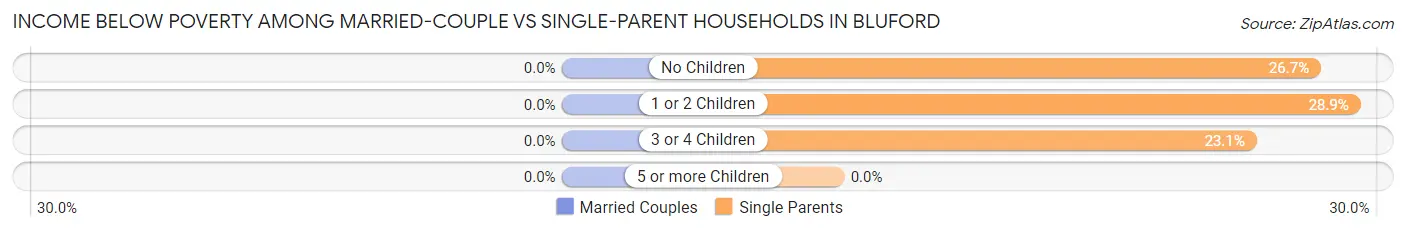
| Children | Married-Couple Families | Single-Parent Households |
| No Children | 0 (0.0%) | 4 (26.7%) |
| 1 or 2 Children | 0 (0.0%) | 13 (28.9%) |
| 3 or 4 Children | 0 (0.0%) | 3 (23.1%) |
| 5 or more Children | 0 (0.0%) | 0 (0.0%) |
| Total | 0 (0.0%) | 20 (27.4%) |
Race in Bluford
The most populous races in Bluford are White / Caucasian (460 | 82.9%), Native / Alaskan (48 | 8.6%), and Two or more Races (47 | 8.5%).
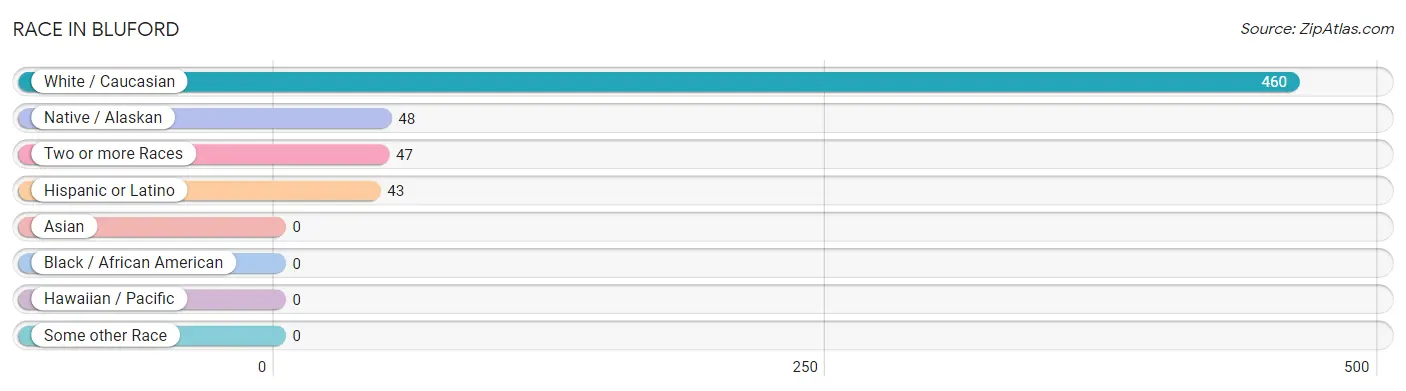
| Race | # Population | % Population |
| Asian | 0 | 0.0% |
| Black / African American | 0 | 0.0% |
| Hawaiian / Pacific | 0 | 0.0% |
| Hispanic or Latino | 43 | 7.7% |
| Native / Alaskan | 48 | 8.6% |
| White / Caucasian | 460 | 82.9% |
| Two or more Races | 47 | 8.5% |
| Some other Race | 0 | 0.0% |
| Total | 555 | 100.0% |
Ancestry in Bluford
The most populous ancestries reported in Bluford are German (90 | 16.2%), English (65 | 11.7%), Chippewa (47 | 8.5%), Irish (34 | 6.1%), and American (32 | 5.8%), together accounting for 48.3% of all Bluford residents.
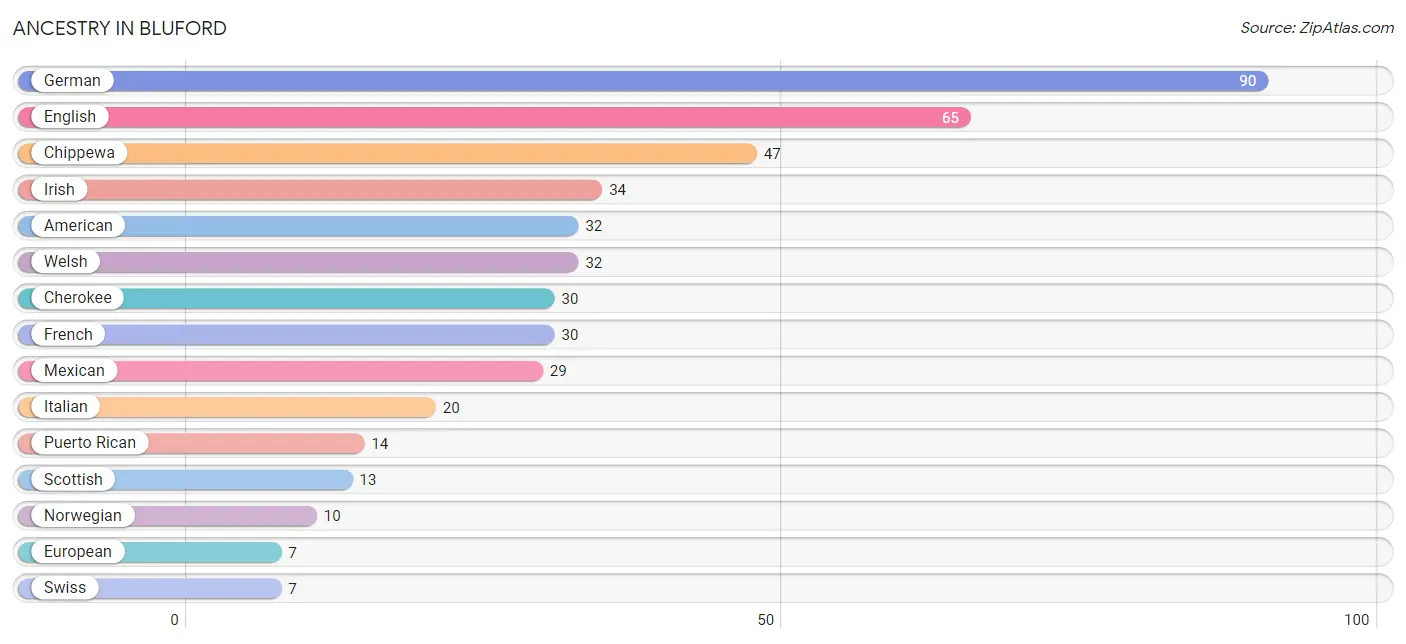
| Ancestry | # Population | % Population |
| American | 32 | 5.8% |
| Cherokee | 30 | 5.4% |
| Chippewa | 47 | 8.5% |
| Czech | 2 | 0.4% |
| Dutch | 3 | 0.5% |
| English | 65 | 11.7% |
| European | 7 | 1.3% |
| French | 30 | 5.4% |
| German | 90 | 16.2% |
| Irish | 34 | 6.1% |
| Italian | 20 | 3.6% |
| Lithuanian | 6 | 1.1% |
| Mexican | 29 | 5.2% |
| Navajo | 3 | 0.5% |
| Norwegian | 10 | 1.8% |
| Polish | 4 | 0.7% |
| Puerto Rican | 14 | 2.5% |
| Scotch-Irish | 2 | 0.4% |
| Scottish | 13 | 2.3% |
| Swiss | 7 | 1.3% |
| Welsh | 32 | 5.8% | View All 21 Rows |
Immigrants in Bluford

| Immigration Origin | # Population | % Population | View All 0 Rows |
Sex and Age in Bluford
Sex and Age in Bluford
The most populous age groups in Bluford are 65 to 69 Years (27 | 10.5%) for men and 25 to 29 Years (46 | 15.5%) for women.
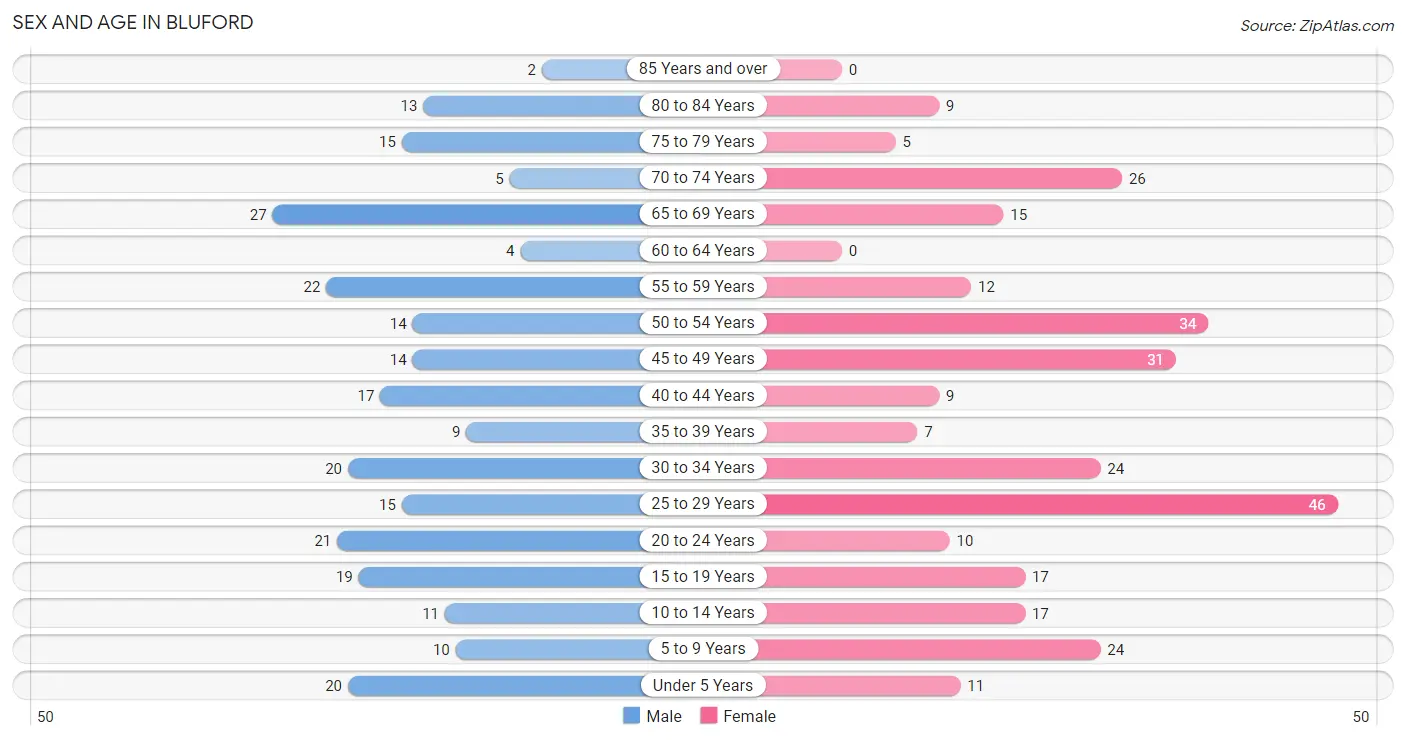
| Age Bracket | Male | Female |
| Under 5 Years | 20 (7.7%) | 11 (3.7%) |
| 5 to 9 Years | 10 (3.9%) | 24 (8.1%) |
| 10 to 14 Years | 11 (4.3%) | 17 (5.7%) |
| 15 to 19 Years | 19 (7.4%) | 17 (5.7%) |
| 20 to 24 Years | 21 (8.1%) | 10 (3.4%) |
| 25 to 29 Years | 15 (5.8%) | 46 (15.5%) |
| 30 to 34 Years | 20 (7.7%) | 24 (8.1%) |
| 35 to 39 Years | 9 (3.5%) | 7 (2.4%) |
| 40 to 44 Years | 17 (6.6%) | 9 (3.0%) |
| 45 to 49 Years | 14 (5.4%) | 31 (10.4%) |
| 50 to 54 Years | 14 (5.4%) | 34 (11.5%) |
| 55 to 59 Years | 22 (8.5%) | 12 (4.0%) |
| 60 to 64 Years | 4 (1.5%) | 0 (0.0%) |
| 65 to 69 Years | 27 (10.5%) | 15 (5.1%) |
| 70 to 74 Years | 5 (1.9%) | 26 (8.7%) |
| 75 to 79 Years | 15 (5.8%) | 5 (1.7%) |
| 80 to 84 Years | 13 (5.0%) | 9 (3.0%) |
| 85 Years and over | 2 (0.8%) | 0 (0.0%) |
| Total | 258 (100.0%) | 297 (100.0%) |
Families and Households in Bluford
Median Family Size in Bluford
The median family size in Bluford is 2.66 persons per family, with single female/mother families (52 | 28.4%) accounting for the largest median family size of 2.87 persons per family. On the other hand, married-couple families (110 | 60.1%) represent the smallest median family size with 2.55 persons per family.
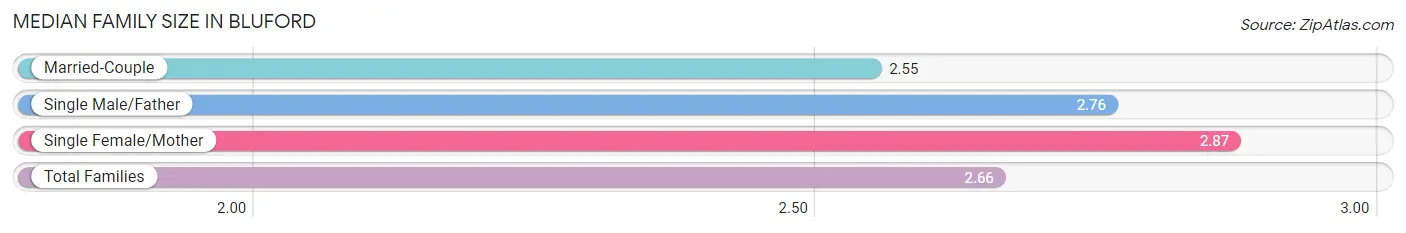
| Family Type | # Families | Family Size |
| Married-Couple | 110 (60.1%) | 2.55 |
| Single Male/Father | 21 (11.5%) | 2.76 |
| Single Female/Mother | 52 (28.4%) | 2.87 |
| Total Families | 183 (100.0%) | 2.66 |
Median Household Size in Bluford
The median household size in Bluford is 2.39 persons per household, with single male/father households (21 | 9.0%) accounting for the largest median household size of 3.1 persons per household. non-family households (49 | 21.1%) represent the smallest median household size with 1.08 persons per household.
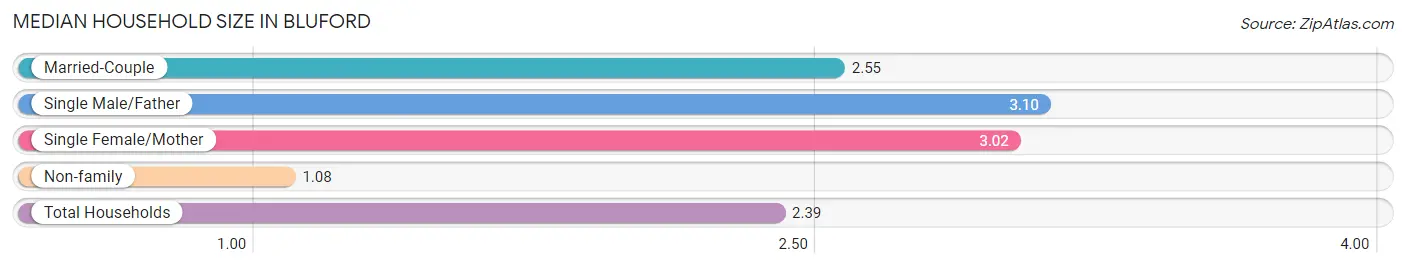
| Household Type | # Households | Household Size |
| Married-Couple | 110 (47.4%) | 2.55 |
| Single Male/Father | 21 (9.0%) | 3.10 |
| Single Female/Mother | 52 (22.4%) | 3.02 |
| Non-family | 49 (21.1%) | 1.08 |
| Total Households | 232 (100.0%) | 2.39 |
Household Size by Marriage Status in Bluford
Out of a total of 232 households in Bluford, 183 (78.9%) are family households, while 49 (21.1%) are nonfamily households. The most numerous type of family households are 2-person households, comprising 89, and the most common type of nonfamily households are 1-person households, comprising 45.
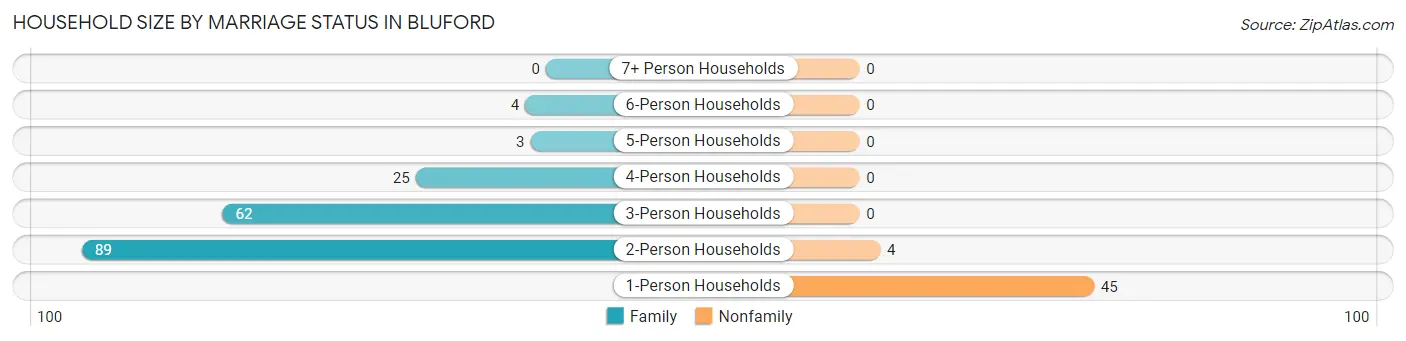
| Household Size | Family Households | Nonfamily Households |
| 1-Person Households | - | 45 (19.4%) |
| 2-Person Households | 89 (38.4%) | 4 (1.7%) |
| 3-Person Households | 62 (26.7%) | 0 (0.0%) |
| 4-Person Households | 25 (10.8%) | 0 (0.0%) |
| 5-Person Households | 3 (1.3%) | 0 (0.0%) |
| 6-Person Households | 4 (1.7%) | 0 (0.0%) |
| 7+ Person Households | 0 (0.0%) | 0 (0.0%) |
| Total | 183 (78.9%) | 49 (21.1%) |
Female Fertility in Bluford
Fertility by Age in Bluford
Average fertility rate in Bluford is 56.0 births per 1,000 women. Women in the age bracket of 20 to 34 years have the highest fertility rate with 100.0 births per 1,000 women. Women in the age bracket of 20 to 34 years acount for 100.0% of all women with births.
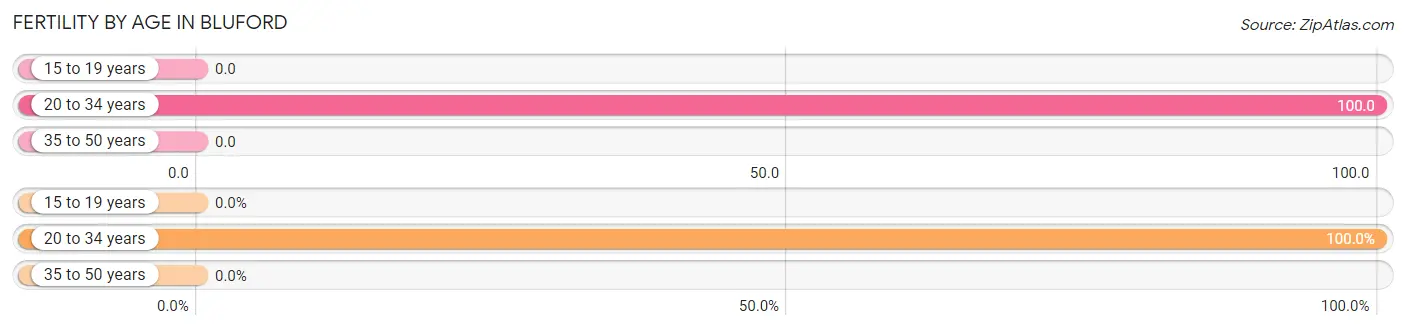
| Age Bracket | Women with Births | Births / 1,000 Women |
| 15 to 19 years | 0 (0.0%) | 0.0 |
| 20 to 34 years | 8 (100.0%) | 100.0 |
| 35 to 50 years | 0 (0.0%) | 0.0 |
| Total | 8 (100.0%) | 56.0 |
Fertility by Age by Marriage Status in Bluford
25.0% of women with births (8) in Bluford are married. The highest percentage of unmarried women with births falls into 20 to 34 years age bracket with 75.0% of them unmarried at the time of birth, while the lowest percentage of unmarried women with births belong to 20 to 34 years age bracket with 75.0% of them unmarried.
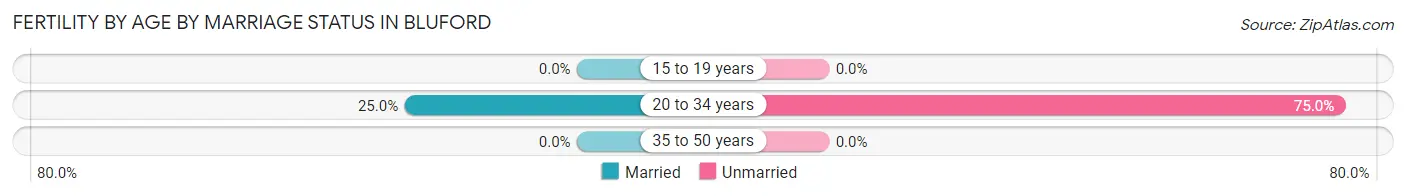
| Age Bracket | Married | Unmarried |
| 15 to 19 years | 0 (0.0%) | 0 (0.0%) |
| 20 to 34 years | 2 (25.0%) | 6 (75.0%) |
| 35 to 50 years | 0 (0.0%) | 0 (0.0%) |
| Total | 2 (25.0%) | 6 (75.0%) |
Fertility by Education in Bluford
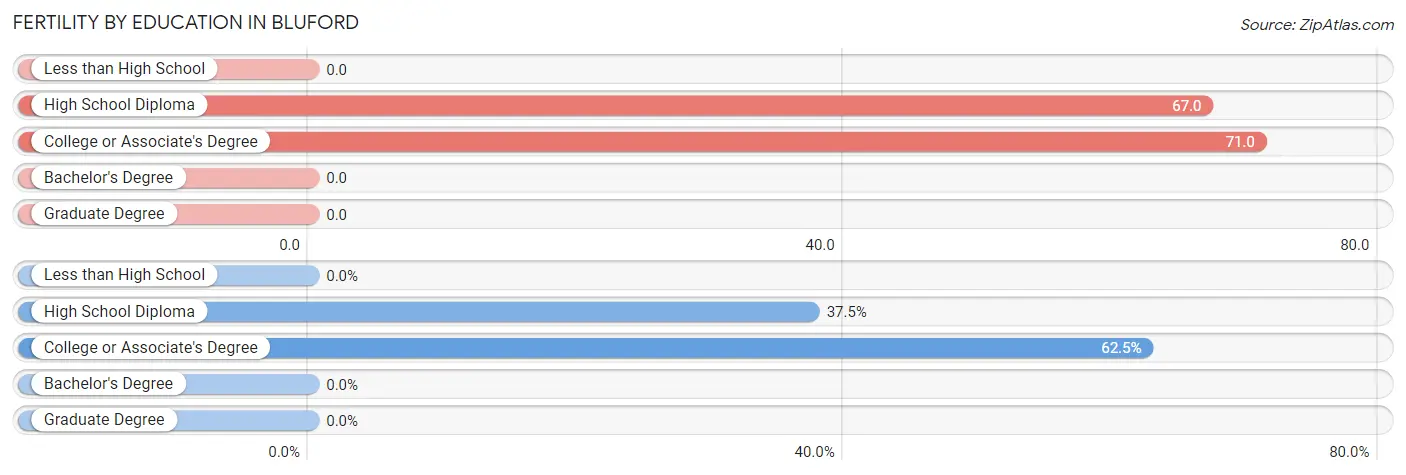
| Educational Attainment | Women with Births | Births / 1,000 Women |
| Less than High School | 0 (0.0%) | 0.0 |
| High School Diploma | 3 (37.5%) | 67.0 |
| College or Associate's Degree | 5 (62.5%) | 71.0 |
| Bachelor's Degree | 0 (0.0%) | 0.0 |
| Graduate Degree | 0 (0.0%) | 0.0 |
| Total | 8 (100.0%) | 56.0 |
Fertility by Education by Marriage Status in Bluford
75.0% of women with births in Bluford are unmarried. Women with the educational attainment of college or associate's degree are most likely to be married with 40.0% of them married at childbirth, while women with the educational attainment of high school diploma are least likely to be married with 100.0% of them unmarried at childbirth.
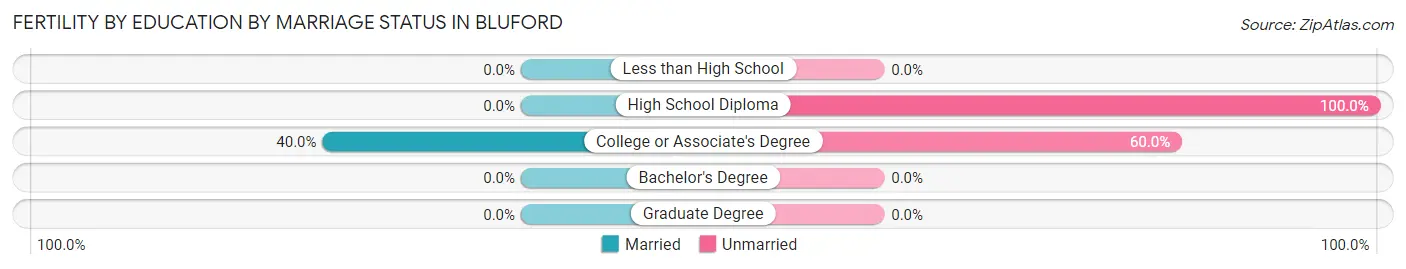
| Educational Attainment | Married | Unmarried |
| Less than High School | 0 (0.0%) | 0 (0.0%) |
| High School Diploma | 0 (0.0%) | 3 (100.0%) |
| College or Associate's Degree | 2 (40.0%) | 3 (60.0%) |
| Bachelor's Degree | 0 (0.0%) | 0 (0.0%) |
| Graduate Degree | 0 (0.0%) | 0 (0.0%) |
| Total | 2 (25.0%) | 6 (75.0%) |
Employment Characteristics in Bluford
Employment by Class of Employer in Bluford
Among the 287 employed individuals in Bluford, private company employees (177 | 61.7%), not-for-profit organizations (60 | 20.9%), and self-employed (not incorporated) (15 | 5.2%) make up the most common classes of employment.
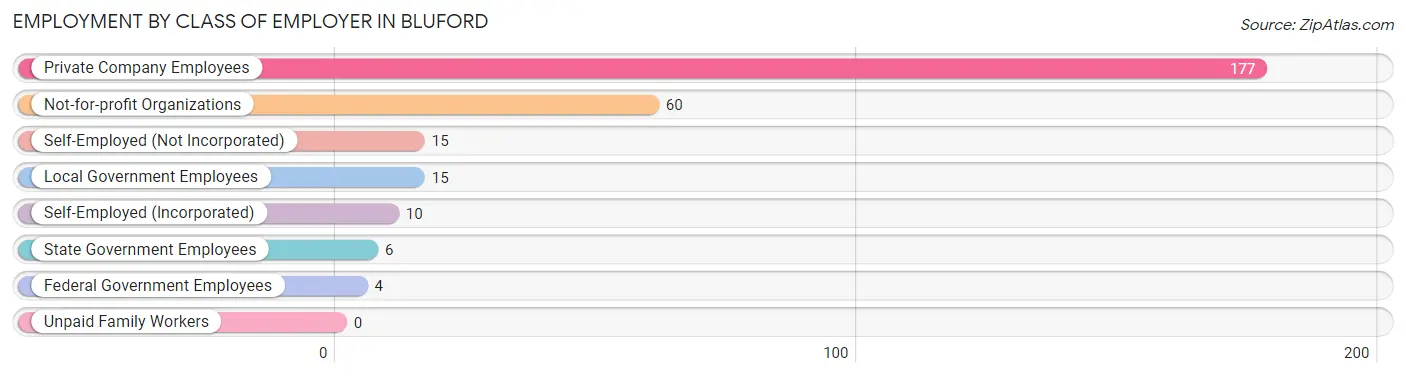
| Employer Class | # Employees | % Employees |
| Private Company Employees | 177 | 61.7% |
| Self-Employed (Incorporated) | 10 | 3.5% |
| Self-Employed (Not Incorporated) | 15 | 5.2% |
| Not-for-profit Organizations | 60 | 20.9% |
| Local Government Employees | 15 | 5.2% |
| State Government Employees | 6 | 2.1% |
| Federal Government Employees | 4 | 1.4% |
| Unpaid Family Workers | 0 | 0.0% |
| Total | 287 | 100.0% |
Employment Status by Age in Bluford
According to the labor force statistics for Bluford, out of the total population over 16 years of age (460), 67.0% or 308 individuals are in the labor force, with 6.8% or 21 of them unemployed. The age group with the highest labor force participation rate is 60 to 64 years, with 100.0% or 4 individuals in the labor force. Within the labor force, the 16 to 19 years age range has the highest percentage of unemployed individuals, with 66.7% or 6 of them being unemployed.
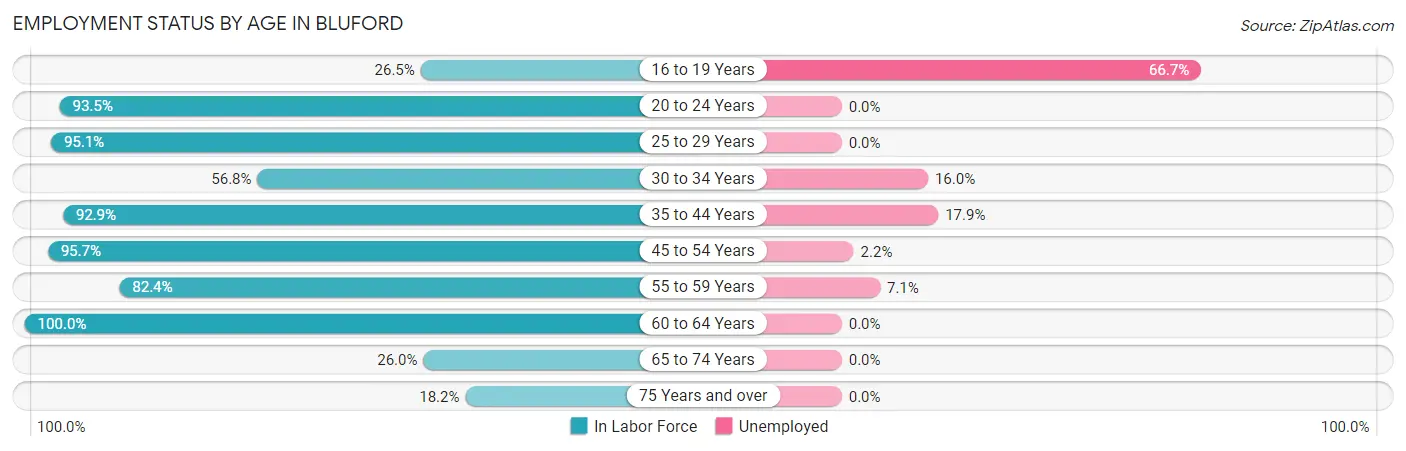
| Age Bracket | In Labor Force | Unemployed |
| 16 to 19 Years | 9 (26.5%) | 6 (66.7%) |
| 20 to 24 Years | 29 (93.5%) | 0 (0.0%) |
| 25 to 29 Years | 58 (95.1%) | 0 (0.0%) |
| 30 to 34 Years | 25 (56.8%) | 4 (16.0%) |
| 35 to 44 Years | 39 (92.9%) | 7 (17.9%) |
| 45 to 54 Years | 89 (95.7%) | 2 (2.2%) |
| 55 to 59 Years | 28 (82.4%) | 2 (7.1%) |
| 60 to 64 Years | 4 (100.0%) | 0 (0.0%) |
| 65 to 74 Years | 19 (26.0%) | 0 (0.0%) |
| 75 Years and over | 8 (18.2%) | 0 (0.0%) |
| Total | 308 (67.0%) | 21 (6.8%) |
Employment Status by Educational Attainment in Bluford
According to labor force statistics for Bluford, 87.4% of individuals (243) out of the total population between 25 and 64 years of age (278) are in the labor force, with 6.2% or 15 of them being unemployed. The group with the highest labor force participation rate are those with the educational attainment of high school diploma, with 92.2% or 106 individuals in the labor force. Within the labor force, individuals with less than high school education have the highest percentage of unemployment, with 8.7% or 2 of them being unemployed.
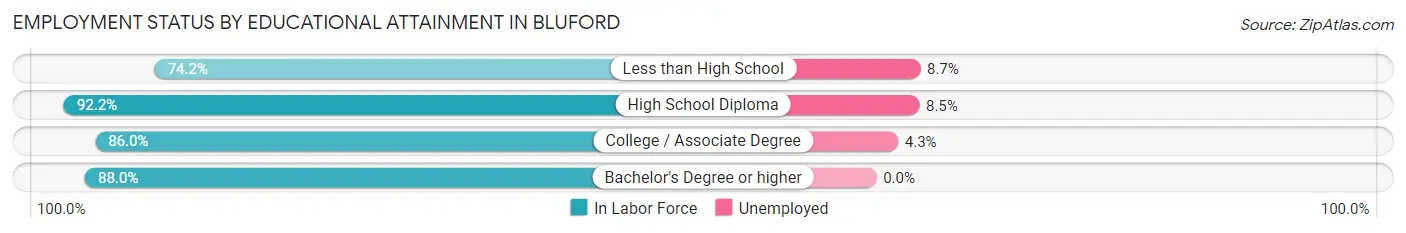
| Educational Attainment | In Labor Force | Unemployed |
| Less than High School | 23 (74.2%) | 3 (8.7%) |
| High School Diploma | 106 (92.2%) | 10 (8.5%) |
| College / Associate Degree | 92 (86.0%) | 5 (4.3%) |
| Bachelor's Degree or higher | 22 (88.0%) | 0 (0.0%) |
| Total | 243 (87.4%) | 17 (6.2%) |
Employment Occupations by Sex in Bluford
Management, Business, Science and Arts Occupations
The most common Management, Business, Science and Arts occupations in Bluford are Community & Social Service (34 | 11.8%), Health Diagnosing & Treating (23 | 8.0%), Education Instruction & Library (13 | 4.5%), Legal Services & Support (11 | 3.8%), and Education, Arts & Media (10 | 3.5%).
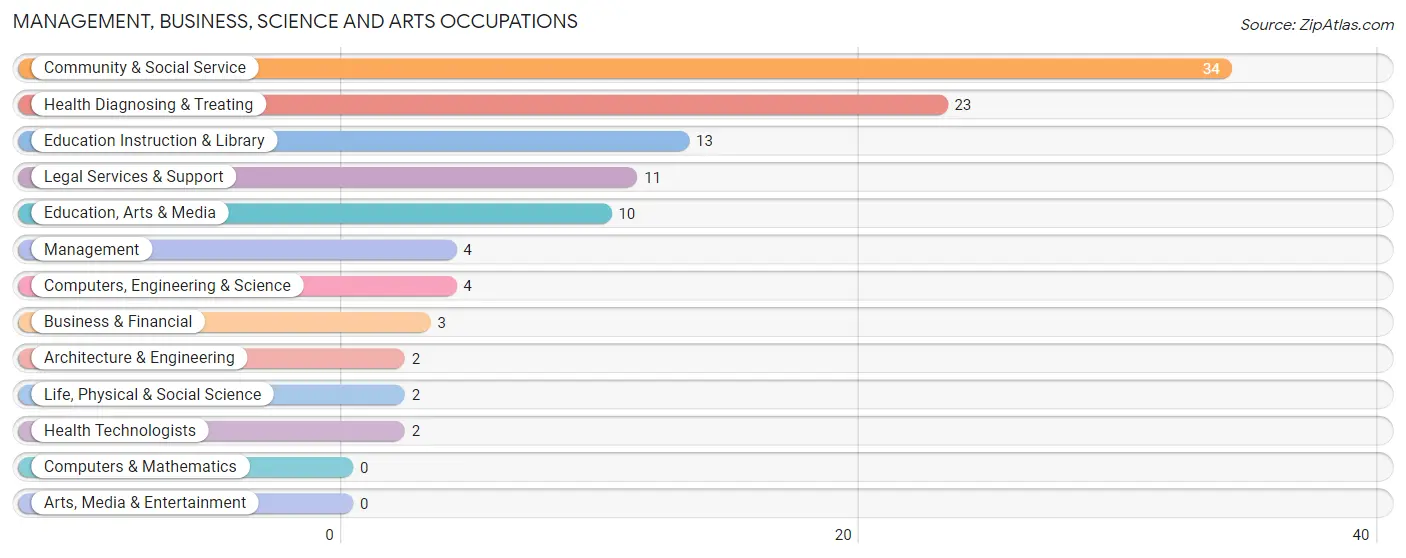
Management, Business, Science and Arts Occupations by Sex
Within the Management, Business, Science and Arts occupations in Bluford, the most male-oriented occupations are Management (100.0%), Computers, Engineering & Science (100.0%), and Architecture & Engineering (100.0%), while the most female-oriented occupations are Business & Financial (100.0%), Legal Services & Support (100.0%), and Health Diagnosing & Treating (100.0%).
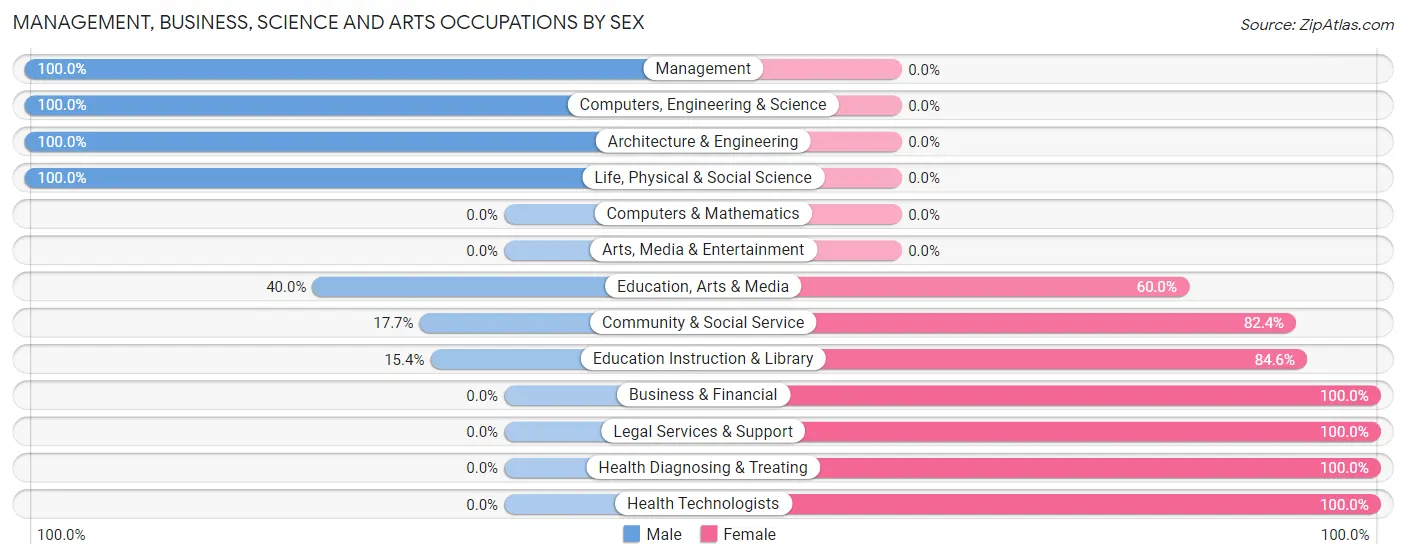
| Occupation | Male | Female |
| Management | 4 (100.0%) | 0 (0.0%) |
| Business & Financial | 0 (0.0%) | 3 (100.0%) |
| Computers, Engineering & Science | 4 (100.0%) | 0 (0.0%) |
| Computers & Mathematics | 0 (0.0%) | 0 (0.0%) |
| Architecture & Engineering | 2 (100.0%) | 0 (0.0%) |
| Life, Physical & Social Science | 2 (100.0%) | 0 (0.0%) |
| Community & Social Service | 6 (17.6%) | 28 (82.4%) |
| Education, Arts & Media | 4 (40.0%) | 6 (60.0%) |
| Legal Services & Support | 0 (0.0%) | 11 (100.0%) |
| Education Instruction & Library | 2 (15.4%) | 11 (84.6%) |
| Arts, Media & Entertainment | 0 (0.0%) | 0 (0.0%) |
| Health Diagnosing & Treating | 0 (0.0%) | 23 (100.0%) |
| Health Technologists | 0 (0.0%) | 2 (100.0%) |
| Total (Category) | 14 (20.6%) | 54 (79.4%) |
| Total (Overall) | 134 (46.7%) | 153 (53.3%) |
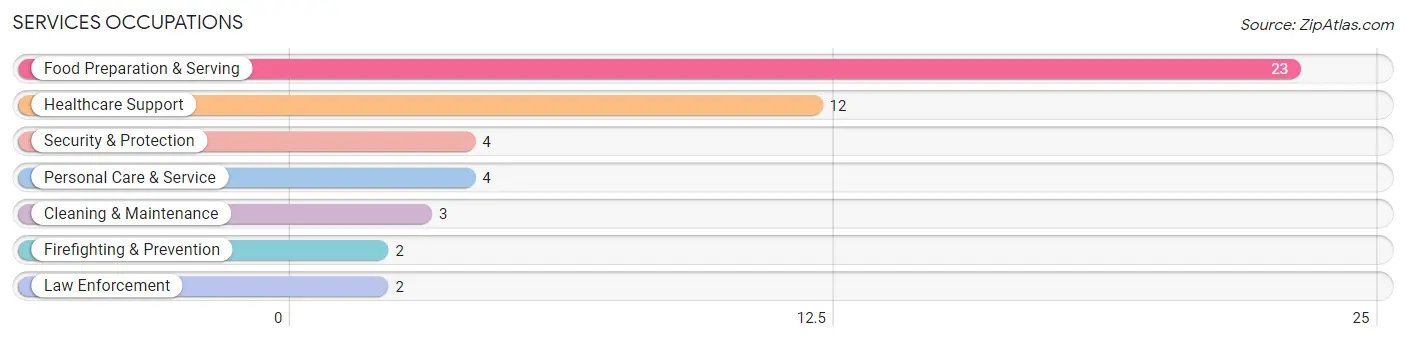
Services Occupations
The most common Services occupations in Bluford are Food Preparation & Serving (23 | 8.0%), Healthcare Support (12 | 4.2%), Security & Protection (4 | 1.4%), Personal Care & Service (4 | 1.4%), and Cleaning & Maintenance (3 | 1.1%).
Services Occupations by Sex
Within the Services occupations in Bluford, the most male-oriented occupations are Security & Protection (100.0%), Firefighting & Prevention (100.0%), and Law Enforcement (100.0%), while the most female-oriented occupations are Healthcare Support (100.0%), Cleaning & Maintenance (100.0%), and Food Preparation & Serving (87.0%).
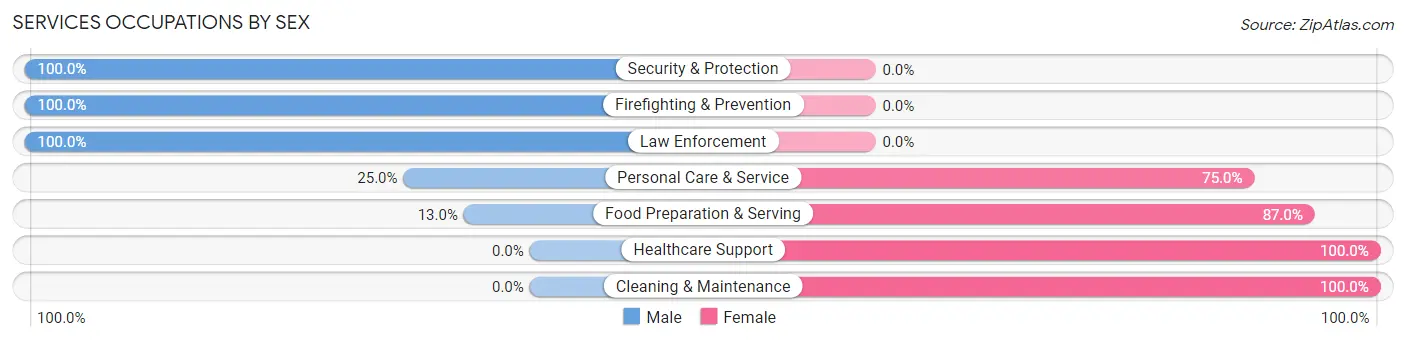
| Occupation | Male | Female |
| Healthcare Support | 0 (0.0%) | 12 (100.0%) |
| Security & Protection | 4 (100.0%) | 0 (0.0%) |
| Firefighting & Prevention | 2 (100.0%) | 0 (0.0%) |
| Law Enforcement | 2 (100.0%) | 0 (0.0%) |
| Food Preparation & Serving | 3 (13.0%) | 20 (87.0%) |
| Cleaning & Maintenance | 0 (0.0%) | 3 (100.0%) |
| Personal Care & Service | 1 (25.0%) | 3 (75.0%) |
| Total (Category) | 8 (17.4%) | 38 (82.6%) |
| Total (Overall) | 134 (46.7%) | 153 (53.3%) |
Sales and Office Occupations
The most common Sales and Office occupations in Bluford are Sales & Related (35 | 12.2%), and Office & Administration (25 | 8.7%).

Sales and Office Occupations by Sex
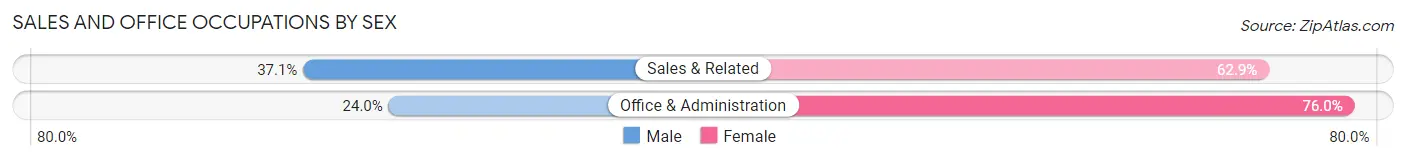
| Occupation | Male | Female |
| Sales & Related | 13 (37.1%) | 22 (62.9%) |
| Office & Administration | 6 (24.0%) | 19 (76.0%) |
| Total (Category) | 19 (31.7%) | 41 (68.3%) |
| Total (Overall) | 134 (46.7%) | 153 (53.3%) |
Natural Resources, Construction and Maintenance Occupations
The most common Natural Resources, Construction and Maintenance occupations in Bluford are Installation, Maintenance & Repair (13 | 4.5%), Construction & Extraction (12 | 4.2%), and Farming, Fishing & Forestry (5 | 1.7%).

Natural Resources, Construction and Maintenance Occupations by Sex

| Occupation | Male | Female |
| Farming, Fishing & Forestry | 5 (100.0%) | 0 (0.0%) |
| Construction & Extraction | 12 (100.0%) | 0 (0.0%) |
| Installation, Maintenance & Repair | 13 (100.0%) | 0 (0.0%) |
| Total (Category) | 30 (100.0%) | 0 (0.0%) |
| Total (Overall) | 134 (46.7%) | 153 (53.3%) |
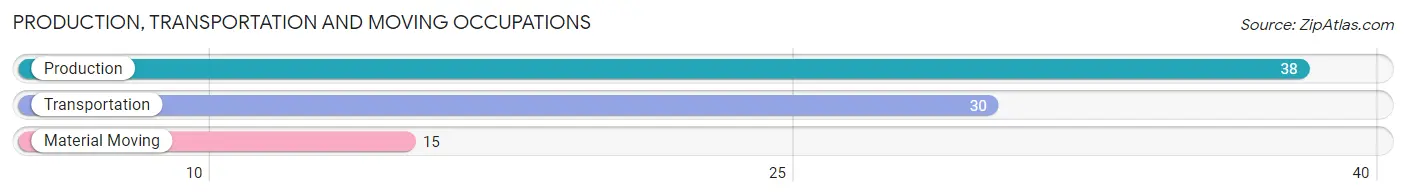
Production, Transportation and Moving Occupations
The most common Production, Transportation and Moving occupations in Bluford are Production (38 | 13.2%), Transportation (30 | 10.4%), and Material Moving (15 | 5.2%).
Production, Transportation and Moving Occupations by Sex
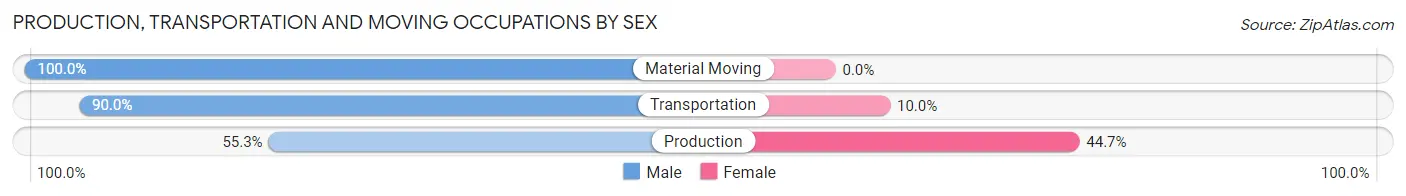
| Occupation | Male | Female |
| Production | 21 (55.3%) | 17 (44.7%) |
| Transportation | 27 (90.0%) | 3 (10.0%) |
| Material Moving | 15 (100.0%) | 0 (0.0%) |
| Total (Category) | 63 (75.9%) | 20 (24.1%) |
| Total (Overall) | 134 (46.7%) | 153 (53.3%) |
Employment Industries by Sex in Bluford
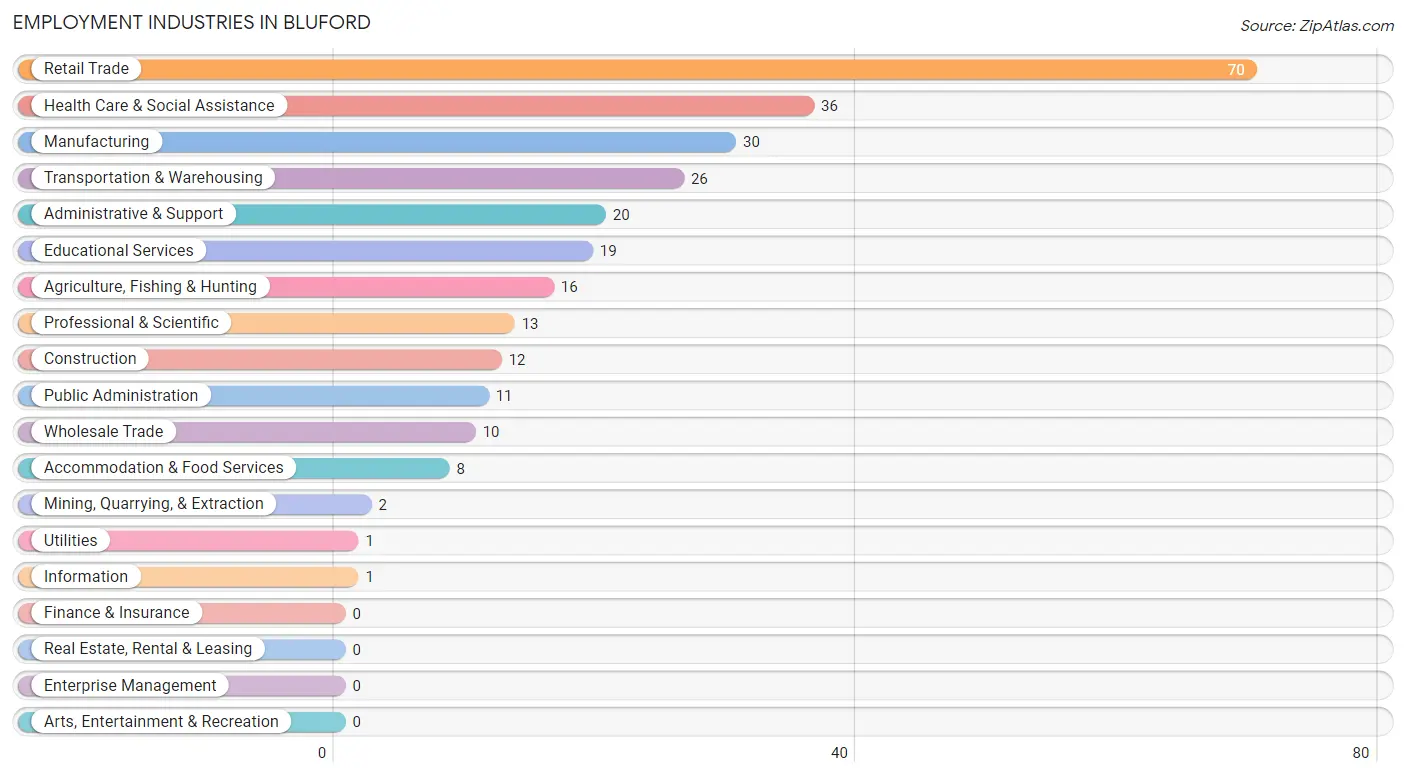
Employment Industries in Bluford
The major employment industries in Bluford include Retail Trade (70 | 24.4%), Health Care & Social Assistance (36 | 12.5%), Manufacturing (30 | 10.4%), Transportation & Warehousing (26 | 9.1%), and Administrative & Support (20 | 7.0%).
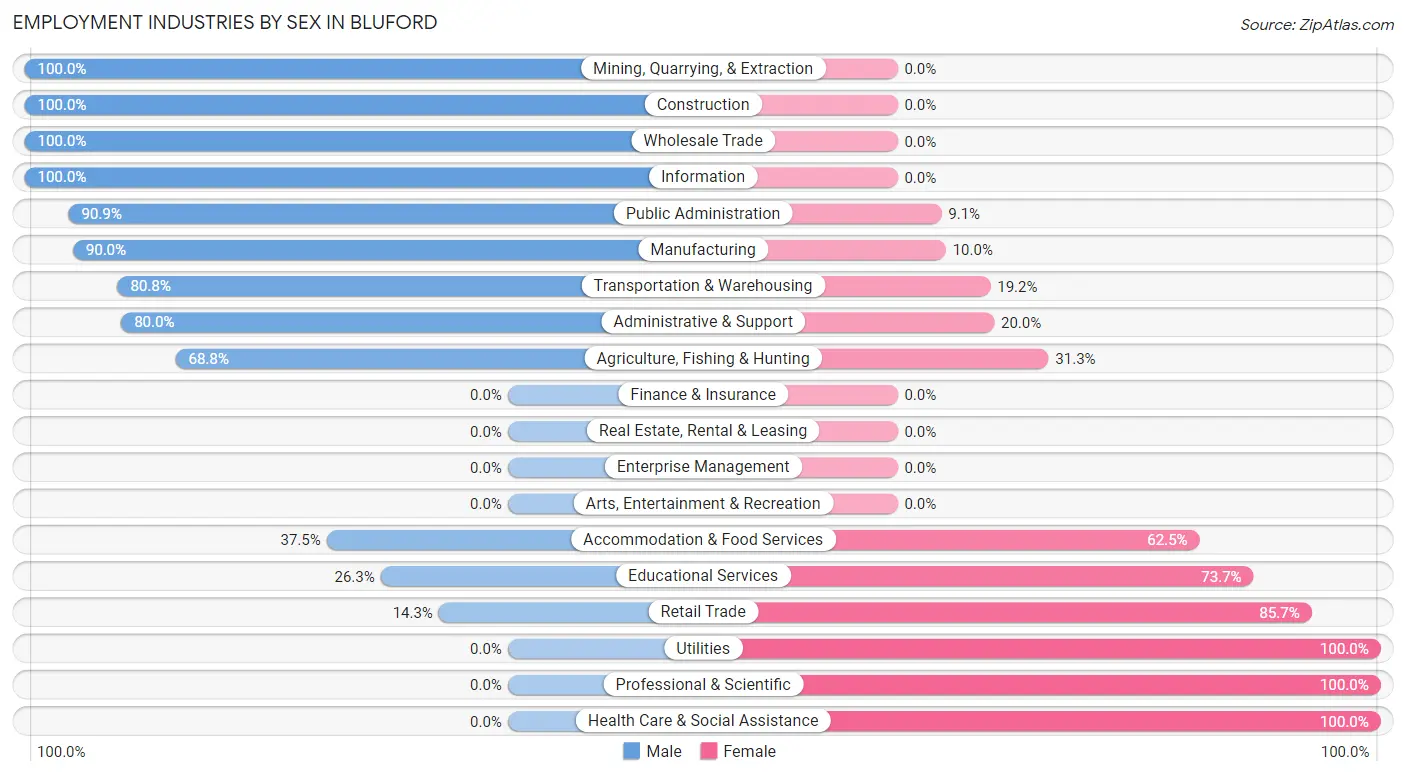
Employment Industries by Sex in Bluford
The Bluford industries that see more men than women are Mining, Quarrying, & Extraction (100.0%), Construction (100.0%), and Wholesale Trade (100.0%), whereas the industries that tend to have a higher number of women are Utilities (100.0%), Professional & Scientific (100.0%), and Health Care & Social Assistance (100.0%).
| Industry | Male | Female |
| Agriculture, Fishing & Hunting | 11 (68.8%) | 5 (31.2%) |
| Mining, Quarrying, & Extraction | 2 (100.0%) | 0 (0.0%) |
| Construction | 12 (100.0%) | 0 (0.0%) |
| Manufacturing | 27 (90.0%) | 3 (10.0%) |
| Wholesale Trade | 10 (100.0%) | 0 (0.0%) |
| Retail Trade | 10 (14.3%) | 60 (85.7%) |
| Transportation & Warehousing | 21 (80.8%) | 5 (19.2%) |
| Utilities | 0 (0.0%) | 1 (100.0%) |
| Information | 1 (100.0%) | 0 (0.0%) |
| Finance & Insurance | 0 (0.0%) | 0 (0.0%) |
| Real Estate, Rental & Leasing | 0 (0.0%) | 0 (0.0%) |
| Professional & Scientific | 0 (0.0%) | 13 (100.0%) |
| Enterprise Management | 0 (0.0%) | 0 (0.0%) |
| Administrative & Support | 16 (80.0%) | 4 (20.0%) |
| Educational Services | 5 (26.3%) | 14 (73.7%) |
| Health Care & Social Assistance | 0 (0.0%) | 36 (100.0%) |
| Arts, Entertainment & Recreation | 0 (0.0%) | 0 (0.0%) |
| Accommodation & Food Services | 3 (37.5%) | 5 (62.5%) |
| Public Administration | 10 (90.9%) | 1 (9.1%) |
| Total | 134 (46.7%) | 153 (53.3%) |
Education in Bluford
School Enrollment in Bluford
The most common levels of schooling among the 113 students in Bluford are elementary school (29 | 25.7%), college / undergraduate (29 | 25.7%), and middle school (26 | 23.0%).
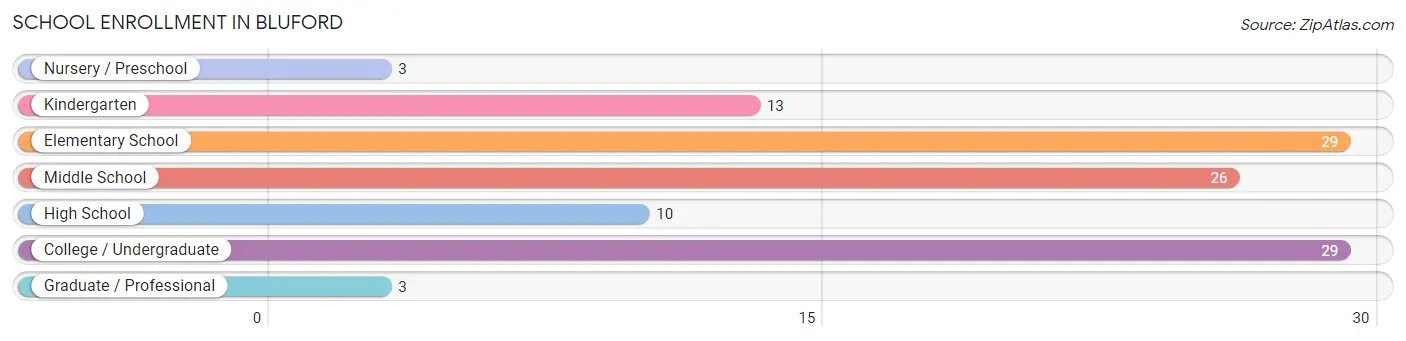
| School Level | # Students | % Students |
| Nursery / Preschool | 3 | 2.6% |
| Kindergarten | 13 | 11.5% |
| Elementary School | 29 | 25.7% |
| Middle School | 26 | 23.0% |
| High School | 10 | 8.8% |
| College / Undergraduate | 29 | 25.7% |
| Graduate / Professional | 3 | 2.6% |
| Total | 113 | 100.0% |
School Enrollment by Age by Funding Source in Bluford
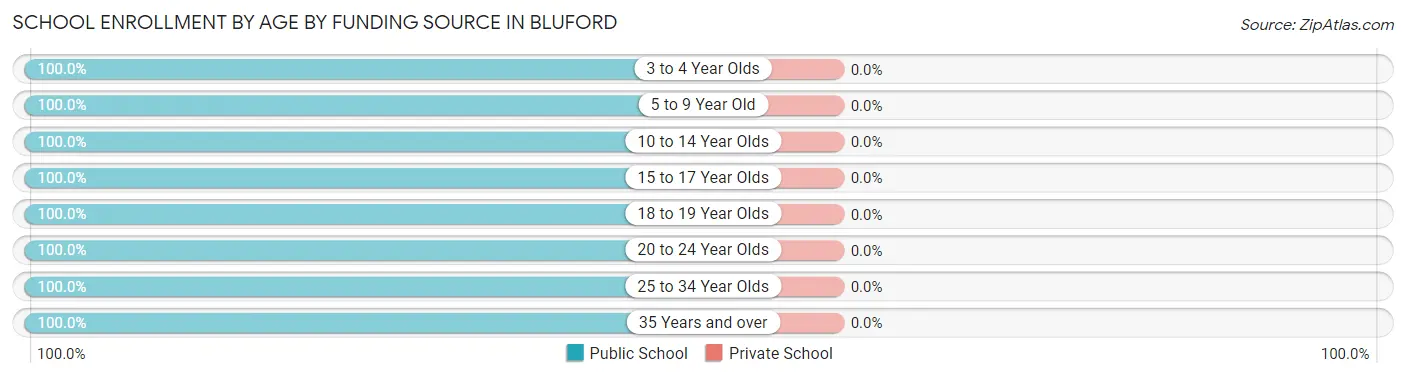
| Age Bracket | Public School | Private School |
| 3 to 4 Year Olds | 9 (100.0%) | 0 (0.0%) |
| 5 to 9 Year Old | 34 (100.0%) | 0 (0.0%) |
| 10 to 14 Year Olds | 28 (100.0%) | 0 (0.0%) |
| 15 to 17 Year Olds | 10 (100.0%) | 0 (0.0%) |
| 18 to 19 Year Olds | 21 (100.0%) | 0 (0.0%) |
| 20 to 24 Year Olds | 1 (100.0%) | 0 (0.0%) |
| 25 to 34 Year Olds | 6 (100.0%) | 0 (0.0%) |
| 35 Years and over | 4 (100.0%) | 0 (0.0%) |
| Total | 113 (100.0%) | 0 (0.0%) |
Educational Attainment by Field of Study in Bluford
Business (10 | 25.6%), education (7 | 17.9%), arts & humanities (5 | 12.8%), engineering (4 | 10.3%), and physical & health sciences (2 | 5.1%) are the most common fields of study among 39 individuals in Bluford who have obtained a bachelor's degree or higher.
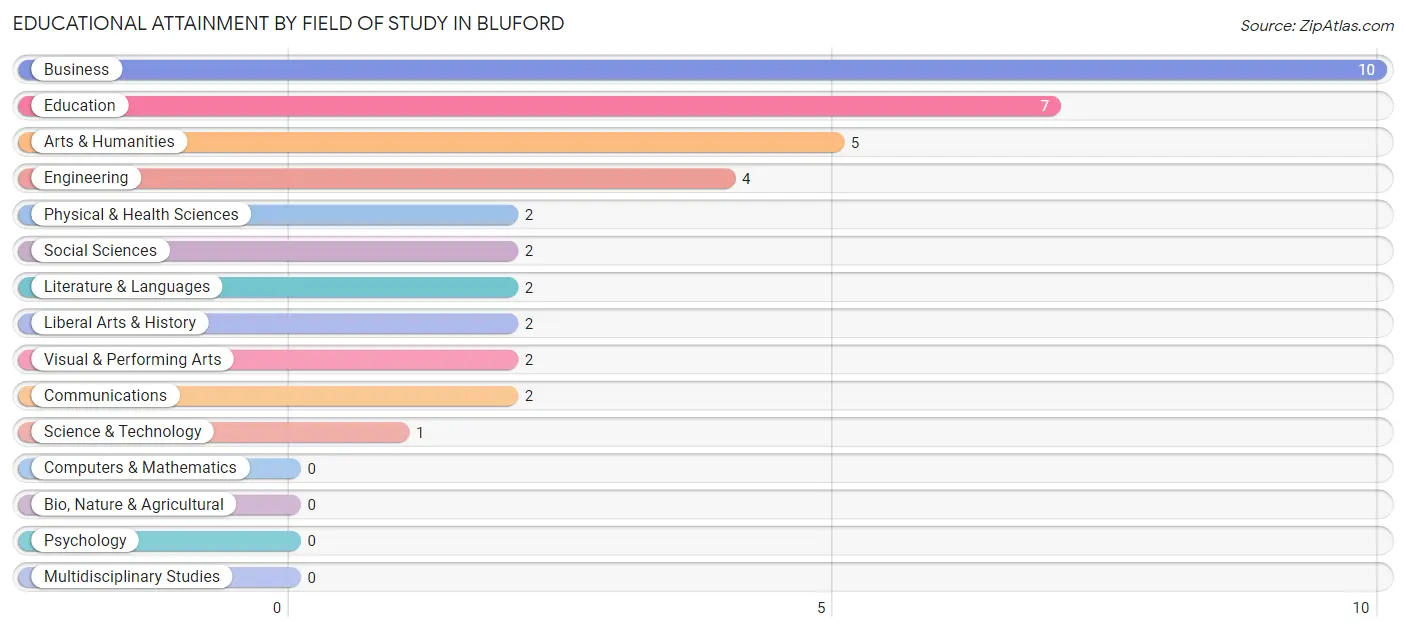
| Field of Study | # Graduates | % Graduates |
| Computers & Mathematics | 0 | 0.0% |
| Bio, Nature & Agricultural | 0 | 0.0% |
| Physical & Health Sciences | 2 | 5.1% |
| Psychology | 0 | 0.0% |
| Social Sciences | 2 | 5.1% |
| Engineering | 4 | 10.3% |
| Multidisciplinary Studies | 0 | 0.0% |
| Science & Technology | 1 | 2.6% |
| Business | 10 | 25.6% |
| Education | 7 | 17.9% |
| Literature & Languages | 2 | 5.1% |
| Liberal Arts & History | 2 | 5.1% |
| Visual & Performing Arts | 2 | 5.1% |
| Communications | 2 | 5.1% |
| Arts & Humanities | 5 | 12.8% |
| Total | 39 | 100.0% |
Transportation & Commute in Bluford
Vehicle Availability by Sex in Bluford
The most prevalent vehicle ownership categories in Bluford are males with 2 vehicles (51, accounting for 38.1%) and females with 2 vehicles (76, making up 33.3%).
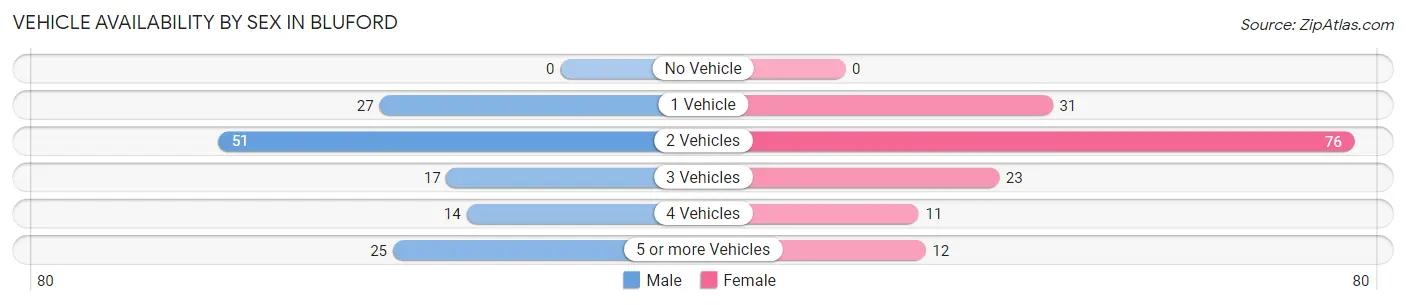
| Vehicles Available | Male | Female |
| No Vehicle | 0 (0.0%) | 0 (0.0%) |
| 1 Vehicle | 27 (20.2%) | 31 (20.3%) |
| 2 Vehicles | 51 (38.1%) | 76 (49.7%) |
| 3 Vehicles | 17 (12.7%) | 23 (15.0%) |
| 4 Vehicles | 14 (10.4%) | 11 (7.2%) |
| 5 or more Vehicles | 25 (18.7%) | 12 (7.8%) |
| Total | 134 (100.0%) | 153 (100.0%) |
Commute Time in Bluford
The most frequently occuring commute durations in Bluford are 20 to 24 minutes (91 commuters, 32.7%), 15 to 19 minutes (63 commuters, 22.7%), and 10 to 14 minutes (40 commuters, 14.4%).
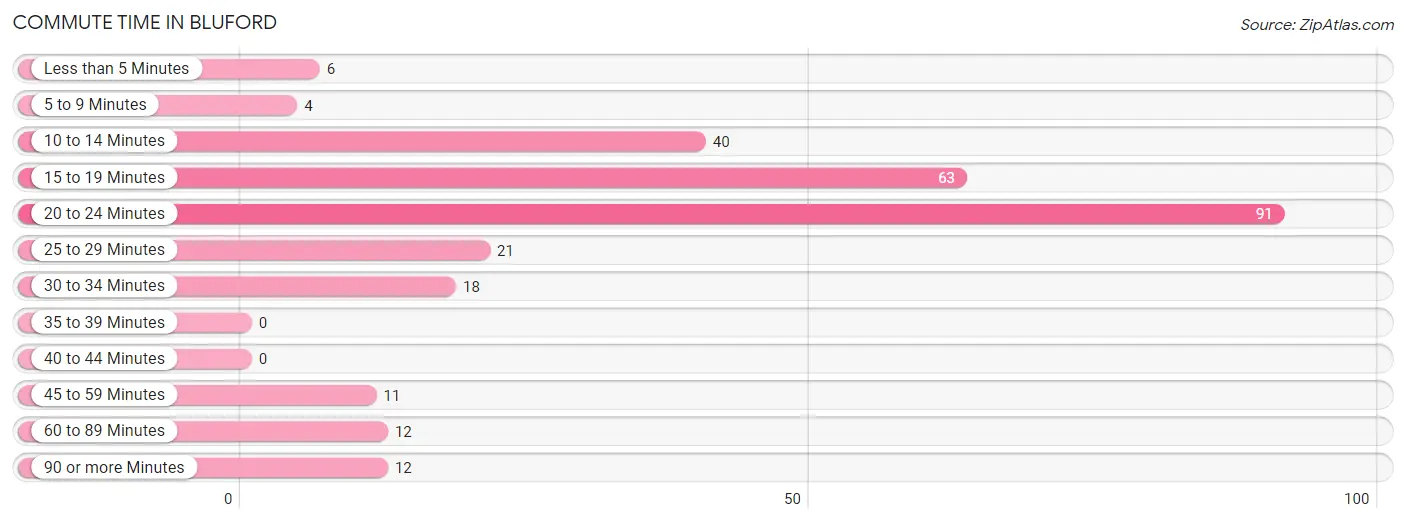
| Commute Time | # Commuters | % Commuters |
| Less than 5 Minutes | 6 | 2.2% |
| 5 to 9 Minutes | 4 | 1.4% |
| 10 to 14 Minutes | 40 | 14.4% |
| 15 to 19 Minutes | 63 | 22.7% |
| 20 to 24 Minutes | 91 | 32.7% |
| 25 to 29 Minutes | 21 | 7.5% |
| 30 to 34 Minutes | 18 | 6.5% |
| 35 to 39 Minutes | 0 | 0.0% |
| 40 to 44 Minutes | 0 | 0.0% |
| 45 to 59 Minutes | 11 | 4.0% |
| 60 to 89 Minutes | 12 | 4.3% |
| 90 or more Minutes | 12 | 4.3% |
Commute Time by Sex in Bluford
The most common commute times in Bluford are 20 to 24 minutes (50 commuters, 38.5%) for males and 15 to 19 minutes (51 commuters, 34.5%) for females.
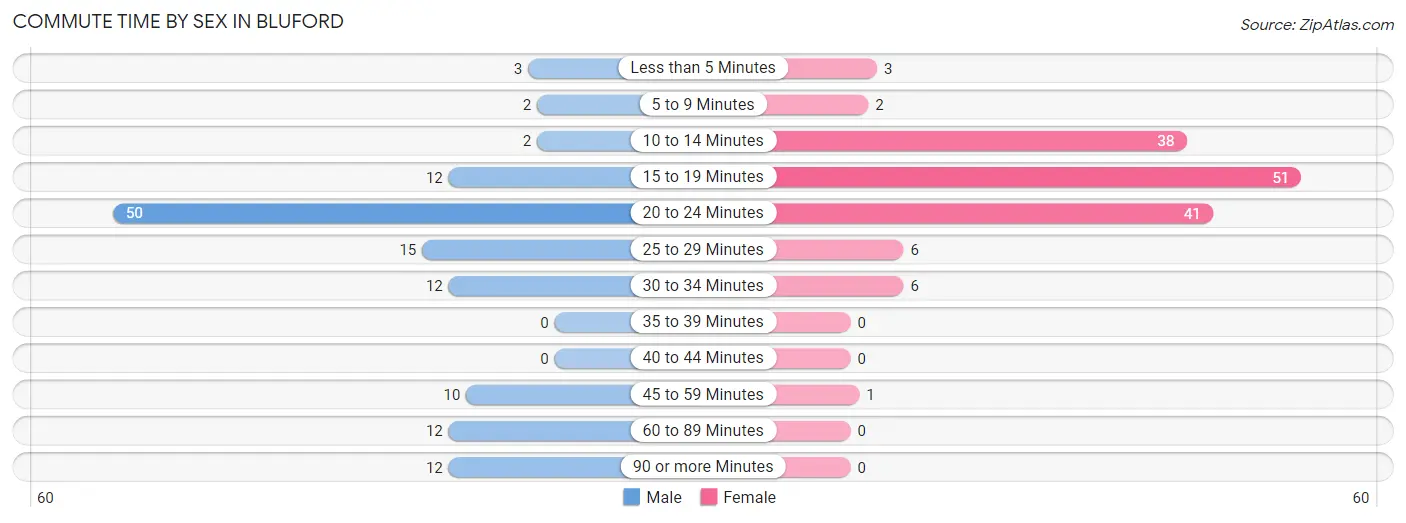
| Commute Time | Male | Female |
| Less than 5 Minutes | 3 (2.3%) | 3 (2.0%) |
| 5 to 9 Minutes | 2 (1.5%) | 2 (1.3%) |
| 10 to 14 Minutes | 2 (1.5%) | 38 (25.7%) |
| 15 to 19 Minutes | 12 (9.2%) | 51 (34.5%) |
| 20 to 24 Minutes | 50 (38.5%) | 41 (27.7%) |
| 25 to 29 Minutes | 15 (11.5%) | 6 (4.1%) |
| 30 to 34 Minutes | 12 (9.2%) | 6 (4.1%) |
| 35 to 39 Minutes | 0 (0.0%) | 0 (0.0%) |
| 40 to 44 Minutes | 0 (0.0%) | 0 (0.0%) |
| 45 to 59 Minutes | 10 (7.7%) | 1 (0.7%) |
| 60 to 89 Minutes | 12 (9.2%) | 0 (0.0%) |
| 90 or more Minutes | 12 (9.2%) | 0 (0.0%) |
Time of Departure to Work by Sex in Bluford
The most frequent times of departure to work in Bluford are 8:00 AM to 8:29 AM (22, 16.9%) for males and 7:00 AM to 7:29 AM (34, 23.0%) for females.
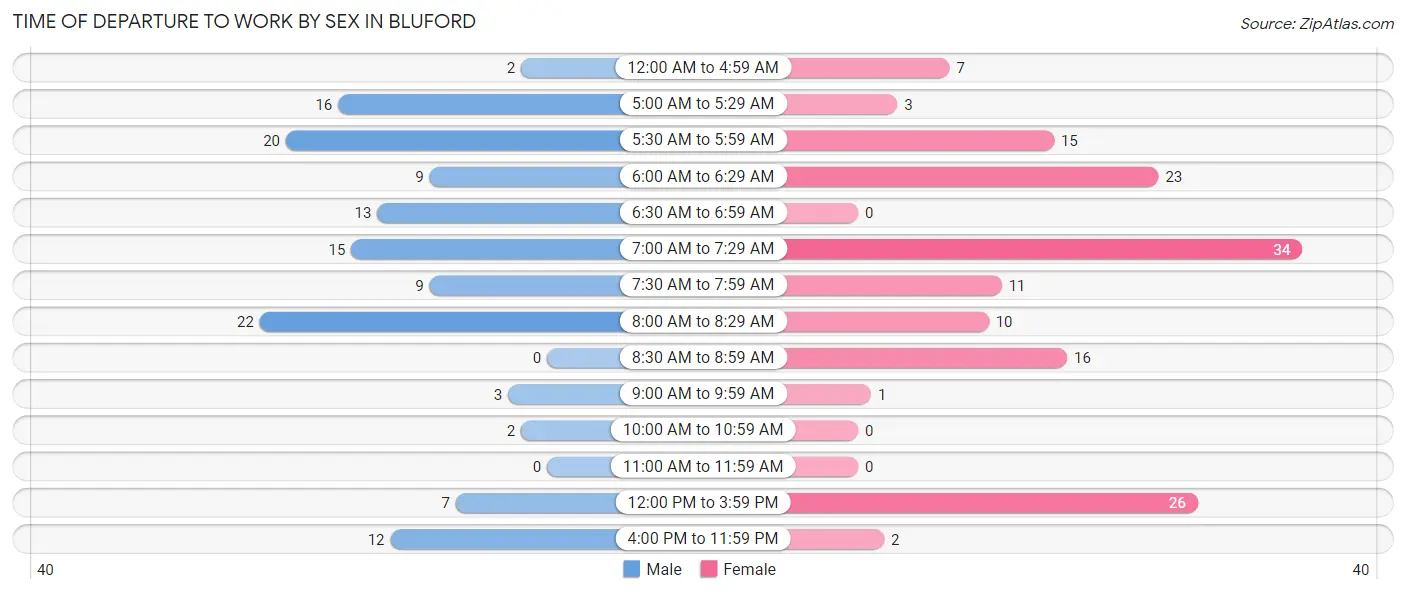
| Time of Departure | Male | Female |
| 12:00 AM to 4:59 AM | 2 (1.5%) | 7 (4.7%) |
| 5:00 AM to 5:29 AM | 16 (12.3%) | 3 (2.0%) |
| 5:30 AM to 5:59 AM | 20 (15.4%) | 15 (10.1%) |
| 6:00 AM to 6:29 AM | 9 (6.9%) | 23 (15.5%) |
| 6:30 AM to 6:59 AM | 13 (10.0%) | 0 (0.0%) |
| 7:00 AM to 7:29 AM | 15 (11.5%) | 34 (23.0%) |
| 7:30 AM to 7:59 AM | 9 (6.9%) | 11 (7.4%) |
| 8:00 AM to 8:29 AM | 22 (16.9%) | 10 (6.8%) |
| 8:30 AM to 8:59 AM | 0 (0.0%) | 16 (10.8%) |
| 9:00 AM to 9:59 AM | 3 (2.3%) | 1 (0.7%) |
| 10:00 AM to 10:59 AM | 2 (1.5%) | 0 (0.0%) |
| 11:00 AM to 11:59 AM | 0 (0.0%) | 0 (0.0%) |
| 12:00 PM to 3:59 PM | 7 (5.4%) | 26 (17.6%) |
| 4:00 PM to 11:59 PM | 12 (9.2%) | 2 (1.3%) |
| Total | 130 (100.0%) | 148 (100.0%) |
Housing Occupancy in Bluford
Occupancy by Ownership in Bluford
Of the total 232 dwellings in Bluford, owner-occupied units account for 191 (82.3%), while renter-occupied units make up 41 (17.7%).
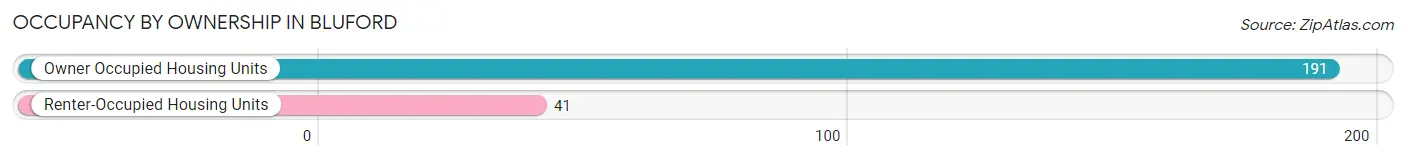
| Occupancy | # Housing Units | % Housing Units |
| Owner Occupied Housing Units | 191 | 82.3% |
| Renter-Occupied Housing Units | 41 | 17.7% |
| Total Occupied Housing Units | 232 | 100.0% |
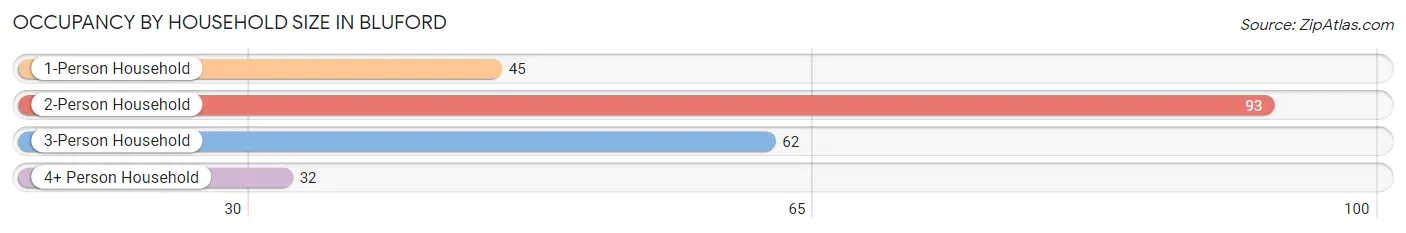
Occupancy by Household Size in Bluford
| Household Size | # Housing Units | % Housing Units |
| 1-Person Household | 45 | 19.4% |
| 2-Person Household | 93 | 40.1% |
| 3-Person Household | 62 | 26.7% |
| 4+ Person Household | 32 | 13.8% |
| Total Housing Units | 232 | 100.0% |
Occupancy by Ownership by Household Size in Bluford
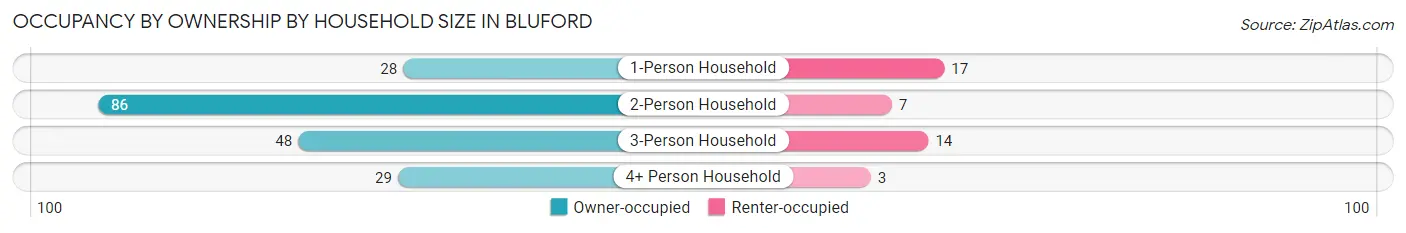
| Household Size | Owner-occupied | Renter-occupied |
| 1-Person Household | 28 (62.2%) | 17 (37.8%) |
| 2-Person Household | 86 (92.5%) | 7 (7.5%) |
| 3-Person Household | 48 (77.4%) | 14 (22.6%) |
| 4+ Person Household | 29 (90.6%) | 3 (9.4%) |
| Total Housing Units | 191 (82.3%) | 41 (17.7%) |
Occupancy by Educational Attainment in Bluford
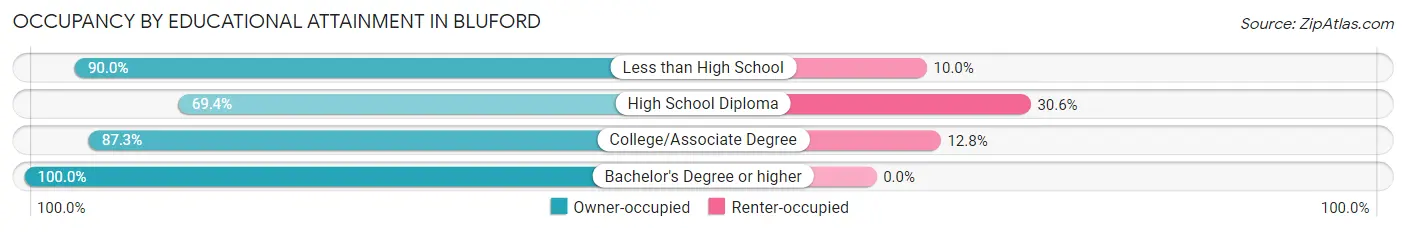
| Household Size | Owner-occupied | Renter-occupied |
| Less than High School | 18 (90.0%) | 2 (10.0%) |
| High School Diploma | 59 (69.4%) | 26 (30.6%) |
| College/Associate Degree | 89 (87.3%) | 13 (12.8%) |
| Bachelor's Degree or higher | 25 (100.0%) | 0 (0.0%) |
Occupancy by Age of Householder in Bluford
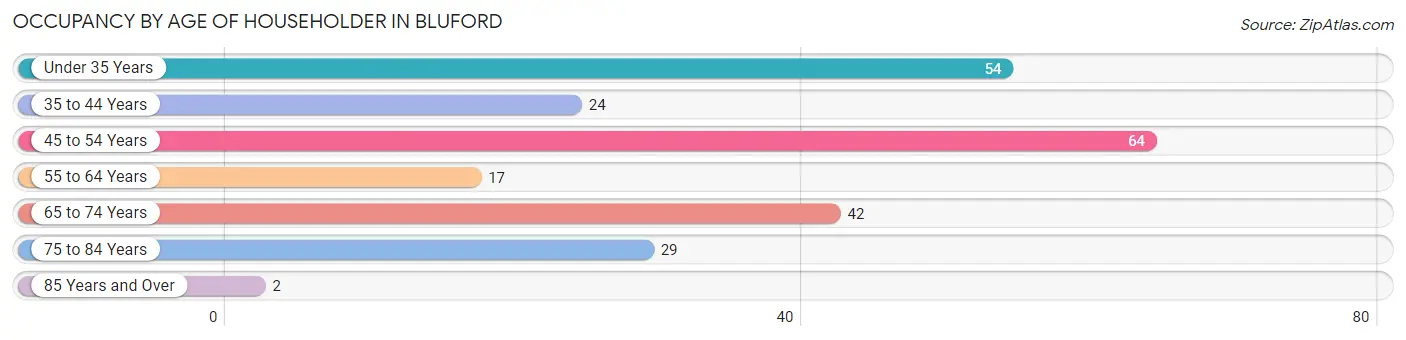
| Age Bracket | # Households | % Households |
| Under 35 Years | 54 | 23.3% |
| 35 to 44 Years | 24 | 10.3% |
| 45 to 54 Years | 64 | 27.6% |
| 55 to 64 Years | 17 | 7.3% |
| 65 to 74 Years | 42 | 18.1% |
| 75 to 84 Years | 29 | 12.5% |
| 85 Years and Over | 2 | 0.9% |
| Total | 232 | 100.0% |
Housing Finances in Bluford
Median Income by Occupancy in Bluford
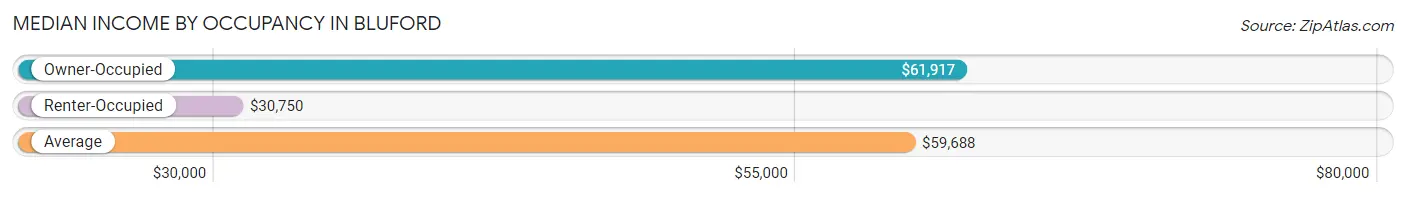
| Occupancy Type | # Households | Median Income |
| Owner-Occupied | 191 (82.3%) | $61,917 |
| Renter-Occupied | 41 (17.7%) | $30,750 |
| Average | 232 (100.0%) | $59,688 |
Occupancy by Householder Income Bracket in Bluford
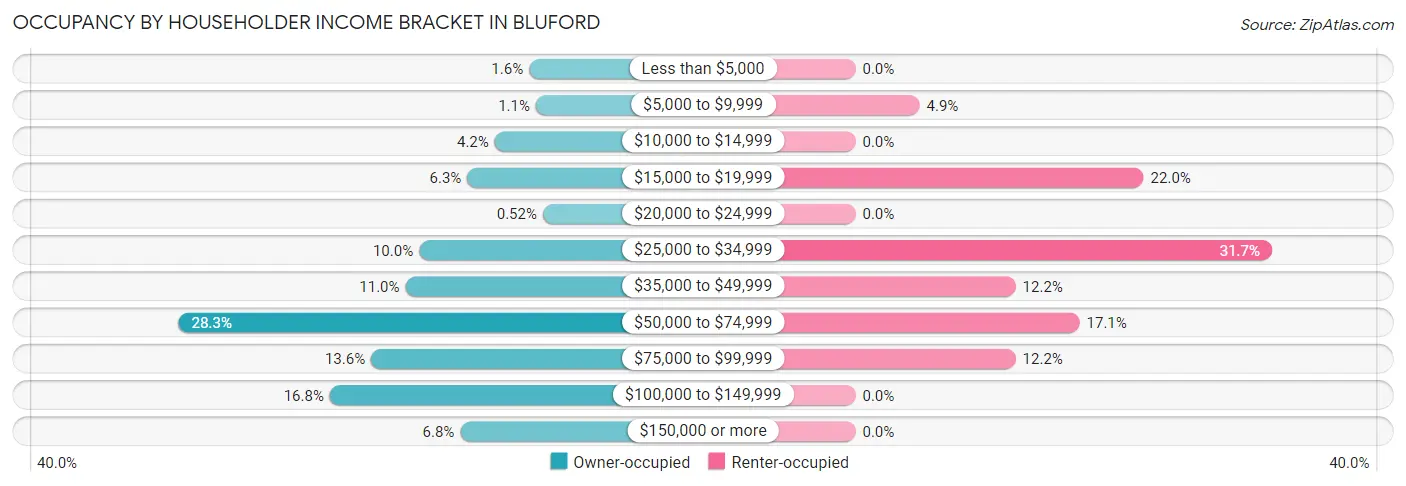
| Income Bracket | Owner-occupied | Renter-occupied |
| Less than $5,000 | 3 (1.6%) | 0 (0.0%) |
| $5,000 to $9,999 | 2 (1.1%) | 2 (4.9%) |
| $10,000 to $14,999 | 8 (4.2%) | 0 (0.0%) |
| $15,000 to $19,999 | 12 (6.3%) | 9 (22.0%) |
| $20,000 to $24,999 | 1 (0.5%) | 0 (0.0%) |
| $25,000 to $34,999 | 19 (10.0%) | 13 (31.7%) |
| $35,000 to $49,999 | 21 (11.0%) | 5 (12.2%) |
| $50,000 to $74,999 | 54 (28.3%) | 7 (17.1%) |
| $75,000 to $99,999 | 26 (13.6%) | 5 (12.2%) |
| $100,000 to $149,999 | 32 (16.8%) | 0 (0.0%) |
| $150,000 or more | 13 (6.8%) | 0 (0.0%) |
| Total | 191 (100.0%) | 41 (100.0%) |
Monthly Housing Cost Tiers in Bluford
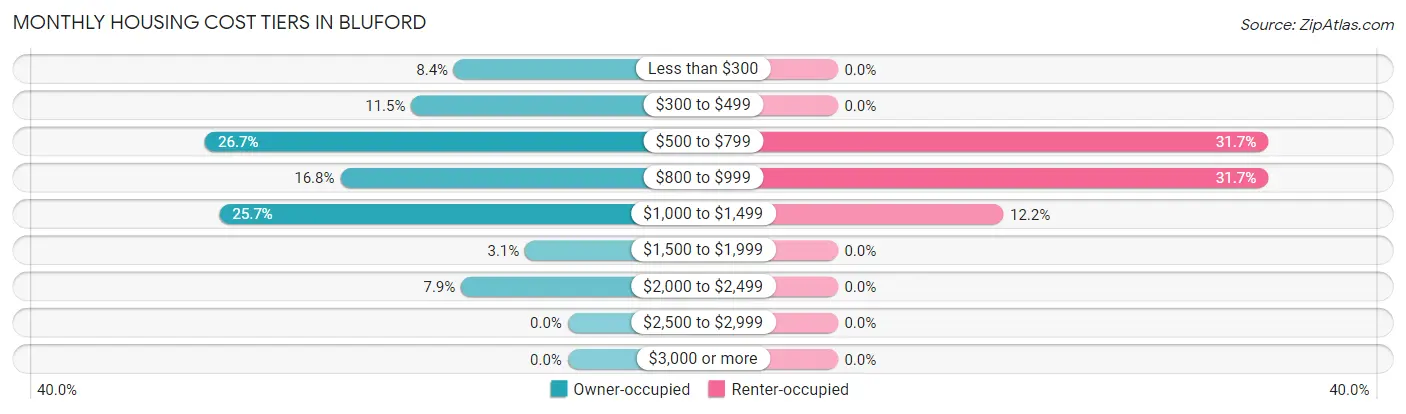
| Monthly Cost | Owner-occupied | Renter-occupied |
| Less than $300 | 16 (8.4%) | 0 (0.0%) |
| $300 to $499 | 22 (11.5%) | 0 (0.0%) |
| $500 to $799 | 51 (26.7%) | 13 (31.7%) |
| $800 to $999 | 32 (16.8%) | 13 (31.7%) |
| $1,000 to $1,499 | 49 (25.7%) | 5 (12.2%) |
| $1,500 to $1,999 | 6 (3.1%) | 0 (0.0%) |
| $2,000 to $2,499 | 15 (7.9%) | 0 (0.0%) |
| $2,500 to $2,999 | 0 (0.0%) | 0 (0.0%) |
| $3,000 or more | 0 (0.0%) | 0 (0.0%) |
| Total | 191 (100.0%) | 41 (100.0%) |
Physical Housing Characteristics in Bluford
Housing Structures in Bluford
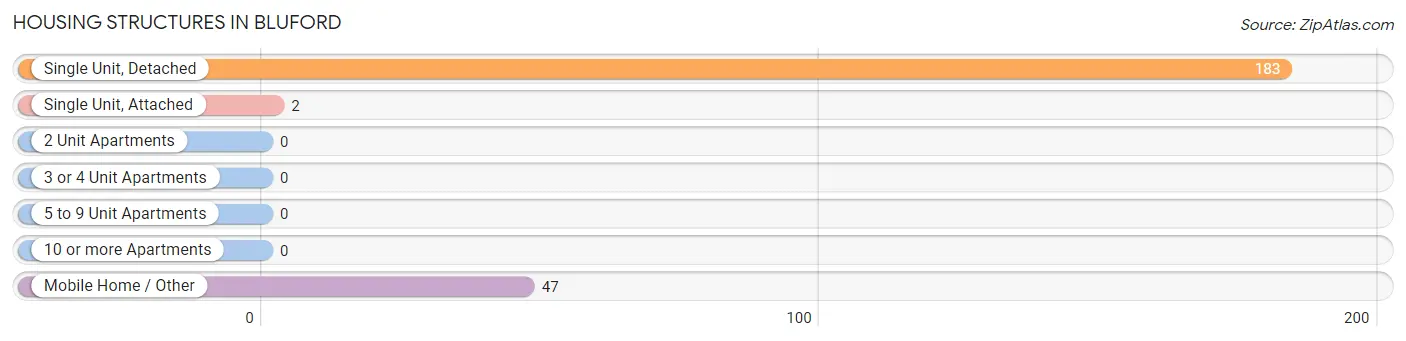
| Structure Type | # Housing Units | % Housing Units |
| Single Unit, Detached | 183 | 78.9% |
| Single Unit, Attached | 2 | 0.9% |
| 2 Unit Apartments | 0 | 0.0% |
| 3 or 4 Unit Apartments | 0 | 0.0% |
| 5 to 9 Unit Apartments | 0 | 0.0% |
| 10 or more Apartments | 0 | 0.0% |
| Mobile Home / Other | 47 | 20.3% |
| Total | 232 | 100.0% |
Housing Structures by Occupancy in Bluford
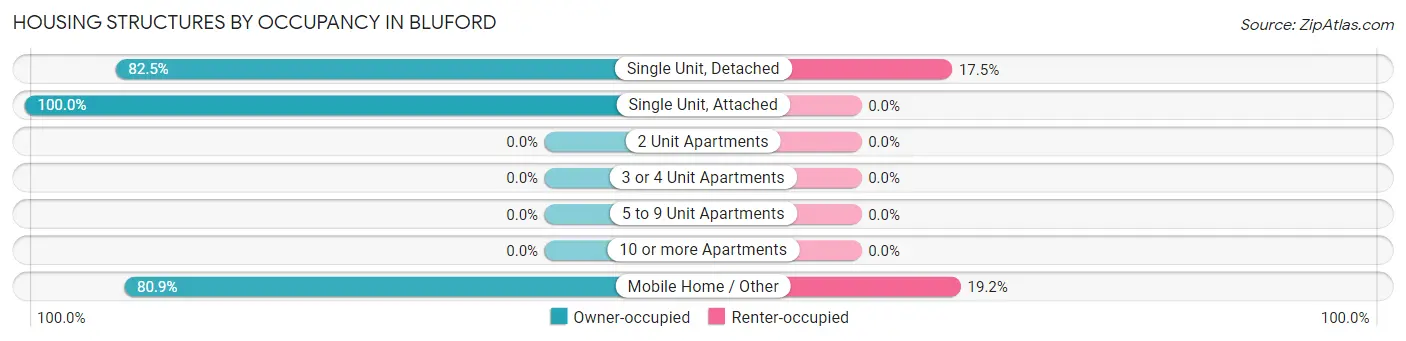
| Structure Type | Owner-occupied | Renter-occupied |
| Single Unit, Detached | 151 (82.5%) | 32 (17.5%) |
| Single Unit, Attached | 2 (100.0%) | 0 (0.0%) |
| 2 Unit Apartments | 0 (0.0%) | 0 (0.0%) |
| 3 or 4 Unit Apartments | 0 (0.0%) | 0 (0.0%) |
| 5 to 9 Unit Apartments | 0 (0.0%) | 0 (0.0%) |
| 10 or more Apartments | 0 (0.0%) | 0 (0.0%) |
| Mobile Home / Other | 38 (80.8%) | 9 (19.2%) |
| Total | 191 (82.3%) | 41 (17.7%) |
Housing Structures by Number of Rooms in Bluford
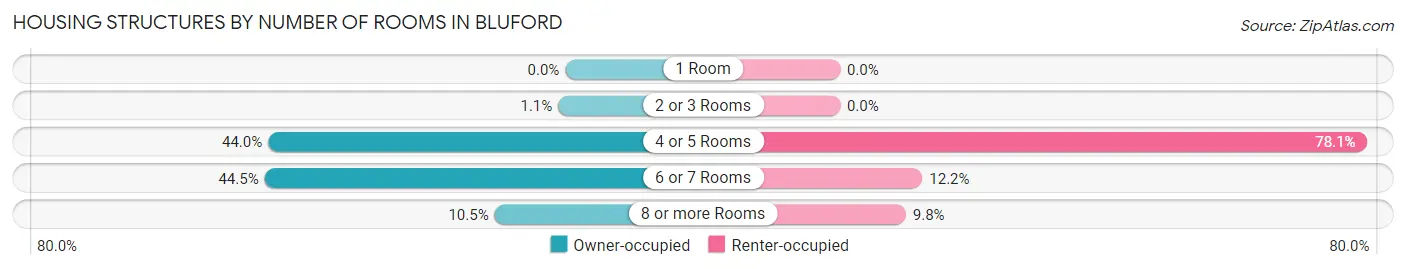
| Number of Rooms | Owner-occupied | Renter-occupied |
| 1 Room | 0 (0.0%) | 0 (0.0%) |
| 2 or 3 Rooms | 2 (1.1%) | 0 (0.0%) |
| 4 or 5 Rooms | 84 (44.0%) | 32 (78.0%) |
| 6 or 7 Rooms | 85 (44.5%) | 5 (12.2%) |
| 8 or more Rooms | 20 (10.5%) | 4 (9.8%) |
| Total | 191 (100.0%) | 41 (100.0%) |
Housing Structure by Heating Type in Bluford
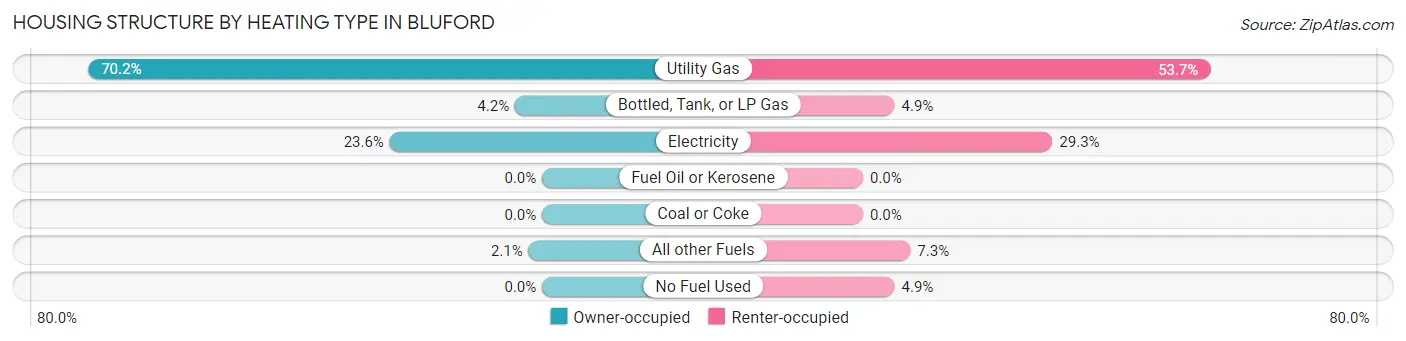
| Heating Type | Owner-occupied | Renter-occupied |
| Utility Gas | 134 (70.2%) | 22 (53.7%) |
| Bottled, Tank, or LP Gas | 8 (4.2%) | 2 (4.9%) |
| Electricity | 45 (23.6%) | 12 (29.3%) |
| Fuel Oil or Kerosene | 0 (0.0%) | 0 (0.0%) |
| Coal or Coke | 0 (0.0%) | 0 (0.0%) |
| All other Fuels | 4 (2.1%) | 3 (7.3%) |
| No Fuel Used | 0 (0.0%) | 2 (4.9%) |
| Total | 191 (100.0%) | 41 (100.0%) |
Household Vehicle Usage in Bluford
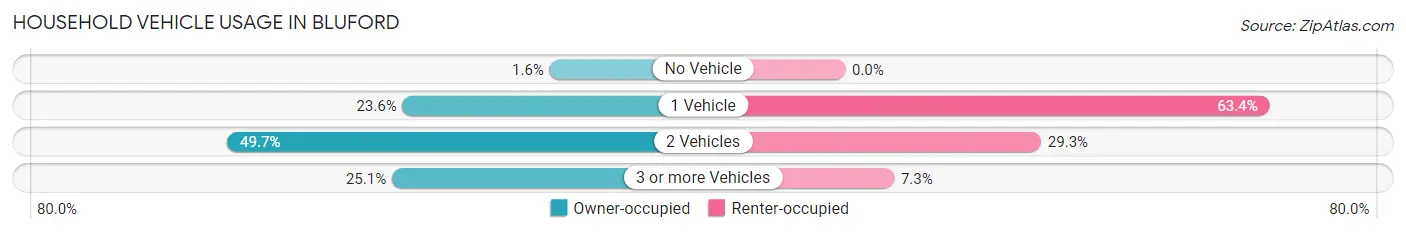
| Vehicles per Household | Owner-occupied | Renter-occupied |
| No Vehicle | 3 (1.6%) | 0 (0.0%) |
| 1 Vehicle | 45 (23.6%) | 26 (63.4%) |
| 2 Vehicles | 95 (49.7%) | 12 (29.3%) |
| 3 or more Vehicles | 48 (25.1%) | 3 (7.3%) |
| Total | 191 (100.0%) | 41 (100.0%) |
Real Estate & Mortgages in Bluford
Real Estate and Mortgage Overview in Bluford
| Characteristic | Without Mortgage | With Mortgage |
| Housing Units | 99 | 92 |
| Median Property Value | $83,500 | $95,300 |
| Median Household Income | $71,375 | $2 |
| Monthly Housing Costs | $538 | $0 |
| Real Estate Taxes | $1,063 | $3 |
Property Value by Mortgage Status in Bluford
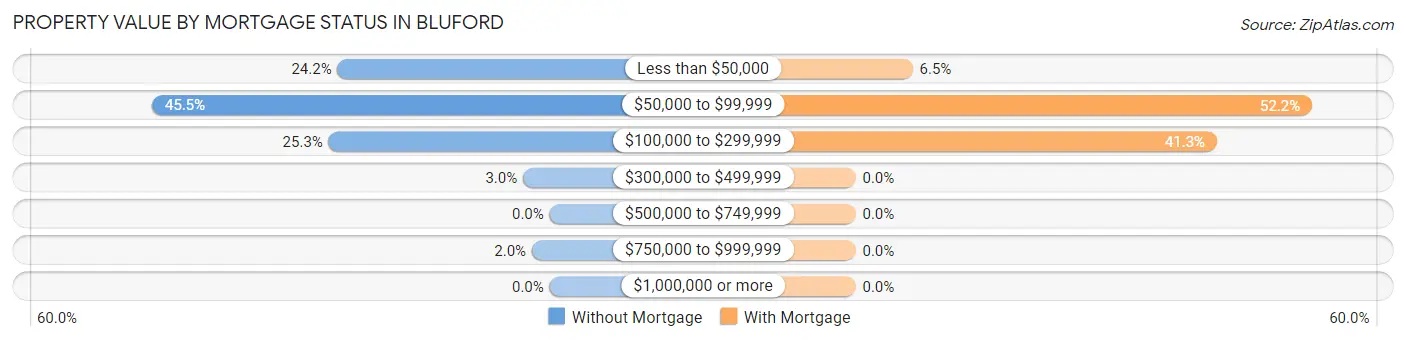
| Property Value | Without Mortgage | With Mortgage |
| Less than $50,000 | 24 (24.2%) | 6 (6.5%) |
| $50,000 to $99,999 | 45 (45.5%) | 48 (52.2%) |
| $100,000 to $299,999 | 25 (25.3%) | 38 (41.3%) |
| $300,000 to $499,999 | 3 (3.0%) | 0 (0.0%) |
| $500,000 to $749,999 | 0 (0.0%) | 0 (0.0%) |
| $750,000 to $999,999 | 2 (2.0%) | 0 (0.0%) |
| $1,000,000 or more | 0 (0.0%) | 0 (0.0%) |
| Total | 99 (100.0%) | 92 (100.0%) |
Household Income by Mortgage Status in Bluford
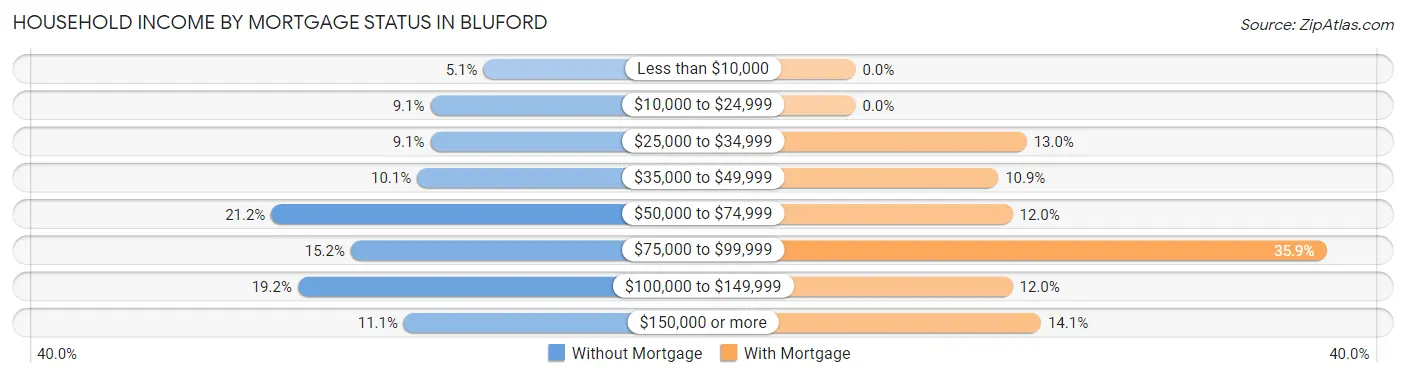
| Household Income | Without Mortgage | With Mortgage |
| Less than $10,000 | 5 (5.1%) | 0 (0.0%) |
| $10,000 to $24,999 | 9 (9.1%) | 0 (0.0%) |
| $25,000 to $34,999 | 9 (9.1%) | 12 (13.0%) |
| $35,000 to $49,999 | 10 (10.1%) | 10 (10.9%) |
| $50,000 to $74,999 | 21 (21.2%) | 11 (12.0%) |
| $75,000 to $99,999 | 15 (15.1%) | 33 (35.9%) |
| $100,000 to $149,999 | 19 (19.2%) | 11 (12.0%) |
| $150,000 or more | 11 (11.1%) | 13 (14.1%) |
| Total | 99 (100.0%) | 92 (100.0%) |
Property Value to Household Income Ratio in Bluford
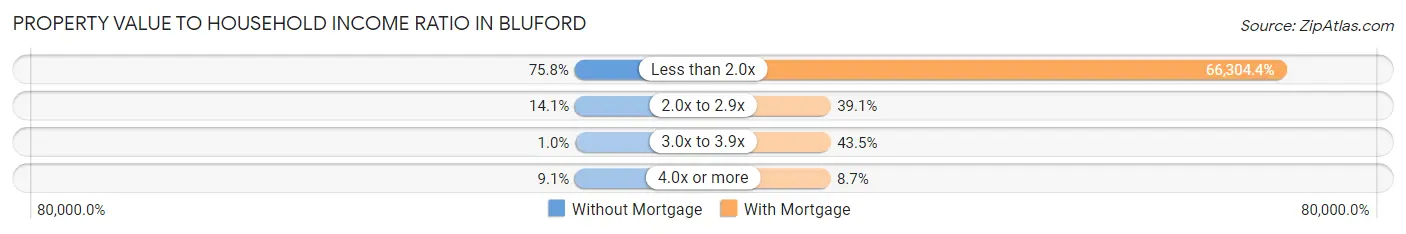
| Value-to-Income Ratio | Without Mortgage | With Mortgage |
| Less than 2.0x | 75 (75.8%) | 61,000 (66,304.3%) |
| 2.0x to 2.9x | 14 (14.1%) | 36 (39.1%) |
| 3.0x to 3.9x | 1 (1.0%) | 40 (43.5%) |
| 4.0x or more | 9 (9.1%) | 8 (8.7%) |
| Total | 99 (100.0%) | 92 (100.0%) |
Real Estate Taxes by Mortgage Status in Bluford
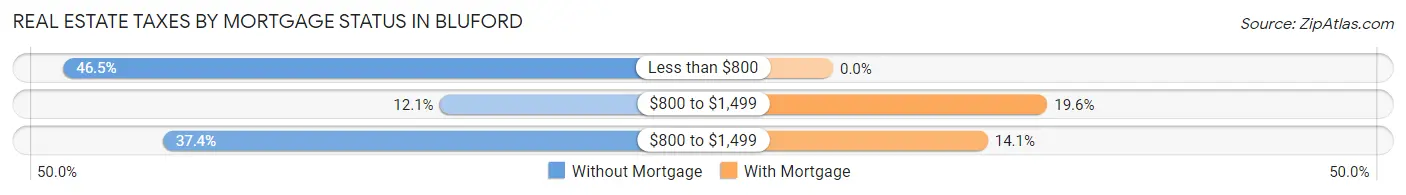
| Property Taxes | Without Mortgage | With Mortgage |
| Less than $800 | 46 (46.5%) | 0 (0.0%) |
| $800 to $1,499 | 12 (12.1%) | 18 (19.6%) |
| $800 to $1,499 | 37 (37.4%) | 13 (14.1%) |
| Total | 99 (100.0%) | 92 (100.0%) |
Health & Disability in Bluford
Health Insurance Coverage by Age in Bluford
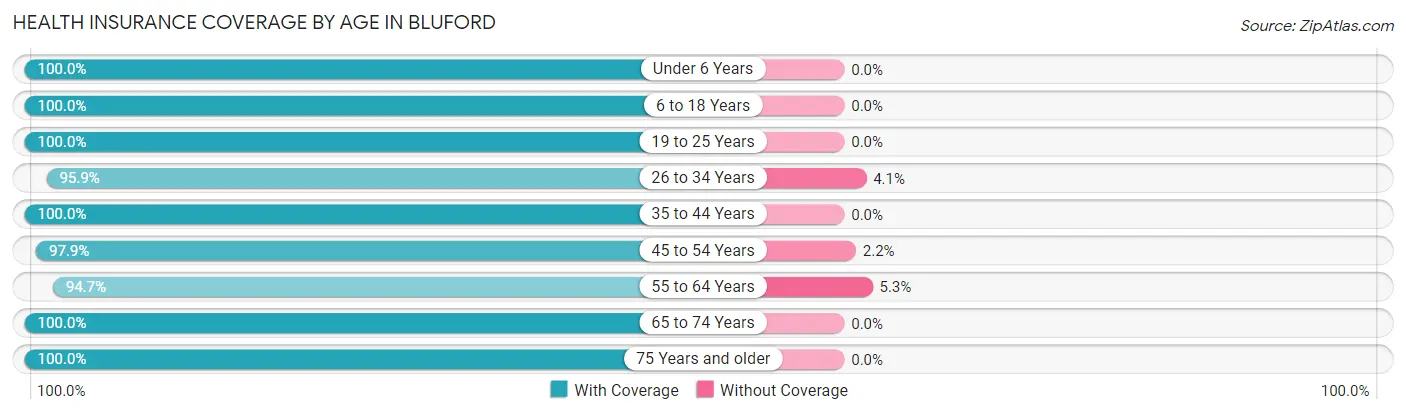
| Age Bracket | With Coverage | Without Coverage |
| Under 6 Years | 33 (100.0%) | 0 (0.0%) |
| 6 to 18 Years | 91 (100.0%) | 0 (0.0%) |
| 19 to 25 Years | 43 (100.0%) | 0 (0.0%) |
| 26 to 34 Years | 94 (95.9%) | 4 (4.1%) |
| 35 to 44 Years | 42 (100.0%) | 0 (0.0%) |
| 45 to 54 Years | 91 (97.9%) | 2 (2.1%) |
| 55 to 64 Years | 36 (94.7%) | 2 (5.3%) |
| 65 to 74 Years | 73 (100.0%) | 0 (0.0%) |
| 75 Years and older | 44 (100.0%) | 0 (0.0%) |
| Total | 547 (98.6%) | 8 (1.4%) |
Health Insurance Coverage by Citizenship Status in Bluford

| Citizenship Status | With Coverage | Without Coverage |
| Native Born | 33 (100.0%) | 0 (0.0%) |
| Foreign Born, Citizen | 91 (100.0%) | 0 (0.0%) |
| Foreign Born, not a Citizen | 43 (100.0%) | 0 (0.0%) |
Health Insurance Coverage by Household Income in Bluford
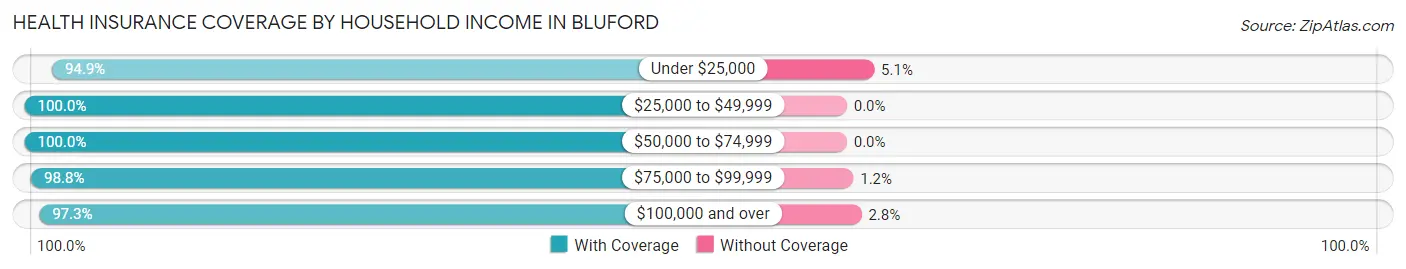
| Household Income | With Coverage | Without Coverage |
| Under $25,000 | 74 (94.9%) | 4 (5.1%) |
| $25,000 to $49,999 | 125 (100.0%) | 0 (0.0%) |
| $50,000 to $74,999 | 161 (100.0%) | 0 (0.0%) |
| $75,000 to $99,999 | 81 (98.8%) | 1 (1.2%) |
| $100,000 and over | 106 (97.3%) | 3 (2.8%) |
Public vs Private Health Insurance Coverage by Age in Bluford
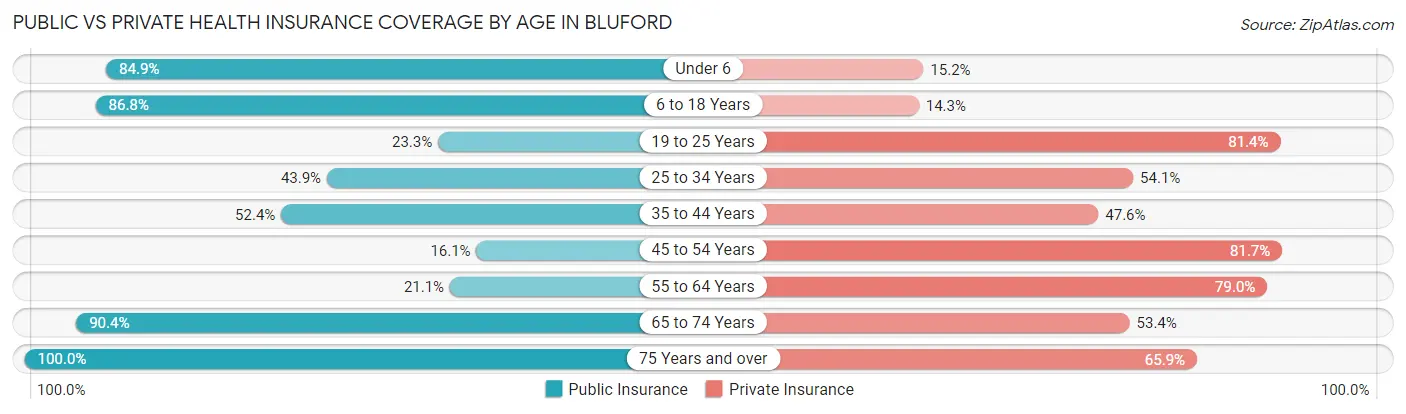
| Age Bracket | Public Insurance | Private Insurance |
| Under 6 | 28 (84.9%) | 5 (15.1%) |
| 6 to 18 Years | 79 (86.8%) | 13 (14.3%) |
| 19 to 25 Years | 10 (23.3%) | 35 (81.4%) |
| 25 to 34 Years | 43 (43.9%) | 53 (54.1%) |
| 35 to 44 Years | 22 (52.4%) | 20 (47.6%) |
| 45 to 54 Years | 15 (16.1%) | 76 (81.7%) |
| 55 to 64 Years | 8 (21.0%) | 30 (78.9%) |
| 65 to 74 Years | 66 (90.4%) | 39 (53.4%) |
| 75 Years and over | 44 (100.0%) | 29 (65.9%) |
| Total | 315 (56.8%) | 300 (54.0%) |
Disability Status by Sex by Age in Bluford
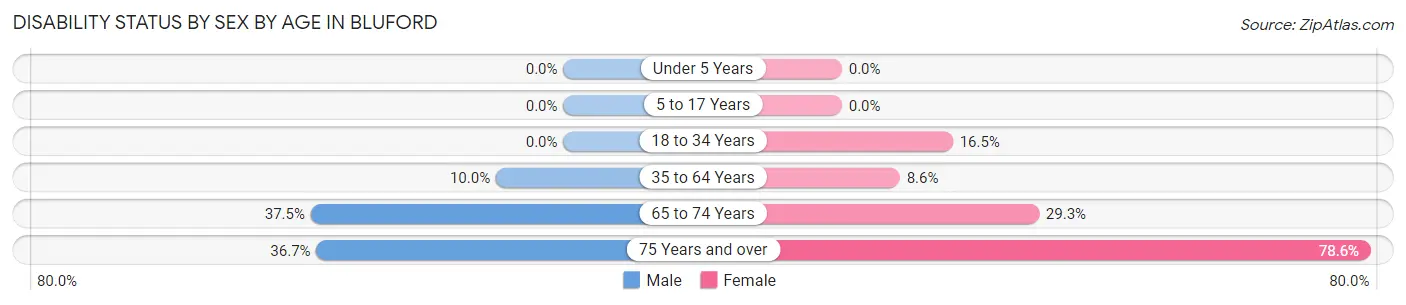
| Age Bracket | Male | Female |
| Under 5 Years | 0 (0.0%) | 0 (0.0%) |
| 5 to 17 Years | 0 (0.0%) | 0 (0.0%) |
| 18 to 34 Years | 0 (0.0%) | 14 (16.5%) |
| 35 to 64 Years | 8 (10.0%) | 8 (8.6%) |
| 65 to 74 Years | 12 (37.5%) | 12 (29.3%) |
| 75 Years and over | 11 (36.7%) | 11 (78.6%) |
Disability Class by Sex by Age in Bluford
Disability Class: Hearing Difficulty
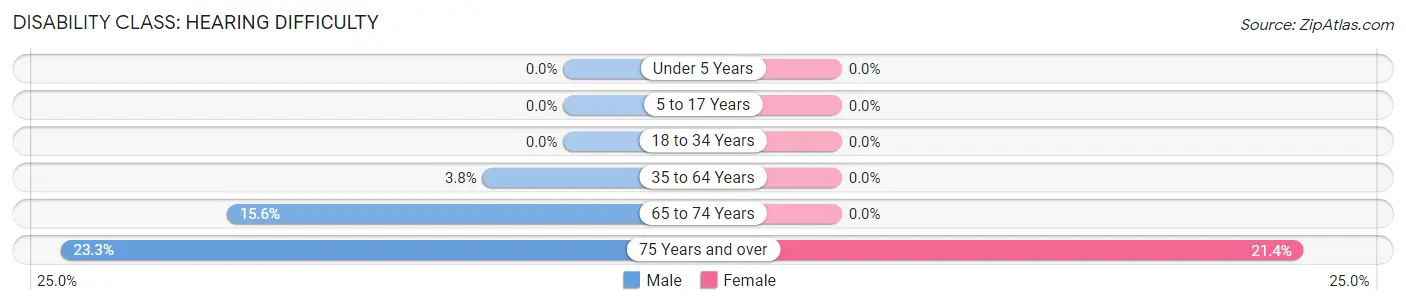
| Age Bracket | Male | Female |
| Under 5 Years | 0 (0.0%) | 0 (0.0%) |
| 5 to 17 Years | 0 (0.0%) | 0 (0.0%) |
| 18 to 34 Years | 0 (0.0%) | 0 (0.0%) |
| 35 to 64 Years | 3 (3.7%) | 0 (0.0%) |
| 65 to 74 Years | 5 (15.6%) | 0 (0.0%) |
| 75 Years and over | 7 (23.3%) | 3 (21.4%) |
Disability Class: Vision Difficulty
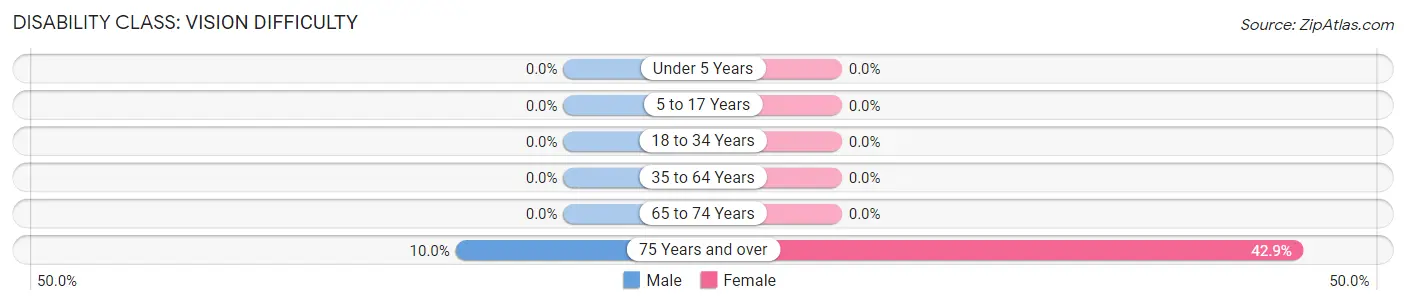
| Age Bracket | Male | Female |
| Under 5 Years | 0 (0.0%) | 0 (0.0%) |
| 5 to 17 Years | 0 (0.0%) | 0 (0.0%) |
| 18 to 34 Years | 0 (0.0%) | 0 (0.0%) |
| 35 to 64 Years | 0 (0.0%) | 0 (0.0%) |
| 65 to 74 Years | 0 (0.0%) | 0 (0.0%) |
| 75 Years and over | 3 (10.0%) | 6 (42.9%) |
Disability Class: Cognitive Difficulty
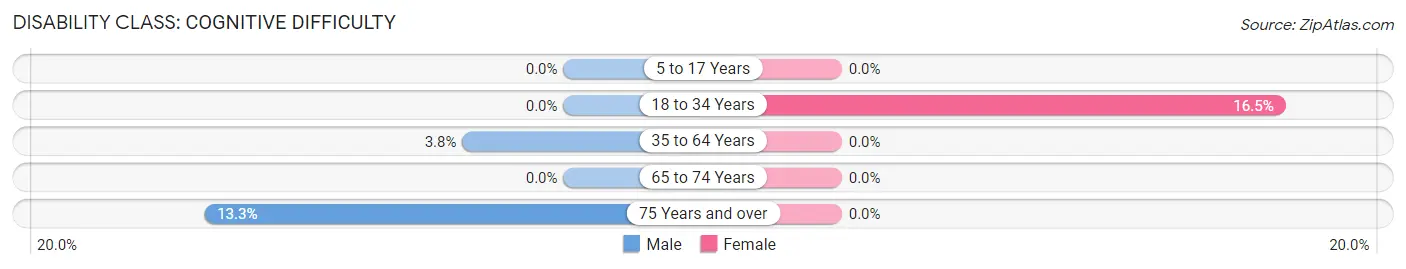
| Age Bracket | Male | Female |
| 5 to 17 Years | 0 (0.0%) | 0 (0.0%) |
| 18 to 34 Years | 0 (0.0%) | 14 (16.5%) |
| 35 to 64 Years | 3 (3.7%) | 0 (0.0%) |
| 65 to 74 Years | 0 (0.0%) | 0 (0.0%) |
| 75 Years and over | 4 (13.3%) | 0 (0.0%) |
Disability Class: Ambulatory Difficulty
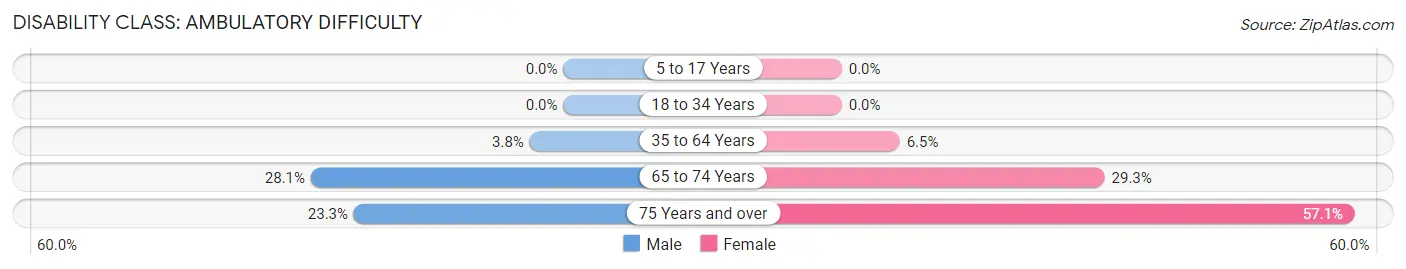
| Age Bracket | Male | Female |
| 5 to 17 Years | 0 (0.0%) | 0 (0.0%) |
| 18 to 34 Years | 0 (0.0%) | 0 (0.0%) |
| 35 to 64 Years | 3 (3.7%) | 6 (6.5%) |
| 65 to 74 Years | 9 (28.1%) | 12 (29.3%) |
| 75 Years and over | 7 (23.3%) | 8 (57.1%) |
Disability Class: Self-Care Difficulty
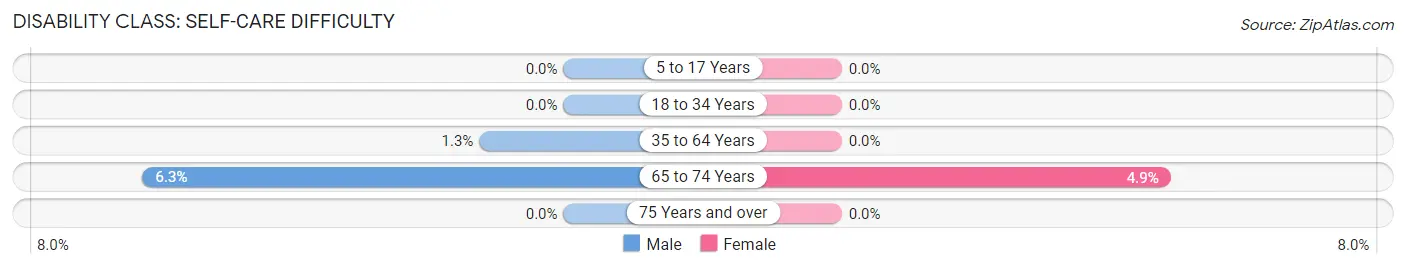
| Age Bracket | Male | Female |
| 5 to 17 Years | 0 (0.0%) | 0 (0.0%) |
| 18 to 34 Years | 0 (0.0%) | 0 (0.0%) |
| 35 to 64 Years | 1 (1.3%) | 0 (0.0%) |
| 65 to 74 Years | 2 (6.2%) | 2 (4.9%) |
| 75 Years and over | 0 (0.0%) | 0 (0.0%) |
Technology Access in Bluford
Computing Device Access in Bluford
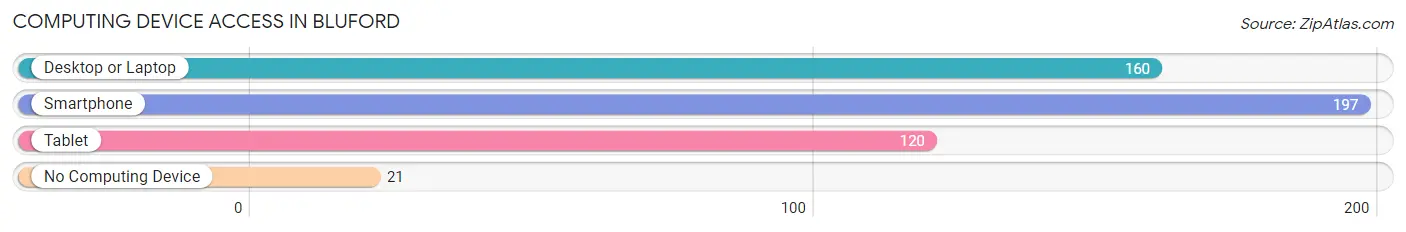
| Device Type | # Households | % Households |
| Desktop or Laptop | 160 | 69.0% |
| Smartphone | 197 | 84.9% |
| Tablet | 120 | 51.7% |
| No Computing Device | 21 | 9.0% |
| Total | 232 | 100.0% |
Internet Access in Bluford
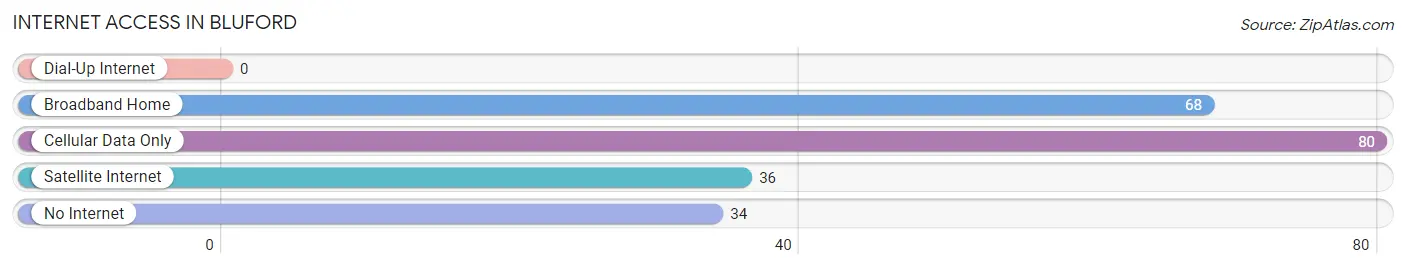
| Internet Type | # Households | % Households |
| Dial-Up Internet | 0 | 0.0% |
| Broadband Home | 68 | 29.3% |
| Cellular Data Only | 80 | 34.5% |
| Satellite Internet | 36 | 15.5% |
| No Internet | 34 | 14.7% |
| Total | 232 | 100.0% |
Bluford Summary
History
Bluford, Illinois is a small village located in St. Clair County, Illinois. It is situated on the banks of the Kaskaskia River, about 25 miles east of St. Louis. The village was founded in 1836 by William Bluford, a former slave who had escaped from Kentucky. Bluford purchased the land from the federal government and established a small settlement. The village was named after him and has remained a small, rural community ever since.
The village of Bluford was originally a farming community, with many of the residents growing corn, wheat, and other crops. The village also had a few small businesses, such as a general store, a blacksmith, and a post office. In the late 1800s, the village began to grow and expand, with the addition of a school, a church, and a few other businesses.
In the early 1900s, the village began to experience a period of growth and prosperity. The population increased from around 200 in 1900 to over 500 by 1920. During this time, the village was home to several businesses, including a bank, a hotel, a movie theater, and a variety of other stores.
The Great Depression of the 1930s had a devastating effect on the village, as many of the businesses closed and the population decreased. However, the village was able to recover and by the 1950s, the population had grown to over 800.
Geography
Bluford is located in St. Clair County, Illinois, about 25 miles east of St. Louis. The village is situated on the banks of the Kaskaskia River, which flows through the area. The village is surrounded by rolling hills and farmland, with the nearest major city being Belleville, which is about 10 miles away.
The village has a total area of 0.7 square miles, all of which is land. The climate in Bluford is typical of the Midwest, with hot summers and cold winters. The average temperature in the summer is around 80 degrees Fahrenheit, while the average temperature in the winter is around 30 degrees Fahrenheit.
Economy
The economy of Bluford is largely based on agriculture. The village is home to several farms, which grow a variety of crops, including corn, wheat, soybeans, and hay. The village also has a few small businesses, such as a general store, a hardware store, and a few restaurants.
The village is also home to a few manufacturing companies, which produce a variety of products, such as furniture, clothing, and automotive parts. The village also has a few small service businesses, such as auto repair shops and hair salons.
Demographics
As of the 2010 census, the population of Bluford was 845. The racial makeup of the village was 97.3% White, 0.6% African American, 0.2% Native American, 0.2% Asian, 0.2% from other races, and 1.7% from two or more races. Hispanic or Latino of any race were 1.2% of the population.
The median income for a household in Bluford was $41,250, and the median income for a family was $45,000. The per capita income for the village was $18,945. About 8.3% of families and 10.2% of the population were below the poverty line, including 14.3% of those under age 18 and 5.3% of those age 65 or over.
Common Questions
What is Per Capita Income in Bluford?
Per Capita income in Bluford is $28,024.
What is the Median Family Income in Bluford?
Median Family Income in Bluford is $62,083.
What is the Median Household income in Bluford?
Median Household Income in Bluford is $59,688.
What is Income or Wage Gap in Bluford?
Income or Wage Gap in Bluford is 13.5%.
Women in Bluford earn 86.5 cents for every dollar earned by a man.
What is Family Income Deficit in Bluford?
Family Income Deficit in Bluford is $10,655.
Families that are below poverty line in Bluford earn $10,655 less on average than the poverty threshold level.
What is Inequality or Gini Index in Bluford?
Inequality or Gini Index in Bluford is 0.39.
What is the Total Population of Bluford?
Total Population of Bluford is 555.
What is the Total Male Population of Bluford?
Total Male Population of Bluford is 258.
What is the Total Female Population of Bluford?
Total Female Population of Bluford is 297.
What is the Ratio of Males per 100 Females in Bluford?
There are 86.87 Males per 100 Females in Bluford.
What is the Ratio of Females per 100 Males in Bluford?
There are 115.12 Females per 100 Males in Bluford.
What is the Median Population Age in Bluford?
Median Population Age in Bluford is 38.3 Years.
What is the Average Family Size in Bluford
Average Family Size in Bluford is 2.7 People.
What is the Average Household Size in Bluford
Average Household Size in Bluford is 2.4 People.
How Large is the Labor Force in Bluford?
There are 308 People in the Labor Forcein in Bluford.
What is the Percentage of People in the Labor Force in Bluford?
67.0% of People are in the Labor Force in Bluford.
What is the Unemployment Rate in Bluford?
Unemployment Rate in Bluford is 6.8%.