Harrisburg, IL Map & Demographics
Harrisburg Map
Harrisburg Overview
$26,175
PER CAPITA INCOME
$60,240
AVG FAMILY INCOME
$38,937
AVG HOUSEHOLD INCOME
31.0%
WAGE / INCOME GAP [ % ]
69.0¢/ $1
WAGE / INCOME GAP [ $ ]
$9,611
FAMILY INCOME DEFICIT
0.47
INEQUALITY / GINI INDEX
8,380
TOTAL POPULATION
3,963
MALE POPULATION
4,417
FEMALE POPULATION
89.72
MALES / 100 FEMALES
111.46
FEMALES / 100 MALES
36.6
MEDIAN AGE
2.9
AVG FAMILY SIZE
2.2
AVG HOUSEHOLD SIZE
3,785
LABOR FORCE [ PEOPLE ]
56.9%
PERCENT IN LABOR FORCE
7.7%
UNEMPLOYMENT RATE
Harrisburg Zip Codes
Harrisburg Area Codes
Income in Harrisburg
Income Overview in Harrisburg
Per Capita Income in Harrisburg is $26,175, while median incomes of families and households are $60,240 and $38,937 respectively.
| Characteristic | Number | Measure |
| Per Capita Income | 8,380 | $26,175 |
| Median Family Income | 2,046 | $60,240 |
| Mean Family Income | 2,046 | $71,296 |
| Median Household Income | 3,579 | $38,937 |
| Mean Household Income | 3,579 | $58,374 |
| Income Deficit | 2,046 | $9,611 |
| Wage / Income Gap (%) | 8,380 | 30.98% |
| Wage / Income Gap ($) | 8,380 | 69.02¢ per $1 |
| Gini / Inequality Index | 8,380 | 0.47 |
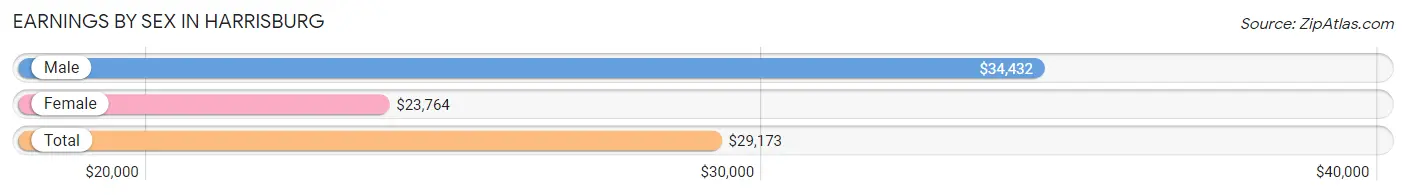
Earnings by Sex in Harrisburg
Average Earnings in Harrisburg are $29,173, $34,432 for men and $23,764 for women, a difference of 31.0%.
| Sex | Number | Average Earnings |
| Male | 1,805 (47.4%) | $34,432 |
| Female | 2,004 (52.6%) | $23,764 |
| Total | 3,809 (100.0%) | $29,173 |
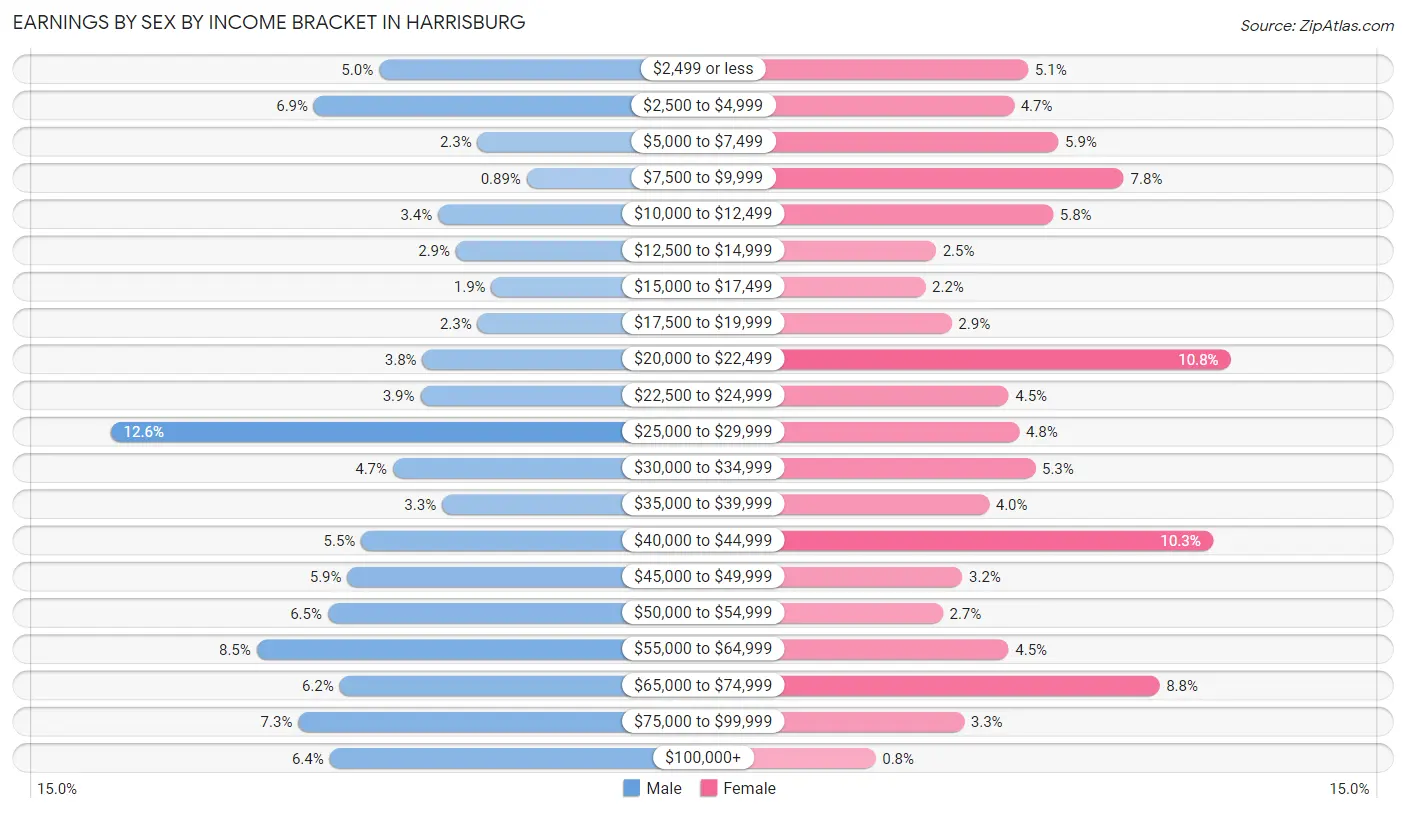
Earnings by Sex by Income Bracket in Harrisburg
The most common earnings brackets in Harrisburg are $25,000 to $29,999 for men (227 | 12.6%) and $20,000 to $22,499 for women (216 | 10.8%).
| Income | Male | Female |
| $2,499 or less | 91 (5.0%) | 102 (5.1%) |
| $2,500 to $4,999 | 124 (6.9%) | 94 (4.7%) |
| $5,000 to $7,499 | 41 (2.3%) | 119 (5.9%) |
| $7,500 to $9,999 | 16 (0.9%) | 156 (7.8%) |
| $10,000 to $12,499 | 61 (3.4%) | 116 (5.8%) |
| $12,500 to $14,999 | 52 (2.9%) | 50 (2.5%) |
| $15,000 to $17,499 | 34 (1.9%) | 44 (2.2%) |
| $17,500 to $19,999 | 41 (2.3%) | 59 (2.9%) |
| $20,000 to $22,499 | 69 (3.8%) | 216 (10.8%) |
| $22,500 to $24,999 | 70 (3.9%) | 91 (4.5%) |
| $25,000 to $29,999 | 227 (12.6%) | 97 (4.8%) |
| $30,000 to $34,999 | 84 (4.6%) | 106 (5.3%) |
| $35,000 to $39,999 | 59 (3.3%) | 80 (4.0%) |
| $40,000 to $44,999 | 100 (5.5%) | 206 (10.3%) |
| $45,000 to $49,999 | 107 (5.9%) | 65 (3.2%) |
| $50,000 to $54,999 | 117 (6.5%) | 54 (2.7%) |
| $55,000 to $64,999 | 153 (8.5%) | 91 (4.5%) |
| $65,000 to $74,999 | 111 (6.1%) | 176 (8.8%) |
| $75,000 to $99,999 | 132 (7.3%) | 66 (3.3%) |
| $100,000+ | 116 (6.4%) | 16 (0.8%) |
| Total | 1,805 (100.0%) | 2,004 (100.0%) |
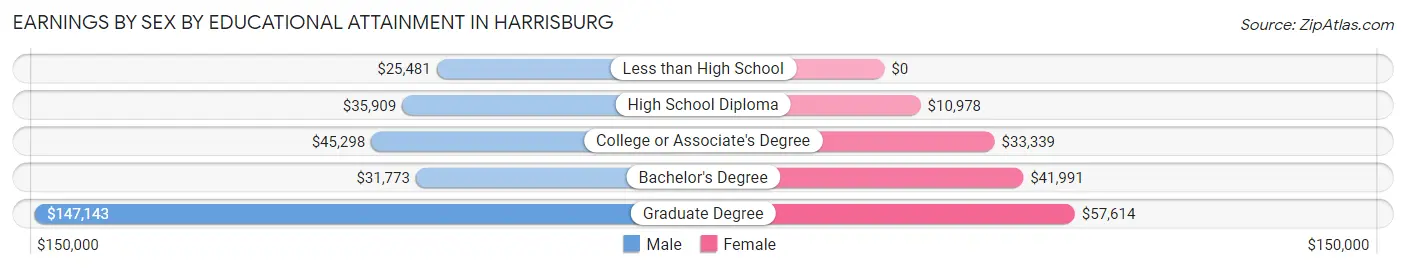
Earnings by Sex by Educational Attainment in Harrisburg
Average earnings in Harrisburg are $36,484 for men and $28,018 for women, a difference of 23.2%. Men with an educational attainment of graduate degree enjoy the highest average annual earnings of $147,143, while those with less than high school education earn the least with $25,481. Women with an educational attainment of graduate degree earn the most with the average annual earnings of $57,614, while those with high school diploma education have the smallest earnings of $10,978.
| Educational Attainment | Male Income | Female Income |
| Less than High School | $25,481 | $0 |
| High School Diploma | $35,909 | $10,978 |
| College or Associate's Degree | $45,298 | $33,339 |
| Bachelor's Degree | $31,773 | $41,991 |
| Graduate Degree | $147,143 | $57,614 |
| Total | $36,484 | $28,018 |
Family Income in Harrisburg
Family Income Brackets in Harrisburg
According to the Harrisburg family income data, there are 413 families falling into the $35,000 to $49,999 income range, which is the most common income bracket and makes up 20.2% of all families. Conversely, the $200,000+ income bracket is the least frequent group with only 45 families (2.2%) belonging to this category.
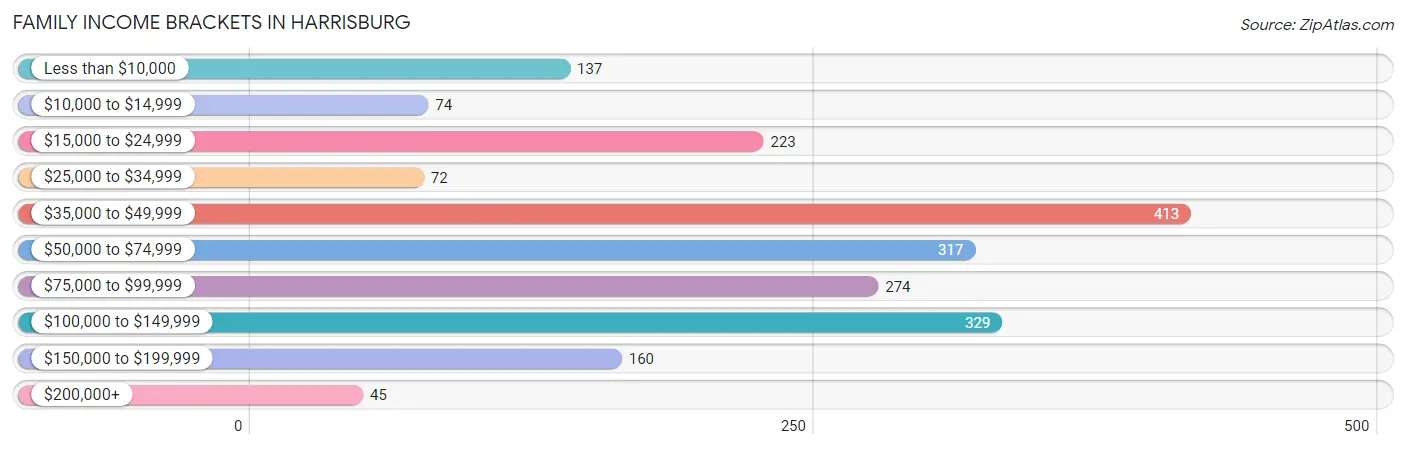
| Income Bracket | # Families | % Families |
| Less than $10,000 | 137 | 6.7% |
| $10,000 to $14,999 | 74 | 3.6% |
| $15,000 to $24,999 | 223 | 10.9% |
| $25,000 to $34,999 | 72 | 3.5% |
| $35,000 to $49,999 | 413 | 20.2% |
| $50,000 to $74,999 | 317 | 15.5% |
| $75,000 to $99,999 | 274 | 13.4% |
| $100,000 to $149,999 | 329 | 16.1% |
| $150,000 to $199,999 | 160 | 7.8% |
| $200,000+ | 45 | 2.2% |
Family Income by Famaliy Size in Harrisburg
4-person families (520 | 25.4%) account for the highest median family income in Harrisburg with $76,892 per family, while 2-person families (935 | 45.7%) have the highest median income of $30,806 per family member.
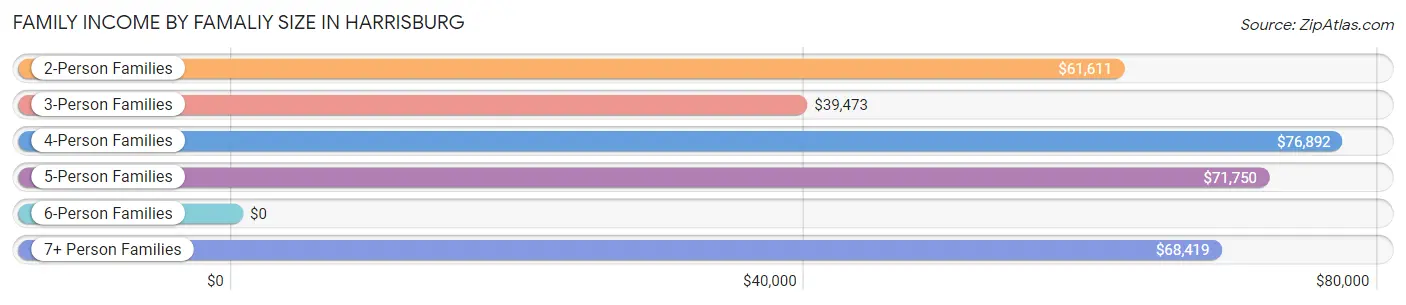
| Income Bracket | # Families | Median Income |
| 2-Person Families | 935 (45.7%) | $61,611 |
| 3-Person Families | 467 (22.8%) | $39,473 |
| 4-Person Families | 520 (25.4%) | $76,892 |
| 5-Person Families | 69 (3.4%) | $71,750 |
| 6-Person Families | 12 (0.6%) | $0 |
| 7+ Person Families | 43 (2.1%) | $68,419 |
| Total | 2,046 (100.0%) | $60,240 |
Family Income by Number of Earners in Harrisburg
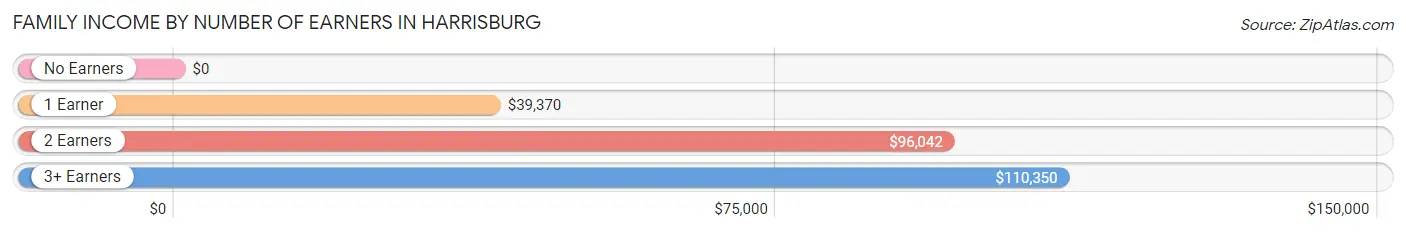
| Number of Earners | # Families | Median Income |
| No Earners | 229 (11.2%) | $0 |
| 1 Earner | 940 (45.9%) | $39,370 |
| 2 Earners | 764 (37.3%) | $96,042 |
| 3+ Earners | 113 (5.5%) | $110,350 |
| Total | 2,046 (100.0%) | $60,240 |
Household Income in Harrisburg
Household Income Brackets in Harrisburg
With 526 households falling in the category, the $35,000 to $49,999 income range is the most frequent in Harrisburg, accounting for 14.7% of all households. In contrast, only 54 households (1.5%) fall into the $200,000+ income bracket, making it the least populous group.
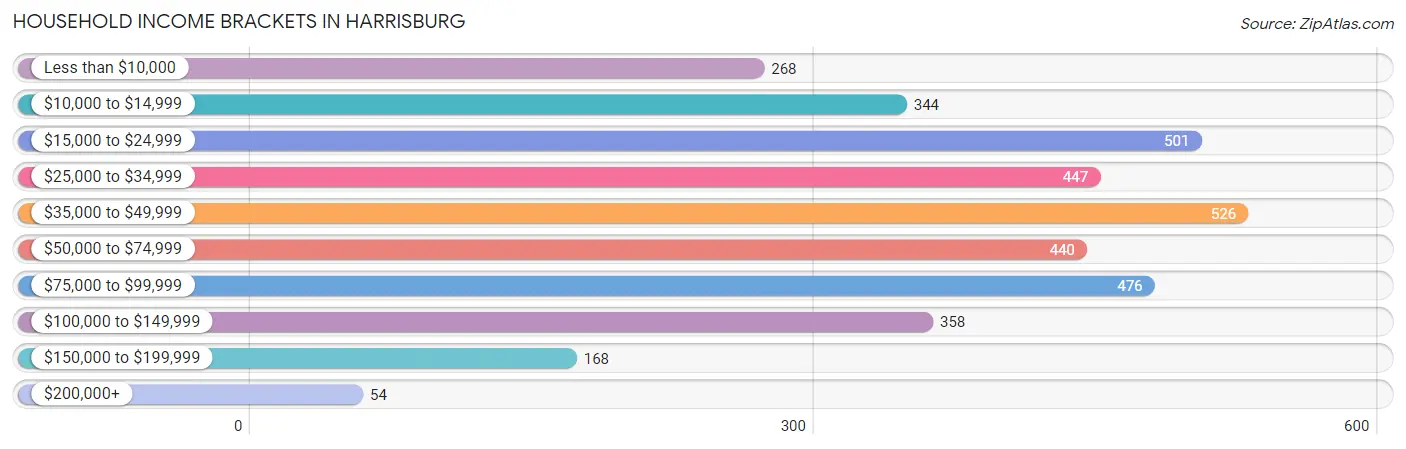
| Income Bracket | # Households | % Households |
| Less than $10,000 | 268 | 7.5% |
| $10,000 to $14,999 | 344 | 9.6% |
| $15,000 to $24,999 | 501 | 14.0% |
| $25,000 to $34,999 | 447 | 12.5% |
| $35,000 to $49,999 | 526 | 14.7% |
| $50,000 to $74,999 | 440 | 12.3% |
| $75,000 to $99,999 | 476 | 13.3% |
| $100,000 to $149,999 | 358 | 10.0% |
| $150,000 to $199,999 | 168 | 4.7% |
| $200,000+ | 54 | 1.5% |
Household Income by Householder Age in Harrisburg
The median household income in Harrisburg is $38,937, with the highest median household income of $54,960 found in the 25 to 44 years age bracket for the primary householder. A total of 1,105 households (30.9%) fall into this category. Meanwhile, the 15 to 24 years age bracket for the primary householder has the lowest median household income of $0, with 100 households (2.8%) in this group.
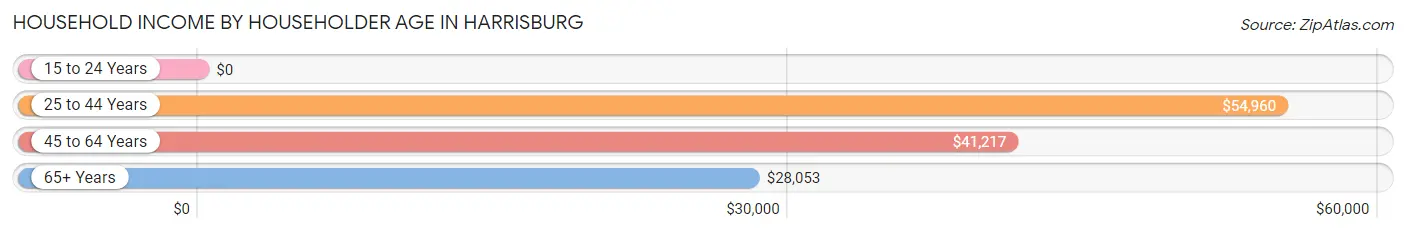
| Income Bracket | # Households | Median Income |
| 15 to 24 Years | 100 (2.8%) | $0 |
| 25 to 44 Years | 1,105 (30.9%) | $54,960 |
| 45 to 64 Years | 1,263 (35.3%) | $41,217 |
| 65+ Years | 1,111 (31.0%) | $28,053 |
| Total | 3,579 (100.0%) | $38,937 |
Poverty in Harrisburg
Income Below Poverty by Sex and Age in Harrisburg
With 22.4% poverty level for males and 25.7% for females among the residents of Harrisburg, 5 year old males and 15 year old females are the most vulnerable to poverty, with 53 males (61.6%) and 37 females (100.0%) in their respective age groups living below the poverty level.
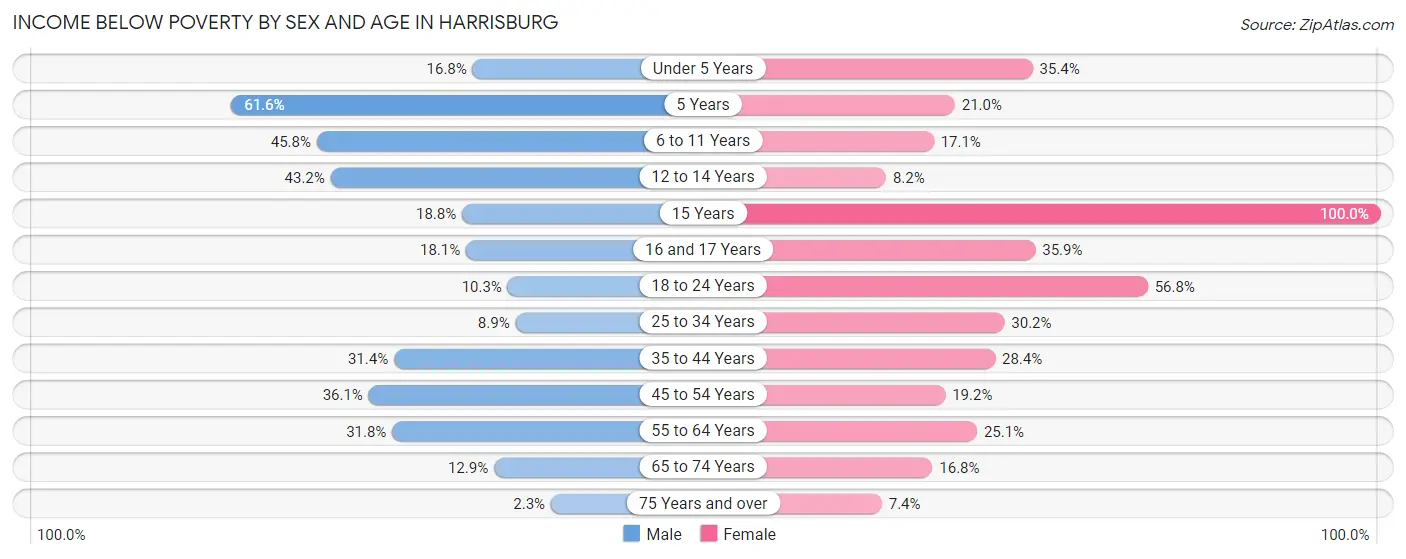
| Age Bracket | Male | Female |
| Under 5 Years | 63 (16.8%) | 96 (35.4%) |
| 5 Years | 53 (61.6%) | 13 (21.0%) |
| 6 to 11 Years | 65 (45.8%) | 43 (17.1%) |
| 12 to 14 Years | 73 (43.2%) | 10 (8.2%) |
| 15 Years | 19 (18.8%) | 37 (100.0%) |
| 16 and 17 Years | 13 (18.1%) | 51 (35.9%) |
| 18 to 24 Years | 28 (10.3%) | 134 (56.8%) |
| 25 to 34 Years | 54 (8.9%) | 246 (30.2%) |
| 35 to 44 Years | 116 (31.4%) | 91 (28.4%) |
| 45 to 54 Years | 142 (36.1%) | 106 (19.2%) |
| 55 to 64 Years | 163 (31.8%) | 141 (25.1%) |
| 65 to 74 Years | 47 (12.9%) | 80 (16.8%) |
| 75 Years and over | 7 (2.3%) | 25 (7.4%) |
| Total | 843 (22.4%) | 1,073 (25.7%) |
Income Above Poverty by Sex and Age in Harrisburg
According to the poverty statistics in Harrisburg, males aged 75 years and over and females aged 75 years and over are the age groups that are most secure financially, with 97.7% of males and 92.6% of females in these age groups living above the poverty line.
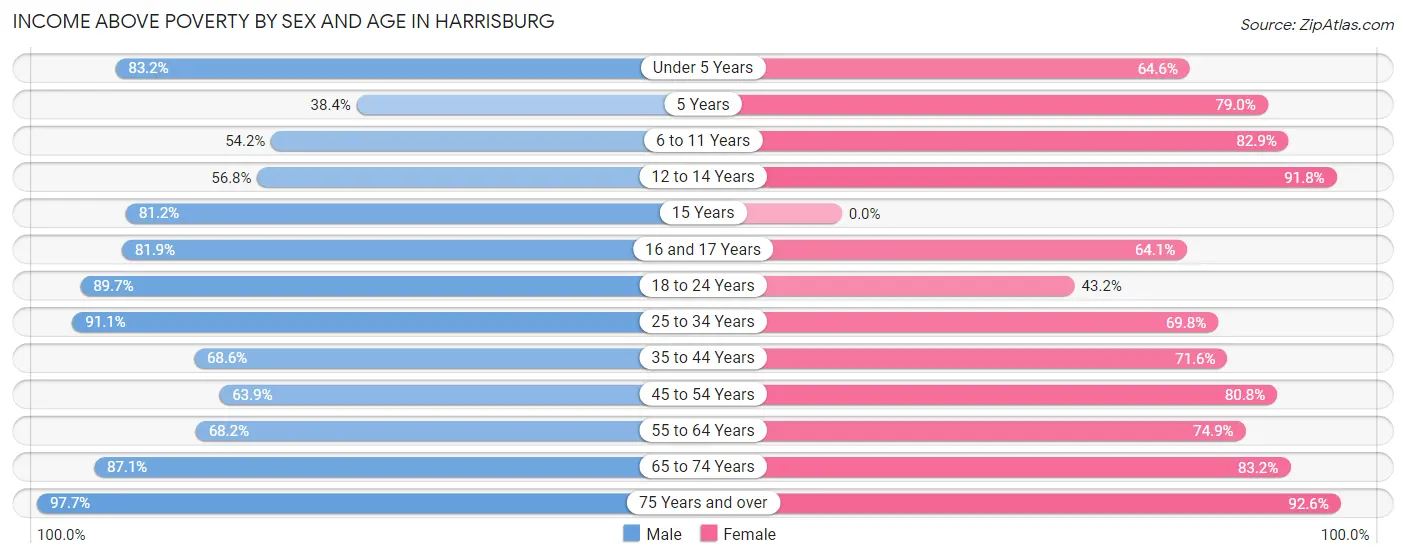
| Age Bracket | Male | Female |
| Under 5 Years | 311 (83.2%) | 175 (64.6%) |
| 5 Years | 33 (38.4%) | 49 (79.0%) |
| 6 to 11 Years | 77 (54.2%) | 209 (82.9%) |
| 12 to 14 Years | 96 (56.8%) | 112 (91.8%) |
| 15 Years | 82 (81.2%) | 0 (0.0%) |
| 16 and 17 Years | 59 (81.9%) | 91 (64.1%) |
| 18 to 24 Years | 243 (89.7%) | 102 (43.2%) |
| 25 to 34 Years | 554 (91.1%) | 569 (69.8%) |
| 35 to 44 Years | 253 (68.6%) | 229 (71.6%) |
| 45 to 54 Years | 251 (63.9%) | 446 (80.8%) |
| 55 to 64 Years | 350 (68.2%) | 421 (74.9%) |
| 65 to 74 Years | 318 (87.1%) | 396 (83.2%) |
| 75 Years and over | 297 (97.7%) | 312 (92.6%) |
| Total | 2,924 (77.6%) | 3,111 (74.4%) |
Income Below Poverty Among Married-Couple Families in Harrisburg
The poverty statistics for married-couple families in Harrisburg show that 6.3% or 76 of the total 1,198 families live below the poverty line. Families with no children have the highest poverty rate of 10.8%, comprising of 76 families. On the other hand, families with 1 or 2 children have the lowest poverty rate of 0.0%, which includes 0 families.
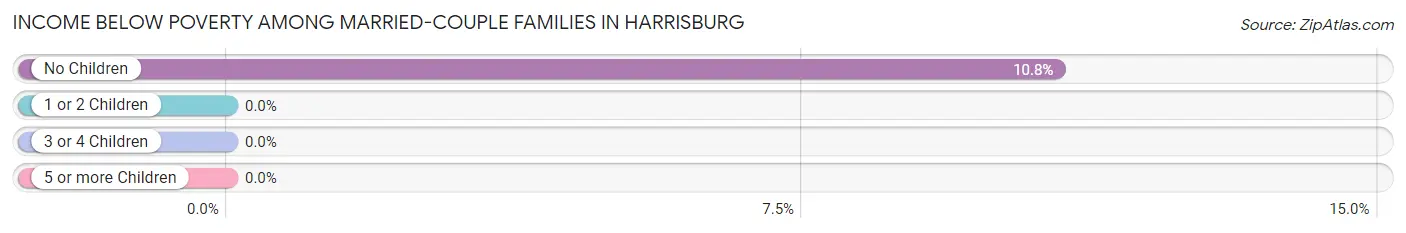
| Children | Above Poverty | Below Poverty |
| No Children | 628 (89.2%) | 76 (10.8%) |
| 1 or 2 Children | 414 (100.0%) | 0 (0.0%) |
| 3 or 4 Children | 80 (100.0%) | 0 (0.0%) |
| 5 or more Children | 0 (0.0%) | 0 (0.0%) |
| Total | 1,122 (93.7%) | 76 (6.3%) |
Income Below Poverty Among Single-Parent Households in Harrisburg
According to the poverty data in Harrisburg, 16.3% or 36 single-father households and 50.7% or 318 single-mother households are living below the poverty line. Among single-father households, those with 1 or 2 children have the highest poverty rate, with 36 households (25.4%) experiencing poverty. Likewise, among single-mother households, those with 3 or 4 children have the highest poverty rate, with 111 households (65.3%) falling below the poverty line.
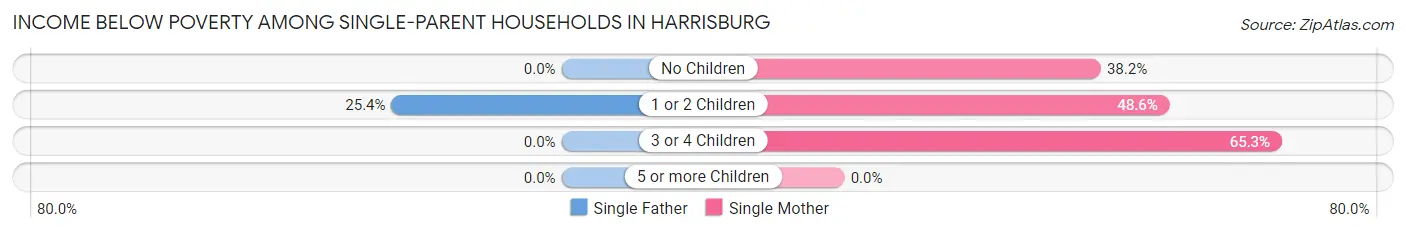
| Children | Single Father | Single Mother |
| No Children | 0 (0.0%) | 55 (38.2%) |
| 1 or 2 Children | 36 (25.4%) | 152 (48.6%) |
| 3 or 4 Children | 0 (0.0%) | 111 (65.3%) |
| 5 or more Children | 0 (0.0%) | 0 (0.0%) |
| Total | 36 (16.3%) | 318 (50.7%) |
Income Below Poverty Among Married-Couple vs Single-Parent Households in Harrisburg
The poverty data for Harrisburg shows that 76 of the married-couple family households (6.3%) and 354 of the single-parent households (41.7%) are living below the poverty level. Within the married-couple family households, those with no children have the highest poverty rate, with 76 households (10.8%) falling below the poverty line. Among the single-parent households, those with 3 or 4 children have the highest poverty rate, with 111 household (65.3%) living below poverty.
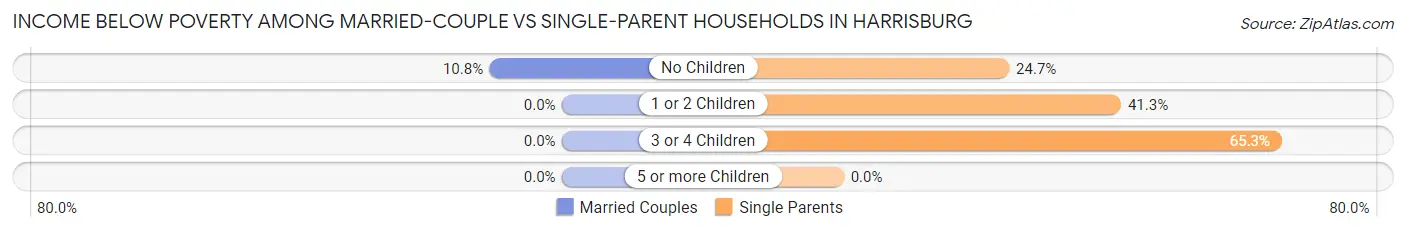
| Children | Married-Couple Families | Single-Parent Households |
| No Children | 76 (10.8%) | 55 (24.7%) |
| 1 or 2 Children | 0 (0.0%) | 188 (41.3%) |
| 3 or 4 Children | 0 (0.0%) | 111 (65.3%) |
| 5 or more Children | 0 (0.0%) | 0 (0.0%) |
| Total | 76 (6.3%) | 354 (41.7%) |
Race in Harrisburg
The most populous races in Harrisburg are White / Caucasian (7,667 | 91.5%), Two or more Races (453 | 5.4%), and Black / African American (185 | 2.2%).
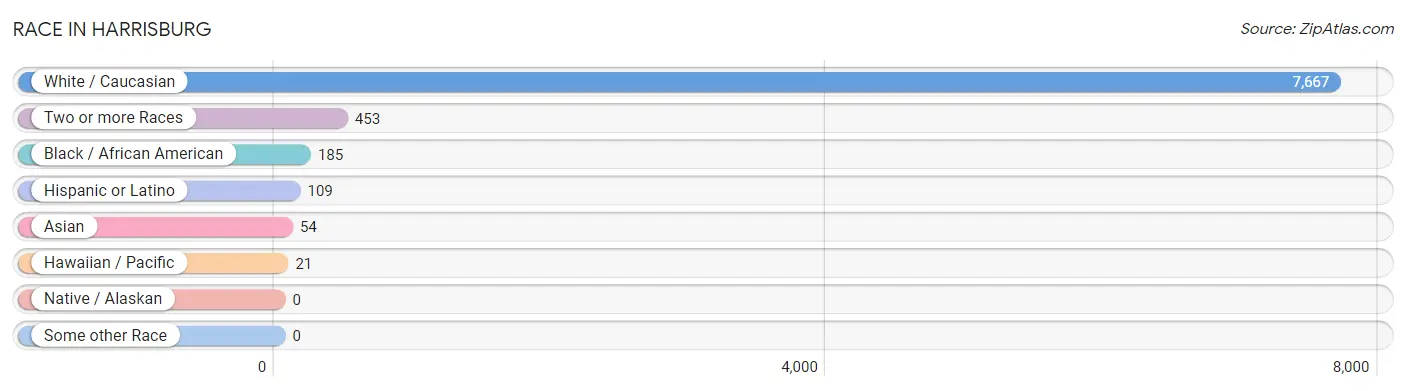
| Race | # Population | % Population |
| Asian | 54 | 0.6% |
| Black / African American | 185 | 2.2% |
| Hawaiian / Pacific | 21 | 0.3% |
| Hispanic or Latino | 109 | 1.3% |
| Native / Alaskan | 0 | 0.0% |
| White / Caucasian | 7,667 | 91.5% |
| Two or more Races | 453 | 5.4% |
| Some other Race | 0 | 0.0% |
| Total | 8,380 | 100.0% |
Ancestry in Harrisburg
The most populous ancestries reported in Harrisburg are Irish (1,468 | 17.5%), German (1,360 | 16.2%), English (1,066 | 12.7%), American (722 | 8.6%), and European (251 | 3.0%), together accounting for 58.1% of all Harrisburg residents.
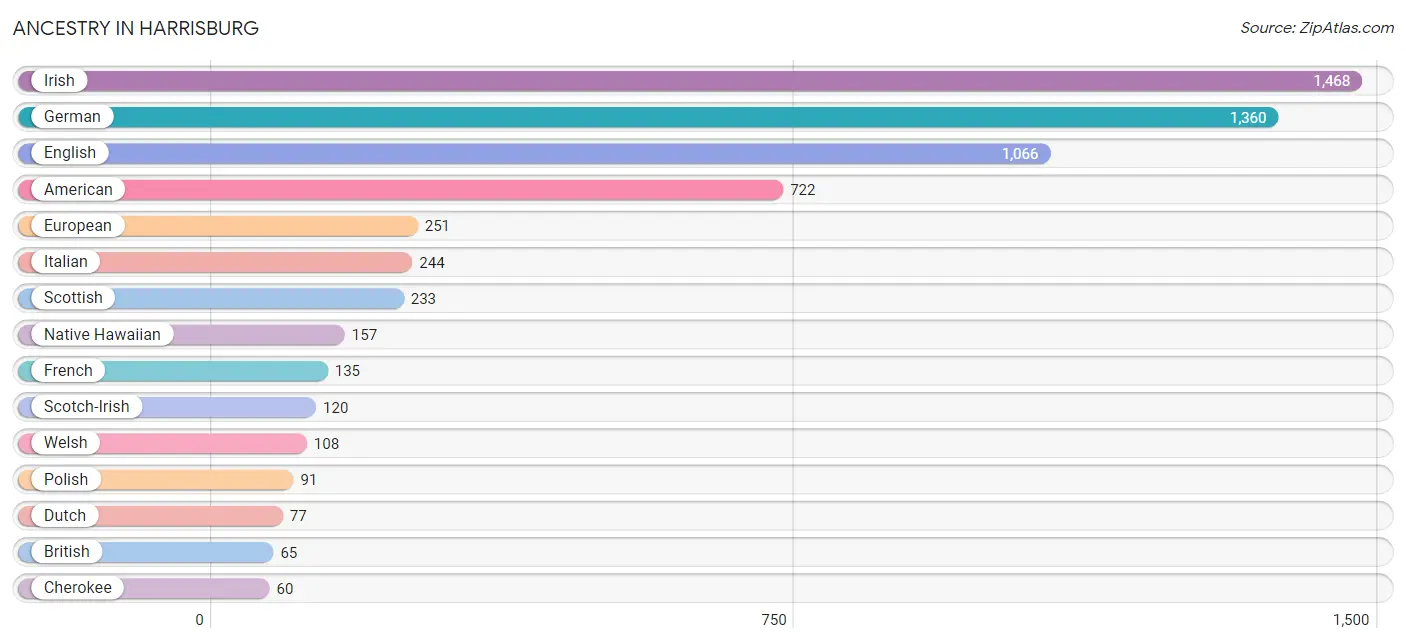
| Ancestry | # Population | % Population |
| American | 722 | 8.6% |
| Apache | 42 | 0.5% |
| Belgian | 10 | 0.1% |
| Blackfeet | 42 | 0.5% |
| British | 65 | 0.8% |
| Cherokee | 60 | 0.7% |
| Dutch | 77 | 0.9% |
| English | 1,066 | 12.7% |
| European | 251 | 3.0% |
| French | 135 | 1.6% |
| French Canadian | 9 | 0.1% |
| German | 1,360 | 16.2% |
| Hungarian | 15 | 0.2% |
| Indian (Asian) | 39 | 0.5% |
| Irish | 1,468 | 17.5% |
| Italian | 244 | 2.9% |
| Lithuanian | 9 | 0.1% |
| Mexican | 53 | 0.6% |
| Native Hawaiian | 157 | 1.9% |
| Polish | 91 | 1.1% |
| Puerto Rican | 14 | 0.2% |
| Russian | 12 | 0.1% |
| Scandinavian | 2 | 0.0% |
| Scotch-Irish | 120 | 1.4% |
| Scottish | 233 | 2.8% |
| Spaniard | 42 | 0.5% |
| Swedish | 27 | 0.3% |
| U.S. Virgin Islander | 7 | 0.1% |
| Welsh | 108 | 1.3% | View All 29 Rows |
Immigrants in Harrisburg
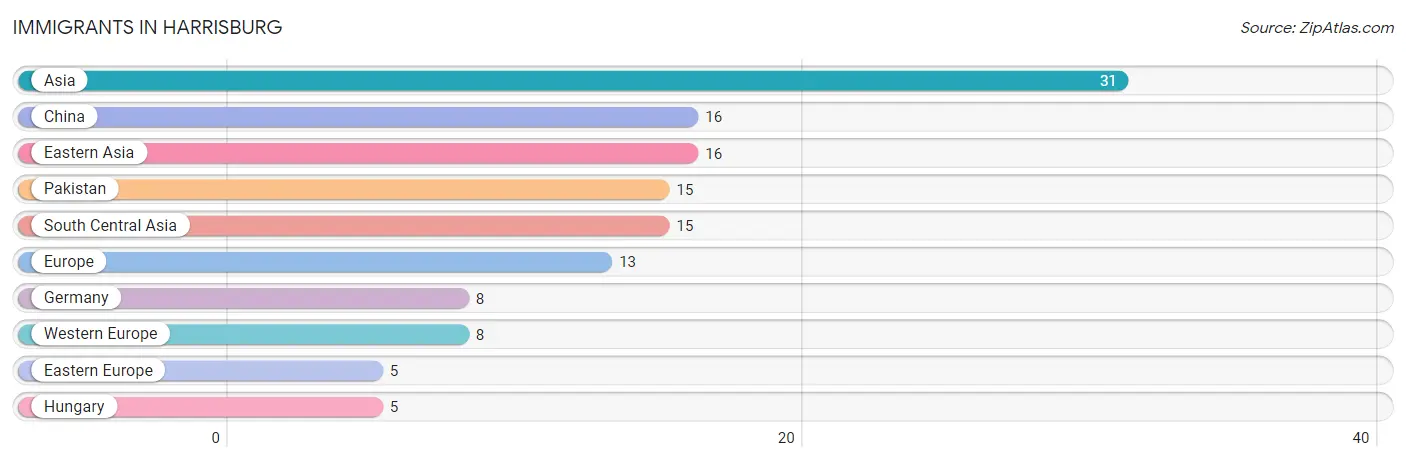
The most numerous immigrant groups reported in Harrisburg came from Asia (31 | 0.4%), China (16 | 0.2%), Eastern Asia (16 | 0.2%), Pakistan (15 | 0.2%), and South Central Asia (15 | 0.2%), together accounting for 1.1% of all Harrisburg residents.
| Immigration Origin | # Population | % Population |
| Asia | 31 | 0.4% |
| China | 16 | 0.2% |
| Eastern Asia | 16 | 0.2% |
| Eastern Europe | 5 | 0.1% |
| Europe | 13 | 0.2% |
| Germany | 8 | 0.1% |
| Hungary | 5 | 0.1% |
| Pakistan | 15 | 0.2% |
| South Central Asia | 15 | 0.2% |
| Western Europe | 8 | 0.1% | View All 10 Rows |
Sex and Age in Harrisburg
Sex and Age in Harrisburg
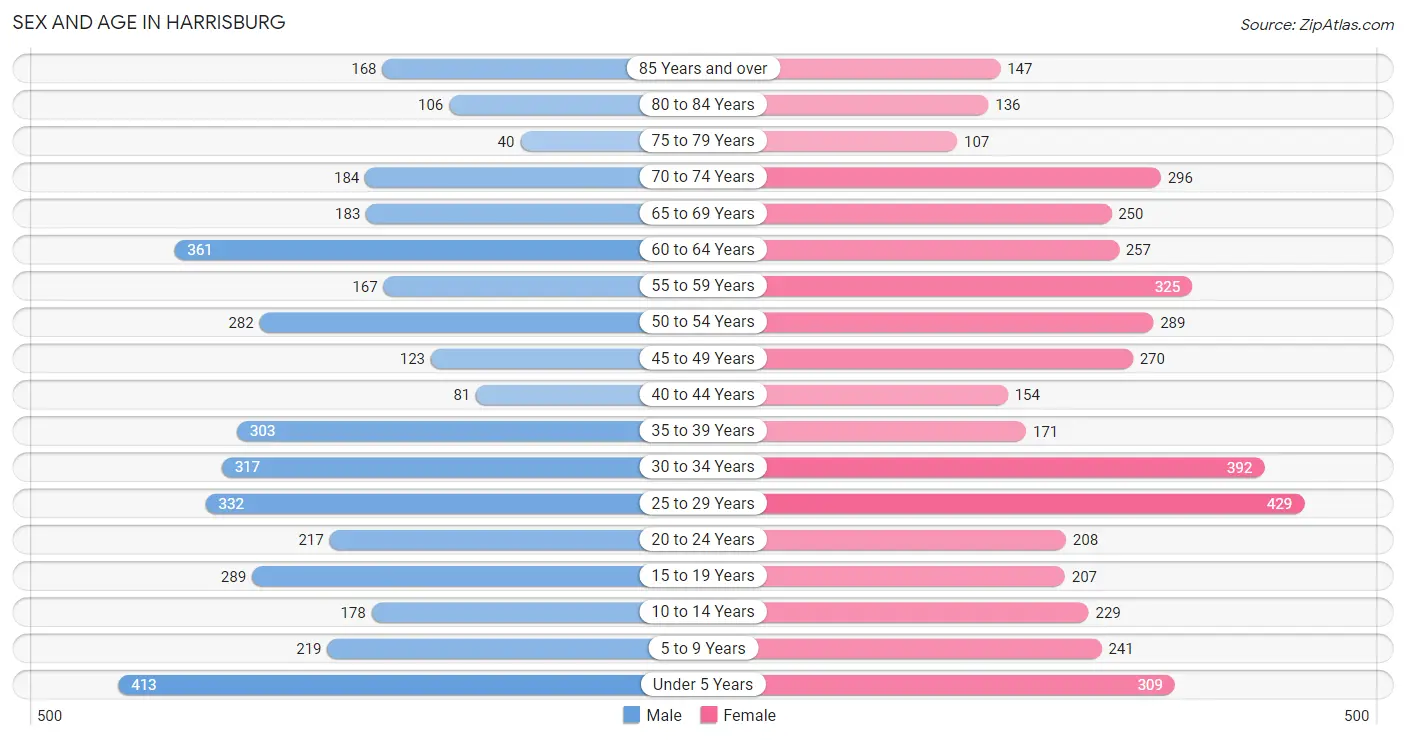
The most populous age groups in Harrisburg are Under 5 Years (413 | 10.4%) for men and 25 to 29 Years (429 | 9.7%) for women.
| Age Bracket | Male | Female |
| Under 5 Years | 413 (10.4%) | 309 (7.0%) |
| 5 to 9 Years | 219 (5.5%) | 241 (5.5%) |
| 10 to 14 Years | 178 (4.5%) | 229 (5.2%) |
| 15 to 19 Years | 289 (7.3%) | 207 (4.7%) |
| 20 to 24 Years | 217 (5.5%) | 208 (4.7%) |
| 25 to 29 Years | 332 (8.4%) | 429 (9.7%) |
| 30 to 34 Years | 317 (8.0%) | 392 (8.9%) |
| 35 to 39 Years | 303 (7.6%) | 171 (3.9%) |
| 40 to 44 Years | 81 (2.0%) | 154 (3.5%) |
| 45 to 49 Years | 123 (3.1%) | 270 (6.1%) |
| 50 to 54 Years | 282 (7.1%) | 289 (6.5%) |
| 55 to 59 Years | 167 (4.2%) | 325 (7.4%) |
| 60 to 64 Years | 361 (9.1%) | 257 (5.8%) |
| 65 to 69 Years | 183 (4.6%) | 250 (5.7%) |
| 70 to 74 Years | 184 (4.6%) | 296 (6.7%) |
| 75 to 79 Years | 40 (1.0%) | 107 (2.4%) |
| 80 to 84 Years | 106 (2.7%) | 136 (3.1%) |
| 85 Years and over | 168 (4.2%) | 147 (3.3%) |
| Total | 3,963 (100.0%) | 4,417 (100.0%) |
Families and Households in Harrisburg
Median Family Size in Harrisburg
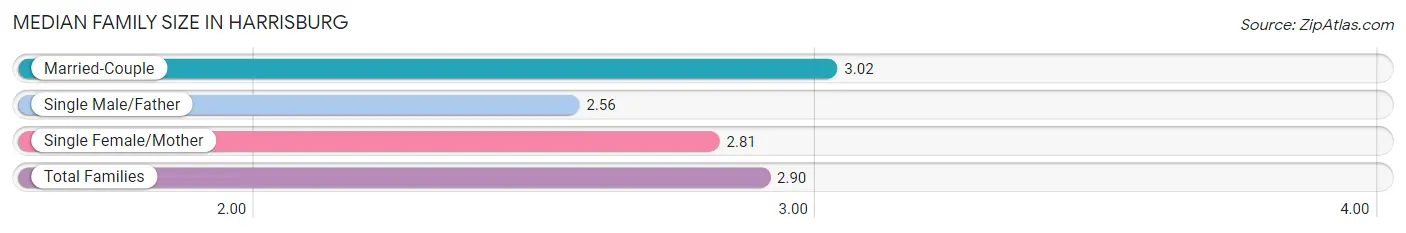
The median family size in Harrisburg is 2.90 persons per family, with married-couple families (1,198 | 58.6%) accounting for the largest median family size of 3.02 persons per family. On the other hand, single male/father families (221 | 10.8%) represent the smallest median family size with 2.56 persons per family.
| Family Type | # Families | Family Size |
| Married-Couple | 1,198 (58.6%) | 3.02 |
| Single Male/Father | 221 (10.8%) | 2.56 |
| Single Female/Mother | 627 (30.6%) | 2.81 |
| Total Families | 2,046 (100.0%) | 2.90 |
Median Household Size in Harrisburg
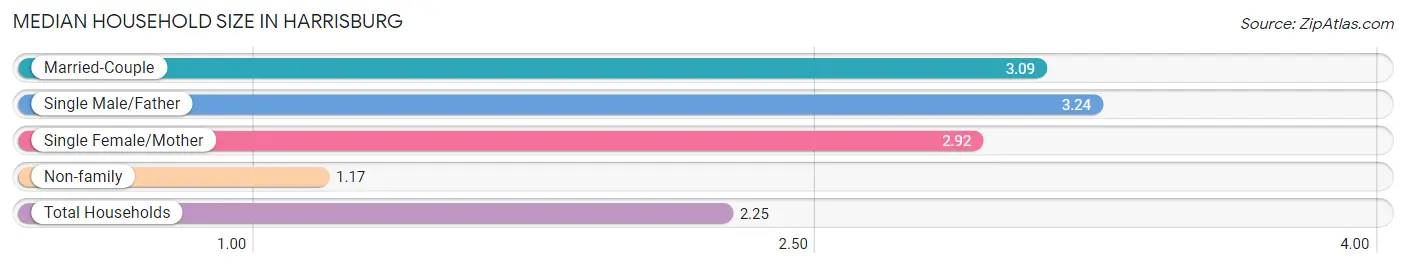
The median household size in Harrisburg is 2.25 persons per household, with single male/father households (221 | 6.2%) accounting for the largest median household size of 3.24 persons per household. non-family households (1,533 | 42.8%) represent the smallest median household size with 1.17 persons per household.
| Household Type | # Households | Household Size |
| Married-Couple | 1,198 (33.5%) | 3.09 |
| Single Male/Father | 221 (6.2%) | 3.24 |
| Single Female/Mother | 627 (17.5%) | 2.92 |
| Non-family | 1,533 (42.8%) | 1.17 |
| Total Households | 3,579 (100.0%) | 2.25 |
Household Size by Marriage Status in Harrisburg
Out of a total of 3,579 households in Harrisburg, 2,046 (57.2%) are family households, while 1,533 (42.8%) are nonfamily households. The most numerous type of family households are 2-person households, comprising 832, and the most common type of nonfamily households are 1-person households, comprising 1,369.
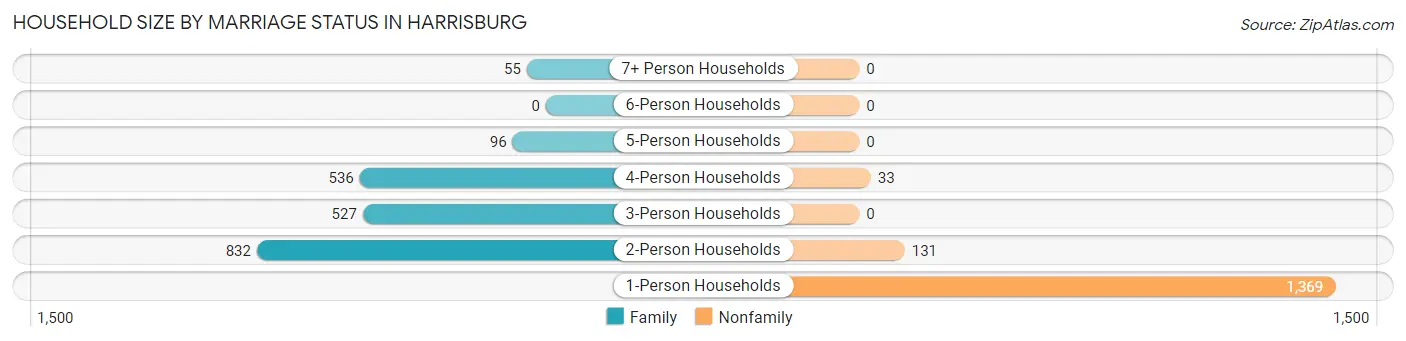
| Household Size | Family Households | Nonfamily Households |
| 1-Person Households | - | 1,369 (38.3%) |
| 2-Person Households | 832 (23.3%) | 131 (3.7%) |
| 3-Person Households | 527 (14.7%) | 0 (0.0%) |
| 4-Person Households | 536 (15.0%) | 33 (0.9%) |
| 5-Person Households | 96 (2.7%) | 0 (0.0%) |
| 6-Person Households | 0 (0.0%) | 0 (0.0%) |
| 7+ Person Households | 55 (1.5%) | 0 (0.0%) |
| Total | 2,046 (57.2%) | 1,533 (42.8%) |
Female Fertility in Harrisburg
Fertility by Age in Harrisburg
Average fertility rate in Harrisburg is 85.0 births per 1,000 women. Women in the age bracket of 20 to 34 years have the highest fertility rate with 139.0 births per 1,000 women. Women in the age bracket of 20 to 34 years acount for 91.1% of all women with births.
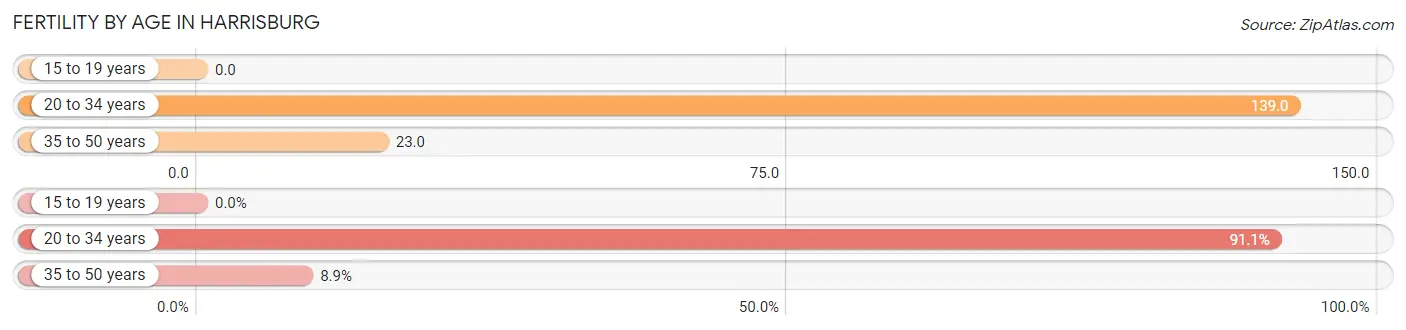
| Age Bracket | Women with Births | Births / 1,000 Women |
| 15 to 19 years | 0 (0.0%) | 0.0 |
| 20 to 34 years | 143 (91.1%) | 139.0 |
| 35 to 50 years | 14 (8.9%) | 23.0 |
| Total | 157 (100.0%) | 85.0 |
Fertility by Age by Marriage Status in Harrisburg
52.2% of women with births (157) in Harrisburg are married. The highest percentage of unmarried women with births falls into 20 to 34 years age bracket with 52.4% of them unmarried at the time of birth, while the lowest percentage of unmarried women with births belong to 35 to 50 years age bracket with 0.0% of them unmarried.
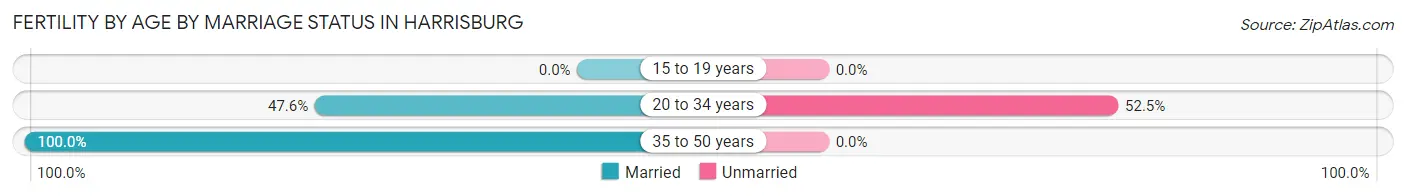
| Age Bracket | Married | Unmarried |
| 15 to 19 years | 0 (0.0%) | 0 (0.0%) |
| 20 to 34 years | 68 (47.5%) | 75 (52.4%) |
| 35 to 50 years | 14 (100.0%) | 0 (0.0%) |
| Total | 82 (52.2%) | 75 (47.8%) |
Fertility by Education in Harrisburg
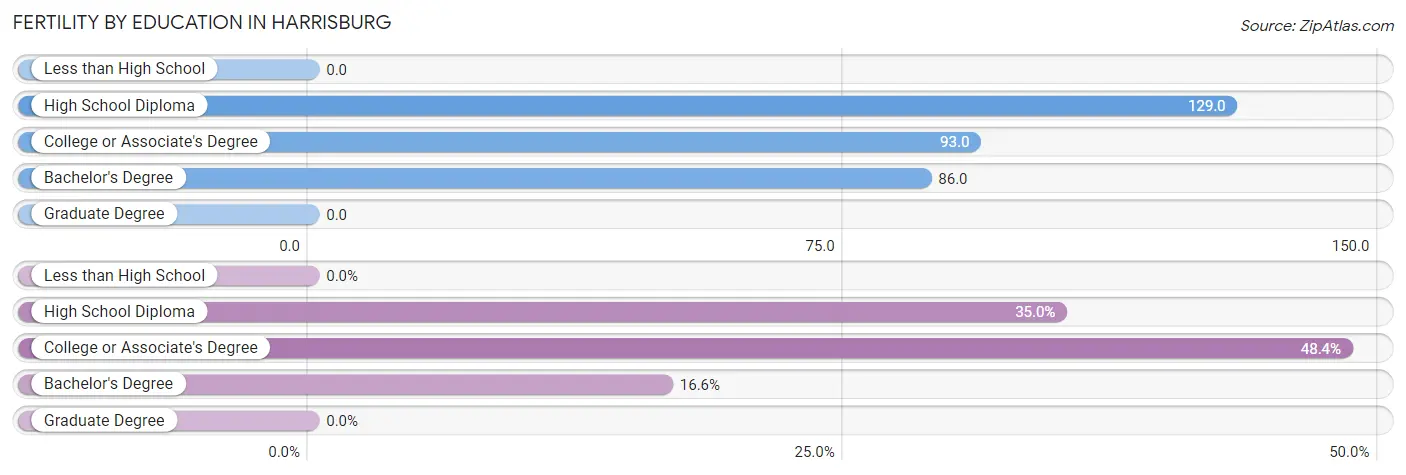
| Educational Attainment | Women with Births | Births / 1,000 Women |
| Less than High School | 0 (0.0%) | 0.0 |
| High School Diploma | 55 (35.0%) | 129.0 |
| College or Associate's Degree | 76 (48.4%) | 93.0 |
| Bachelor's Degree | 26 (16.6%) | 86.0 |
| Graduate Degree | 0 (0.0%) | 0.0 |
| Total | 157 (100.0%) | 85.0 |
Fertility by Education by Marriage Status in Harrisburg
47.8% of women with births in Harrisburg are unmarried. Women with the educational attainment of bachelor's degree are most likely to be married with 100.0% of them married at childbirth, while women with the educational attainment of high school diploma are least likely to be married with 100.0% of them unmarried at childbirth.
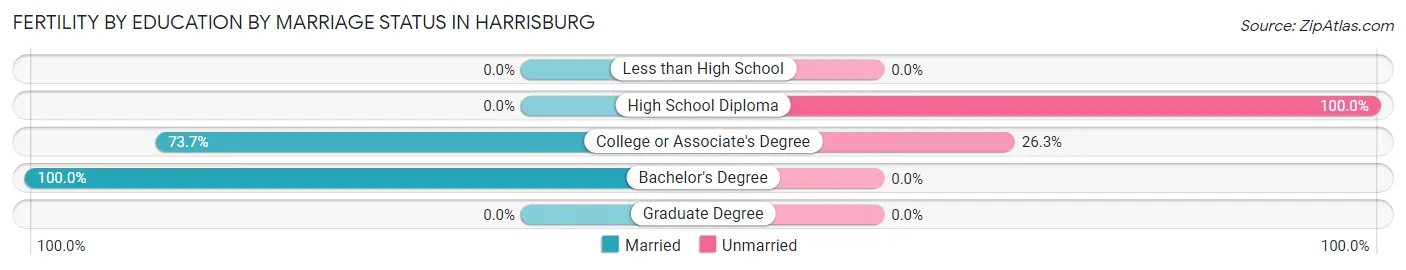
| Educational Attainment | Married | Unmarried |
| Less than High School | 0 (0.0%) | 0 (0.0%) |
| High School Diploma | 0 (0.0%) | 55 (100.0%) |
| College or Associate's Degree | 56 (73.7%) | 20 (26.3%) |
| Bachelor's Degree | 26 (100.0%) | 0 (0.0%) |
| Graduate Degree | 0 (0.0%) | 0 (0.0%) |
| Total | 82 (52.2%) | 75 (47.8%) |
Employment Characteristics in Harrisburg
Employment by Class of Employer in Harrisburg
Among the 3,392 employed individuals in Harrisburg, private company employees (2,034 | 60.0%), not-for-profit organizations (377 | 11.1%), and local government employees (273 | 8.1%) make up the most common classes of employment.
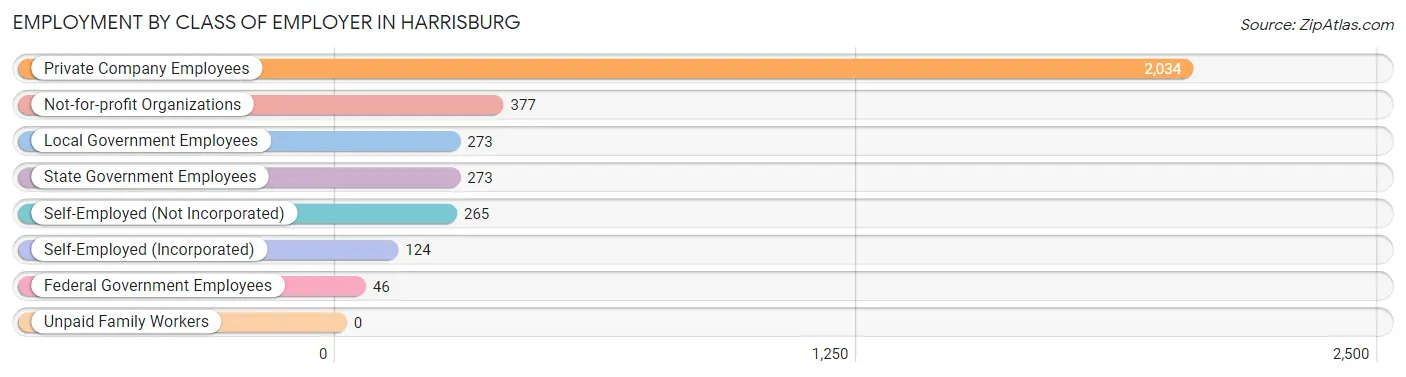
| Employer Class | # Employees | % Employees |
| Private Company Employees | 2,034 | 60.0% |
| Self-Employed (Incorporated) | 124 | 3.7% |
| Self-Employed (Not Incorporated) | 265 | 7.8% |
| Not-for-profit Organizations | 377 | 11.1% |
| Local Government Employees | 273 | 8.1% |
| State Government Employees | 273 | 8.1% |
| Federal Government Employees | 46 | 1.4% |
| Unpaid Family Workers | 0 | 0.0% |
| Total | 3,392 | 100.0% |
Employment Status by Age in Harrisburg
According to the labor force statistics for Harrisburg, out of the total population over 16 years of age (6,652), 56.9% or 3,785 individuals are in the labor force, with 7.7% or 291 of them unemployed. The age group with the highest labor force participation rate is 30 to 34 years, with 86.9% or 616 individuals in the labor force. Within the labor force, the 16 to 19 years age range has the highest percentage of unemployed individuals, with 28.9% or 59 of them being unemployed.
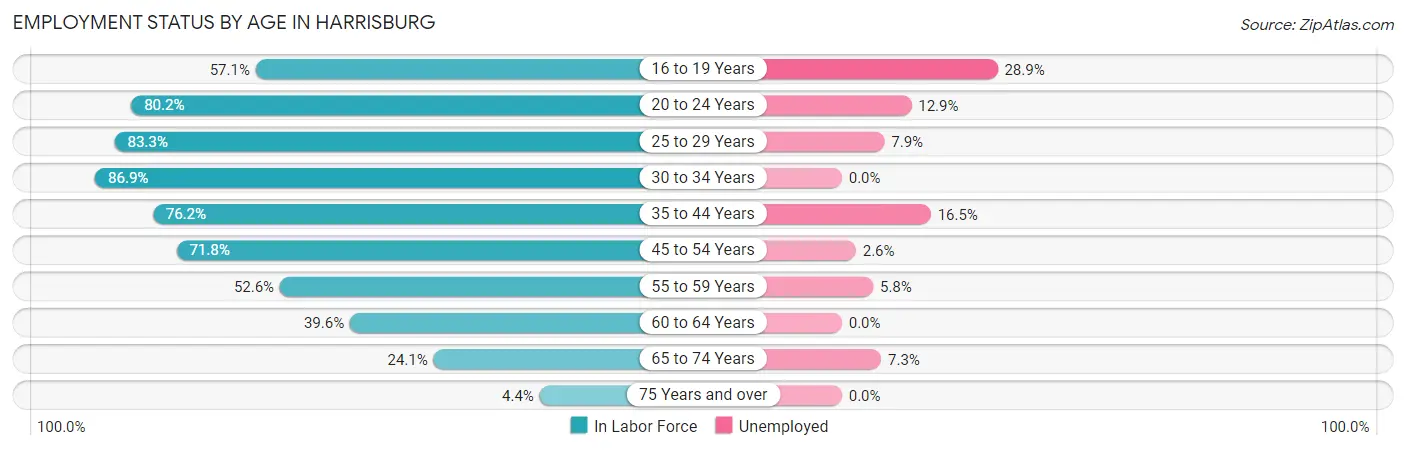
| Age Bracket | In Labor Force | Unemployed |
| 16 to 19 Years | 204 (57.1%) | 59 (28.9%) |
| 20 to 24 Years | 341 (80.2%) | 44 (12.9%) |
| 25 to 29 Years | 634 (83.3%) | 50 (7.9%) |
| 30 to 34 Years | 616 (86.9%) | 0 (0.0%) |
| 35 to 44 Years | 540 (76.2%) | 89 (16.5%) |
| 45 to 54 Years | 692 (71.8%) | 18 (2.6%) |
| 55 to 59 Years | 259 (52.6%) | 15 (5.8%) |
| 60 to 64 Years | 245 (39.6%) | 0 (0.0%) |
| 65 to 74 Years | 220 (24.1%) | 16 (7.3%) |
| 75 Years and over | 31 (4.4%) | 0 (0.0%) |
| Total | 3,785 (56.9%) | 291 (7.7%) |
Employment Status by Educational Attainment in Harrisburg
According to labor force statistics for Harrisburg, 70.2% of individuals (2,986) out of the total population between 25 and 64 years of age (4,253) are in the labor force, with 5.8% or 173 of them being unemployed. The group with the highest labor force participation rate are those with the educational attainment of bachelor's degree or higher, with 87.8% or 778 individuals in the labor force. Within the labor force, individuals with less than high school education have the highest percentage of unemployment, with 21.0% or 66 of them being unemployed.
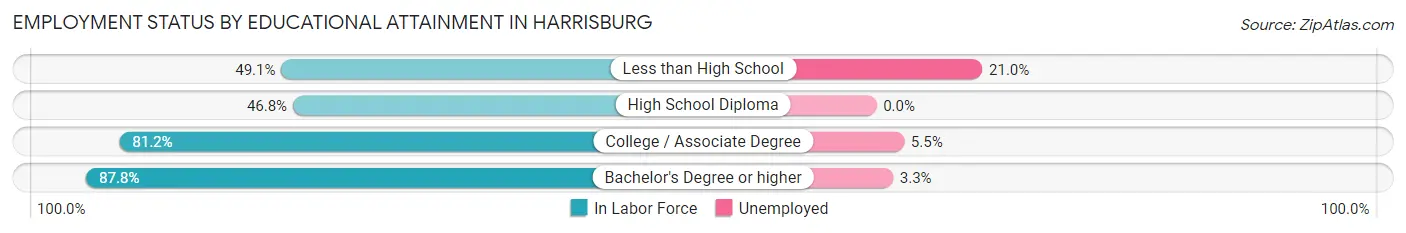
| Educational Attainment | In Labor Force | Unemployed |
| Less than High School | 314 (49.1%) | 134 (21.0%) |
| High School Diploma | 437 (46.8%) | 0 (0.0%) |
| College / Associate Degree | 1,457 (81.2%) | 99 (5.5%) |
| Bachelor's Degree or higher | 778 (87.8%) | 29 (3.3%) |
| Total | 2,986 (70.2%) | 247 (5.8%) |
Employment Occupations by Sex in Harrisburg
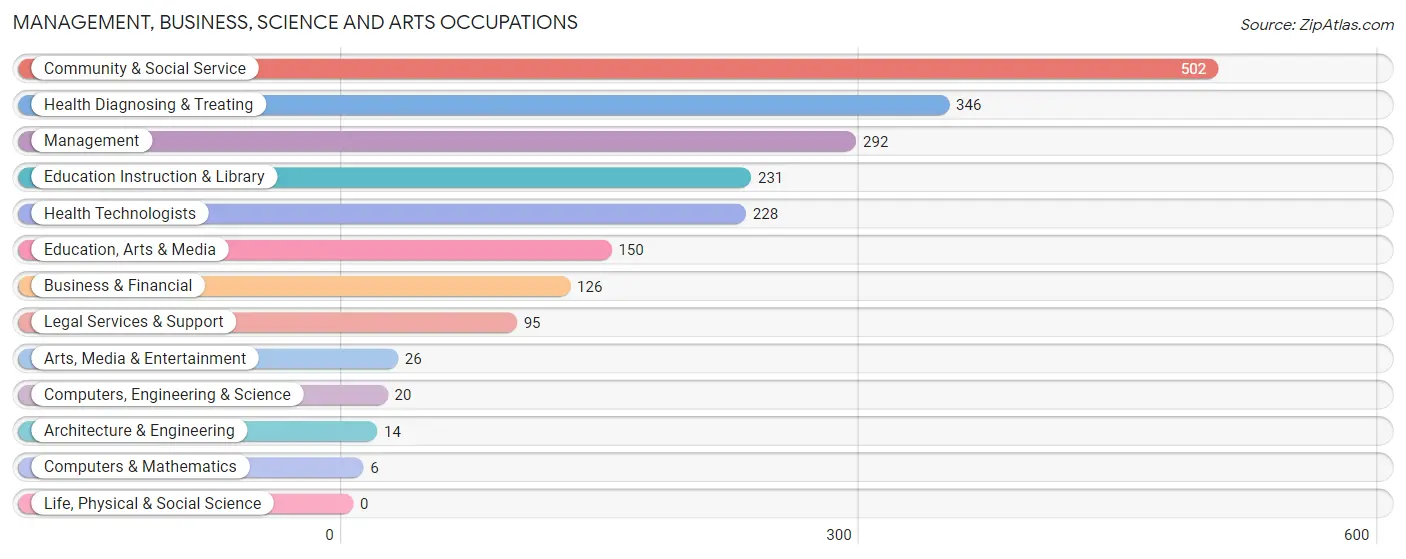
Management, Business, Science and Arts Occupations
The most common Management, Business, Science and Arts occupations in Harrisburg are Community & Social Service (502 | 14.4%), Health Diagnosing & Treating (346 | 9.9%), Management (292 | 8.4%), Education Instruction & Library (231 | 6.6%), and Health Technologists (228 | 6.5%).
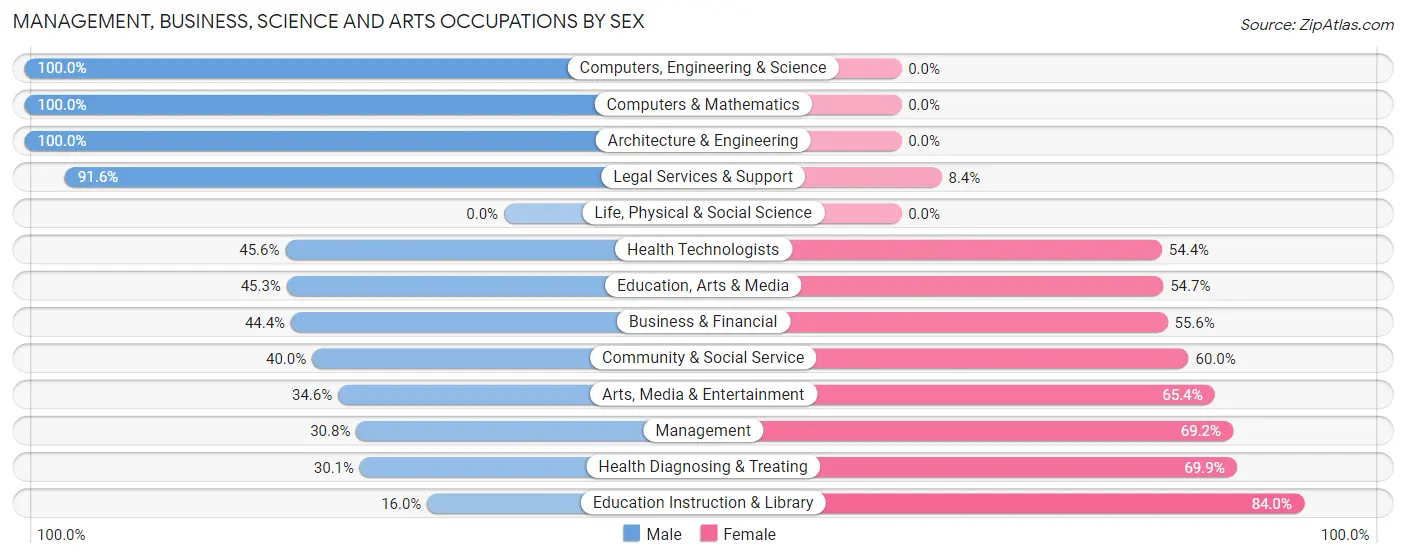
Management, Business, Science and Arts Occupations by Sex
Within the Management, Business, Science and Arts occupations in Harrisburg, the most male-oriented occupations are Computers, Engineering & Science (100.0%), Computers & Mathematics (100.0%), and Architecture & Engineering (100.0%), while the most female-oriented occupations are Education Instruction & Library (84.0%), Health Diagnosing & Treating (69.9%), and Management (69.2%).
| Occupation | Male | Female |
| Management | 90 (30.8%) | 202 (69.2%) |
| Business & Financial | 56 (44.4%) | 70 (55.6%) |
| Computers, Engineering & Science | 20 (100.0%) | 0 (0.0%) |
| Computers & Mathematics | 6 (100.0%) | 0 (0.0%) |
| Architecture & Engineering | 14 (100.0%) | 0 (0.0%) |
| Life, Physical & Social Science | 0 (0.0%) | 0 (0.0%) |
| Community & Social Service | 201 (40.0%) | 301 (60.0%) |
| Education, Arts & Media | 68 (45.3%) | 82 (54.7%) |
| Legal Services & Support | 87 (91.6%) | 8 (8.4%) |
| Education Instruction & Library | 37 (16.0%) | 194 (84.0%) |
| Arts, Media & Entertainment | 9 (34.6%) | 17 (65.4%) |
| Health Diagnosing & Treating | 104 (30.1%) | 242 (69.9%) |
| Health Technologists | 104 (45.6%) | 124 (54.4%) |
| Total (Category) | 471 (36.6%) | 815 (63.4%) |
| Total (Overall) | 1,588 (45.5%) | 1,903 (54.5%) |
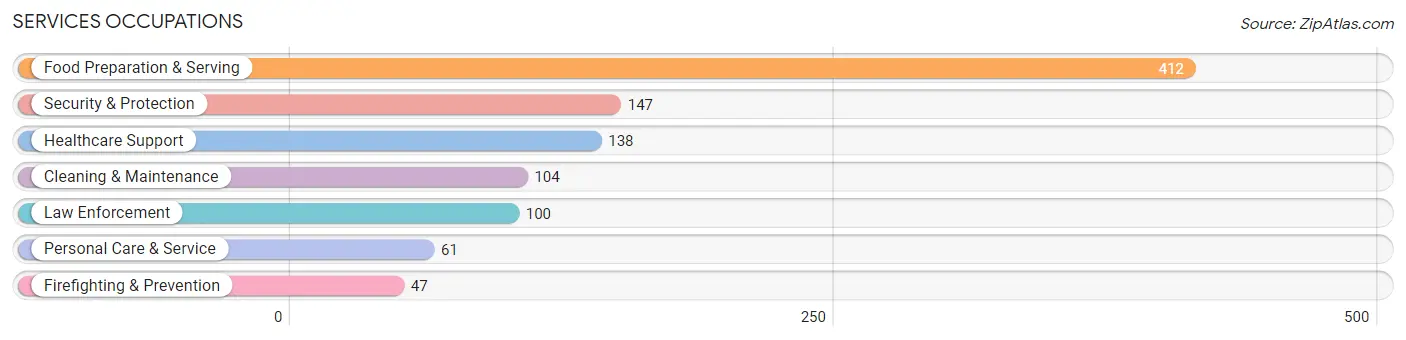
Services Occupations
The most common Services occupations in Harrisburg are Food Preparation & Serving (412 | 11.8%), Security & Protection (147 | 4.2%), Healthcare Support (138 | 4.0%), Cleaning & Maintenance (104 | 3.0%), and Law Enforcement (100 | 2.9%).
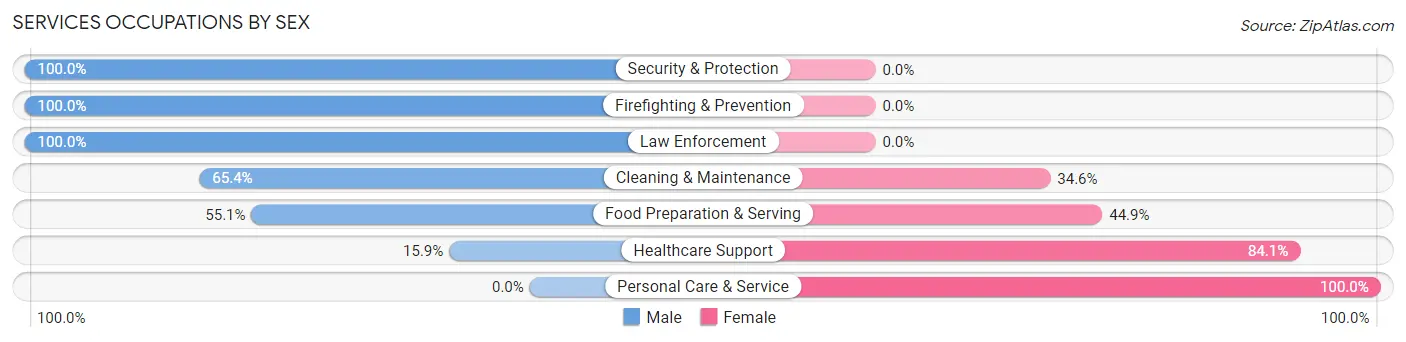
Services Occupations by Sex
Within the Services occupations in Harrisburg, the most male-oriented occupations are Security & Protection (100.0%), Firefighting & Prevention (100.0%), and Law Enforcement (100.0%), while the most female-oriented occupations are Personal Care & Service (100.0%), Healthcare Support (84.1%), and Food Preparation & Serving (44.9%).
| Occupation | Male | Female |
| Healthcare Support | 22 (15.9%) | 116 (84.1%) |
| Security & Protection | 147 (100.0%) | 0 (0.0%) |
| Firefighting & Prevention | 47 (100.0%) | 0 (0.0%) |
| Law Enforcement | 100 (100.0%) | 0 (0.0%) |
| Food Preparation & Serving | 227 (55.1%) | 185 (44.9%) |
| Cleaning & Maintenance | 68 (65.4%) | 36 (34.6%) |
| Personal Care & Service | 0 (0.0%) | 61 (100.0%) |
| Total (Category) | 464 (53.8%) | 398 (46.2%) |
| Total (Overall) | 1,588 (45.5%) | 1,903 (54.5%) |
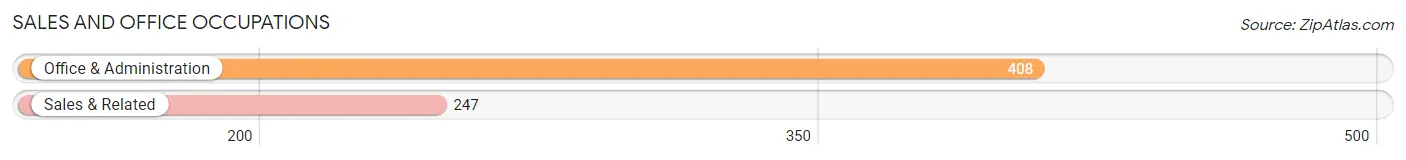
Sales and Office Occupations
The most common Sales and Office occupations in Harrisburg are Office & Administration (408 | 11.7%), and Sales & Related (247 | 7.1%).
Sales and Office Occupations by Sex
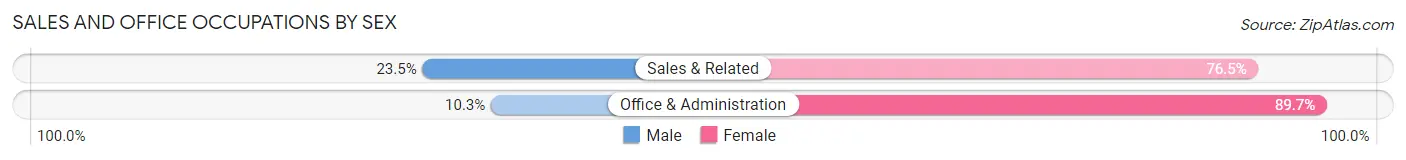
| Occupation | Male | Female |
| Sales & Related | 58 (23.5%) | 189 (76.5%) |
| Office & Administration | 42 (10.3%) | 366 (89.7%) |
| Total (Category) | 100 (15.3%) | 555 (84.7%) |
| Total (Overall) | 1,588 (45.5%) | 1,903 (54.5%) |
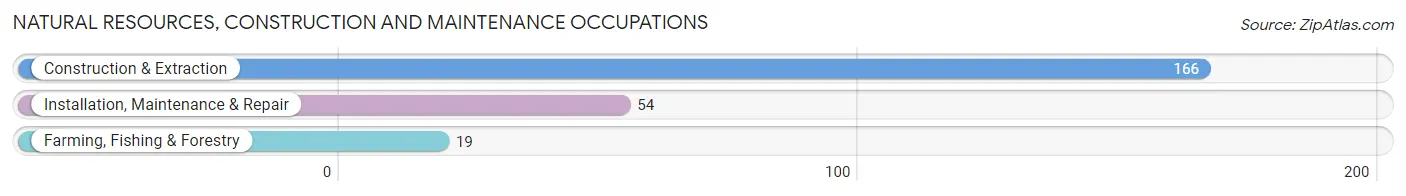
Natural Resources, Construction and Maintenance Occupations
The most common Natural Resources, Construction and Maintenance occupations in Harrisburg are Construction & Extraction (166 | 4.8%), Installation, Maintenance & Repair (54 | 1.5%), and Farming, Fishing & Forestry (19 | 0.5%).
Natural Resources, Construction and Maintenance Occupations by Sex
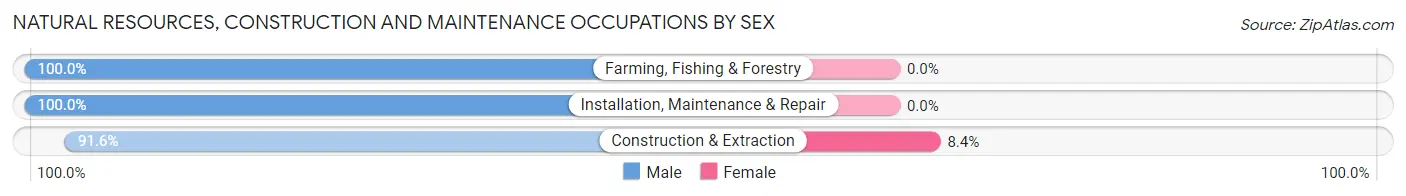
| Occupation | Male | Female |
| Farming, Fishing & Forestry | 19 (100.0%) | 0 (0.0%) |
| Construction & Extraction | 152 (91.6%) | 14 (8.4%) |
| Installation, Maintenance & Repair | 54 (100.0%) | 0 (0.0%) |
| Total (Category) | 225 (94.1%) | 14 (5.9%) |
| Total (Overall) | 1,588 (45.5%) | 1,903 (54.5%) |
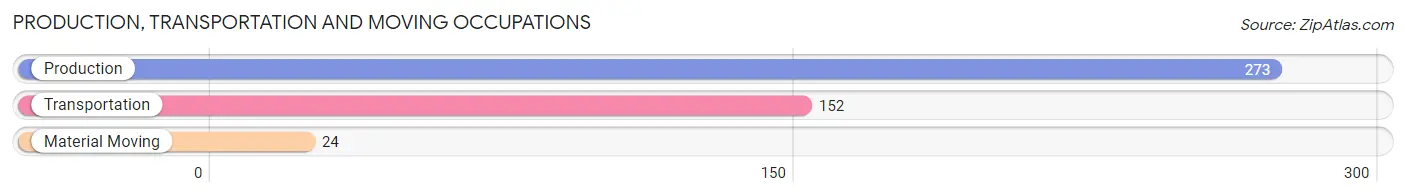
Production, Transportation and Moving Occupations
The most common Production, Transportation and Moving occupations in Harrisburg are Production (273 | 7.8%), Transportation (152 | 4.3%), and Material Moving (24 | 0.7%).
Production, Transportation and Moving Occupations by Sex
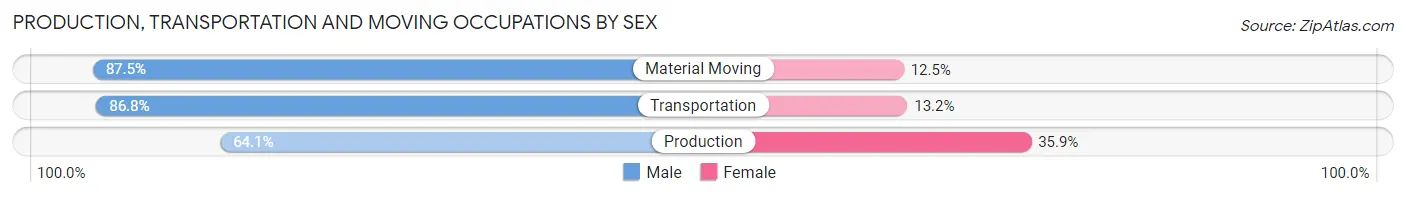
| Occupation | Male | Female |
| Production | 175 (64.1%) | 98 (35.9%) |
| Transportation | 132 (86.8%) | 20 (13.2%) |
| Material Moving | 21 (87.5%) | 3 (12.5%) |
| Total (Category) | 328 (73.1%) | 121 (27.0%) |
| Total (Overall) | 1,588 (45.5%) | 1,903 (54.5%) |
Employment Industries by Sex in Harrisburg
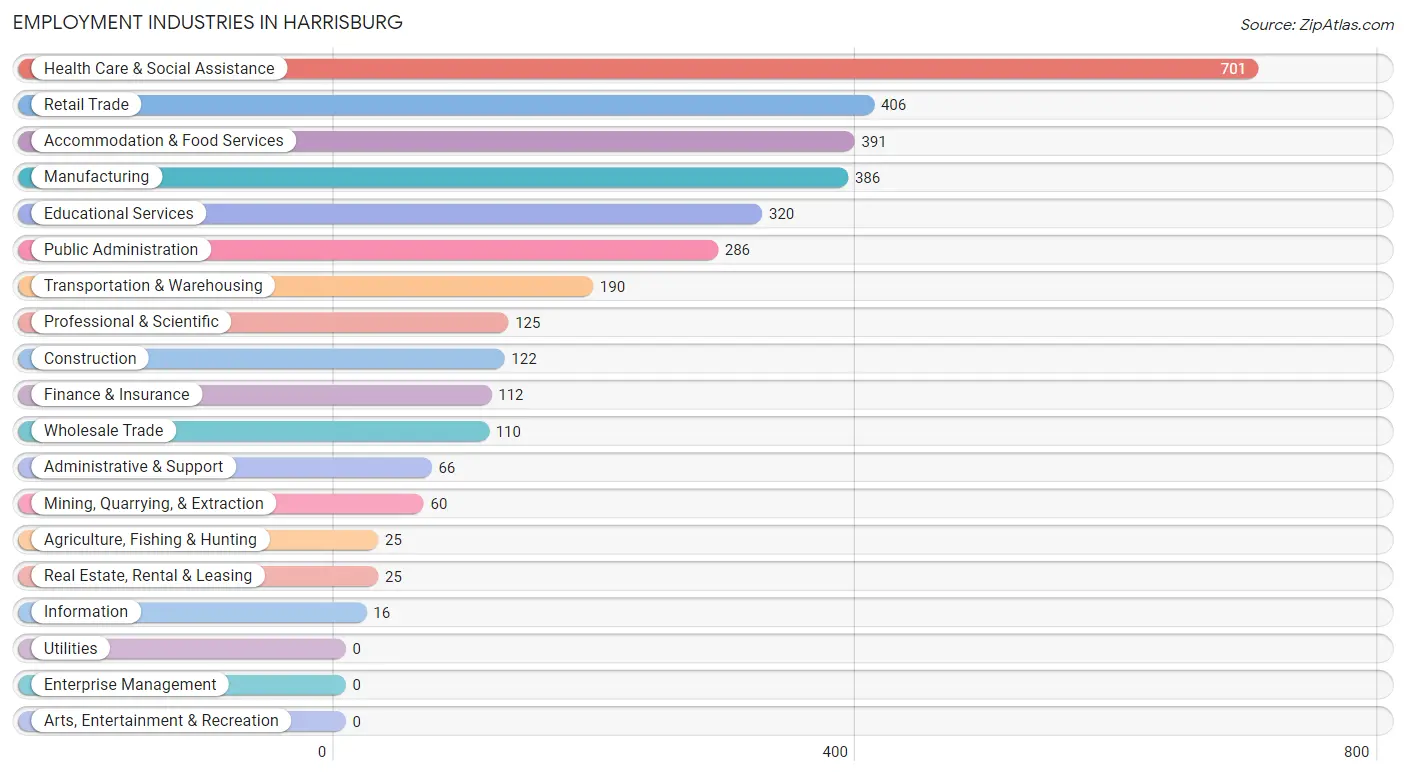
Employment Industries in Harrisburg
The major employment industries in Harrisburg include Health Care & Social Assistance (701 | 20.1%), Retail Trade (406 | 11.6%), Accommodation & Food Services (391 | 11.2%), Manufacturing (386 | 11.1%), and Educational Services (320 | 9.2%).
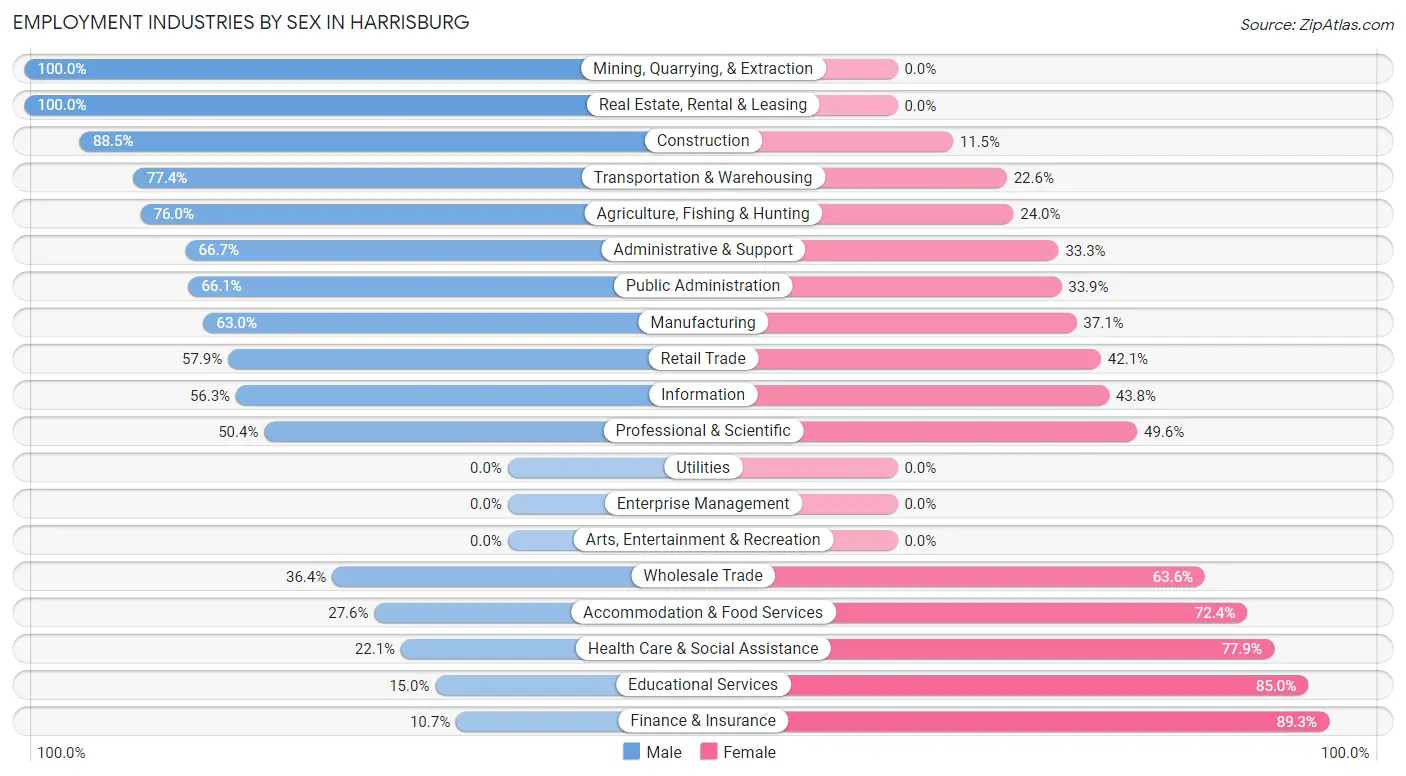
Employment Industries by Sex in Harrisburg
The Harrisburg industries that see more men than women are Mining, Quarrying, & Extraction (100.0%), Real Estate, Rental & Leasing (100.0%), and Construction (88.5%), whereas the industries that tend to have a higher number of women are Finance & Insurance (89.3%), Educational Services (85.0%), and Health Care & Social Assistance (77.9%).
| Industry | Male | Female |
| Agriculture, Fishing & Hunting | 19 (76.0%) | 6 (24.0%) |
| Mining, Quarrying, & Extraction | 60 (100.0%) | 0 (0.0%) |
| Construction | 108 (88.5%) | 14 (11.5%) |
| Manufacturing | 243 (62.9%) | 143 (37.0%) |
| Wholesale Trade | 40 (36.4%) | 70 (63.6%) |
| Retail Trade | 235 (57.9%) | 171 (42.1%) |
| Transportation & Warehousing | 147 (77.4%) | 43 (22.6%) |
| Utilities | 0 (0.0%) | 0 (0.0%) |
| Information | 9 (56.2%) | 7 (43.8%) |
| Finance & Insurance | 12 (10.7%) | 100 (89.3%) |
| Real Estate, Rental & Leasing | 25 (100.0%) | 0 (0.0%) |
| Professional & Scientific | 63 (50.4%) | 62 (49.6%) |
| Enterprise Management | 0 (0.0%) | 0 (0.0%) |
| Administrative & Support | 44 (66.7%) | 22 (33.3%) |
| Educational Services | 48 (15.0%) | 272 (85.0%) |
| Health Care & Social Assistance | 155 (22.1%) | 546 (77.9%) |
| Arts, Entertainment & Recreation | 0 (0.0%) | 0 (0.0%) |
| Accommodation & Food Services | 108 (27.6%) | 283 (72.4%) |
| Public Administration | 189 (66.1%) | 97 (33.9%) |
| Total | 1,588 (45.5%) | 1,903 (54.5%) |
Education in Harrisburg
School Enrollment in Harrisburg
The most common levels of schooling among the 1,436 students in Harrisburg are high school (386 | 26.9%), elementary school (333 | 23.2%), and middle school (316 | 22.0%).
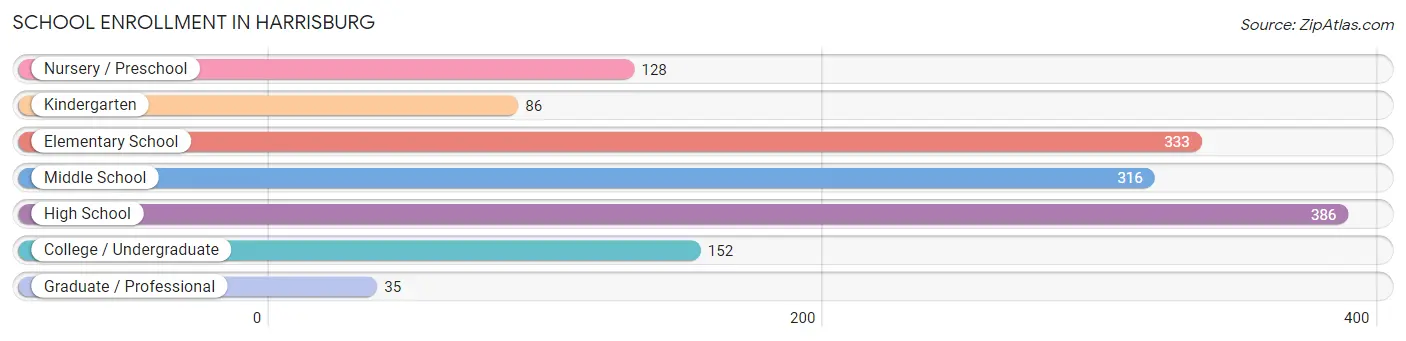
| School Level | # Students | % Students |
| Nursery / Preschool | 128 | 8.9% |
| Kindergarten | 86 | 6.0% |
| Elementary School | 333 | 23.2% |
| Middle School | 316 | 22.0% |
| High School | 386 | 26.9% |
| College / Undergraduate | 152 | 10.6% |
| Graduate / Professional | 35 | 2.4% |
| Total | 1,436 | 100.0% |
School Enrollment by Age by Funding Source in Harrisburg
Out of a total of 1,436 students who are enrolled in schools in Harrisburg, 122 (8.5%) attend a private institution, while the remaining 1,314 (91.5%) are enrolled in public schools. The age group of 18 to 19 year olds has the highest likelihood of being enrolled in private schools, with 12 (22.6% in the age bracket) enrolled. Conversely, the age group of 10 to 14 year olds has the lowest likelihood of being enrolled in a private school, with 370 (100.0% in the age bracket) attending a public institution.
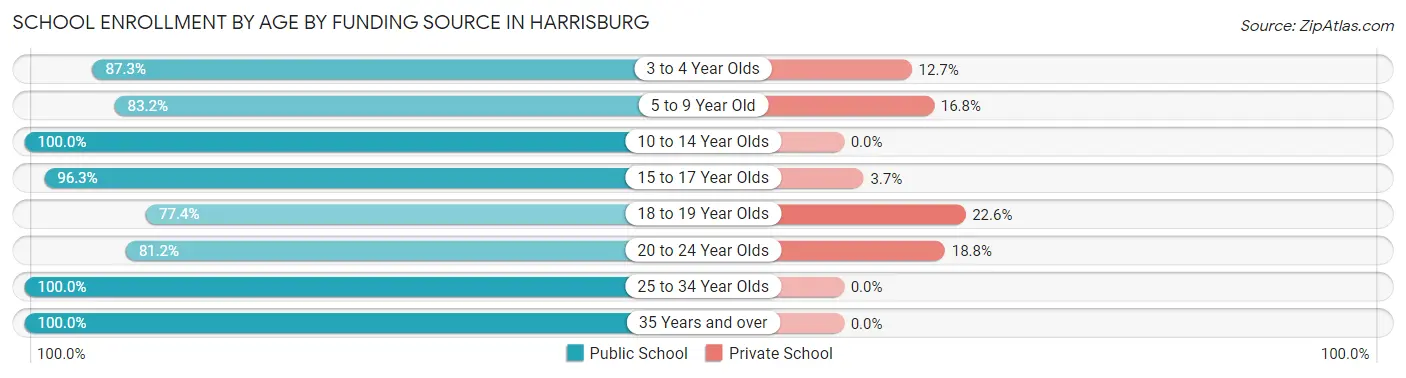
| Age Bracket | Public School | Private School |
| 3 to 4 Year Olds | 69 (87.3%) | 10 (12.7%) |
| 5 to 9 Year Old | 372 (83.2%) | 75 (16.8%) |
| 10 to 14 Year Olds | 370 (100.0%) | 0 (0.0%) |
| 15 to 17 Year Olds | 313 (96.3%) | 12 (3.7%) |
| 18 to 19 Year Olds | 41 (77.4%) | 12 (22.6%) |
| 20 to 24 Year Olds | 56 (81.2%) | 13 (18.8%) |
| 25 to 34 Year Olds | 89 (100.0%) | 0 (0.0%) |
| 35 Years and over | 4 (100.0%) | 0 (0.0%) |
| Total | 1,314 (91.5%) | 122 (8.5%) |
Educational Attainment by Field of Study in Harrisburg
Science & technology (253 | 20.9%), business (233 | 19.2%), education (155 | 12.8%), psychology (112 | 9.2%), and social sciences (94 | 7.8%) are the most common fields of study among 1,211 individuals in Harrisburg who have obtained a bachelor's degree or higher.
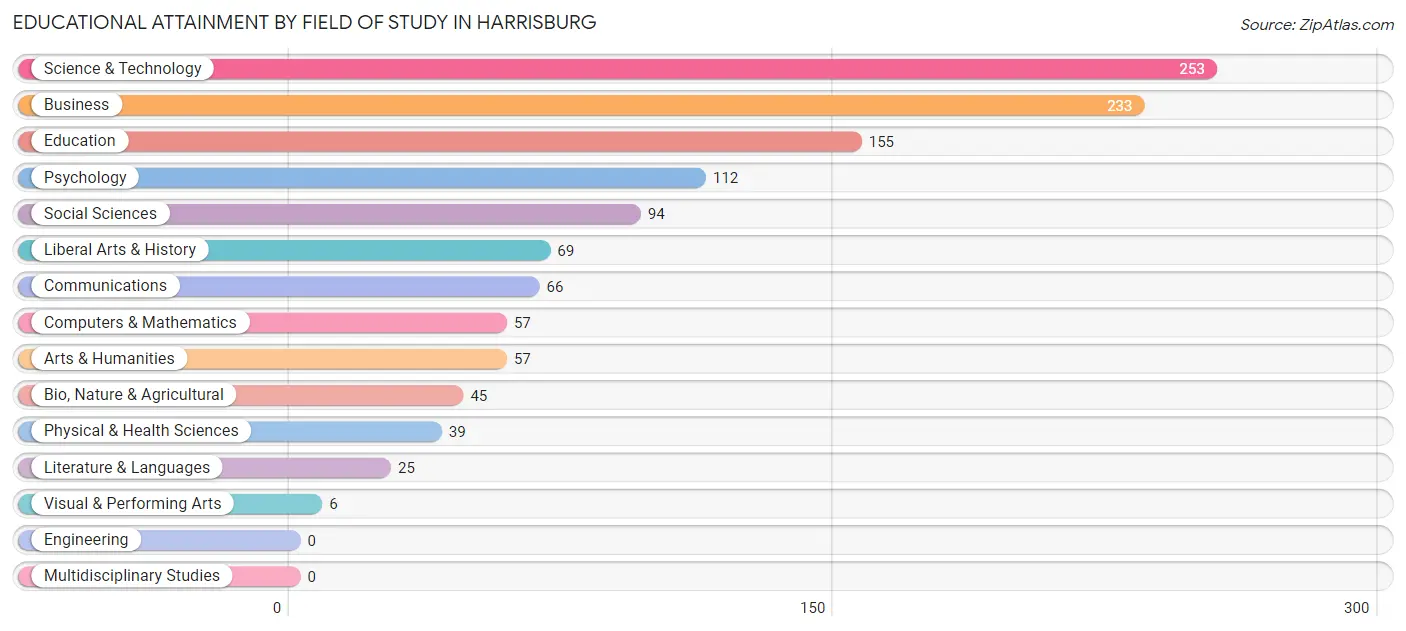
| Field of Study | # Graduates | % Graduates |
| Computers & Mathematics | 57 | 4.7% |
| Bio, Nature & Agricultural | 45 | 3.7% |
| Physical & Health Sciences | 39 | 3.2% |
| Psychology | 112 | 9.2% |
| Social Sciences | 94 | 7.8% |
| Engineering | 0 | 0.0% |
| Multidisciplinary Studies | 0 | 0.0% |
| Science & Technology | 253 | 20.9% |
| Business | 233 | 19.2% |
| Education | 155 | 12.8% |
| Literature & Languages | 25 | 2.1% |
| Liberal Arts & History | 69 | 5.7% |
| Visual & Performing Arts | 6 | 0.5% |
| Communications | 66 | 5.4% |
| Arts & Humanities | 57 | 4.7% |
| Total | 1,211 | 100.0% |
Transportation & Commute in Harrisburg
Vehicle Availability by Sex in Harrisburg
The most prevalent vehicle ownership categories in Harrisburg are males with 2 vehicles (836, accounting for 54.2%) and females with 2 vehicles (898, making up 45.3%).
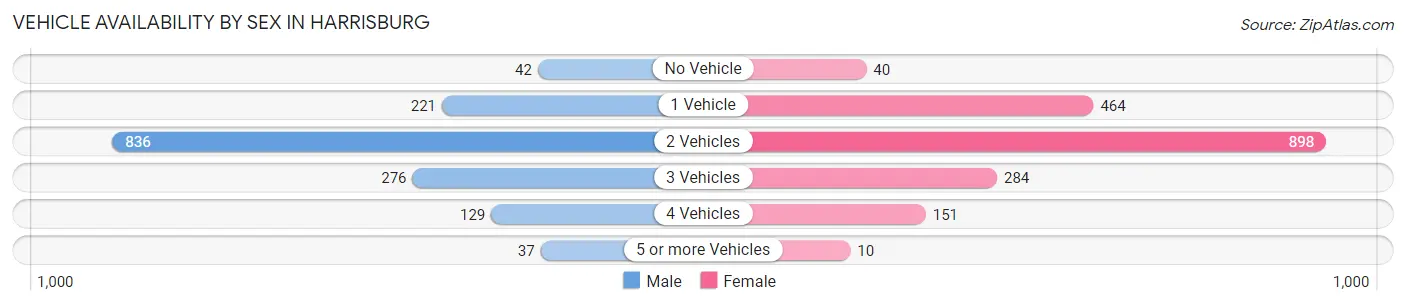
| Vehicles Available | Male | Female |
| No Vehicle | 42 (2.7%) | 40 (2.2%) |
| 1 Vehicle | 221 (14.3%) | 464 (25.1%) |
| 2 Vehicles | 836 (54.2%) | 898 (48.6%) |
| 3 Vehicles | 276 (17.9%) | 284 (15.4%) |
| 4 Vehicles | 129 (8.4%) | 151 (8.2%) |
| 5 or more Vehicles | 37 (2.4%) | 10 (0.5%) |
| Total | 1,541 (100.0%) | 1,847 (100.0%) |
Commute Time in Harrisburg
The most frequently occuring commute durations in Harrisburg are 5 to 9 minutes (1,010 commuters, 31.9%), less than 5 minutes (695 commuters, 21.9%), and 10 to 14 minutes (314 commuters, 9.9%).
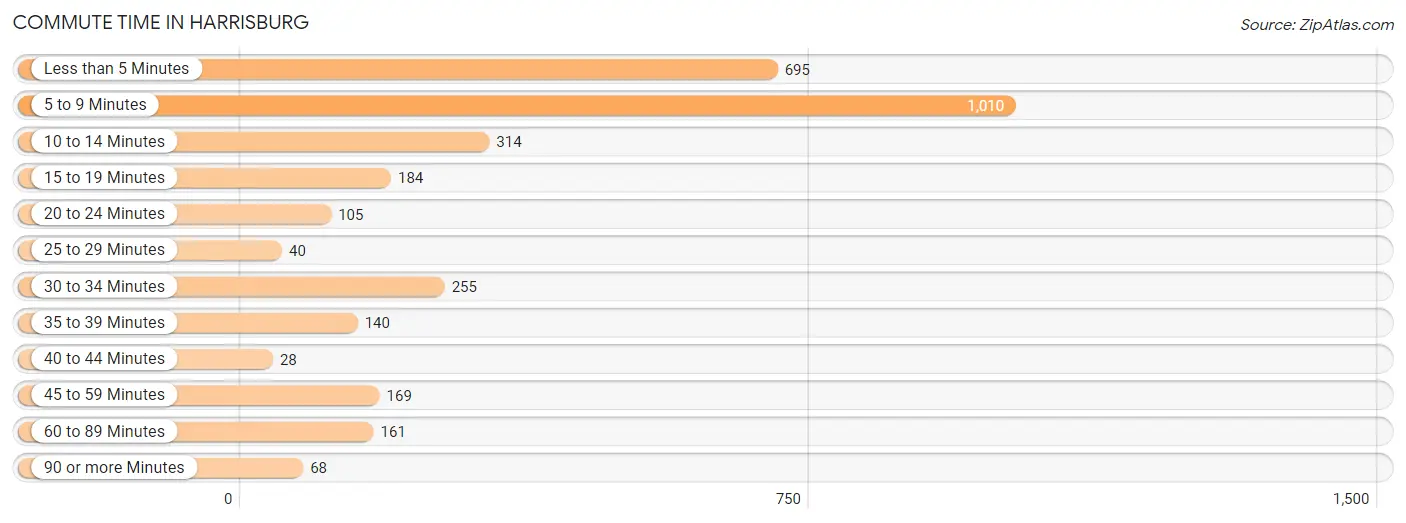
| Commute Time | # Commuters | % Commuters |
| Less than 5 Minutes | 695 | 21.9% |
| 5 to 9 Minutes | 1,010 | 31.9% |
| 10 to 14 Minutes | 314 | 9.9% |
| 15 to 19 Minutes | 184 | 5.8% |
| 20 to 24 Minutes | 105 | 3.3% |
| 25 to 29 Minutes | 40 | 1.3% |
| 30 to 34 Minutes | 255 | 8.1% |
| 35 to 39 Minutes | 140 | 4.4% |
| 40 to 44 Minutes | 28 | 0.9% |
| 45 to 59 Minutes | 169 | 5.3% |
| 60 to 89 Minutes | 161 | 5.1% |
| 90 or more Minutes | 68 | 2.1% |
Commute Time by Sex in Harrisburg
The most common commute times in Harrisburg are 5 to 9 minutes (491 commuters, 33.4%) for males and 5 to 9 minutes (519 commuters, 30.6%) for females.
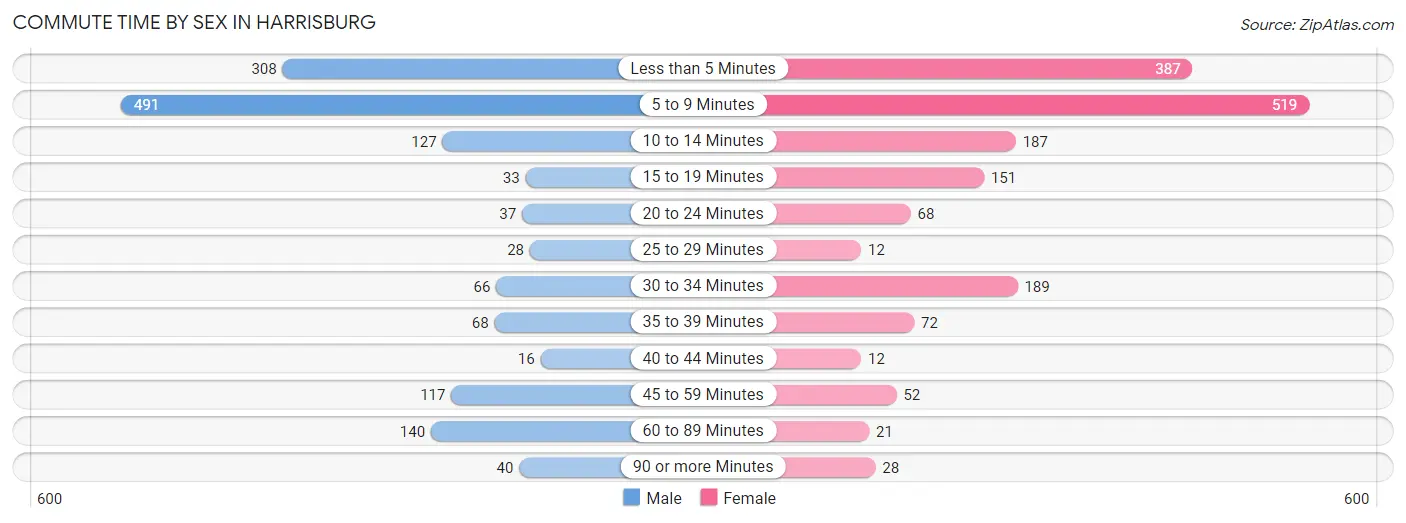
| Commute Time | Male | Female |
| Less than 5 Minutes | 308 (20.9%) | 387 (22.8%) |
| 5 to 9 Minutes | 491 (33.4%) | 519 (30.6%) |
| 10 to 14 Minutes | 127 (8.6%) | 187 (11.0%) |
| 15 to 19 Minutes | 33 (2.2%) | 151 (8.9%) |
| 20 to 24 Minutes | 37 (2.5%) | 68 (4.0%) |
| 25 to 29 Minutes | 28 (1.9%) | 12 (0.7%) |
| 30 to 34 Minutes | 66 (4.5%) | 189 (11.1%) |
| 35 to 39 Minutes | 68 (4.6%) | 72 (4.2%) |
| 40 to 44 Minutes | 16 (1.1%) | 12 (0.7%) |
| 45 to 59 Minutes | 117 (8.0%) | 52 (3.1%) |
| 60 to 89 Minutes | 140 (9.5%) | 21 (1.2%) |
| 90 or more Minutes | 40 (2.7%) | 28 (1.7%) |
Time of Departure to Work by Sex in Harrisburg
The most frequent times of departure to work in Harrisburg are 7:30 AM to 7:59 AM (309, 21.0%) for males and 7:30 AM to 7:59 AM (446, 26.3%) for females.
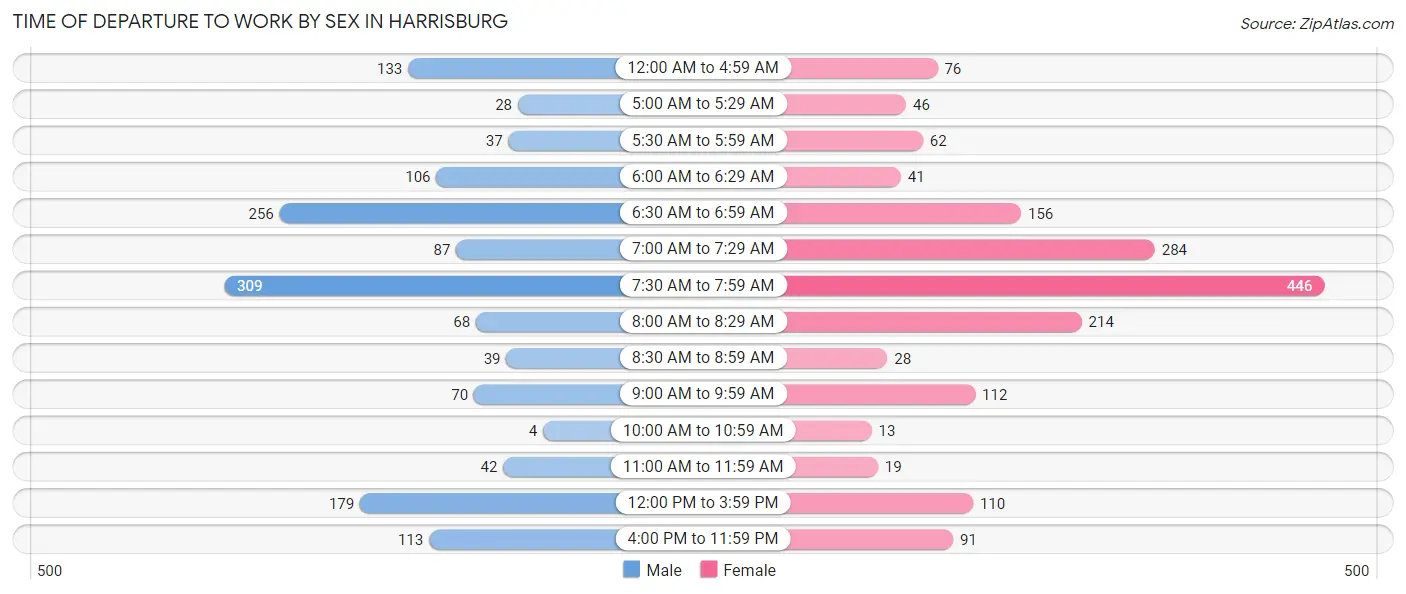
| Time of Departure | Male | Female |
| 12:00 AM to 4:59 AM | 133 (9.0%) | 76 (4.5%) |
| 5:00 AM to 5:29 AM | 28 (1.9%) | 46 (2.7%) |
| 5:30 AM to 5:59 AM | 37 (2.5%) | 62 (3.6%) |
| 6:00 AM to 6:29 AM | 106 (7.2%) | 41 (2.4%) |
| 6:30 AM to 6:59 AM | 256 (17.4%) | 156 (9.2%) |
| 7:00 AM to 7:29 AM | 87 (5.9%) | 284 (16.7%) |
| 7:30 AM to 7:59 AM | 309 (21.0%) | 446 (26.3%) |
| 8:00 AM to 8:29 AM | 68 (4.6%) | 214 (12.6%) |
| 8:30 AM to 8:59 AM | 39 (2.6%) | 28 (1.7%) |
| 9:00 AM to 9:59 AM | 70 (4.8%) | 112 (6.6%) |
| 10:00 AM to 10:59 AM | 4 (0.3%) | 13 (0.8%) |
| 11:00 AM to 11:59 AM | 42 (2.9%) | 19 (1.1%) |
| 12:00 PM to 3:59 PM | 179 (12.2%) | 110 (6.5%) |
| 4:00 PM to 11:59 PM | 113 (7.7%) | 91 (5.4%) |
| Total | 1,471 (100.0%) | 1,698 (100.0%) |
Housing Occupancy in Harrisburg
Occupancy by Ownership in Harrisburg
Of the total 3,579 dwellings in Harrisburg, owner-occupied units account for 2,218 (62.0%), while renter-occupied units make up 1,361 (38.0%).
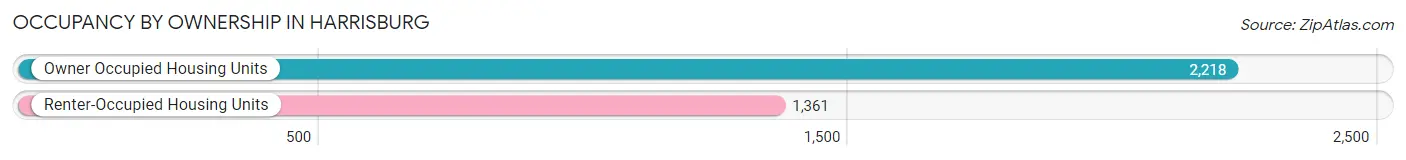
| Occupancy | # Housing Units | % Housing Units |
| Owner Occupied Housing Units | 2,218 | 62.0% |
| Renter-Occupied Housing Units | 1,361 | 38.0% |
| Total Occupied Housing Units | 3,579 | 100.0% |
Occupancy by Household Size in Harrisburg
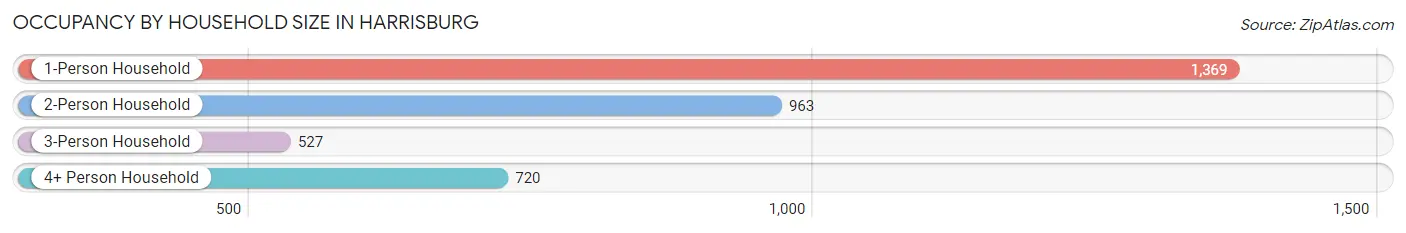
| Household Size | # Housing Units | % Housing Units |
| 1-Person Household | 1,369 | 38.3% |
| 2-Person Household | 963 | 26.9% |
| 3-Person Household | 527 | 14.7% |
| 4+ Person Household | 720 | 20.1% |
| Total Housing Units | 3,579 | 100.0% |
Occupancy by Ownership by Household Size in Harrisburg
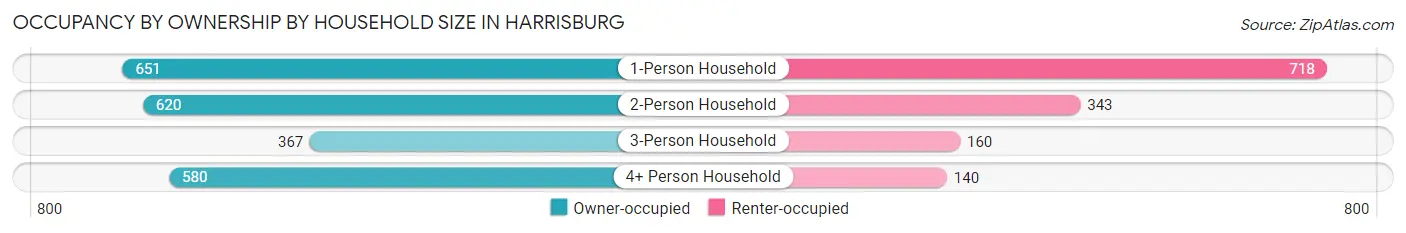
| Household Size | Owner-occupied | Renter-occupied |
| 1-Person Household | 651 (47.5%) | 718 (52.4%) |
| 2-Person Household | 620 (64.4%) | 343 (35.6%) |
| 3-Person Household | 367 (69.6%) | 160 (30.4%) |
| 4+ Person Household | 580 (80.6%) | 140 (19.4%) |
| Total Housing Units | 2,218 (62.0%) | 1,361 (38.0%) |
Occupancy by Educational Attainment in Harrisburg
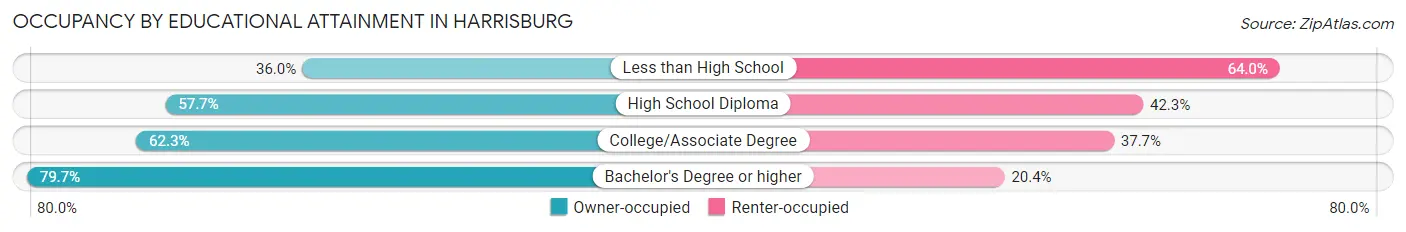
| Household Size | Owner-occupied | Renter-occupied |
| Less than High School | 149 (36.0%) | 265 (64.0%) |
| High School Diploma | 519 (57.7%) | 381 (42.3%) |
| College/Associate Degree | 912 (62.3%) | 552 (37.7%) |
| Bachelor's Degree or higher | 638 (79.6%) | 163 (20.3%) |
Occupancy by Age of Householder in Harrisburg
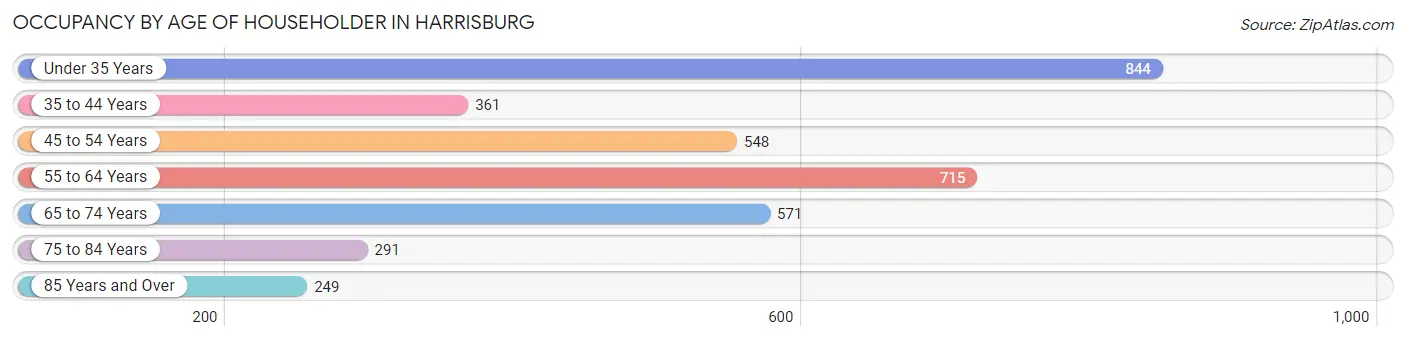
| Age Bracket | # Households | % Households |
| Under 35 Years | 844 | 23.6% |
| 35 to 44 Years | 361 | 10.1% |
| 45 to 54 Years | 548 | 15.3% |
| 55 to 64 Years | 715 | 20.0% |
| 65 to 74 Years | 571 | 16.0% |
| 75 to 84 Years | 291 | 8.1% |
| 85 Years and Over | 249 | 7.0% |
| Total | 3,579 | 100.0% |
Housing Finances in Harrisburg
Median Income by Occupancy in Harrisburg
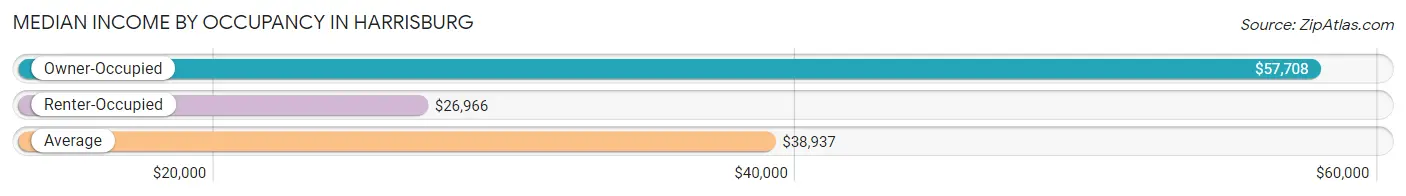
| Occupancy Type | # Households | Median Income |
| Owner-Occupied | 2,218 (62.0%) | $57,708 |
| Renter-Occupied | 1,361 (38.0%) | $26,966 |
| Average | 3,579 (100.0%) | $38,937 |
Occupancy by Householder Income Bracket in Harrisburg
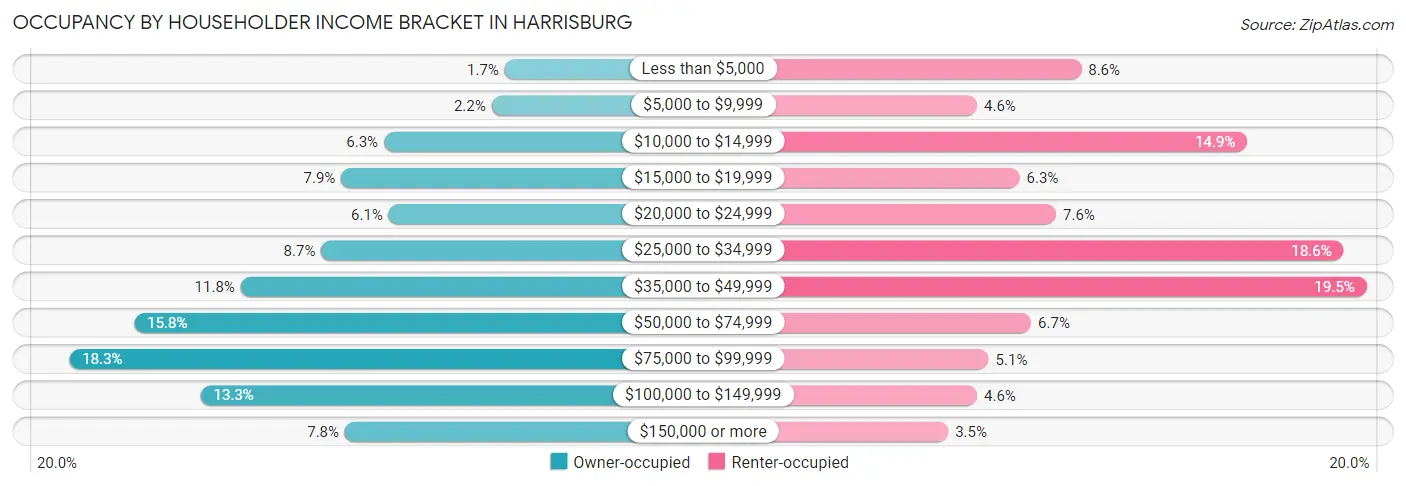
| Income Bracket | Owner-occupied | Renter-occupied |
| Less than $5,000 | 38 (1.7%) | 117 (8.6%) |
| $5,000 to $9,999 | 49 (2.2%) | 63 (4.6%) |
| $10,000 to $14,999 | 140 (6.3%) | 203 (14.9%) |
| $15,000 to $19,999 | 176 (7.9%) | 85 (6.2%) |
| $20,000 to $24,999 | 136 (6.1%) | 104 (7.6%) |
| $25,000 to $34,999 | 193 (8.7%) | 253 (18.6%) |
| $35,000 to $49,999 | 261 (11.8%) | 265 (19.5%) |
| $50,000 to $74,999 | 351 (15.8%) | 91 (6.7%) |
| $75,000 to $99,999 | 406 (18.3%) | 69 (5.1%) |
| $100,000 to $149,999 | 295 (13.3%) | 63 (4.6%) |
| $150,000 or more | 173 (7.8%) | 48 (3.5%) |
| Total | 2,218 (100.0%) | 1,361 (100.0%) |
Monthly Housing Cost Tiers in Harrisburg
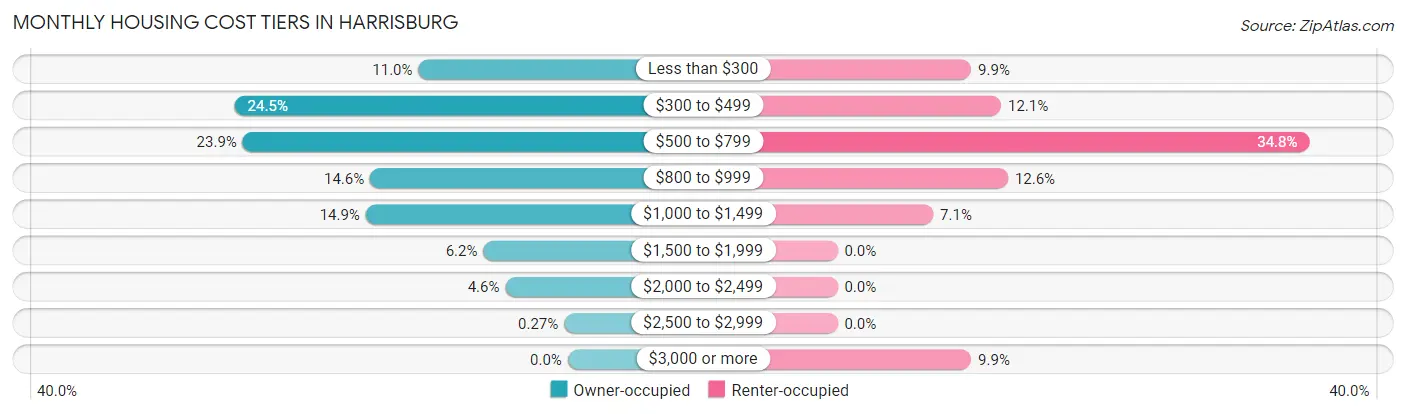
| Monthly Cost | Owner-occupied | Renter-occupied |
| Less than $300 | 244 (11.0%) | 134 (9.9%) |
| $300 to $499 | 544 (24.5%) | 164 (12.0%) |
| $500 to $799 | 531 (23.9%) | 473 (34.7%) |
| $800 to $999 | 323 (14.6%) | 171 (12.6%) |
| $1,000 to $1,499 | 330 (14.9%) | 96 (7.0%) |
| $1,500 to $1,999 | 138 (6.2%) | 0 (0.0%) |
| $2,000 to $2,499 | 102 (4.6%) | 0 (0.0%) |
| $2,500 to $2,999 | 6 (0.3%) | 0 (0.0%) |
| $3,000 or more | 0 (0.0%) | 134 (9.9%) |
| Total | 2,218 (100.0%) | 1,361 (100.0%) |
Physical Housing Characteristics in Harrisburg
Housing Structures in Harrisburg
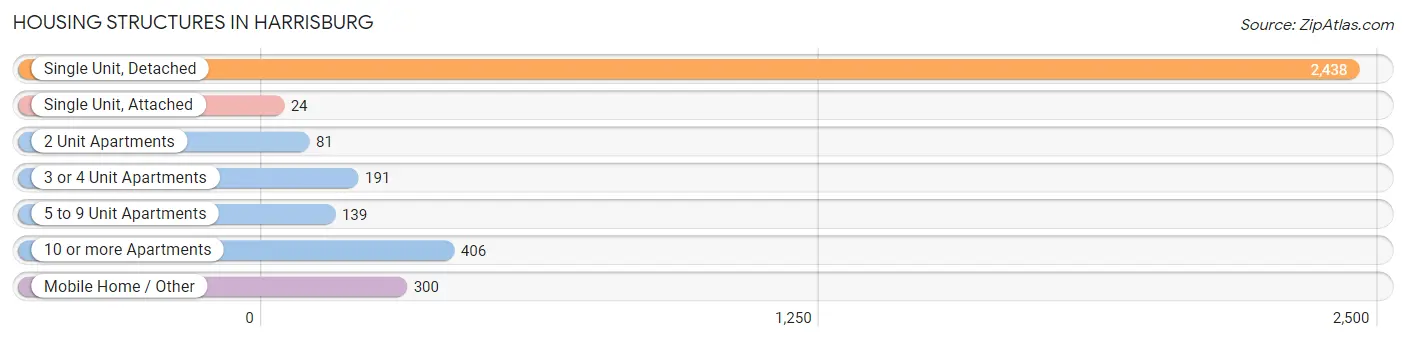
| Structure Type | # Housing Units | % Housing Units |
| Single Unit, Detached | 2,438 | 68.1% |
| Single Unit, Attached | 24 | 0.7% |
| 2 Unit Apartments | 81 | 2.3% |
| 3 or 4 Unit Apartments | 191 | 5.3% |
| 5 to 9 Unit Apartments | 139 | 3.9% |
| 10 or more Apartments | 406 | 11.3% |
| Mobile Home / Other | 300 | 8.4% |
| Total | 3,579 | 100.0% |
Housing Structures by Occupancy in Harrisburg
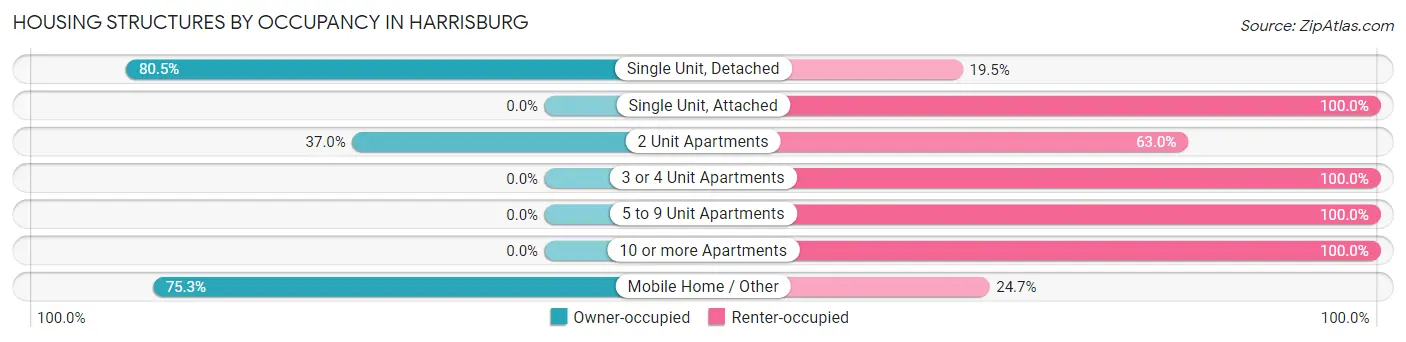
| Structure Type | Owner-occupied | Renter-occupied |
| Single Unit, Detached | 1,962 (80.5%) | 476 (19.5%) |
| Single Unit, Attached | 0 (0.0%) | 24 (100.0%) |
| 2 Unit Apartments | 30 (37.0%) | 51 (63.0%) |
| 3 or 4 Unit Apartments | 0 (0.0%) | 191 (100.0%) |
| 5 to 9 Unit Apartments | 0 (0.0%) | 139 (100.0%) |
| 10 or more Apartments | 0 (0.0%) | 406 (100.0%) |
| Mobile Home / Other | 226 (75.3%) | 74 (24.7%) |
| Total | 2,218 (62.0%) | 1,361 (38.0%) |
Housing Structures by Number of Rooms in Harrisburg
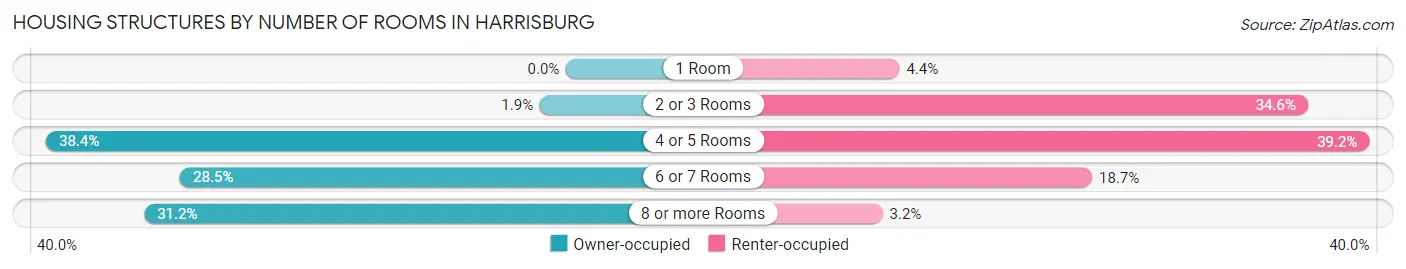
| Number of Rooms | Owner-occupied | Renter-occupied |
| 1 Room | 0 (0.0%) | 60 (4.4%) |
| 2 or 3 Rooms | 43 (1.9%) | 471 (34.6%) |
| 4 or 5 Rooms | 852 (38.4%) | 533 (39.2%) |
| 6 or 7 Rooms | 632 (28.5%) | 254 (18.7%) |
| 8 or more Rooms | 691 (31.1%) | 43 (3.2%) |
| Total | 2,218 (100.0%) | 1,361 (100.0%) |
Housing Structure by Heating Type in Harrisburg
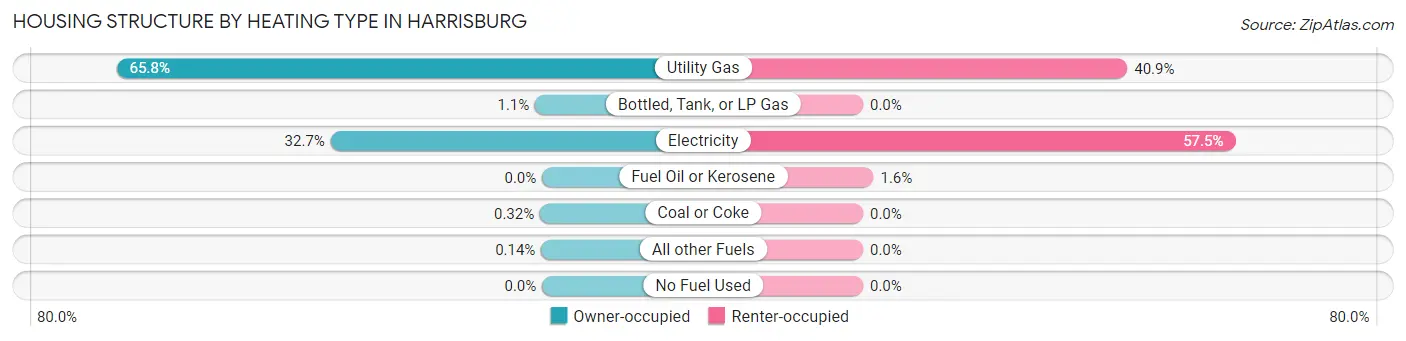
| Heating Type | Owner-occupied | Renter-occupied |
| Utility Gas | 1,459 (65.8%) | 556 (40.8%) |
| Bottled, Tank, or LP Gas | 24 (1.1%) | 0 (0.0%) |
| Electricity | 725 (32.7%) | 783 (57.5%) |
| Fuel Oil or Kerosene | 0 (0.0%) | 22 (1.6%) |
| Coal or Coke | 7 (0.3%) | 0 (0.0%) |
| All other Fuels | 3 (0.1%) | 0 (0.0%) |
| No Fuel Used | 0 (0.0%) | 0 (0.0%) |
| Total | 2,218 (100.0%) | 1,361 (100.0%) |
Household Vehicle Usage in Harrisburg
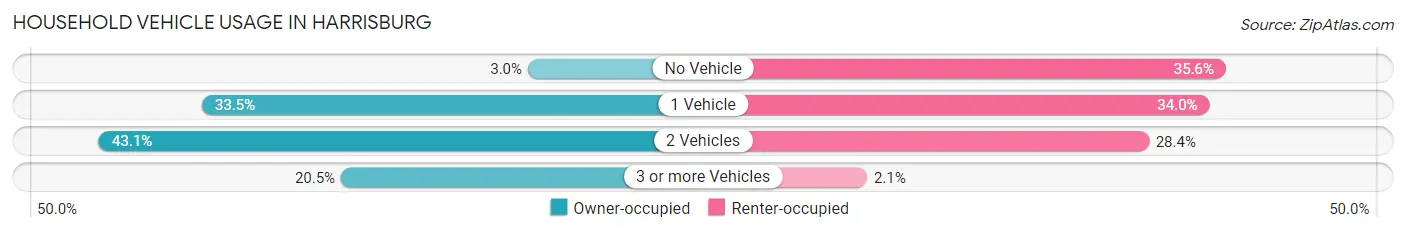
| Vehicles per Household | Owner-occupied | Renter-occupied |
| No Vehicle | 67 (3.0%) | 484 (35.6%) |
| 1 Vehicle | 742 (33.5%) | 463 (34.0%) |
| 2 Vehicles | 955 (43.1%) | 386 (28.4%) |
| 3 or more Vehicles | 454 (20.5%) | 28 (2.1%) |
| Total | 2,218 (100.0%) | 1,361 (100.0%) |
Real Estate & Mortgages in Harrisburg
Real Estate and Mortgage Overview in Harrisburg
| Characteristic | Without Mortgage | With Mortgage |
| Housing Units | 1,135 | 1,083 |
| Median Property Value | $65,400 | $97,700 |
| Median Household Income | $45,694 | $128 |
| Monthly Housing Costs | $393 | $0 |
| Real Estate Taxes | $833 | $42 |
Property Value by Mortgage Status in Harrisburg
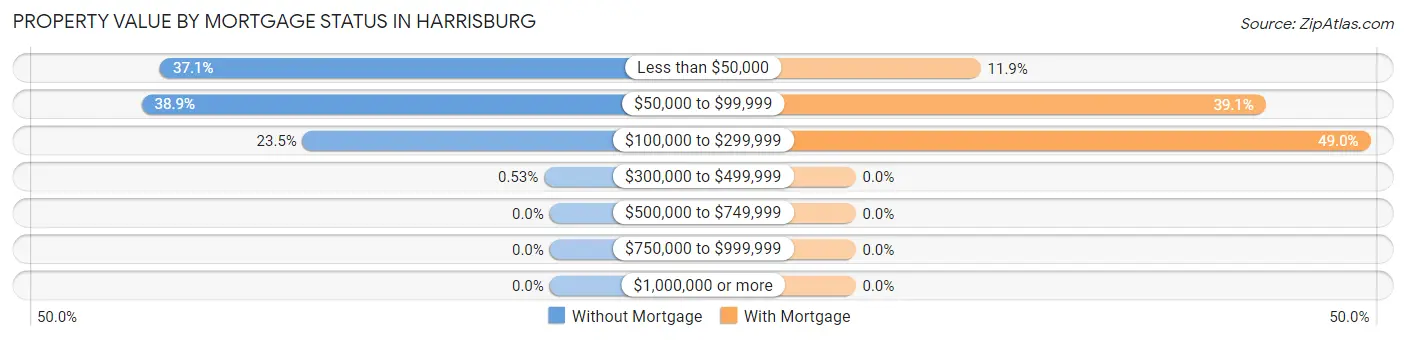
| Property Value | Without Mortgage | With Mortgage |
| Less than $50,000 | 421 (37.1%) | 129 (11.9%) |
| $50,000 to $99,999 | 441 (38.9%) | 423 (39.1%) |
| $100,000 to $299,999 | 267 (23.5%) | 531 (49.0%) |
| $300,000 to $499,999 | 6 (0.5%) | 0 (0.0%) |
| $500,000 to $749,999 | 0 (0.0%) | 0 (0.0%) |
| $750,000 to $999,999 | 0 (0.0%) | 0 (0.0%) |
| $1,000,000 or more | 0 (0.0%) | 0 (0.0%) |
| Total | 1,135 (100.0%) | 1,083 (100.0%) |
Household Income by Mortgage Status in Harrisburg
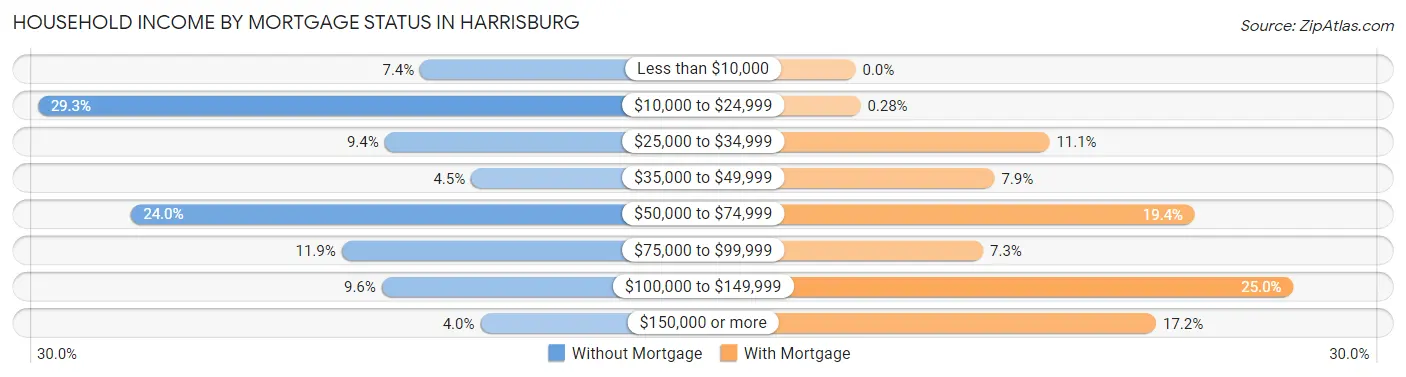
| Household Income | Without Mortgage | With Mortgage |
| Less than $10,000 | 84 (7.4%) | 0 (0.0%) |
| $10,000 to $24,999 | 332 (29.2%) | 3 (0.3%) |
| $25,000 to $34,999 | 107 (9.4%) | 120 (11.1%) |
| $35,000 to $49,999 | 51 (4.5%) | 86 (7.9%) |
| $50,000 to $74,999 | 272 (24.0%) | 210 (19.4%) |
| $75,000 to $99,999 | 135 (11.9%) | 79 (7.3%) |
| $100,000 to $149,999 | 109 (9.6%) | 271 (25.0%) |
| $150,000 or more | 45 (4.0%) | 186 (17.2%) |
| Total | 1,135 (100.0%) | 1,083 (100.0%) |
Property Value to Household Income Ratio in Harrisburg
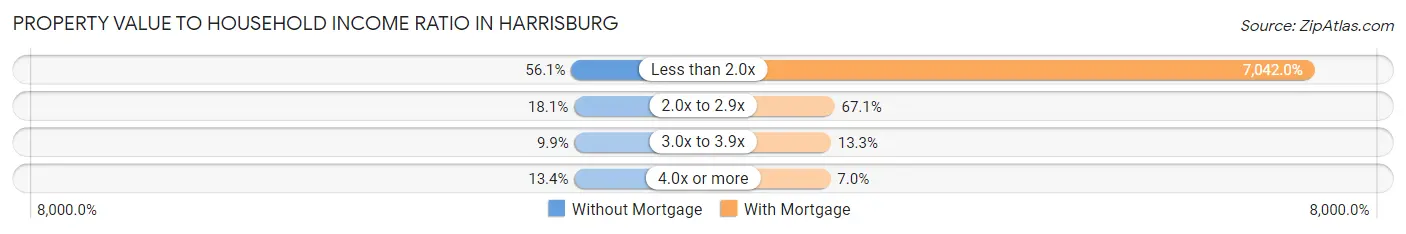
| Value-to-Income Ratio | Without Mortgage | With Mortgage |
| Less than 2.0x | 637 (56.1%) | 76,265 (7,042.0%) |
| 2.0x to 2.9x | 205 (18.1%) | 727 (67.1%) |
| 3.0x to 3.9x | 112 (9.9%) | 144 (13.3%) |
| 4.0x or more | 152 (13.4%) | 76 (7.0%) |
| Total | 1,135 (100.0%) | 1,083 (100.0%) |
Real Estate Taxes by Mortgage Status in Harrisburg
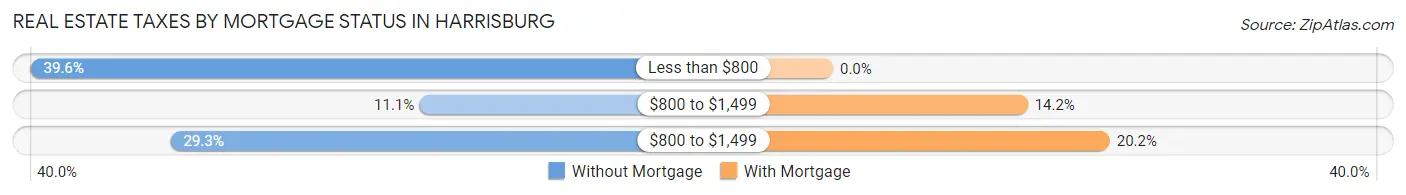
| Property Taxes | Without Mortgage | With Mortgage |
| Less than $800 | 449 (39.6%) | 0 (0.0%) |
| $800 to $1,499 | 126 (11.1%) | 154 (14.2%) |
| $800 to $1,499 | 333 (29.3%) | 219 (20.2%) |
| Total | 1,135 (100.0%) | 1,083 (100.0%) |
Health & Disability in Harrisburg
Health Insurance Coverage by Age in Harrisburg
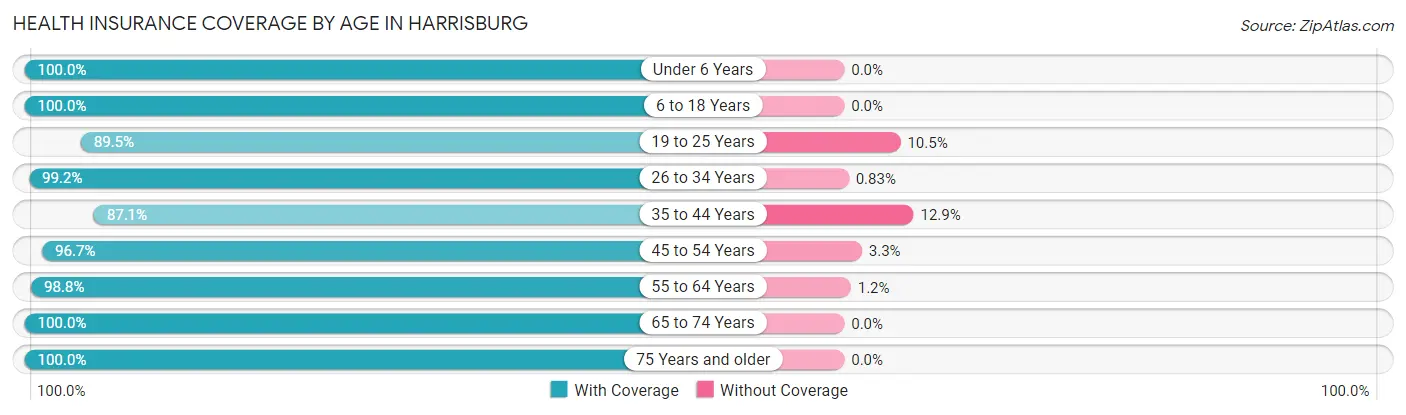
| Age Bracket | With Coverage | Without Coverage |
| Under 6 Years | 870 (100.0%) | 0 (0.0%) |
| 6 to 18 Years | 1,118 (100.0%) | 0 (0.0%) |
| 19 to 25 Years | 504 (89.5%) | 59 (10.5%) |
| 26 to 34 Years | 1,309 (99.2%) | 11 (0.8%) |
| 35 to 44 Years | 600 (87.1%) | 89 (12.9%) |
| 45 to 54 Years | 914 (96.7%) | 31 (3.3%) |
| 55 to 64 Years | 1,062 (98.8%) | 13 (1.2%) |
| 65 to 74 Years | 841 (100.0%) | 0 (0.0%) |
| 75 Years and older | 641 (100.0%) | 0 (0.0%) |
| Total | 7,859 (97.5%) | 203 (2.5%) |
Health Insurance Coverage by Citizenship Status in Harrisburg
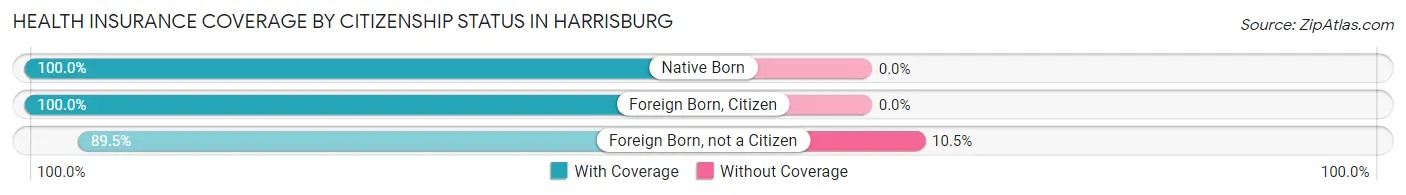
| Citizenship Status | With Coverage | Without Coverage |
| Native Born | 870 (100.0%) | 0 (0.0%) |
| Foreign Born, Citizen | 1,118 (100.0%) | 0 (0.0%) |
| Foreign Born, not a Citizen | 504 (89.5%) | 59 (10.5%) |
Health Insurance Coverage by Household Income in Harrisburg
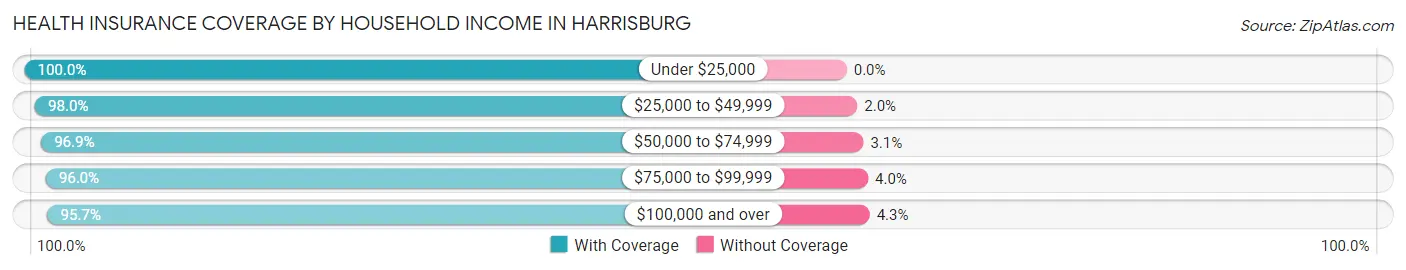
| Household Income | With Coverage | Without Coverage |
| Under $25,000 | 1,843 (100.0%) | 0 (0.0%) |
| $25,000 to $49,999 | 1,927 (98.0%) | 39 (2.0%) |
| $50,000 to $74,999 | 1,147 (96.9%) | 37 (3.1%) |
| $75,000 to $99,999 | 1,301 (96.0%) | 54 (4.0%) |
| $100,000 and over | 1,623 (95.7%) | 73 (4.3%) |
Public vs Private Health Insurance Coverage by Age in Harrisburg
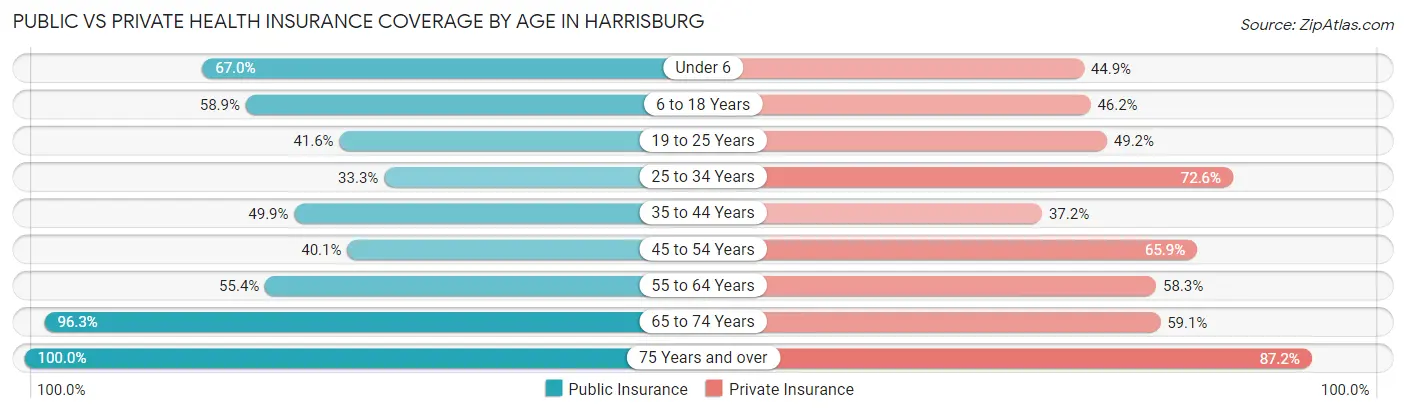
| Age Bracket | Public Insurance | Private Insurance |
| Under 6 | 583 (67.0%) | 391 (44.9%) |
| 6 to 18 Years | 659 (58.9%) | 516 (46.2%) |
| 19 to 25 Years | 234 (41.6%) | 277 (49.2%) |
| 25 to 34 Years | 439 (33.3%) | 958 (72.6%) |
| 35 to 44 Years | 344 (49.9%) | 256 (37.2%) |
| 45 to 54 Years | 379 (40.1%) | 623 (65.9%) |
| 55 to 64 Years | 595 (55.3%) | 627 (58.3%) |
| 65 to 74 Years | 810 (96.3%) | 497 (59.1%) |
| 75 Years and over | 641 (100.0%) | 559 (87.2%) |
| Total | 4,684 (58.1%) | 4,704 (58.4%) |
Disability Status by Sex by Age in Harrisburg
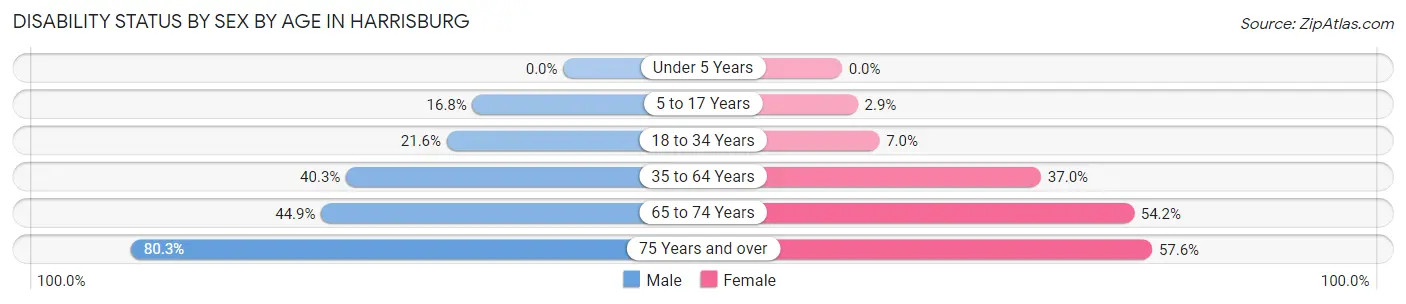
| Age Bracket | Male | Female |
| Under 5 Years | 0 (0.0%) | 0 (0.0%) |
| 5 to 17 Years | 96 (16.8%) | 19 (2.9%) |
| 18 to 34 Years | 190 (21.6%) | 73 (7.0%) |
| 35 to 64 Years | 514 (40.3%) | 530 (37.0%) |
| 65 to 74 Years | 164 (44.9%) | 258 (54.2%) |
| 75 Years and over | 244 (80.3%) | 194 (57.6%) |
Disability Class by Sex by Age in Harrisburg
Disability Class: Hearing Difficulty
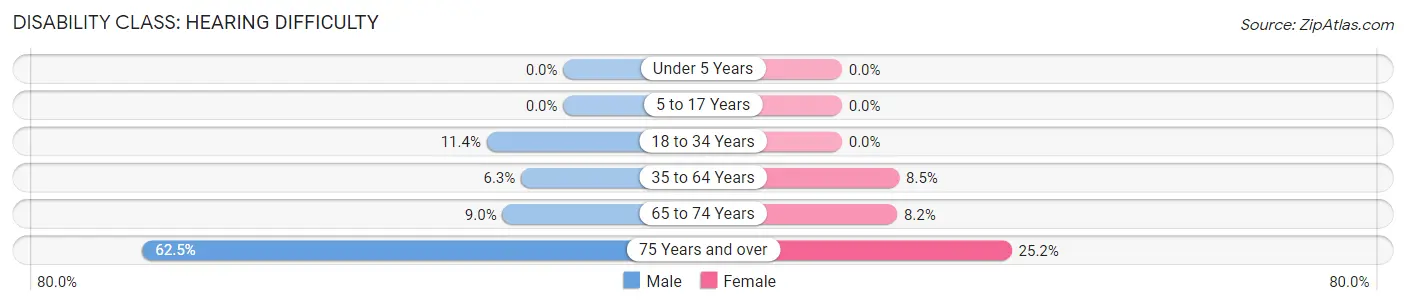
| Age Bracket | Male | Female |
| Under 5 Years | 0 (0.0%) | 0 (0.0%) |
| 5 to 17 Years | 0 (0.0%) | 0 (0.0%) |
| 18 to 34 Years | 100 (11.4%) | 0 (0.0%) |
| 35 to 64 Years | 80 (6.3%) | 122 (8.5%) |
| 65 to 74 Years | 33 (9.0%) | 39 (8.2%) |
| 75 Years and over | 190 (62.5%) | 85 (25.2%) |
Disability Class: Vision Difficulty
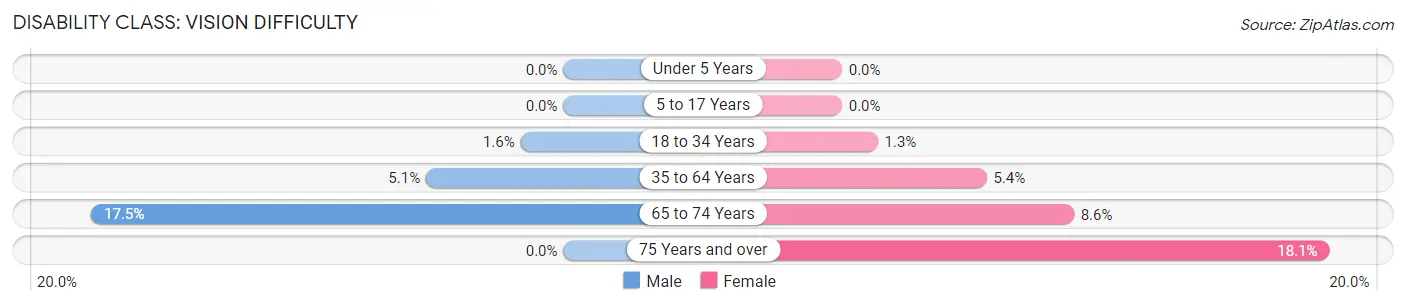
| Age Bracket | Male | Female |
| Under 5 Years | 0 (0.0%) | 0 (0.0%) |
| 5 to 17 Years | 0 (0.0%) | 0 (0.0%) |
| 18 to 34 Years | 14 (1.6%) | 14 (1.3%) |
| 35 to 64 Years | 65 (5.1%) | 77 (5.4%) |
| 65 to 74 Years | 64 (17.5%) | 41 (8.6%) |
| 75 Years and over | 0 (0.0%) | 61 (18.1%) |
Disability Class: Cognitive Difficulty
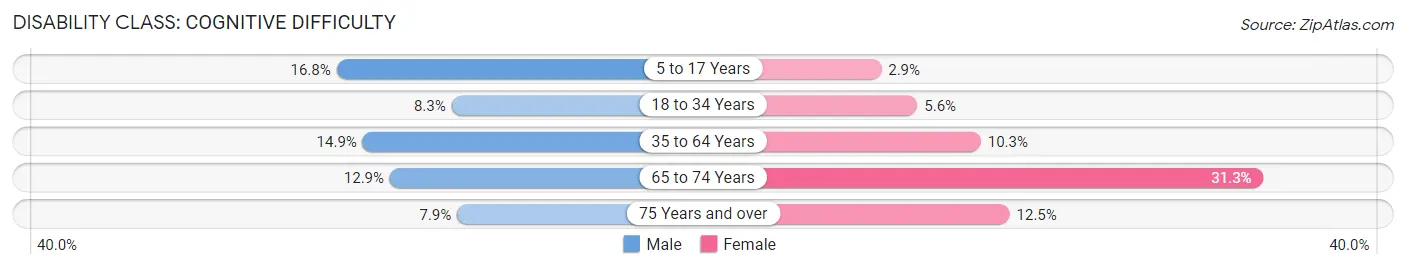
| Age Bracket | Male | Female |
| 5 to 17 Years | 96 (16.8%) | 19 (2.9%) |
| 18 to 34 Years | 73 (8.3%) | 59 (5.6%) |
| 35 to 64 Years | 190 (14.9%) | 148 (10.3%) |
| 65 to 74 Years | 47 (12.9%) | 149 (31.3%) |
| 75 Years and over | 24 (7.9%) | 42 (12.5%) |
Disability Class: Ambulatory Difficulty
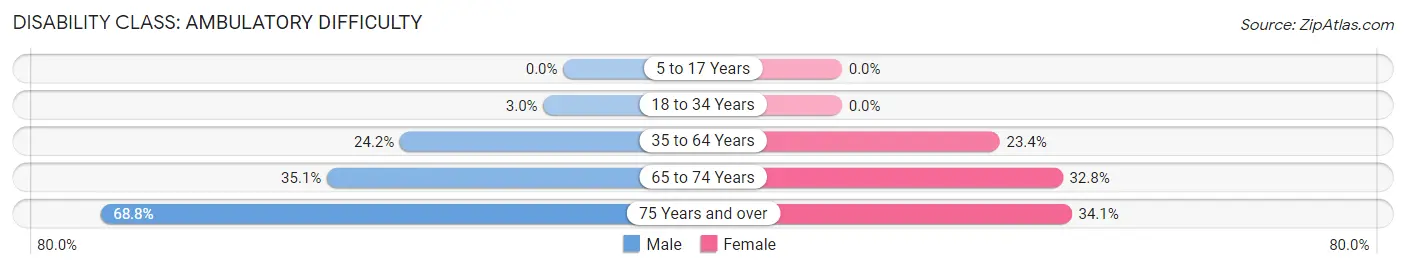
| Age Bracket | Male | Female |
| 5 to 17 Years | 0 (0.0%) | 0 (0.0%) |
| 18 to 34 Years | 26 (3.0%) | 0 (0.0%) |
| 35 to 64 Years | 309 (24.2%) | 336 (23.4%) |
| 65 to 74 Years | 128 (35.1%) | 156 (32.8%) |
| 75 Years and over | 209 (68.8%) | 115 (34.1%) |
Disability Class: Self-Care Difficulty
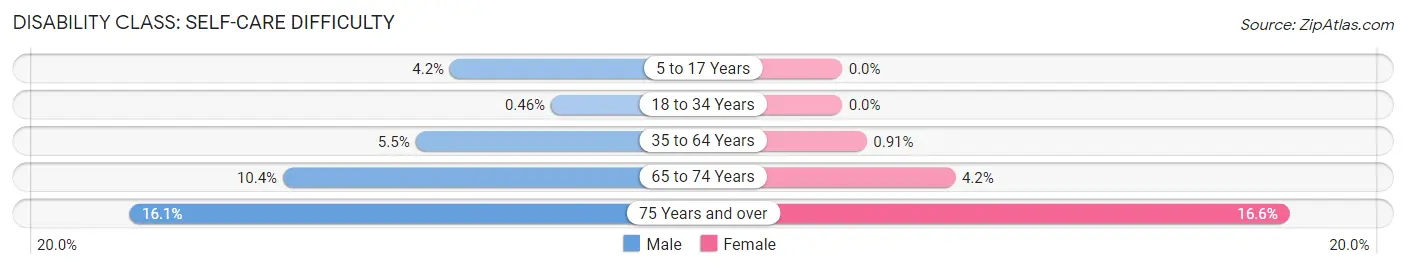
| Age Bracket | Male | Female |
| 5 to 17 Years | 24 (4.2%) | 0 (0.0%) |
| 18 to 34 Years | 4 (0.5%) | 0 (0.0%) |
| 35 to 64 Years | 70 (5.5%) | 13 (0.9%) |
| 65 to 74 Years | 38 (10.4%) | 20 (4.2%) |
| 75 Years and over | 49 (16.1%) | 56 (16.6%) |
Technology Access in Harrisburg
Computing Device Access in Harrisburg
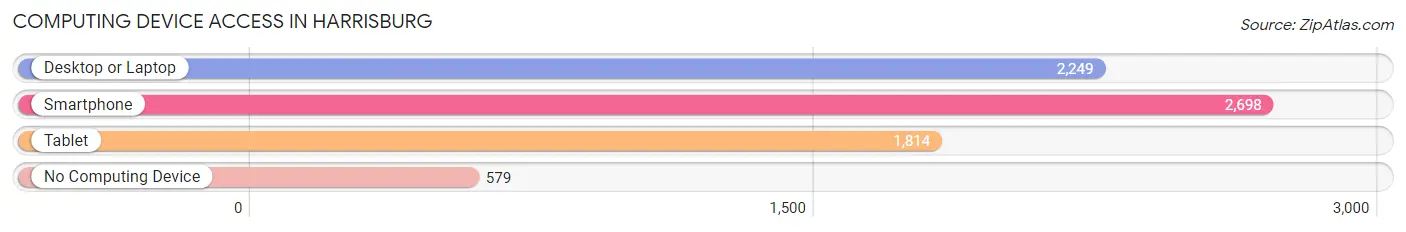
| Device Type | # Households | % Households |
| Desktop or Laptop | 2,249 | 62.8% |
| Smartphone | 2,698 | 75.4% |
| Tablet | 1,814 | 50.7% |
| No Computing Device | 579 | 16.2% |
| Total | 3,579 | 100.0% |
Internet Access in Harrisburg
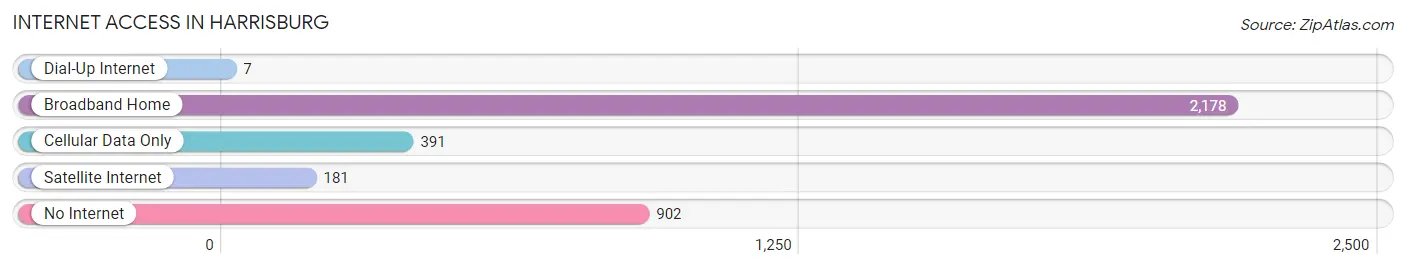
| Internet Type | # Households | % Households |
| Dial-Up Internet | 7 | 0.2% |
| Broadband Home | 2,178 | 60.9% |
| Cellular Data Only | 391 | 10.9% |
| Satellite Internet | 181 | 5.1% |
| No Internet | 902 | 25.2% |
| Total | 3,579 | 100.0% |
Harrisburg Summary
Harrisburg, Illinois is a small city located in Saline County, Illinois. It is situated on the banks of the Saline River, and is the county seat of Saline County. The city has a population of 8,743 as of the 2010 census, and is part of the Harrisburg-Raleigh-Marion Metropolitan Statistical Area.
History
The area that is now Harrisburg was first settled in 1819 by John and William Harris, who were brothers from Kentucky. The brothers established a trading post and ferry service on the Saline River, and the settlement that grew up around it was named Harrisburg. The town was officially incorporated in 1843, and the first post office was established in 1845.
In the late 19th century, Harrisburg was a major center for coal mining, and the city was home to several coal mines. The coal industry was the main source of employment for the city's residents, and the city was home to several coal-related businesses.
In the early 20th century, Harrisburg was a major center for the oil industry. The city was home to several oil refineries, and the oil industry was the main source of employment for the city's residents.
Geography
Harrisburg is located in southeastern Illinois, in Saline County. It is situated on the banks of the Saline River, and is located about 30 miles south of Carbondale and about 50 miles east of St. Louis, Missouri. The city has a total area of 4.2 square miles, all of which is land.
Economy
The economy of Harrisburg is largely based on agriculture and manufacturing. The city is home to several manufacturing companies, including a paper mill, a steel mill, and a plastics plant. The city is also home to several agricultural businesses, including a grain elevator, a feed mill, and a fertilizer plant.
The city is also home to several retail businesses, including several restaurants, a grocery store, and several clothing stores. The city is also home to several medical facilities, including a hospital and several clinics.
Demographics
As of the 2010 census, Harrisburg had a population of 8,743. The racial makeup of the city was 95.2% White, 1.2% African American, 0.3% Native American, 0.4% Asian, 0.1% Pacific Islander, 1.2% from other races, and 1.6% from two or more races. Hispanic or Latino of any race were 3.2% of the population.
The median household income in Harrisburg was $37,917, and the median family income was $45,917. The per capita income in Harrisburg was $19,845. About 11.2% of families and 14.2% of the population were below the poverty line, including 19.2% of those under age 18 and 8.2% of those age 65 or over.
Common Questions
What is Per Capita Income in Harrisburg?
Per Capita income in Harrisburg is $26,175.
What is the Median Family Income in Harrisburg?
Median Family Income in Harrisburg is $60,240.
What is the Median Household income in Harrisburg?
Median Household Income in Harrisburg is $38,937.
What is Income or Wage Gap in Harrisburg?
Income or Wage Gap in Harrisburg is 31.0%.
Women in Harrisburg earn 69.0 cents for every dollar earned by a man.
What is Family Income Deficit in Harrisburg?
Family Income Deficit in Harrisburg is $9,611.
Families that are below poverty line in Harrisburg earn $9,611 less on average than the poverty threshold level.
What is Inequality or Gini Index in Harrisburg?
Inequality or Gini Index in Harrisburg is 0.47.
What is the Total Population of Harrisburg?
Total Population of Harrisburg is 8,380.
What is the Total Male Population of Harrisburg?
Total Male Population of Harrisburg is 3,963.
What is the Total Female Population of Harrisburg?
Total Female Population of Harrisburg is 4,417.
What is the Ratio of Males per 100 Females in Harrisburg?
There are 89.72 Males per 100 Females in Harrisburg.
What is the Ratio of Females per 100 Males in Harrisburg?
There are 111.46 Females per 100 Males in Harrisburg.
What is the Median Population Age in Harrisburg?
Median Population Age in Harrisburg is 36.6 Years.
What is the Average Family Size in Harrisburg
Average Family Size in Harrisburg is 2.9 People.
What is the Average Household Size in Harrisburg
Average Household Size in Harrisburg is 2.2 People.
How Large is the Labor Force in Harrisburg?
There are 3,785 People in the Labor Forcein in Harrisburg.
What is the Percentage of People in the Labor Force in Harrisburg?
56.9% of People are in the Labor Force in Harrisburg.
What is the Unemployment Rate in Harrisburg?
Unemployment Rate in Harrisburg is 7.7%.