Winfield, IL Map & Demographics
Winfield Map
Winfield Overview
$60,931
PER CAPITA INCOME
$159,483
AVG FAMILY INCOME
$136,696
AVG HOUSEHOLD INCOME
25.1%
WAGE / INCOME GAP [ % ]
74.9¢/ $1
WAGE / INCOME GAP [ $ ]
0.38
INEQUALITY / GINI INDEX
9,947
TOTAL POPULATION
5,086
MALE POPULATION
4,861
FEMALE POPULATION
104.63
MALES / 100 FEMALES
95.58
FEMALES / 100 MALES
48.2
MEDIAN AGE
3.0
AVG FAMILY SIZE
2.5
AVG HOUSEHOLD SIZE
5,447
LABOR FORCE [ PEOPLE ]
66.6%
PERCENT IN LABOR FORCE
4.5%
UNEMPLOYMENT RATE
Winfield Zip Codes
Winfield Area Codes
Income in Winfield
Income Overview in Winfield
Per Capita Income in Winfield is $60,931, while median incomes of families and households are $159,483 and $136,696 respectively.
| Characteristic | Number | Measure |
| Per Capita Income | 9,947 | $60,931 |
| Median Family Income | 2,904 | $159,483 |
| Mean Family Income | 2,904 | $178,672 |
| Median Household Income | 3,931 | $136,696 |
| Mean Household Income | 3,931 | $154,921 |
| Income Deficit | 2,904 | $0 |
| Wage / Income Gap (%) | 9,947 | 25.07% |
| Wage / Income Gap ($) | 9,947 | 74.93¢ per $1 |
| Gini / Inequality Index | 9,947 | 0.38 |
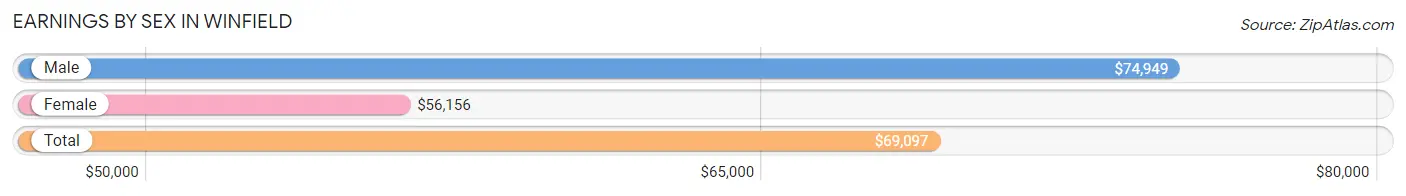
Earnings by Sex in Winfield
Average Earnings in Winfield are $69,097, $74,949 for men and $56,156 for women, a difference of 25.1%.
| Sex | Number | Average Earnings |
| Male | 3,064 (52.9%) | $74,949 |
| Female | 2,723 (47.0%) | $56,156 |
| Total | 5,787 (100.0%) | $69,097 |
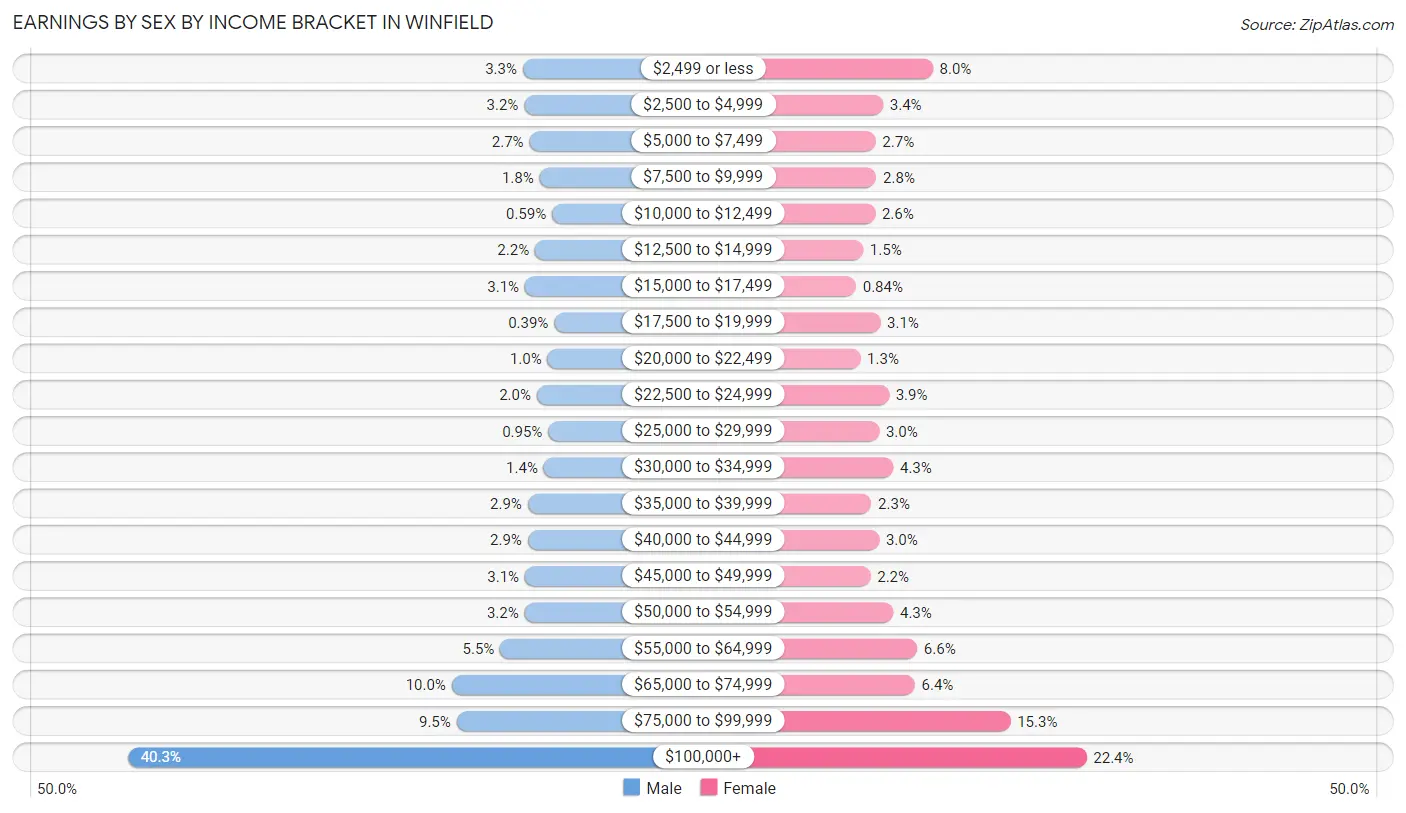
Earnings by Sex by Income Bracket in Winfield
The most common earnings brackets in Winfield are $100,000+ for men (1,236 | 40.3%) and $100,000+ for women (611 | 22.4%).
| Income | Male | Female |
| $2,499 or less | 102 (3.3%) | 219 (8.0%) |
| $2,500 to $4,999 | 98 (3.2%) | 92 (3.4%) |
| $5,000 to $7,499 | 83 (2.7%) | 73 (2.7%) |
| $7,500 to $9,999 | 54 (1.8%) | 75 (2.8%) |
| $10,000 to $12,499 | 18 (0.6%) | 72 (2.6%) |
| $12,500 to $14,999 | 67 (2.2%) | 41 (1.5%) |
| $15,000 to $17,499 | 96 (3.1%) | 23 (0.8%) |
| $17,500 to $19,999 | 12 (0.4%) | 85 (3.1%) |
| $20,000 to $22,499 | 31 (1.0%) | 34 (1.3%) |
| $22,500 to $24,999 | 62 (2.0%) | 107 (3.9%) |
| $25,000 to $29,999 | 29 (0.9%) | 82 (3.0%) |
| $30,000 to $34,999 | 42 (1.4%) | 118 (4.3%) |
| $35,000 to $39,999 | 88 (2.9%) | 62 (2.3%) |
| $40,000 to $44,999 | 88 (2.9%) | 82 (3.0%) |
| $45,000 to $49,999 | 96 (3.1%) | 60 (2.2%) |
| $50,000 to $54,999 | 97 (3.2%) | 118 (4.3%) |
| $55,000 to $64,999 | 167 (5.4%) | 179 (6.6%) |
| $65,000 to $74,999 | 306 (10.0%) | 173 (6.4%) |
| $75,000 to $99,999 | 292 (9.5%) | 417 (15.3%) |
| $100,000+ | 1,236 (40.3%) | 611 (22.4%) |
| Total | 3,064 (100.0%) | 2,723 (100.0%) |
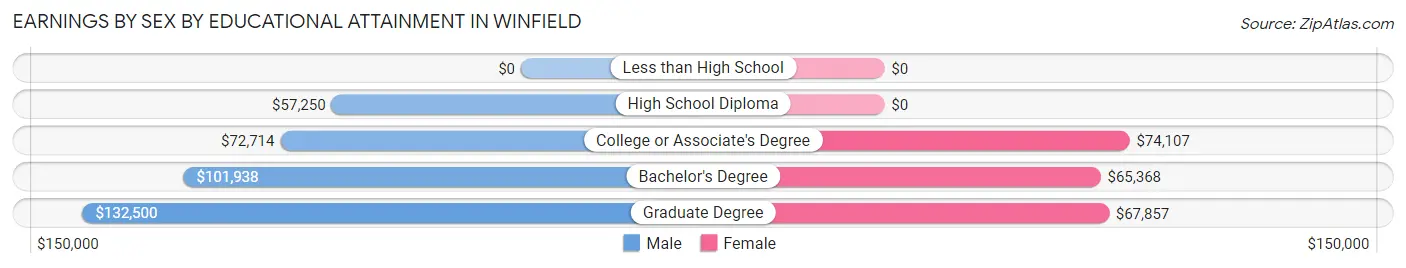
Earnings by Sex by Educational Attainment in Winfield
Average earnings in Winfield are $90,098 for men and $63,468 for women, a difference of 29.6%. Men with an educational attainment of graduate degree enjoy the highest average annual earnings of $132,500, while those with high school diploma education earn the least with $57,250. Women with an educational attainment of college or associate's degree earn the most with the average annual earnings of $74,107, while those with bachelor's degree education have the smallest earnings of $65,368.
| Educational Attainment | Male Income | Female Income |
| Less than High School | - | - |
| High School Diploma | $57,250 | $0 |
| College or Associate's Degree | $72,714 | $74,107 |
| Bachelor's Degree | $101,938 | $65,368 |
| Graduate Degree | $132,500 | $67,857 |
| Total | $90,098 | $63,468 |
Family Income in Winfield
Family Income Brackets in Winfield
According to the Winfield family income data, there are 918 families falling into the $200,000+ income range, which is the most common income bracket and makes up 31.6% of all families.
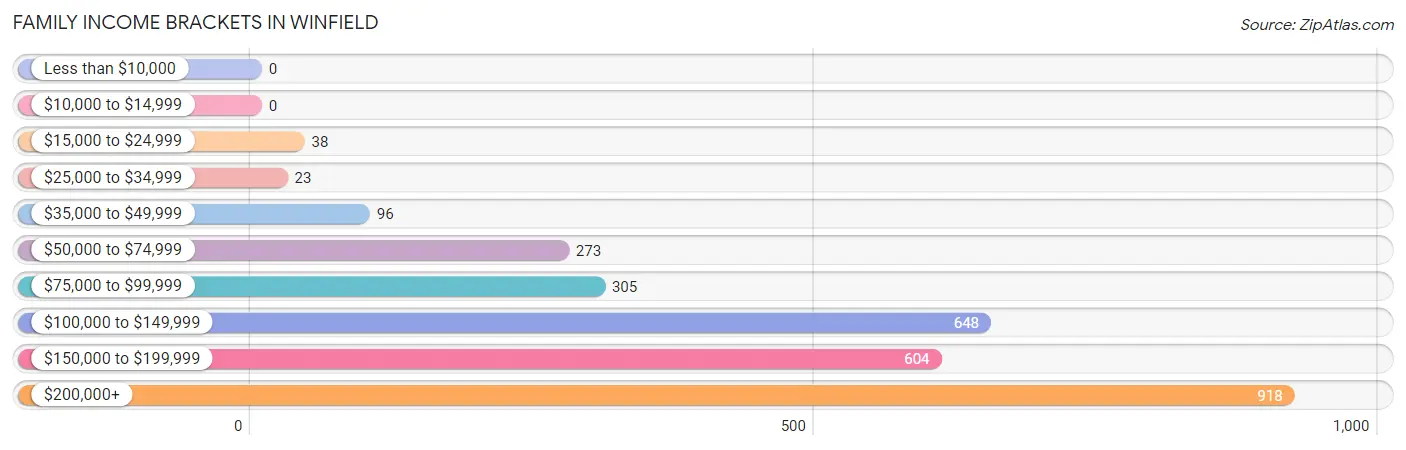
| Income Bracket | # Families | % Families |
| Less than $10,000 | 0 | 0.0% |
| $10,000 to $14,999 | 0 | 0.0% |
| $15,000 to $24,999 | 38 | 1.3% |
| $25,000 to $34,999 | 23 | 0.8% |
| $35,000 to $49,999 | 96 | 3.3% |
| $50,000 to $74,999 | 273 | 9.4% |
| $75,000 to $99,999 | 305 | 10.5% |
| $100,000 to $149,999 | 648 | 22.3% |
| $150,000 to $199,999 | 604 | 20.8% |
| $200,000+ | 918 | 31.6% |
Family Income by Famaliy Size in Winfield
5-person families (180 | 6.2%) account for the highest median family income in Winfield with $211,333 per family, while 2-person families (1,435 | 49.4%) have the highest median income of $70,645 per family member.
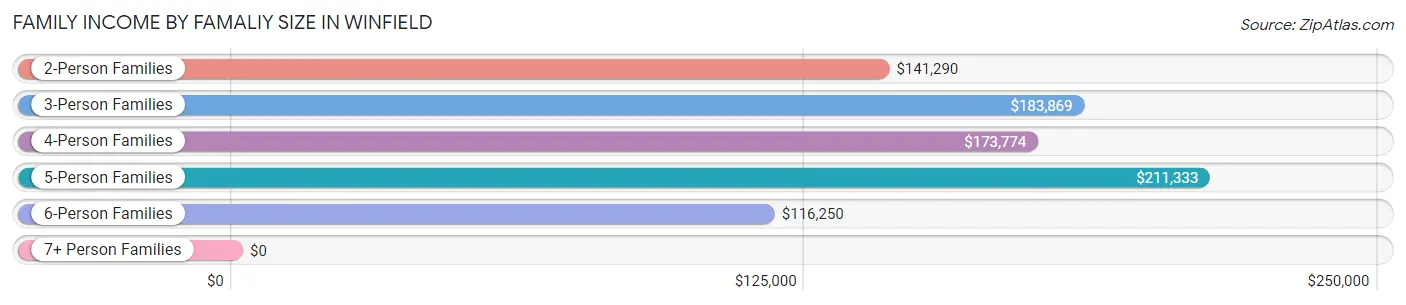
| Income Bracket | # Families | Median Income |
| 2-Person Families | 1,435 (49.4%) | $141,290 |
| 3-Person Families | 519 (17.9%) | $183,869 |
| 4-Person Families | 674 (23.2%) | $173,774 |
| 5-Person Families | 180 (6.2%) | $211,333 |
| 6-Person Families | 90 (3.1%) | $116,250 |
| 7+ Person Families | 6 (0.2%) | $0 |
| Total | 2,904 (100.0%) | $159,483 |
Family Income by Number of Earners in Winfield
The median family income in Winfield is $159,483, with families comprising 3+ earners (332) having the highest median family income of $216,250, while families with 1 earner (625) have the lowest median family income of $94,432, accounting for 11.4% and 21.5% of families, respectively.
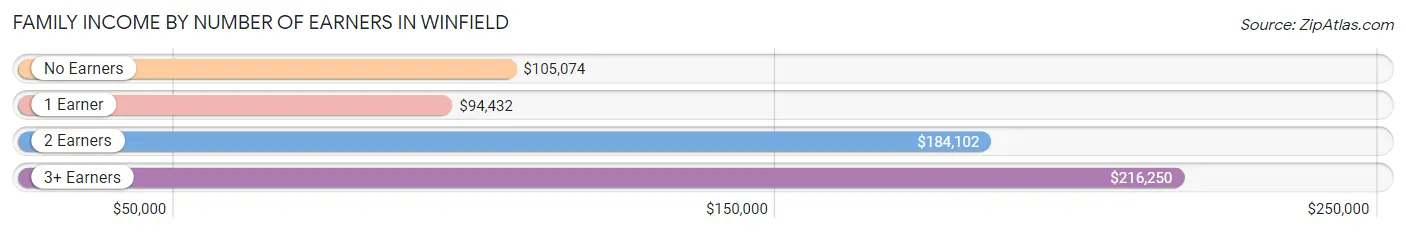
| Number of Earners | # Families | Median Income |
| No Earners | 384 (13.2%) | $105,074 |
| 1 Earner | 625 (21.5%) | $94,432 |
| 2 Earners | 1,563 (53.8%) | $184,102 |
| 3+ Earners | 332 (11.4%) | $216,250 |
| Total | 2,904 (100.0%) | $159,483 |
Household Income in Winfield
Household Income Brackets in Winfield
With 1,006 households falling in the category, the $200,000+ income range is the most frequent in Winfield, accounting for 25.6% of all households. In contrast, only 8 households (0.2%) fall into the $10,000 to $14,999 income bracket, making it the least populous group.
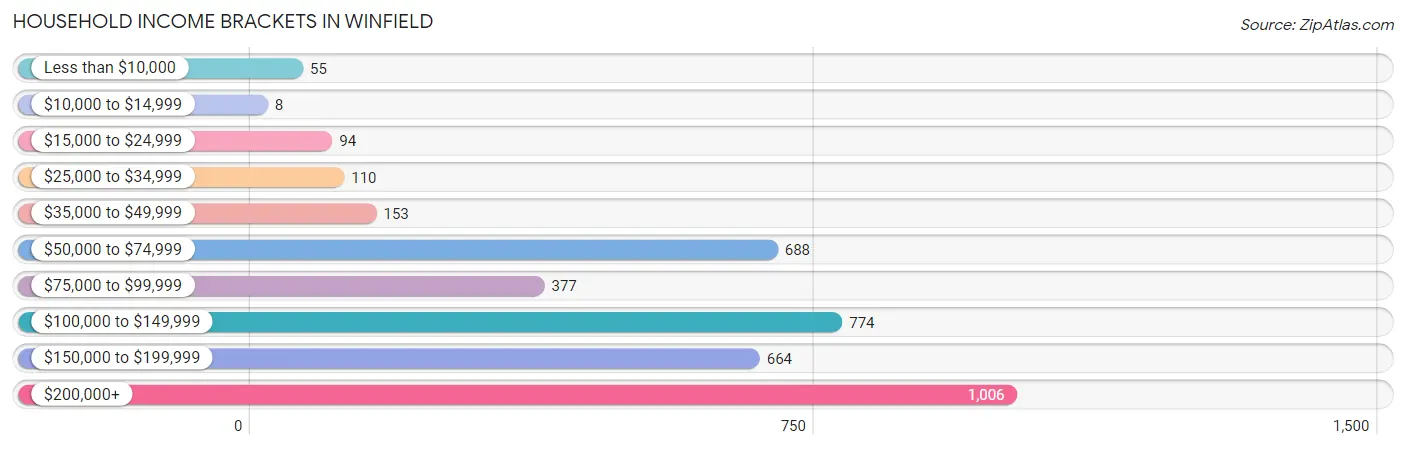
| Income Bracket | # Households | % Households |
| Less than $10,000 | 55 | 1.4% |
| $10,000 to $14,999 | 8 | 0.2% |
| $15,000 to $24,999 | 94 | 2.4% |
| $25,000 to $34,999 | 110 | 2.8% |
| $35,000 to $49,999 | 153 | 3.9% |
| $50,000 to $74,999 | 688 | 17.5% |
| $75,000 to $99,999 | 377 | 9.6% |
| $100,000 to $149,999 | 774 | 19.7% |
| $150,000 to $199,999 | 664 | 16.9% |
| $200,000+ | 1,006 | 25.6% |
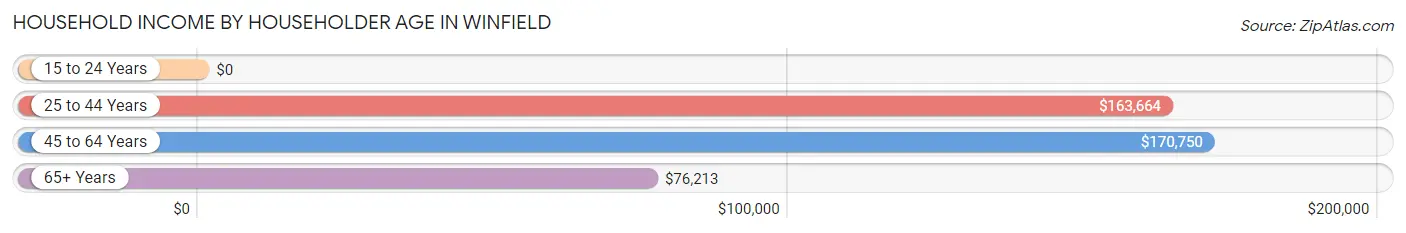
Household Income by Householder Age in Winfield
The median household income in Winfield is $136,696, with the highest median household income of $170,750 found in the 45 to 64 years age bracket for the primary householder. A total of 1,785 households (45.4%) fall into this category.
| Income Bracket | # Households | Median Income |
| 15 to 24 Years | 0 (0.0%) | $0 |
| 25 to 44 Years | 871 (22.2%) | $163,664 |
| 45 to 64 Years | 1,785 (45.4%) | $170,750 |
| 65+ Years | 1,275 (32.4%) | $76,213 |
| Total | 3,931 (100.0%) | $136,696 |
Poverty in Winfield
Income Below Poverty by Sex and Age in Winfield
With 1.2% poverty level for males and 1.7% for females among the residents of Winfield, 25 to 34 year old males and 16 and 17 year old females are the most vulnerable to poverty, with 12 males (4.2%) and 10 females (5.0%) in their respective age groups living below the poverty level.
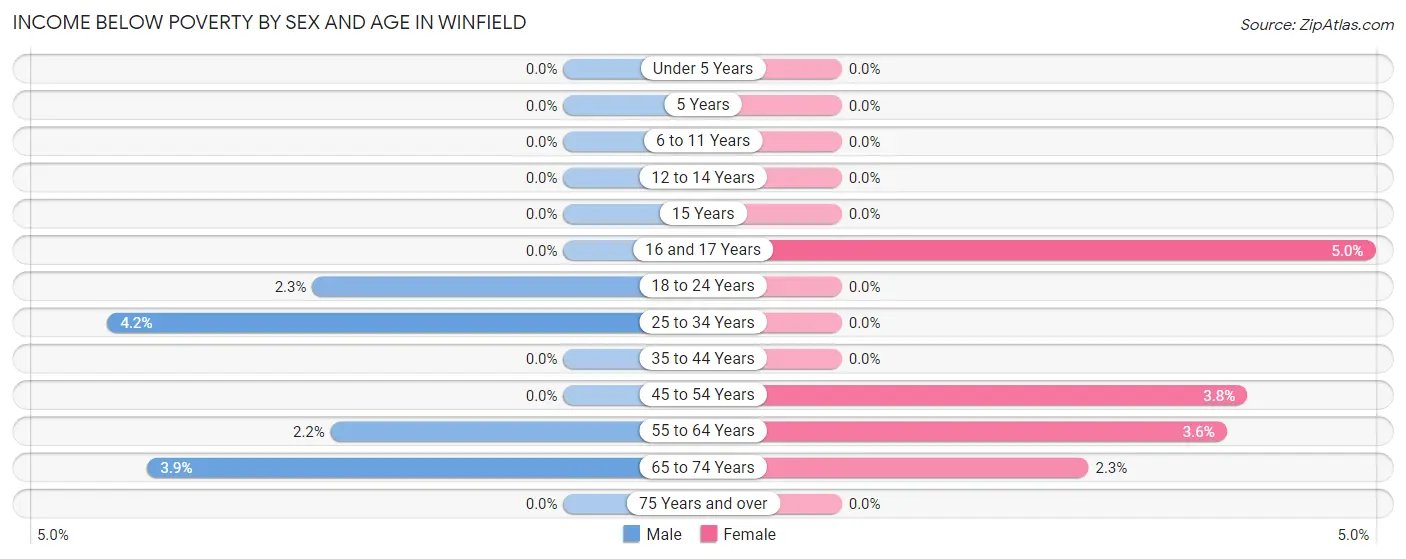
| Age Bracket | Male | Female |
| Under 5 Years | 0 (0.0%) | 0 (0.0%) |
| 5 Years | 0 (0.0%) | 0 (0.0%) |
| 6 to 11 Years | 0 (0.0%) | 0 (0.0%) |
| 12 to 14 Years | 0 (0.0%) | 0 (0.0%) |
| 15 Years | 0 (0.0%) | 0 (0.0%) |
| 16 and 17 Years | 0 (0.0%) | 10 (5.0%) |
| 18 to 24 Years | 10 (2.3%) | 0 (0.0%) |
| 25 to 34 Years | 12 (4.2%) | 0 (0.0%) |
| 35 to 44 Years | 0 (0.0%) | 0 (0.0%) |
| 45 to 54 Years | 0 (0.0%) | 31 (3.8%) |
| 55 to 64 Years | 21 (2.2%) | 27 (3.6%) |
| 65 to 74 Years | 17 (3.9%) | 16 (2.3%) |
| 75 Years and over | 0 (0.0%) | 0 (0.0%) |
| Total | 60 (1.2%) | 84 (1.7%) |
Income Above Poverty by Sex and Age in Winfield
According to the poverty statistics in Winfield, males aged under 5 years and females aged under 5 years are the age groups that are most secure financially, with 100.0% of males and 100.0% of females in these age groups living above the poverty line.
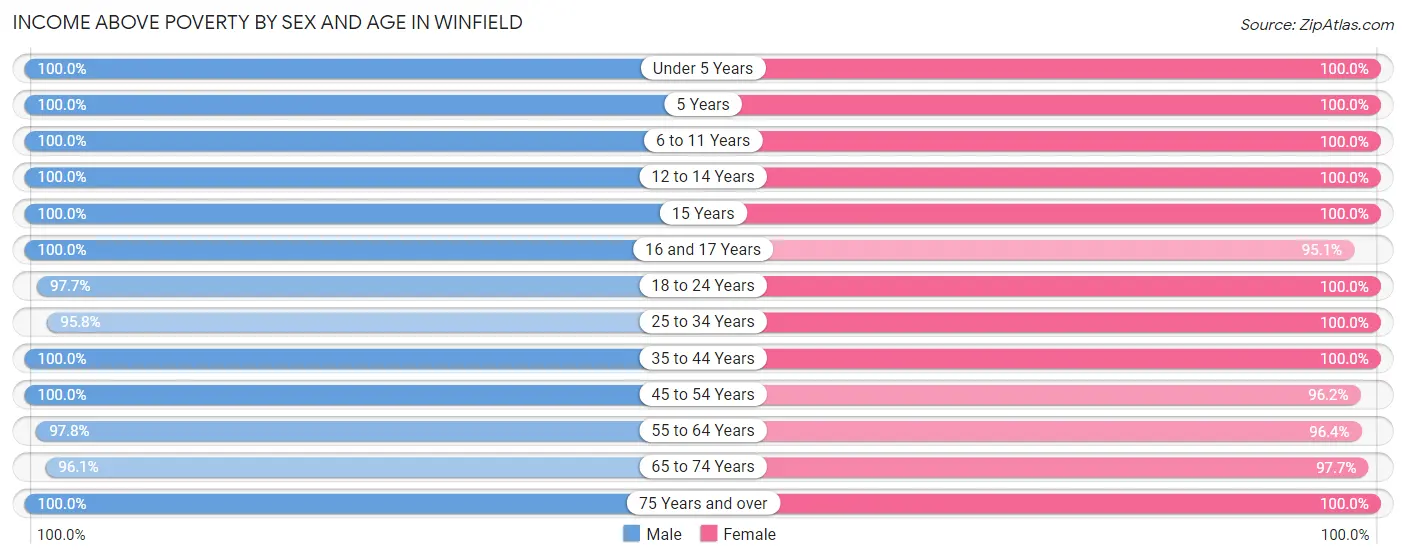
| Age Bracket | Male | Female |
| Under 5 Years | 296 (100.0%) | 151 (100.0%) |
| 5 Years | 71 (100.0%) | 37 (100.0%) |
| 6 to 11 Years | 465 (100.0%) | 363 (100.0%) |
| 12 to 14 Years | 48 (100.0%) | 168 (100.0%) |
| 15 Years | 98 (100.0%) | 32 (100.0%) |
| 16 and 17 Years | 100 (100.0%) | 192 (95.1%) |
| 18 to 24 Years | 419 (97.7%) | 245 (100.0%) |
| 25 to 34 Years | 272 (95.8%) | 333 (100.0%) |
| 35 to 44 Years | 833 (100.0%) | 546 (100.0%) |
| 45 to 54 Years | 607 (100.0%) | 794 (96.2%) |
| 55 to 64 Years | 949 (97.8%) | 730 (96.4%) |
| 65 to 74 Years | 423 (96.1%) | 684 (97.7%) |
| 75 Years and over | 421 (100.0%) | 486 (100.0%) |
| Total | 5,002 (98.8%) | 4,761 (98.3%) |
Income Below Poverty Among Married-Couple Families in Winfield
The poverty statistics for married-couple families in Winfield show that 0.6% or 16 of the total 2,589 families live below the poverty line. Families with no children have the highest poverty rate of 1.0%, comprising of 16 families. On the other hand, families with 1 or 2 children have the lowest poverty rate of 0.0%, which includes 0 families.
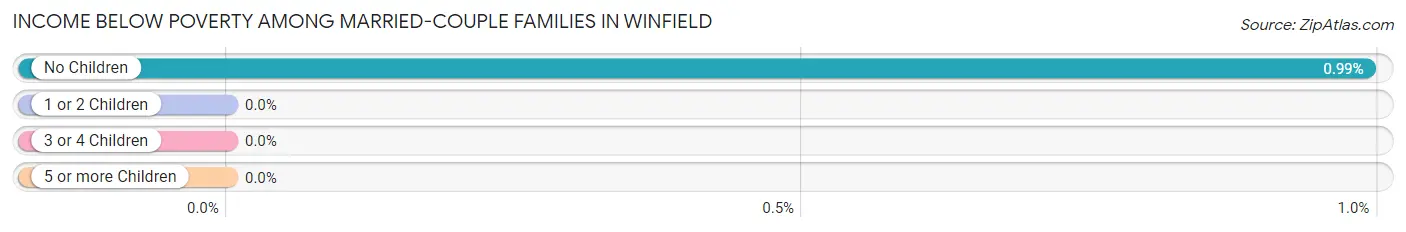
| Children | Above Poverty | Below Poverty |
| No Children | 1,593 (99.0%) | 16 (1.0%) |
| 1 or 2 Children | 784 (100.0%) | 0 (0.0%) |
| 3 or 4 Children | 196 (100.0%) | 0 (0.0%) |
| 5 or more Children | 0 (0.0%) | 0 (0.0%) |
| Total | 2,573 (99.4%) | 16 (0.6%) |
Income Below Poverty Among Single-Parent Households in Winfield
| Children | Single Father | Single Mother |
| No Children | 0 (0.0%) | 0 (0.0%) |
| 1 or 2 Children | 0 (0.0%) | 0 (0.0%) |
| 3 or 4 Children | 0 (0.0%) | 0 (0.0%) |
| 5 or more Children | 0 (0.0%) | 0 (0.0%) |
| Total | 0 (0.0%) | 0 (0.0%) |
Income Below Poverty Among Married-Couple vs Single-Parent Households in Winfield
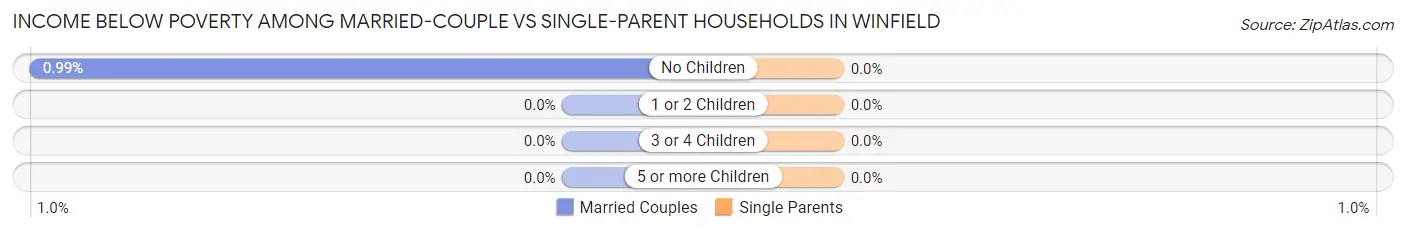
| Children | Married-Couple Families | Single-Parent Households |
| No Children | 16 (1.0%) | 0 (0.0%) |
| 1 or 2 Children | 0 (0.0%) | 0 (0.0%) |
| 3 or 4 Children | 0 (0.0%) | 0 (0.0%) |
| 5 or more Children | 0 (0.0%) | 0 (0.0%) |
| Total | 16 (0.6%) | 0 (0.0%) |
Race in Winfield
The most populous races in Winfield are White / Caucasian (8,352 | 84.0%), Hispanic or Latino (823 | 8.3%), and Two or more Races (784 | 7.9%).
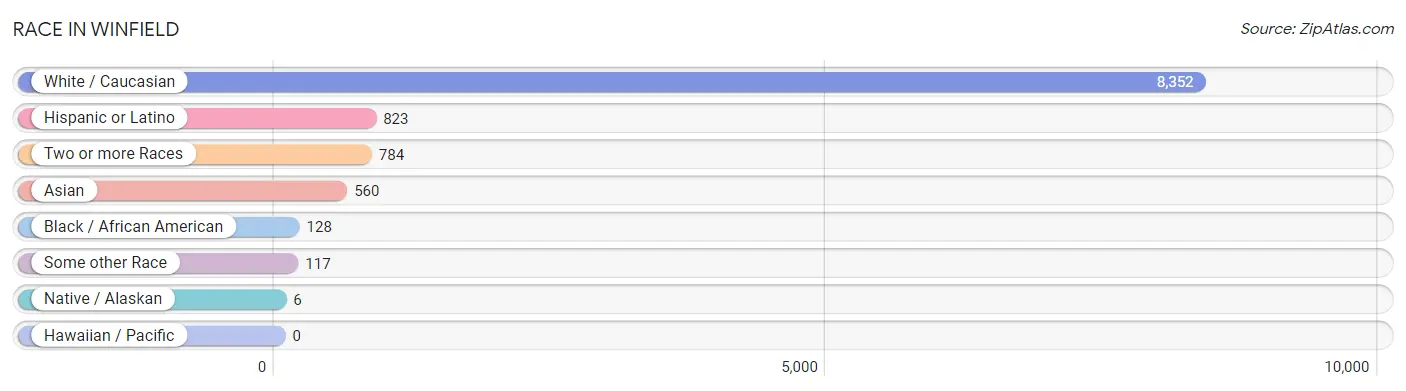
| Race | # Population | % Population |
| Asian | 560 | 5.6% |
| Black / African American | 128 | 1.3% |
| Hawaiian / Pacific | 0 | 0.0% |
| Hispanic or Latino | 823 | 8.3% |
| Native / Alaskan | 6 | 0.1% |
| White / Caucasian | 8,352 | 84.0% |
| Two or more Races | 784 | 7.9% |
| Some other Race | 117 | 1.2% |
| Total | 9,947 | 100.0% |
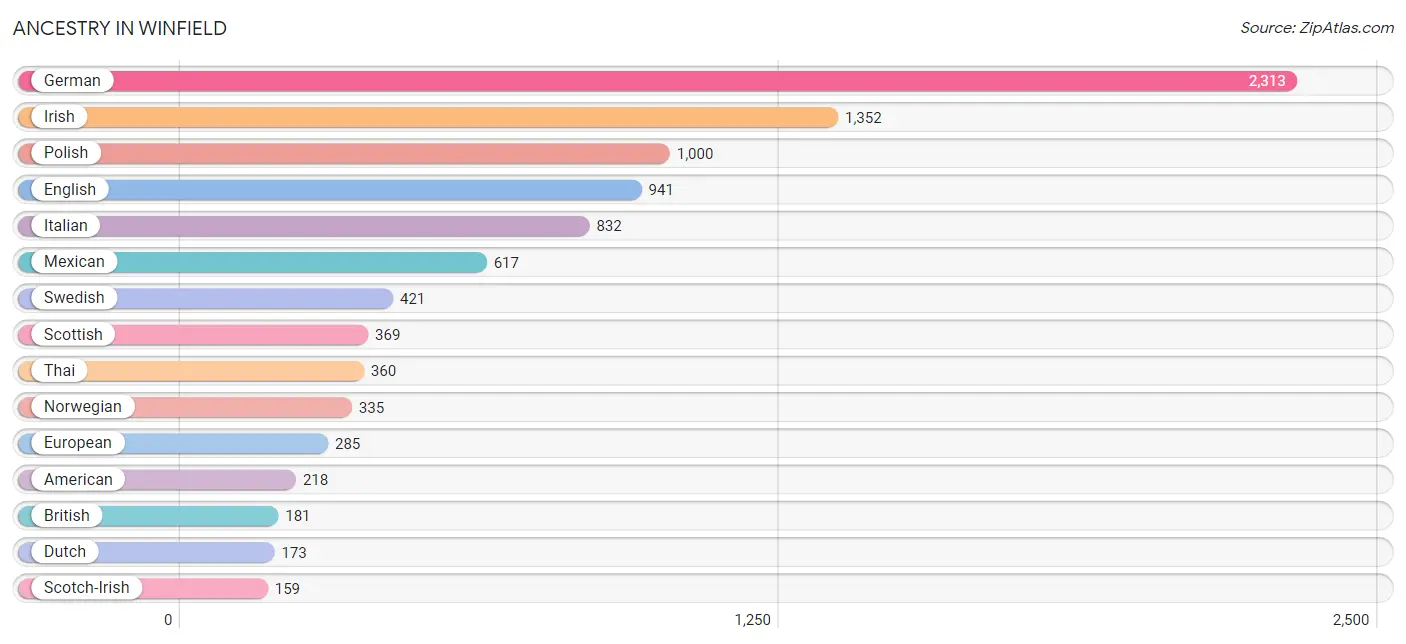
Ancestry in Winfield
The most populous ancestries reported in Winfield are German (2,313 | 23.3%), Irish (1,352 | 13.6%), Polish (1,000 | 10.1%), English (941 | 9.5%), and Italian (832 | 8.4%), together accounting for 64.7% of all Winfield residents.
| Ancestry | # Population | % Population |
| African | 15 | 0.2% |
| Albanian | 40 | 0.4% |
| Alsatian | 5 | 0.1% |
| American | 218 | 2.2% |
| Arab | 48 | 0.5% |
| Assyrian / Chaldean / Syriac | 55 | 0.5% |
| Austrian | 12 | 0.1% |
| Barbadian | 11 | 0.1% |
| Belgian | 40 | 0.4% |
| British | 181 | 1.8% |
| Burmese | 80 | 0.8% |
| Canadian | 23 | 0.2% |
| Cherokee | 47 | 0.5% |
| Choctaw | 7 | 0.1% |
| Colombian | 9 | 0.1% |
| Croatian | 61 | 0.6% |
| Cuban | 9 | 0.1% |
| Czech | 133 | 1.3% |
| Danish | 87 | 0.9% |
| Dutch | 173 | 1.7% |
| Eastern European | 8 | 0.1% |
| English | 941 | 9.5% |
| European | 285 | 2.9% |
| Finnish | 43 | 0.4% |
| French | 113 | 1.1% |
| French Canadian | 133 | 1.3% |
| German | 2,313 | 23.3% |
| Greek | 14 | 0.1% |
| Hungarian | 28 | 0.3% |
| Indian (Asian) | 43 | 0.4% |
| Iranian | 41 | 0.4% |
| Iraqi | 38 | 0.4% |
| Irish | 1,352 | 13.6% |
| Italian | 832 | 8.4% |
| Japanese | 9 | 0.1% |
| Korean | 113 | 1.1% |
| Lithuanian | 83 | 0.8% |
| Menominee | 6 | 0.1% |
| Mexican | 617 | 6.2% |
| Norwegian | 335 | 3.4% |
| Palestinian | 10 | 0.1% |
| Peruvian | 6 | 0.1% |
| Polish | 1,000 | 10.1% |
| Portuguese | 9 | 0.1% |
| Puerto Rican | 100 | 1.0% |
| Romanian | 11 | 0.1% |
| Russian | 51 | 0.5% |
| Scandinavian | 80 | 0.8% |
| Scotch-Irish | 159 | 1.6% |
| Scottish | 369 | 3.7% |
| Serbian | 9 | 0.1% |
| Slavic | 8 | 0.1% |
| Slovak | 42 | 0.4% |
| South American | 15 | 0.2% |
| Spanish | 82 | 0.8% |
| Spanish American Indian | 10 | 0.1% |
| Sri Lankan | 46 | 0.5% |
| Subsaharan African | 15 | 0.2% |
| Swedish | 421 | 4.2% |
| Swiss | 8 | 0.1% |
| Thai | 360 | 3.6% |
| Turkish | 42 | 0.4% |
| Ukrainian | 11 | 0.1% |
| Welsh | 42 | 0.4% |
| Yugoslavian | 8 | 0.1% | View All 65 Rows |
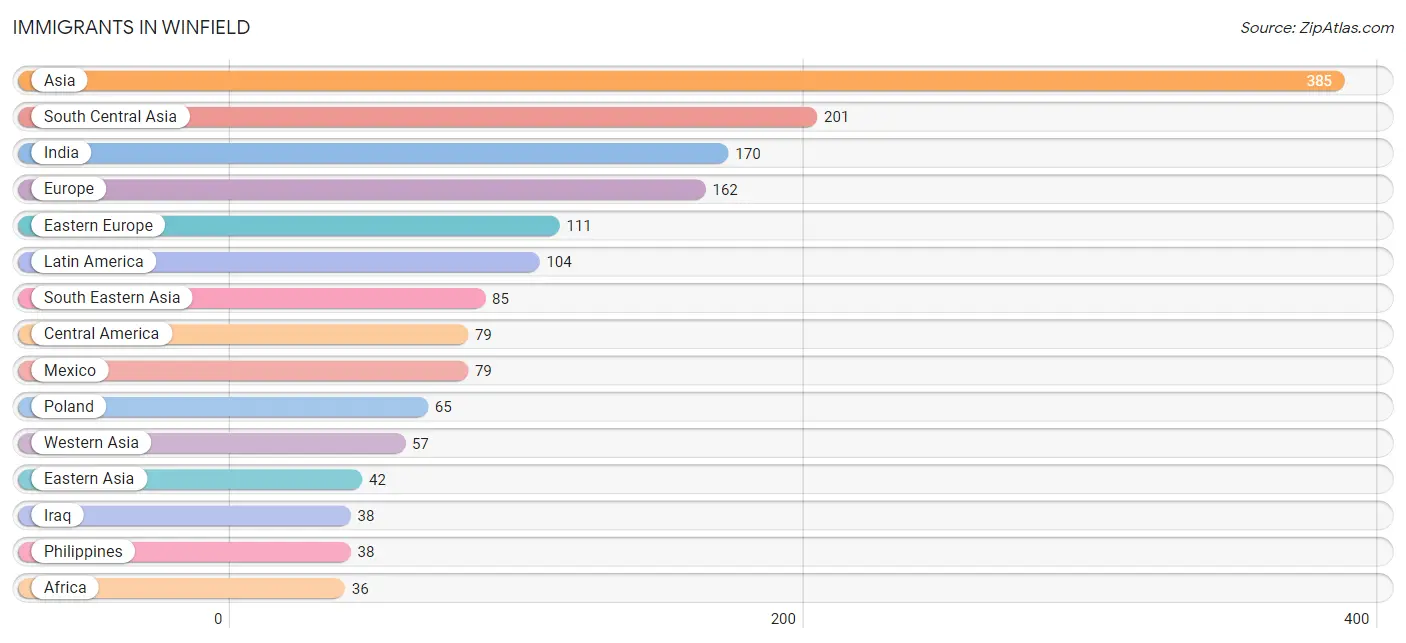
Immigrants in Winfield
The most numerous immigrant groups reported in Winfield came from Asia (385 | 3.9%), South Central Asia (201 | 2.0%), India (170 | 1.7%), Europe (162 | 1.6%), and Eastern Europe (111 | 1.1%), together accounting for 10.3% of all Winfield residents.
| Immigration Origin | # Population | % Population |
| Africa | 36 | 0.4% |
| Asia | 385 | 3.9% |
| Brazil | 16 | 0.2% |
| Cambodia | 9 | 0.1% |
| Canada | 17 | 0.2% |
| Central America | 79 | 0.8% |
| China | 18 | 0.2% |
| Colombia | 9 | 0.1% |
| Eastern Africa | 28 | 0.3% |
| Eastern Asia | 42 | 0.4% |
| Eastern Europe | 111 | 1.1% |
| England | 9 | 0.1% |
| Europe | 162 | 1.6% |
| Germany | 14 | 0.1% |
| India | 170 | 1.7% |
| Indonesia | 20 | 0.2% |
| Iraq | 38 | 0.4% |
| Ireland | 10 | 0.1% |
| Italy | 18 | 0.2% |
| Jordan | 19 | 0.2% |
| Korea | 24 | 0.2% |
| Latin America | 104 | 1.1% |
| Mexico | 79 | 0.8% |
| Northern Europe | 19 | 0.2% |
| Philippines | 38 | 0.4% |
| Poland | 65 | 0.6% |
| Russia | 21 | 0.2% |
| South Africa | 8 | 0.1% |
| South America | 25 | 0.3% |
| South Central Asia | 201 | 2.0% |
| South Eastern Asia | 85 | 0.9% |
| Southern Europe | 18 | 0.2% |
| Taiwan | 10 | 0.1% |
| Uganda | 28 | 0.3% |
| Ukraine | 25 | 0.3% |
| Uzbekistan | 31 | 0.3% |
| Vietnam | 18 | 0.2% |
| Western Asia | 57 | 0.6% |
| Western Europe | 14 | 0.1% | View All 39 Rows |
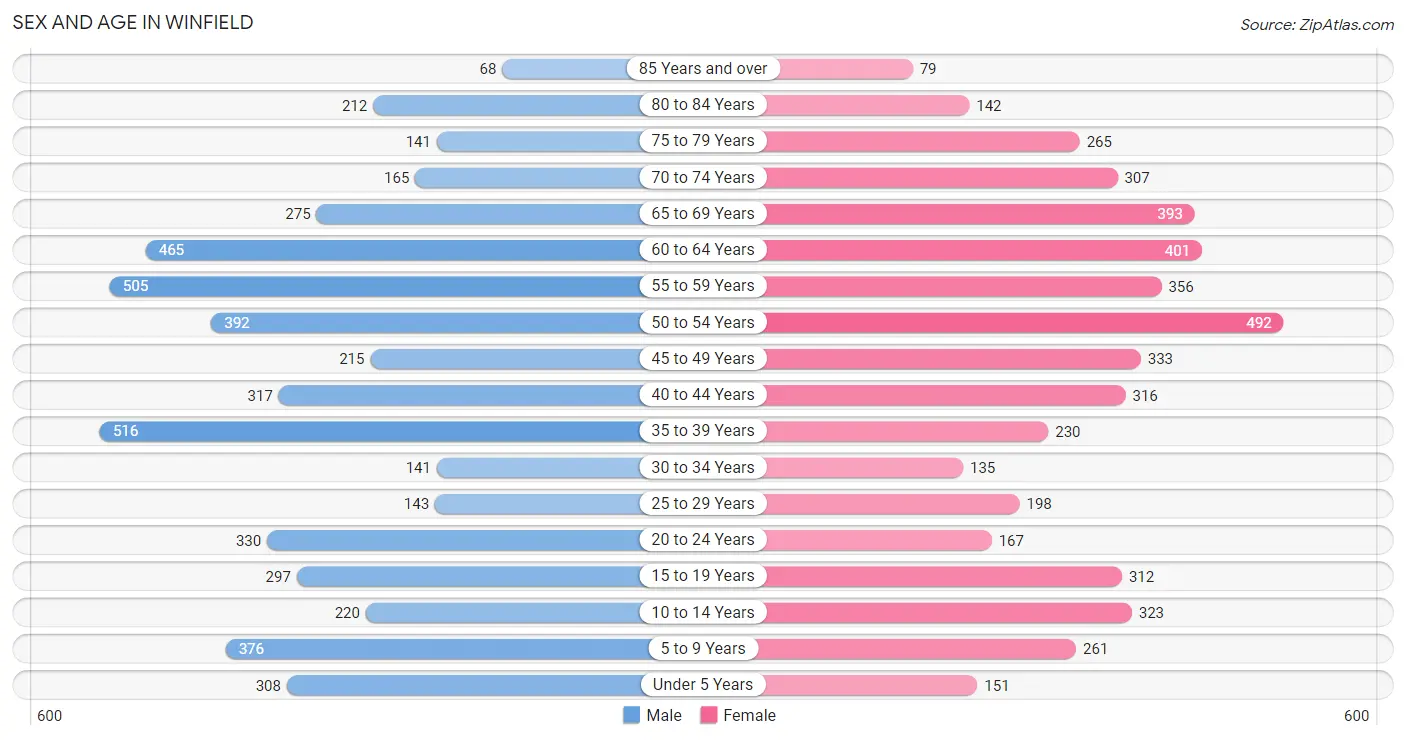
Sex and Age in Winfield
Sex and Age in Winfield
The most populous age groups in Winfield are 35 to 39 Years (516 | 10.2%) for men and 50 to 54 Years (492 | 10.1%) for women.
| Age Bracket | Male | Female |
| Under 5 Years | 308 (6.1%) | 151 (3.1%) |
| 5 to 9 Years | 376 (7.4%) | 261 (5.4%) |
| 10 to 14 Years | 220 (4.3%) | 323 (6.6%) |
| 15 to 19 Years | 297 (5.8%) | 312 (6.4%) |
| 20 to 24 Years | 330 (6.5%) | 167 (3.4%) |
| 25 to 29 Years | 143 (2.8%) | 198 (4.1%) |
| 30 to 34 Years | 141 (2.8%) | 135 (2.8%) |
| 35 to 39 Years | 516 (10.2%) | 230 (4.7%) |
| 40 to 44 Years | 317 (6.2%) | 316 (6.5%) |
| 45 to 49 Years | 215 (4.2%) | 333 (6.9%) |
| 50 to 54 Years | 392 (7.7%) | 492 (10.1%) |
| 55 to 59 Years | 505 (9.9%) | 356 (7.3%) |
| 60 to 64 Years | 465 (9.1%) | 401 (8.3%) |
| 65 to 69 Years | 275 (5.4%) | 393 (8.1%) |
| 70 to 74 Years | 165 (3.2%) | 307 (6.3%) |
| 75 to 79 Years | 141 (2.8%) | 265 (5.4%) |
| 80 to 84 Years | 212 (4.2%) | 142 (2.9%) |
| 85 Years and over | 68 (1.3%) | 79 (1.6%) |
| Total | 5,086 (100.0%) | 4,861 (100.0%) |
Families and Households in Winfield
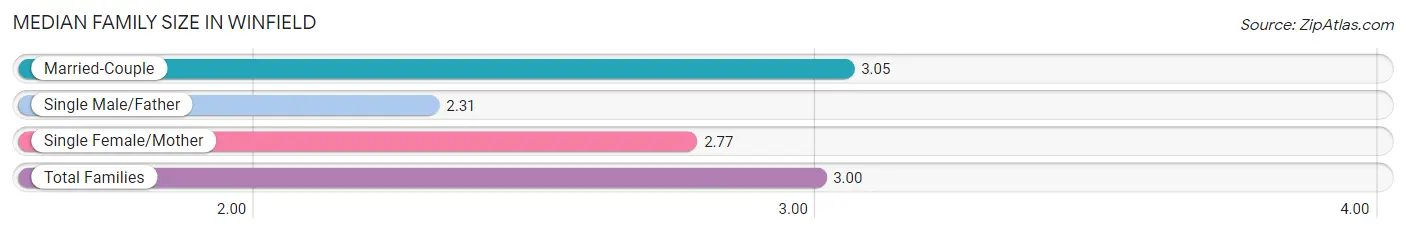
Median Family Size in Winfield
The median family size in Winfield is 3.00 persons per family, with married-couple families (2,589 | 89.1%) accounting for the largest median family size of 3.05 persons per family. On the other hand, single male/father families (104 | 3.6%) represent the smallest median family size with 2.31 persons per family.
| Family Type | # Families | Family Size |
| Married-Couple | 2,589 (89.1%) | 3.05 |
| Single Male/Father | 104 (3.6%) | 2.31 |
| Single Female/Mother | 211 (7.3%) | 2.77 |
| Total Families | 2,904 (100.0%) | 3.00 |
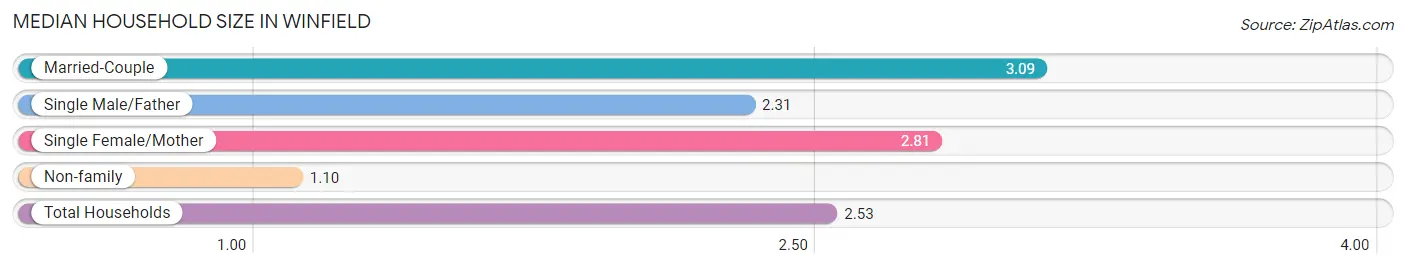
Median Household Size in Winfield
The median household size in Winfield is 2.53 persons per household, with married-couple households (2,589 | 65.9%) accounting for the largest median household size of 3.09 persons per household. non-family households (1,027 | 26.1%) represent the smallest median household size with 1.10 persons per household.
| Household Type | # Households | Household Size |
| Married-Couple | 2,589 (65.9%) | 3.09 |
| Single Male/Father | 104 (2.6%) | 2.31 |
| Single Female/Mother | 211 (5.4%) | 2.81 |
| Non-family | 1,027 (26.1%) | 1.10 |
| Total Households | 3,931 (100.0%) | 2.53 |
Household Size by Marriage Status in Winfield
Out of a total of 3,931 households in Winfield, 2,904 (73.9%) are family households, while 1,027 (26.1%) are nonfamily households. The most numerous type of family households are 2-person households, comprising 1,401, and the most common type of nonfamily households are 1-person households, comprising 945.
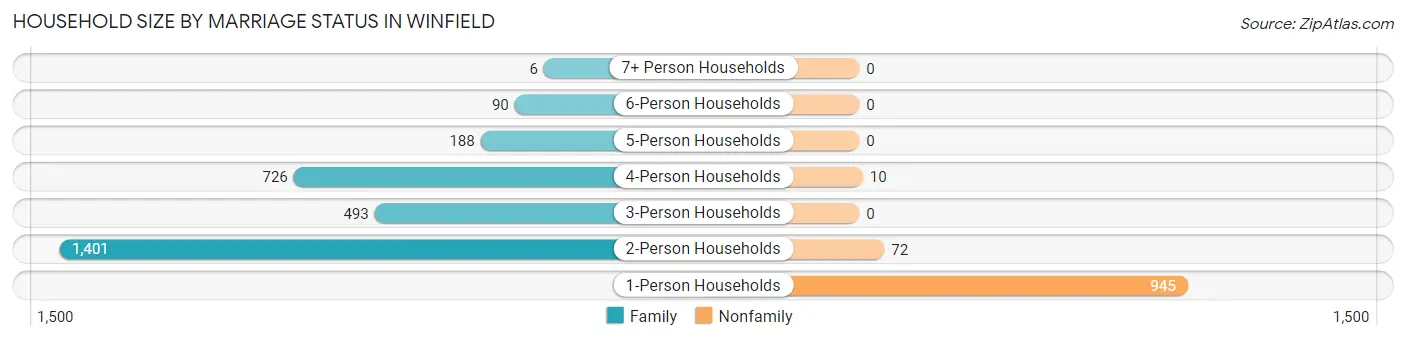
| Household Size | Family Households | Nonfamily Households |
| 1-Person Households | - | 945 (24.0%) |
| 2-Person Households | 1,401 (35.6%) | 72 (1.8%) |
| 3-Person Households | 493 (12.5%) | 0 (0.0%) |
| 4-Person Households | 726 (18.5%) | 10 (0.3%) |
| 5-Person Households | 188 (4.8%) | 0 (0.0%) |
| 6-Person Households | 90 (2.3%) | 0 (0.0%) |
| 7+ Person Households | 6 (0.2%) | 0 (0.0%) |
| Total | 2,904 (73.9%) | 1,027 (26.1%) |
Female Fertility in Winfield
Fertility by Age in Winfield
Average fertility rate in Winfield is 42.0 births per 1,000 women. Women in the age bracket of 35 to 50 years have the highest fertility rate with 56.0 births per 1,000 women. Women in the age bracket of 35 to 50 years acount for 75.6% of all women with births.
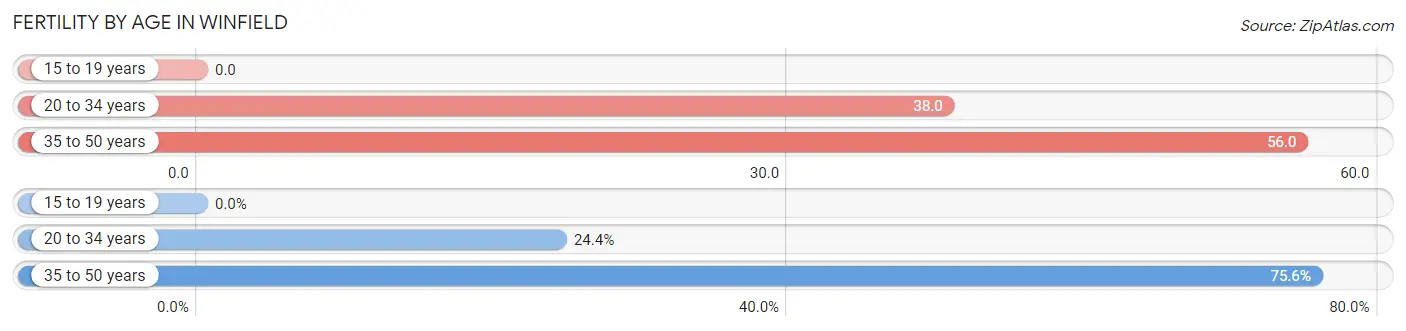
| Age Bracket | Women with Births | Births / 1,000 Women |
| 15 to 19 years | 0 (0.0%) | 0.0 |
| 20 to 34 years | 19 (24.4%) | 38.0 |
| 35 to 50 years | 59 (75.6%) | 56.0 |
| Total | 78 (100.0%) | 42.0 |
Fertility by Age by Marriage Status in Winfield
91.0% of women with births (78) in Winfield are married. The highest percentage of unmarried women with births falls into 35 to 50 years age bracket with 11.9% of them unmarried at the time of birth, while the lowest percentage of unmarried women with births belong to 20 to 34 years age bracket with 0.0% of them unmarried.
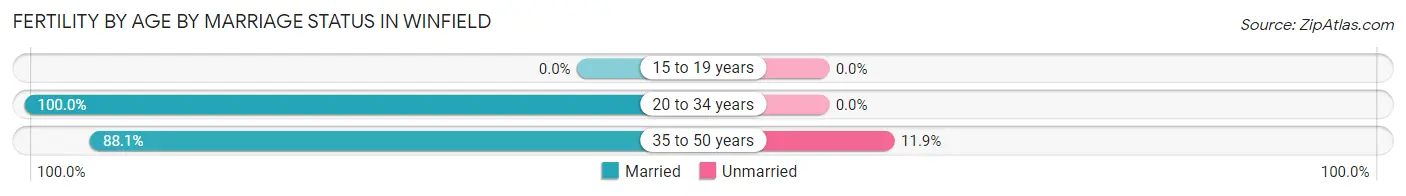
| Age Bracket | Married | Unmarried |
| 15 to 19 years | 0 (0.0%) | 0 (0.0%) |
| 20 to 34 years | 19 (100.0%) | 0 (0.0%) |
| 35 to 50 years | 52 (88.1%) | 7 (11.9%) |
| Total | 71 (91.0%) | 7 (9.0%) |
Fertility by Education in Winfield
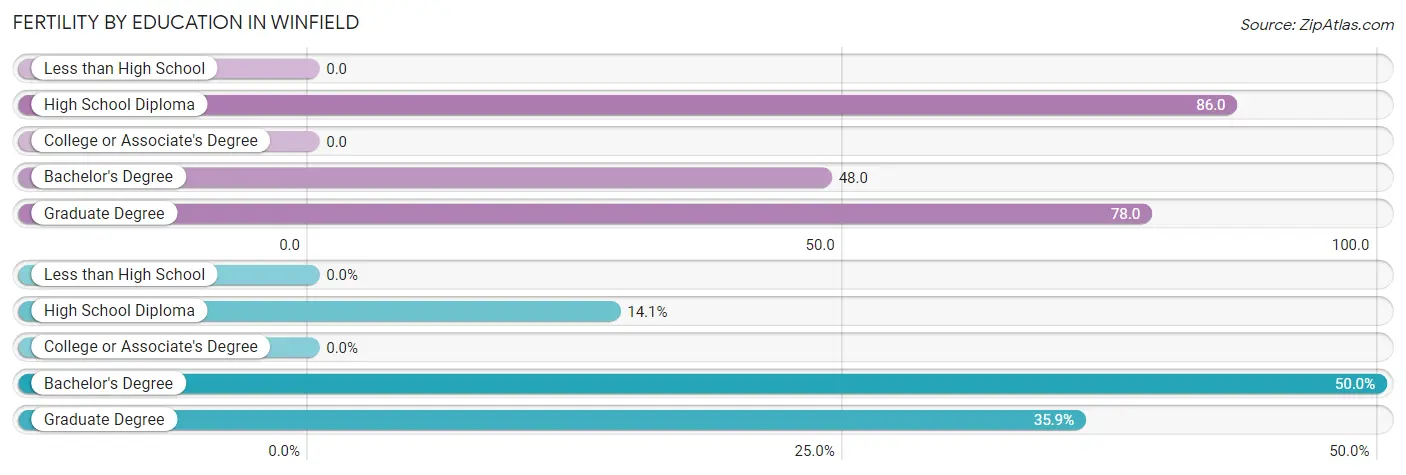
| Educational Attainment | Women with Births | Births / 1,000 Women |
| Less than High School | 0 (0.0%) | 0.0 |
| High School Diploma | 11 (14.1%) | 86.0 |
| College or Associate's Degree | 0 (0.0%) | 0.0 |
| Bachelor's Degree | 39 (50.0%) | 48.0 |
| Graduate Degree | 28 (35.9%) | 78.0 |
| Total | 78 (100.0%) | 42.0 |
Fertility by Education by Marriage Status in Winfield
9.0% of women with births in Winfield are unmarried. Women with the educational attainment of high school diploma are most likely to be married with 100.0% of them married at childbirth, while women with the educational attainment of bachelor's degree are least likely to be married with 17.9% of them unmarried at childbirth.
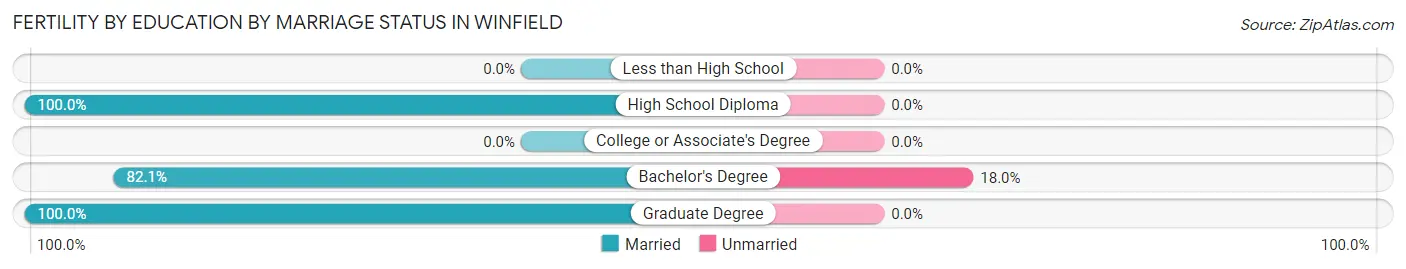
| Educational Attainment | Married | Unmarried |
| Less than High School | 0 (0.0%) | 0 (0.0%) |
| High School Diploma | 11 (100.0%) | 0 (0.0%) |
| College or Associate's Degree | 0 (0.0%) | 0 (0.0%) |
| Bachelor's Degree | 32 (82.1%) | 7 (17.9%) |
| Graduate Degree | 28 (100.0%) | 0 (0.0%) |
| Total | 71 (91.0%) | 7 (9.0%) |
Employment Characteristics in Winfield
Employment by Class of Employer in Winfield
Among the 5,181 employed individuals in Winfield, private company employees (3,387 | 65.4%), not-for-profit organizations (692 | 13.4%), and local government employees (435 | 8.4%) make up the most common classes of employment.
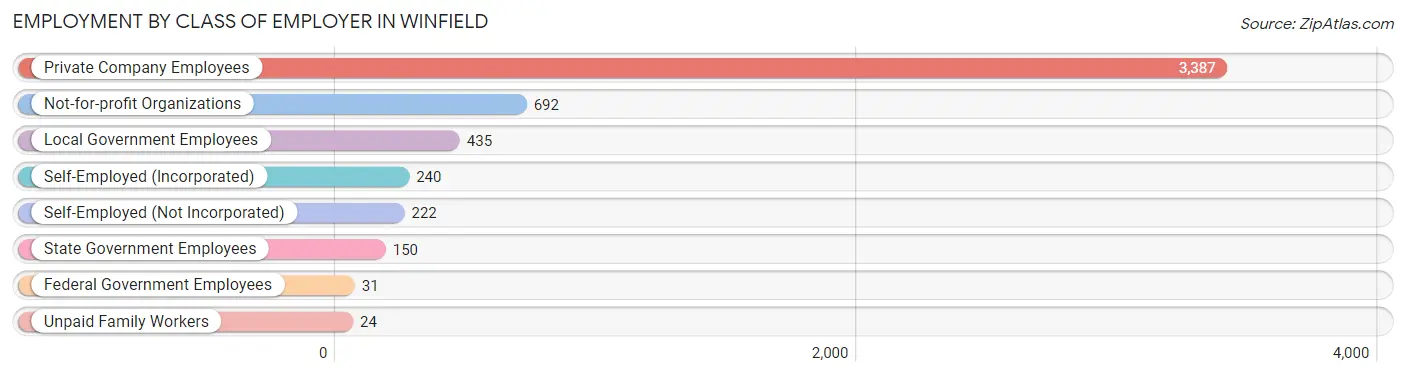
| Employer Class | # Employees | % Employees |
| Private Company Employees | 3,387 | 65.4% |
| Self-Employed (Incorporated) | 240 | 4.6% |
| Self-Employed (Not Incorporated) | 222 | 4.3% |
| Not-for-profit Organizations | 692 | 13.4% |
| Local Government Employees | 435 | 8.4% |
| State Government Employees | 150 | 2.9% |
| Federal Government Employees | 31 | 0.6% |
| Unpaid Family Workers | 24 | 0.5% |
| Total | 5,181 | 100.0% |
Employment Status by Age in Winfield
According to the labor force statistics for Winfield, out of the total population over 16 years of age (8,178), 66.6% or 5,447 individuals are in the labor force, with 4.5% or 245 of them unemployed. The age group with the highest labor force participation rate is 30 to 34 years, with 97.1% or 268 individuals in the labor force. Within the labor force, the 75 years and over age range has the highest percentage of unemployed individuals, with 34.8% or 40 of them being unemployed.
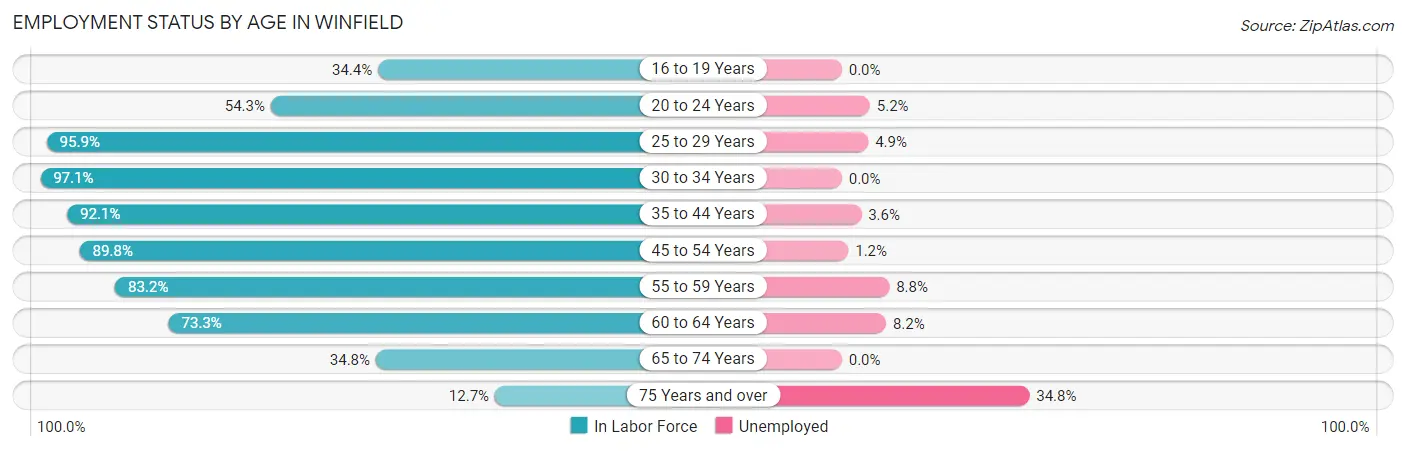
| Age Bracket | In Labor Force | Unemployed |
| 16 to 19 Years | 165 (34.4%) | 0 (0.0%) |
| 20 to 24 Years | 270 (54.3%) | 14 (5.2%) |
| 25 to 29 Years | 327 (95.9%) | 16 (4.9%) |
| 30 to 34 Years | 268 (97.1%) | 0 (0.0%) |
| 35 to 44 Years | 1,270 (92.1%) | 46 (3.6%) |
| 45 to 54 Years | 1,286 (89.8%) | 15 (1.2%) |
| 55 to 59 Years | 716 (83.2%) | 63 (8.8%) |
| 60 to 64 Years | 635 (73.3%) | 52 (8.2%) |
| 65 to 74 Years | 397 (34.8%) | 0 (0.0%) |
| 75 Years and over | 115 (12.7%) | 40 (34.8%) |
| Total | 5,447 (66.6%) | 245 (4.5%) |
Employment Status by Educational Attainment in Winfield
According to labor force statistics for Winfield, 87.3% of individuals (4,500) out of the total population between 25 and 64 years of age (5,155) are in the labor force, with 4.3% or 193 of them being unemployed. The group with the highest labor force participation rate are those with the educational attainment of bachelor's degree or higher, with 89.7% or 3,037 individuals in the labor force. Within the labor force, individuals with high school diploma education have the highest percentage of unemployment, with 22.1% or 101 of them being unemployed.
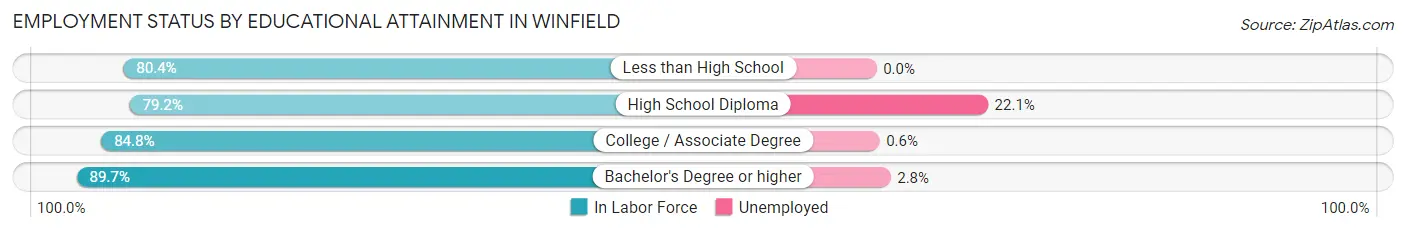
| Educational Attainment | In Labor Force | Unemployed |
| Less than High School | 41 (80.4%) | 0 (0.0%) |
| High School Diploma | 456 (79.2%) | 127 (22.1%) |
| College / Associate Degree | 968 (84.8%) | 7 (0.6%) |
| Bachelor's Degree or higher | 3,037 (89.7%) | 95 (2.8%) |
| Total | 4,500 (87.3%) | 222 (4.3%) |
Employment Occupations by Sex in Winfield
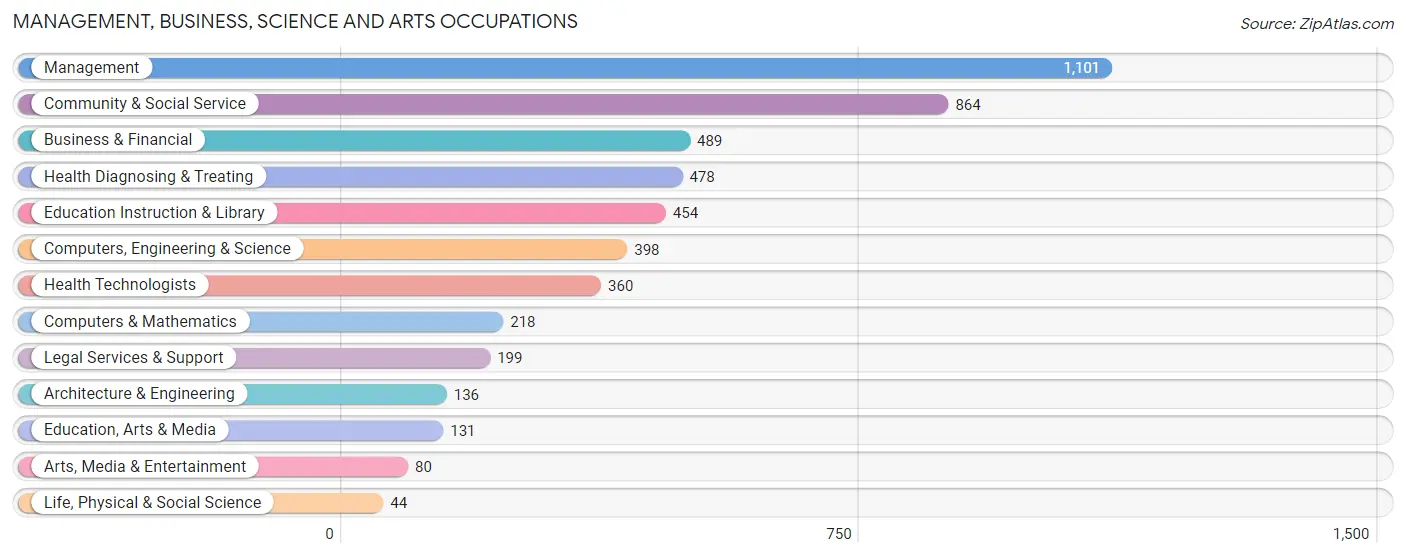
Management, Business, Science and Arts Occupations
The most common Management, Business, Science and Arts occupations in Winfield are Management (1,101 | 21.2%), Community & Social Service (864 | 16.6%), Business & Financial (489 | 9.4%), Health Diagnosing & Treating (478 | 9.2%), and Education Instruction & Library (454 | 8.7%).
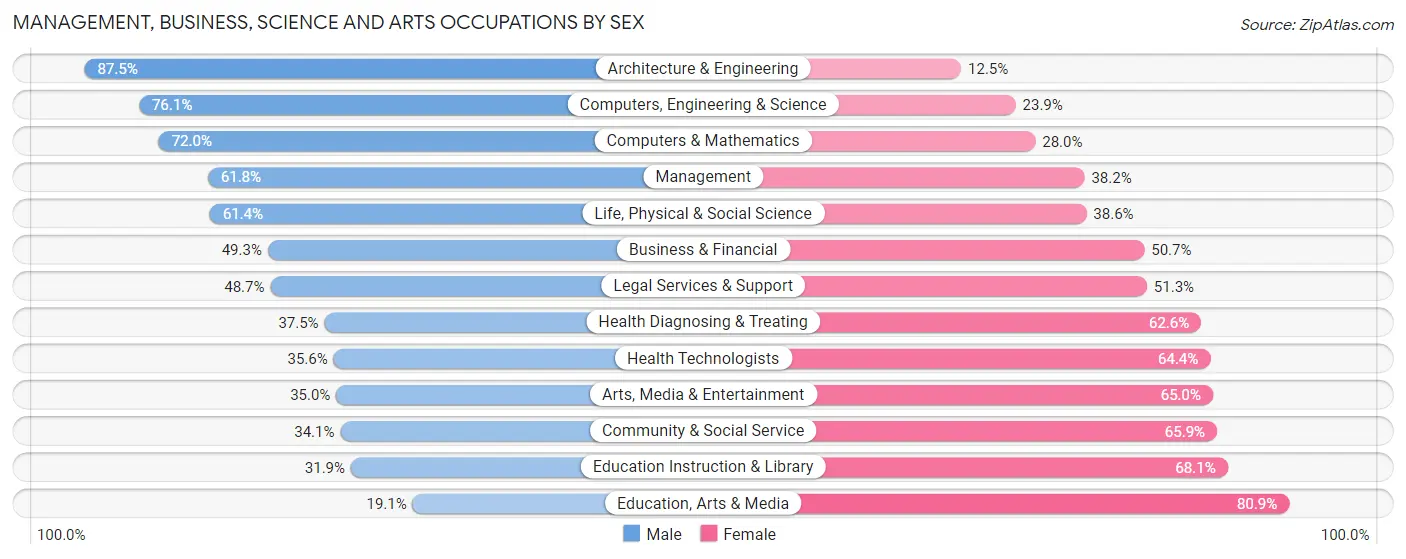
Management, Business, Science and Arts Occupations by Sex
Within the Management, Business, Science and Arts occupations in Winfield, the most male-oriented occupations are Architecture & Engineering (87.5%), Computers, Engineering & Science (76.1%), and Computers & Mathematics (72.0%), while the most female-oriented occupations are Education, Arts & Media (80.9%), Education Instruction & Library (68.1%), and Community & Social Service (65.9%).
| Occupation | Male | Female |
| Management | 680 (61.8%) | 421 (38.2%) |
| Business & Financial | 241 (49.3%) | 248 (50.7%) |
| Computers, Engineering & Science | 303 (76.1%) | 95 (23.9%) |
| Computers & Mathematics | 157 (72.0%) | 61 (28.0%) |
| Architecture & Engineering | 119 (87.5%) | 17 (12.5%) |
| Life, Physical & Social Science | 27 (61.4%) | 17 (38.6%) |
| Community & Social Service | 295 (34.1%) | 569 (65.9%) |
| Education, Arts & Media | 25 (19.1%) | 106 (80.9%) |
| Legal Services & Support | 97 (48.7%) | 102 (51.3%) |
| Education Instruction & Library | 145 (31.9%) | 309 (68.1%) |
| Arts, Media & Entertainment | 28 (35.0%) | 52 (65.0%) |
| Health Diagnosing & Treating | 179 (37.4%) | 299 (62.5%) |
| Health Technologists | 128 (35.6%) | 232 (64.4%) |
| Total (Category) | 1,698 (51.0%) | 1,632 (49.0%) |
| Total (Overall) | 2,866 (55.1%) | 2,336 (44.9%) |
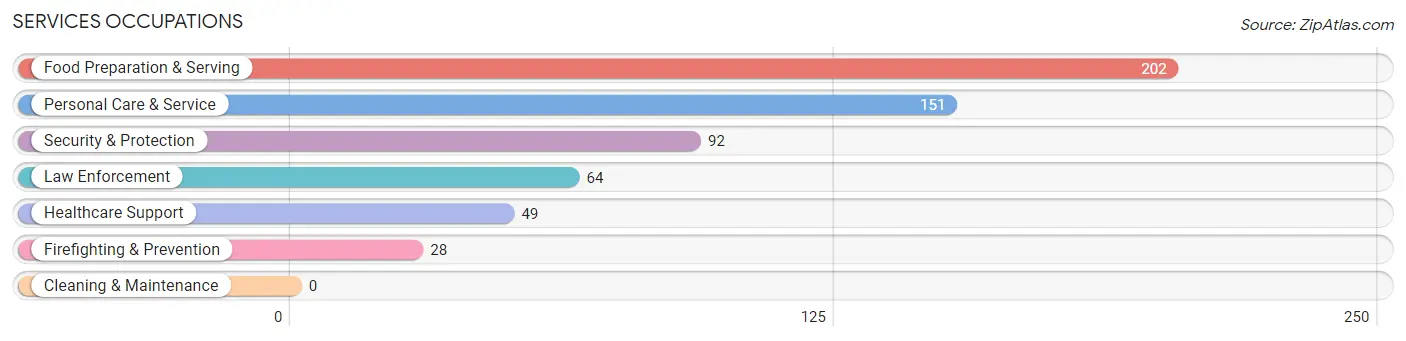
Services Occupations
The most common Services occupations in Winfield are Food Preparation & Serving (202 | 3.9%), Personal Care & Service (151 | 2.9%), Security & Protection (92 | 1.8%), Law Enforcement (64 | 1.2%), and Healthcare Support (49 | 0.9%).
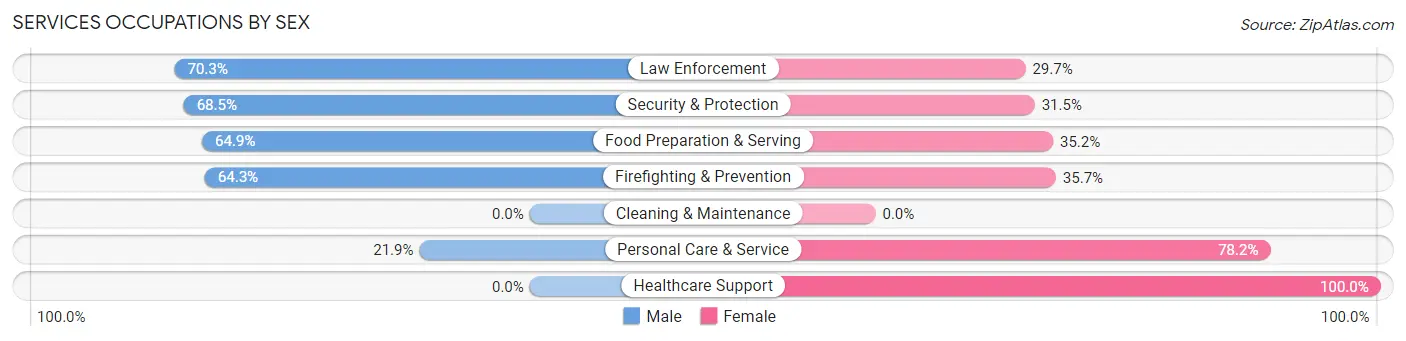
Services Occupations by Sex
Within the Services occupations in Winfield, the most male-oriented occupations are Law Enforcement (70.3%), Security & Protection (68.5%), and Food Preparation & Serving (64.8%), while the most female-oriented occupations are Healthcare Support (100.0%), Personal Care & Service (78.1%), and Firefighting & Prevention (35.7%).
| Occupation | Male | Female |
| Healthcare Support | 0 (0.0%) | 49 (100.0%) |
| Security & Protection | 63 (68.5%) | 29 (31.5%) |
| Firefighting & Prevention | 18 (64.3%) | 10 (35.7%) |
| Law Enforcement | 45 (70.3%) | 19 (29.7%) |
| Food Preparation & Serving | 131 (64.8%) | 71 (35.1%) |
| Cleaning & Maintenance | 0 (0.0%) | 0 (0.0%) |
| Personal Care & Service | 33 (21.8%) | 118 (78.1%) |
| Total (Category) | 227 (46.0%) | 267 (54.0%) |
| Total (Overall) | 2,866 (55.1%) | 2,336 (44.9%) |
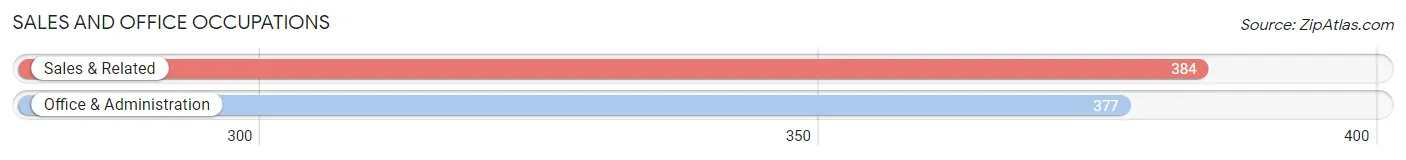
Sales and Office Occupations
The most common Sales and Office occupations in Winfield are Sales & Related (384 | 7.4%), and Office & Administration (377 | 7.2%).
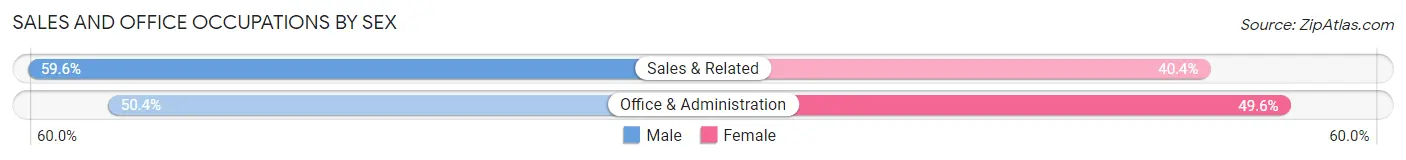
Sales and Office Occupations by Sex
| Occupation | Male | Female |
| Sales & Related | 229 (59.6%) | 155 (40.4%) |
| Office & Administration | 190 (50.4%) | 187 (49.6%) |
| Total (Category) | 419 (55.1%) | 342 (44.9%) |
| Total (Overall) | 2,866 (55.1%) | 2,336 (44.9%) |
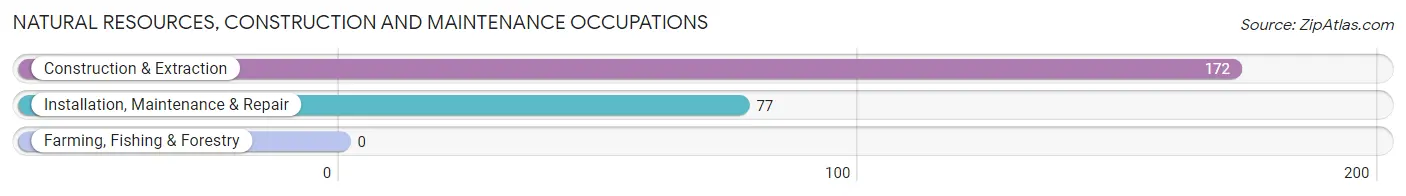
Natural Resources, Construction and Maintenance Occupations
The most common Natural Resources, Construction and Maintenance occupations in Winfield are Construction & Extraction (172 | 3.3%), and Installation, Maintenance & Repair (77 | 1.5%).
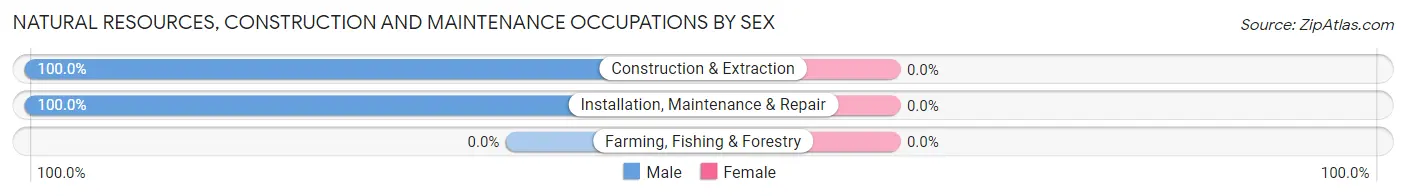
Natural Resources, Construction and Maintenance Occupations by Sex
| Occupation | Male | Female |
| Farming, Fishing & Forestry | 0 (0.0%) | 0 (0.0%) |
| Construction & Extraction | 172 (100.0%) | 0 (0.0%) |
| Installation, Maintenance & Repair | 77 (100.0%) | 0 (0.0%) |
| Total (Category) | 249 (100.0%) | 0 (0.0%) |
| Total (Overall) | 2,866 (55.1%) | 2,336 (44.9%) |
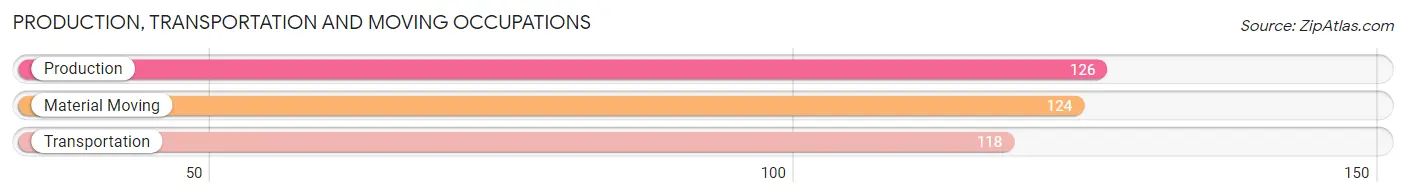
Production, Transportation and Moving Occupations
The most common Production, Transportation and Moving occupations in Winfield are Production (126 | 2.4%), Material Moving (124 | 2.4%), and Transportation (118 | 2.3%).
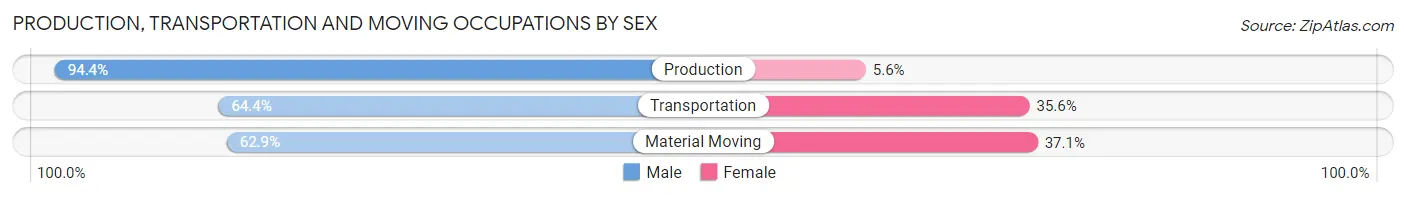
Production, Transportation and Moving Occupations by Sex
| Occupation | Male | Female |
| Production | 119 (94.4%) | 7 (5.6%) |
| Transportation | 76 (64.4%) | 42 (35.6%) |
| Material Moving | 78 (62.9%) | 46 (37.1%) |
| Total (Category) | 273 (74.2%) | 95 (25.8%) |
| Total (Overall) | 2,866 (55.1%) | 2,336 (44.9%) |
Employment Industries by Sex in Winfield
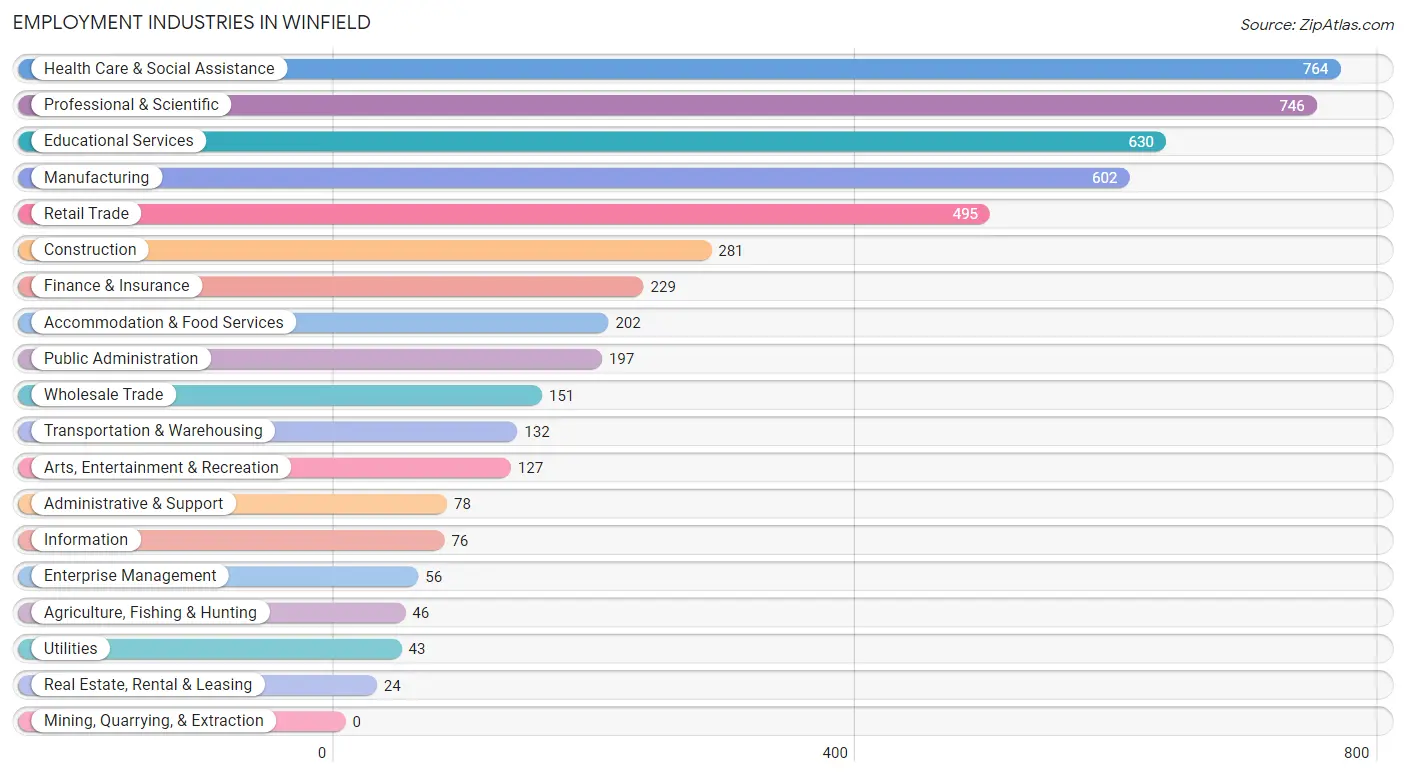
Employment Industries in Winfield
The major employment industries in Winfield include Health Care & Social Assistance (764 | 14.7%), Professional & Scientific (746 | 14.3%), Educational Services (630 | 12.1%), Manufacturing (602 | 11.6%), and Retail Trade (495 | 9.5%).
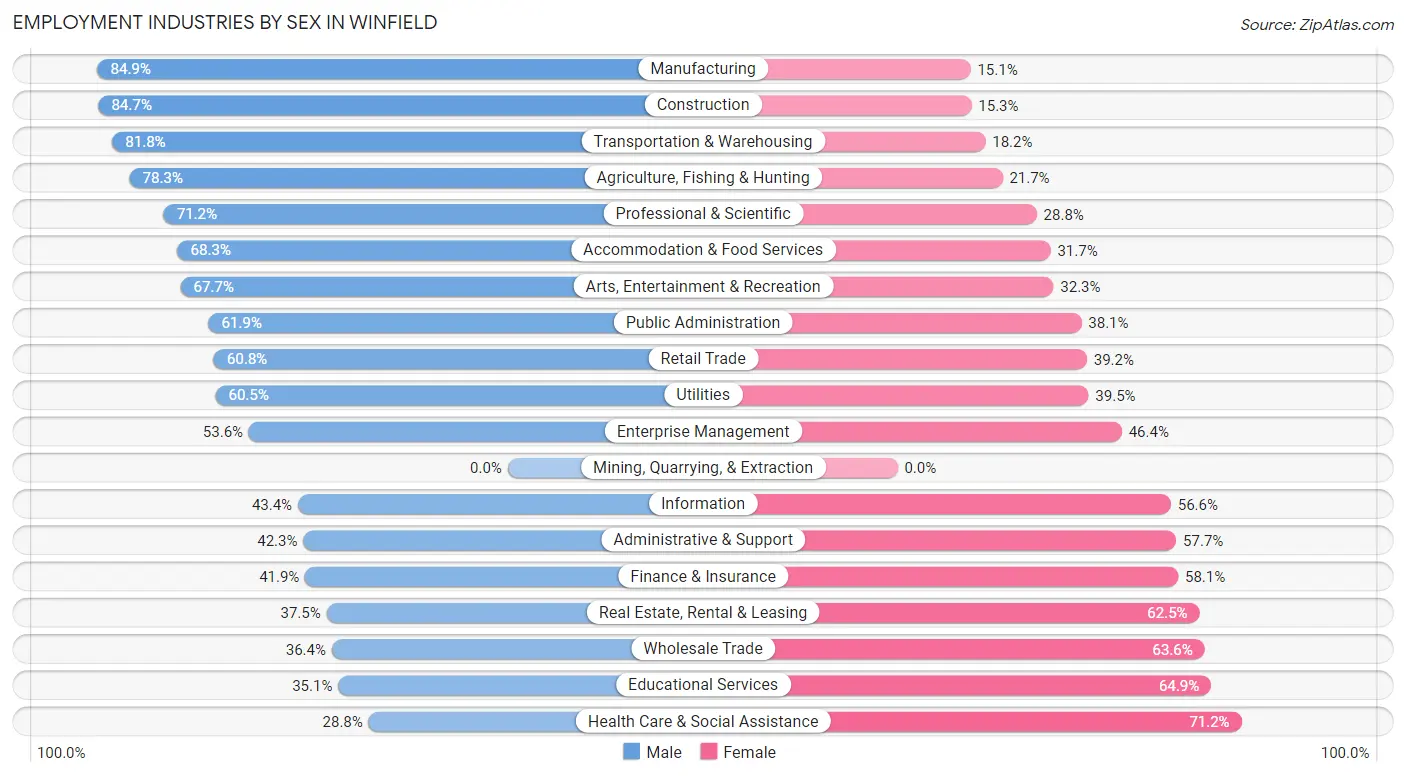
Employment Industries by Sex in Winfield
The Winfield industries that see more men than women are Manufacturing (84.9%), Construction (84.7%), and Transportation & Warehousing (81.8%), whereas the industries that tend to have a higher number of women are Health Care & Social Assistance (71.2%), Educational Services (64.9%), and Wholesale Trade (63.6%).
| Industry | Male | Female |
| Agriculture, Fishing & Hunting | 36 (78.3%) | 10 (21.7%) |
| Mining, Quarrying, & Extraction | 0 (0.0%) | 0 (0.0%) |
| Construction | 238 (84.7%) | 43 (15.3%) |
| Manufacturing | 511 (84.9%) | 91 (15.1%) |
| Wholesale Trade | 55 (36.4%) | 96 (63.6%) |
| Retail Trade | 301 (60.8%) | 194 (39.2%) |
| Transportation & Warehousing | 108 (81.8%) | 24 (18.2%) |
| Utilities | 26 (60.5%) | 17 (39.5%) |
| Information | 33 (43.4%) | 43 (56.6%) |
| Finance & Insurance | 96 (41.9%) | 133 (58.1%) |
| Real Estate, Rental & Leasing | 9 (37.5%) | 15 (62.5%) |
| Professional & Scientific | 531 (71.2%) | 215 (28.8%) |
| Enterprise Management | 30 (53.6%) | 26 (46.4%) |
| Administrative & Support | 33 (42.3%) | 45 (57.7%) |
| Educational Services | 221 (35.1%) | 409 (64.9%) |
| Health Care & Social Assistance | 220 (28.8%) | 544 (71.2%) |
| Arts, Entertainment & Recreation | 86 (67.7%) | 41 (32.3%) |
| Accommodation & Food Services | 138 (68.3%) | 64 (31.7%) |
| Public Administration | 122 (61.9%) | 75 (38.1%) |
| Total | 2,866 (55.1%) | 2,336 (44.9%) |
Education in Winfield
School Enrollment in Winfield
The most common levels of schooling among the 2,247 students in Winfield are high school (661 | 29.4%), elementary school (441 | 19.6%), and college / undergraduate (422 | 18.8%).
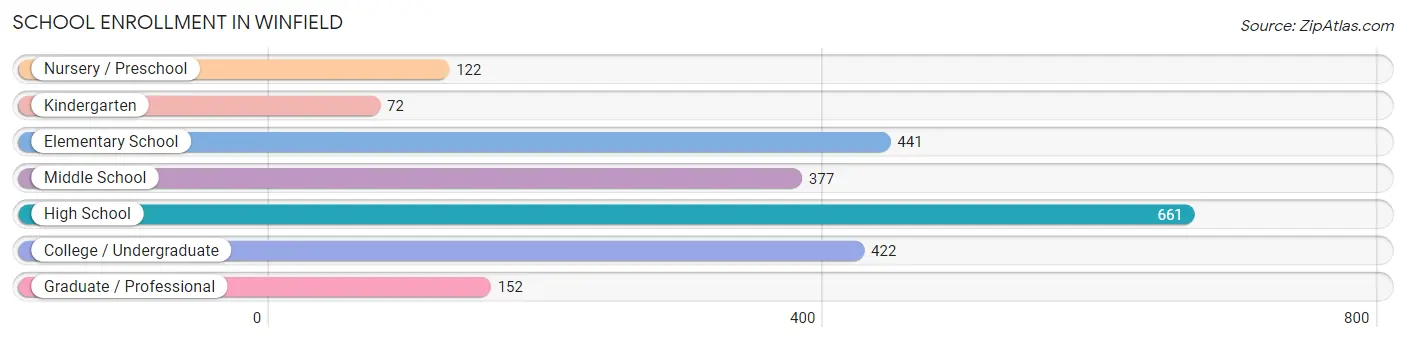
| School Level | # Students | % Students |
| Nursery / Preschool | 122 | 5.4% |
| Kindergarten | 72 | 3.2% |
| Elementary School | 441 | 19.6% |
| Middle School | 377 | 16.8% |
| High School | 661 | 29.4% |
| College / Undergraduate | 422 | 18.8% |
| Graduate / Professional | 152 | 6.8% |
| Total | 2,247 | 100.0% |
School Enrollment by Age by Funding Source in Winfield
Out of a total of 2,247 students who are enrolled in schools in Winfield, 661 (29.4%) attend a private institution, while the remaining 1,586 (70.6%) are enrolled in public schools. The age group of 25 to 34 year olds has the highest likelihood of being enrolled in private schools, with 53 (68.8% in the age bracket) enrolled. Conversely, the age group of 5 to 9 year old has the lowest likelihood of being enrolled in a private school, with 411 (82.0% in the age bracket) attending a public institution.
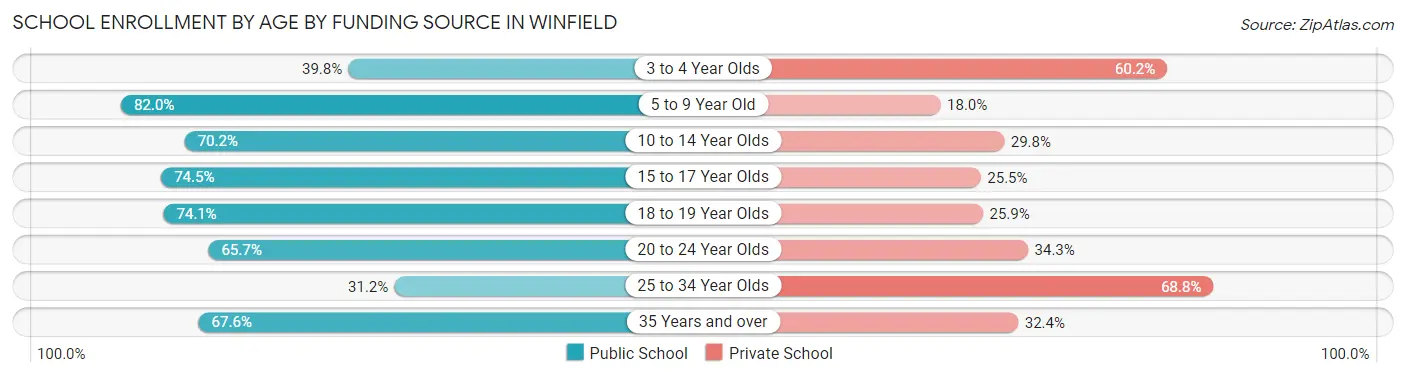
| Age Bracket | Public School | Private School |
| 3 to 4 Year Olds | 33 (39.8%) | 50 (60.2%) |
| 5 to 9 Year Old | 411 (82.0%) | 90 (18.0%) |
| 10 to 14 Year Olds | 381 (70.2%) | 162 (29.8%) |
| 15 to 17 Year Olds | 322 (74.5%) | 110 (25.5%) |
| 18 to 19 Year Olds | 106 (74.1%) | 37 (25.9%) |
| 20 to 24 Year Olds | 259 (65.7%) | 135 (34.3%) |
| 25 to 34 Year Olds | 24 (31.2%) | 53 (68.8%) |
| 35 Years and over | 50 (67.6%) | 24 (32.4%) |
| Total | 1,586 (70.6%) | 661 (29.4%) |
Educational Attainment by Field of Study in Winfield
Business (1,062 | 21.8%), education (563 | 11.6%), science & technology (444 | 9.1%), bio, nature & agricultural (365 | 7.5%), and social sciences (343 | 7.0%) are the most common fields of study among 4,876 individuals in Winfield who have obtained a bachelor's degree or higher.
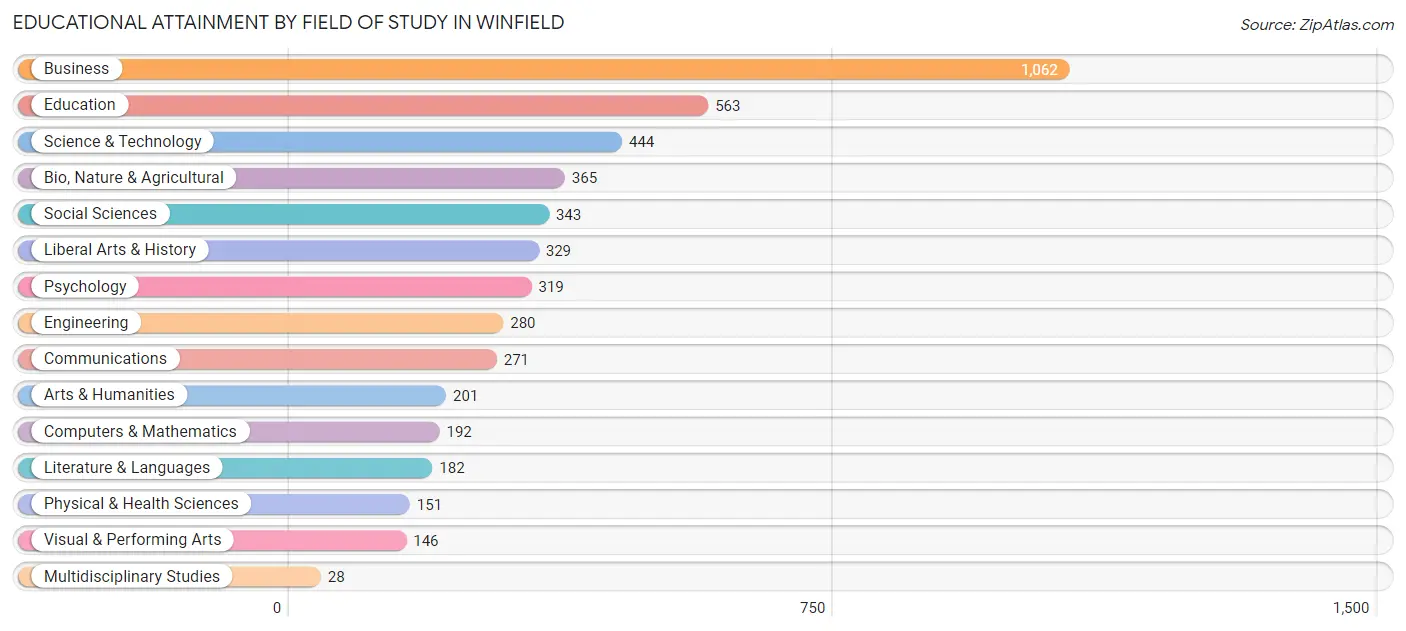
| Field of Study | # Graduates | % Graduates |
| Computers & Mathematics | 192 | 3.9% |
| Bio, Nature & Agricultural | 365 | 7.5% |
| Physical & Health Sciences | 151 | 3.1% |
| Psychology | 319 | 6.5% |
| Social Sciences | 343 | 7.0% |
| Engineering | 280 | 5.7% |
| Multidisciplinary Studies | 28 | 0.6% |
| Science & Technology | 444 | 9.1% |
| Business | 1,062 | 21.8% |
| Education | 563 | 11.6% |
| Literature & Languages | 182 | 3.7% |
| Liberal Arts & History | 329 | 6.8% |
| Visual & Performing Arts | 146 | 3.0% |
| Communications | 271 | 5.6% |
| Arts & Humanities | 201 | 4.1% |
| Total | 4,876 | 100.0% |
Transportation & Commute in Winfield
Vehicle Availability by Sex in Winfield
The most prevalent vehicle ownership categories in Winfield are males with 2 vehicles (1,266, accounting for 44.2%) and females with 2 vehicles (1,044, making up 54.7%).
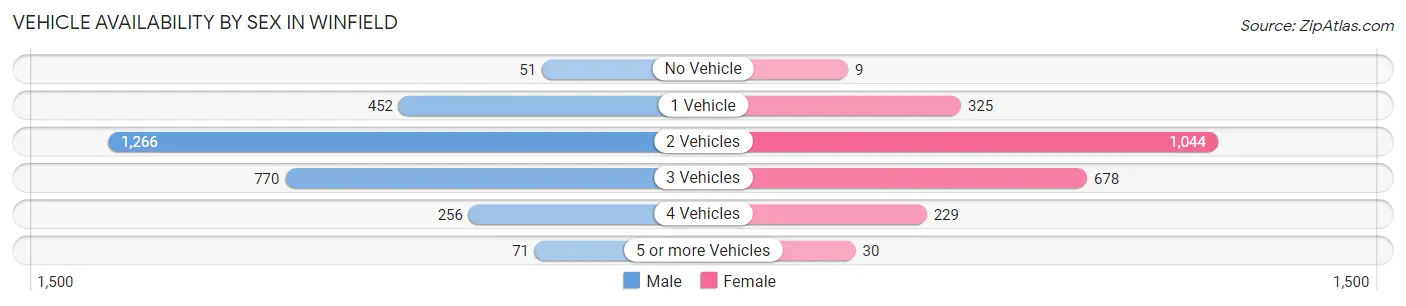
| Vehicles Available | Male | Female |
| No Vehicle | 51 (1.8%) | 9 (0.4%) |
| 1 Vehicle | 452 (15.8%) | 325 (14.0%) |
| 2 Vehicles | 1,266 (44.2%) | 1,044 (45.1%) |
| 3 Vehicles | 770 (26.9%) | 678 (29.3%) |
| 4 Vehicles | 256 (8.9%) | 229 (9.9%) |
| 5 or more Vehicles | 71 (2.5%) | 30 (1.3%) |
| Total | 2,866 (100.0%) | 2,315 (100.0%) |
Commute Time in Winfield
The most frequently occuring commute durations in Winfield are 5 to 9 minutes (619 commuters, 15.1%), 10 to 14 minutes (552 commuters, 13.5%), and 20 to 24 minutes (455 commuters, 11.1%).
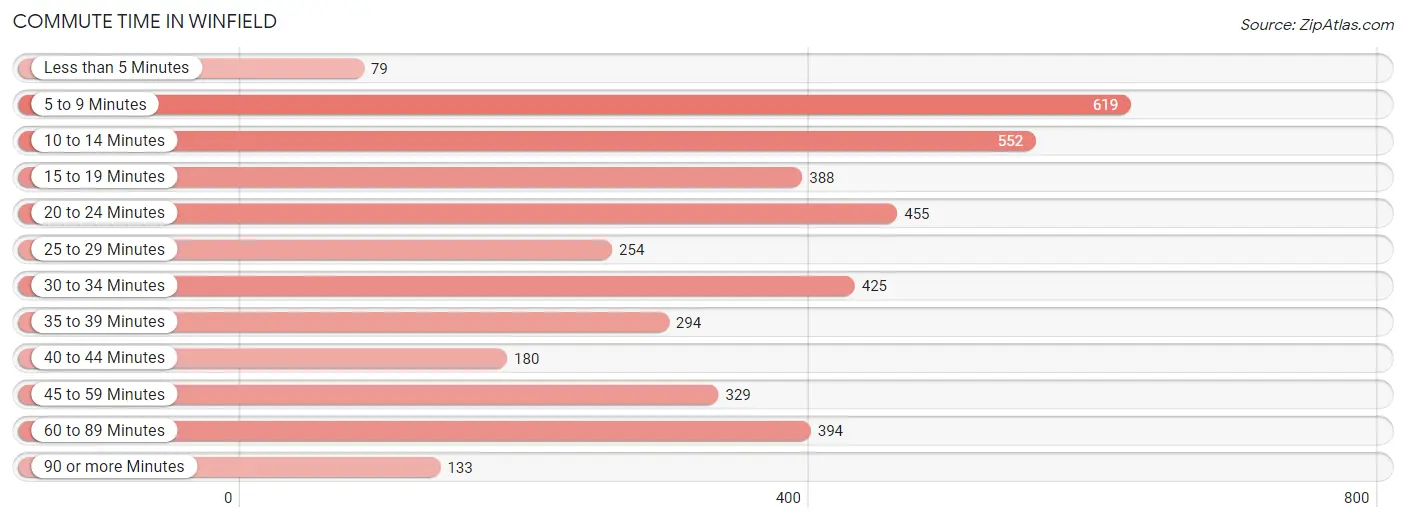
| Commute Time | # Commuters | % Commuters |
| Less than 5 Minutes | 79 | 1.9% |
| 5 to 9 Minutes | 619 | 15.1% |
| 10 to 14 Minutes | 552 | 13.5% |
| 15 to 19 Minutes | 388 | 9.5% |
| 20 to 24 Minutes | 455 | 11.1% |
| 25 to 29 Minutes | 254 | 6.2% |
| 30 to 34 Minutes | 425 | 10.4% |
| 35 to 39 Minutes | 294 | 7.2% |
| 40 to 44 Minutes | 180 | 4.4% |
| 45 to 59 Minutes | 329 | 8.0% |
| 60 to 89 Minutes | 394 | 9.6% |
| 90 or more Minutes | 133 | 3.2% |
Commute Time by Sex in Winfield
The most common commute times in Winfield are 5 to 9 minutes (318 commuters, 13.8%) for males and 5 to 9 minutes (301 commuters, 16.7%) for females.
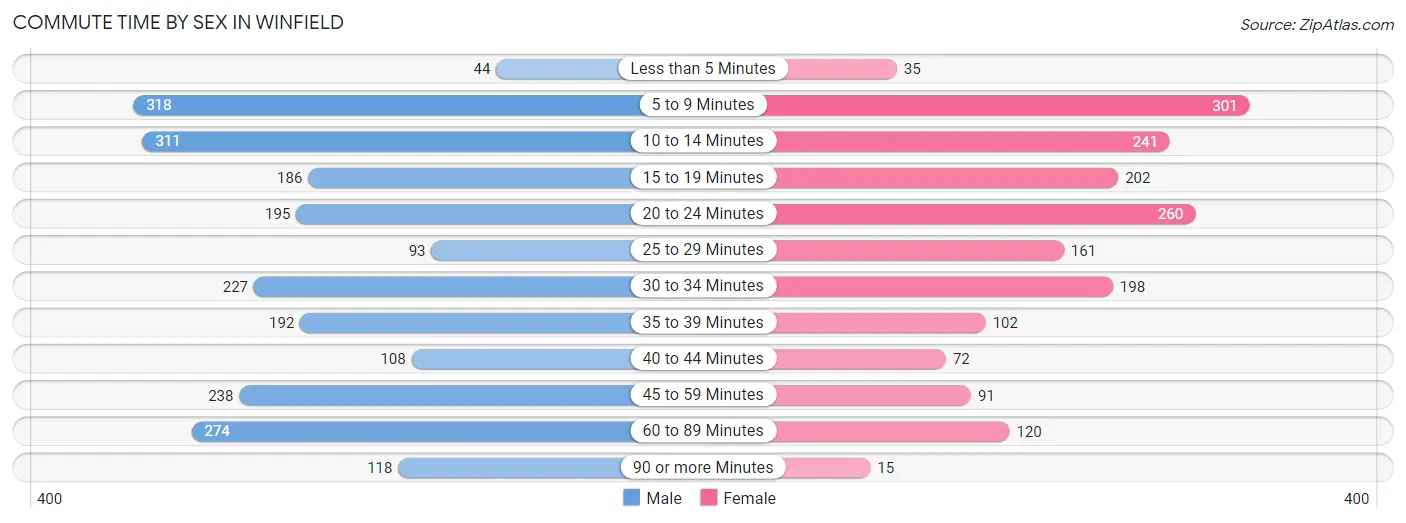
| Commute Time | Male | Female |
| Less than 5 Minutes | 44 (1.9%) | 35 (1.9%) |
| 5 to 9 Minutes | 318 (13.8%) | 301 (16.7%) |
| 10 to 14 Minutes | 311 (13.5%) | 241 (13.4%) |
| 15 to 19 Minutes | 186 (8.1%) | 202 (11.2%) |
| 20 to 24 Minutes | 195 (8.5%) | 260 (14.5%) |
| 25 to 29 Minutes | 93 (4.0%) | 161 (8.9%) |
| 30 to 34 Minutes | 227 (9.9%) | 198 (11.0%) |
| 35 to 39 Minutes | 192 (8.3%) | 102 (5.7%) |
| 40 to 44 Minutes | 108 (4.7%) | 72 (4.0%) |
| 45 to 59 Minutes | 238 (10.3%) | 91 (5.1%) |
| 60 to 89 Minutes | 274 (11.9%) | 120 (6.7%) |
| 90 or more Minutes | 118 (5.1%) | 15 (0.8%) |
Time of Departure to Work by Sex in Winfield
The most frequent times of departure to work in Winfield are 7:00 AM to 7:29 AM (307, 13.3%) for males and 7:30 AM to 7:59 AM (346, 19.2%) for females.
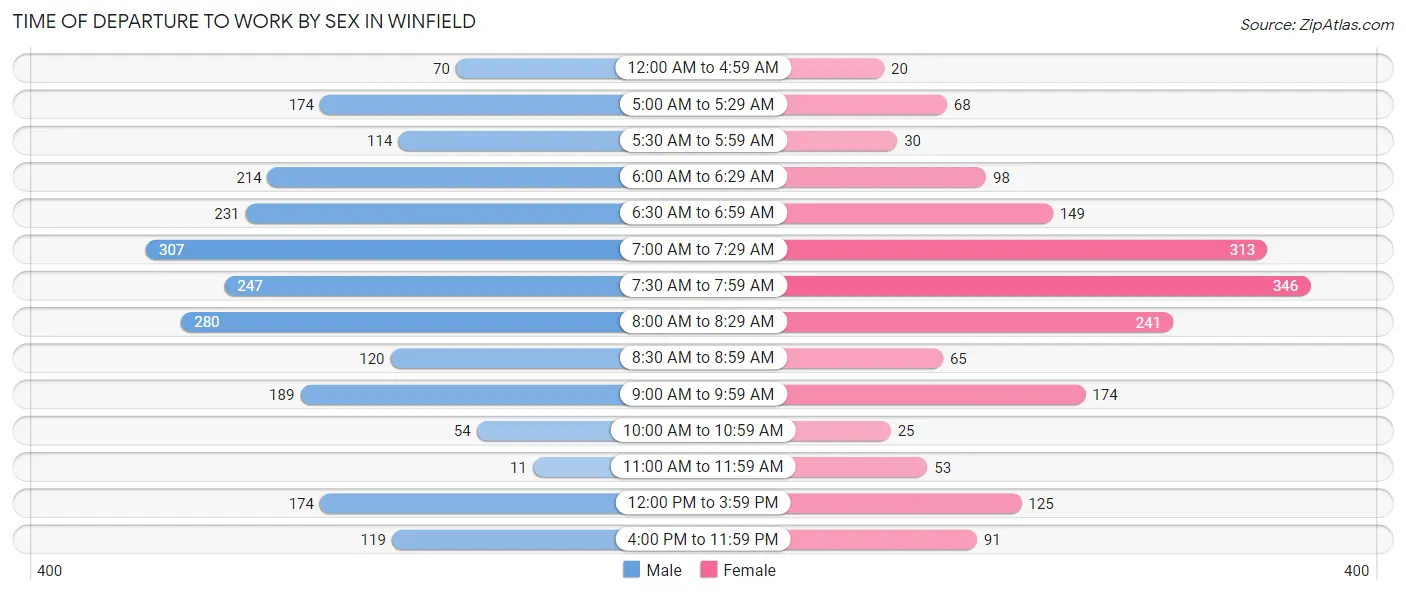
| Time of Departure | Male | Female |
| 12:00 AM to 4:59 AM | 70 (3.0%) | 20 (1.1%) |
| 5:00 AM to 5:29 AM | 174 (7.5%) | 68 (3.8%) |
| 5:30 AM to 5:59 AM | 114 (5.0%) | 30 (1.7%) |
| 6:00 AM to 6:29 AM | 214 (9.3%) | 98 (5.4%) |
| 6:30 AM to 6:59 AM | 231 (10.0%) | 149 (8.3%) |
| 7:00 AM to 7:29 AM | 307 (13.3%) | 313 (17.4%) |
| 7:30 AM to 7:59 AM | 247 (10.7%) | 346 (19.2%) |
| 8:00 AM to 8:29 AM | 280 (12.1%) | 241 (13.4%) |
| 8:30 AM to 8:59 AM | 120 (5.2%) | 65 (3.6%) |
| 9:00 AM to 9:59 AM | 189 (8.2%) | 174 (9.7%) |
| 10:00 AM to 10:59 AM | 54 (2.3%) | 25 (1.4%) |
| 11:00 AM to 11:59 AM | 11 (0.5%) | 53 (2.9%) |
| 12:00 PM to 3:59 PM | 174 (7.5%) | 125 (7.0%) |
| 4:00 PM to 11:59 PM | 119 (5.2%) | 91 (5.1%) |
| Total | 2,304 (100.0%) | 1,798 (100.0%) |
Housing Occupancy in Winfield
Occupancy by Ownership in Winfield
Of the total 3,931 dwellings in Winfield, owner-occupied units account for 3,638 (92.5%), while renter-occupied units make up 293 (7.4%).
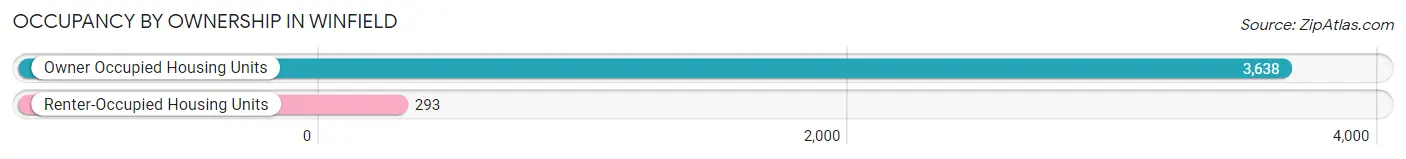
| Occupancy | # Housing Units | % Housing Units |
| Owner Occupied Housing Units | 3,638 | 92.5% |
| Renter-Occupied Housing Units | 293 | 7.4% |
| Total Occupied Housing Units | 3,931 | 100.0% |
Occupancy by Household Size in Winfield
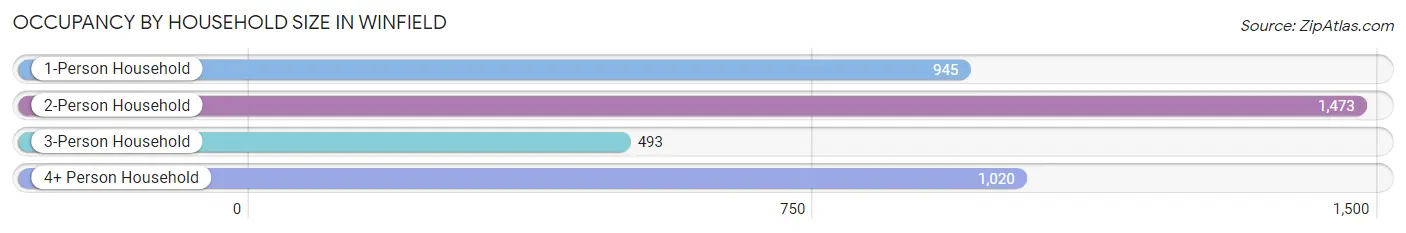
| Household Size | # Housing Units | % Housing Units |
| 1-Person Household | 945 | 24.0% |
| 2-Person Household | 1,473 | 37.5% |
| 3-Person Household | 493 | 12.5% |
| 4+ Person Household | 1,020 | 26.0% |
| Total Housing Units | 3,931 | 100.0% |
Occupancy by Ownership by Household Size in Winfield
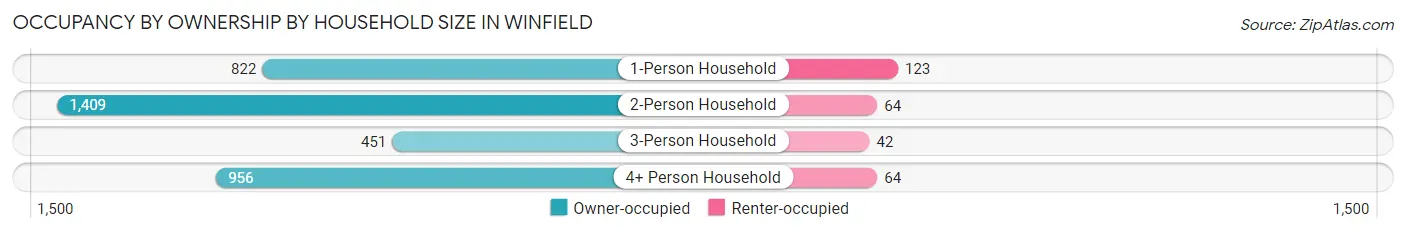
| Household Size | Owner-occupied | Renter-occupied |
| 1-Person Household | 822 (87.0%) | 123 (13.0%) |
| 2-Person Household | 1,409 (95.7%) | 64 (4.3%) |
| 3-Person Household | 451 (91.5%) | 42 (8.5%) |
| 4+ Person Household | 956 (93.7%) | 64 (6.3%) |
| Total Housing Units | 3,638 (92.5%) | 293 (7.4%) |
Occupancy by Educational Attainment in Winfield
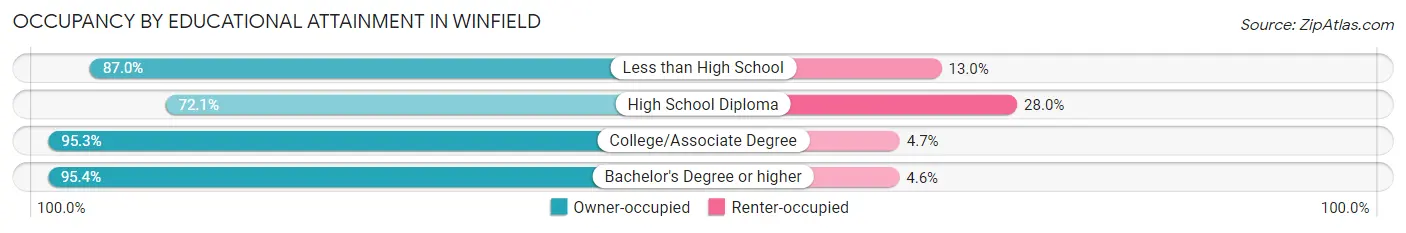
| Household Size | Owner-occupied | Renter-occupied |
| Less than High School | 47 (87.0%) | 7 (13.0%) |
| High School Diploma | 330 (72.1%) | 128 (28.0%) |
| College/Associate Degree | 831 (95.3%) | 41 (4.7%) |
| Bachelor's Degree or higher | 2,430 (95.4%) | 117 (4.6%) |
Occupancy by Age of Householder in Winfield
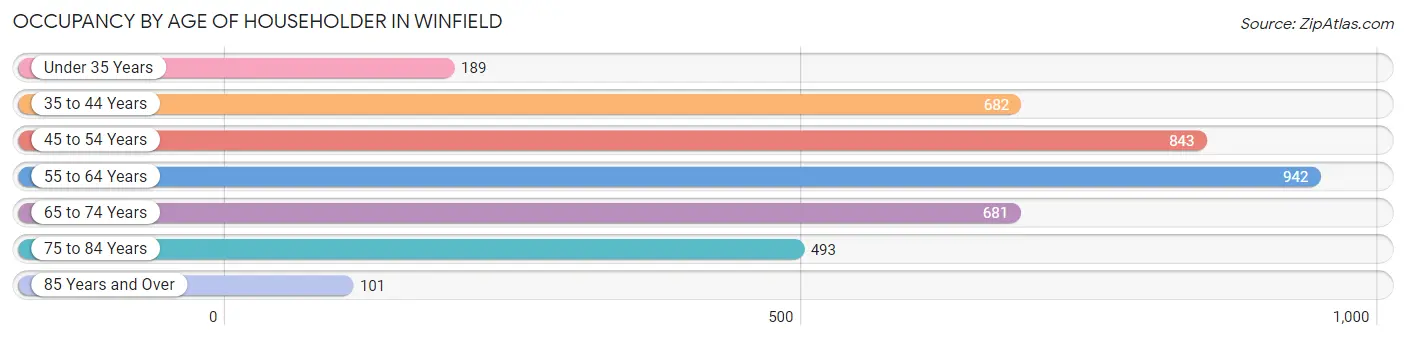
| Age Bracket | # Households | % Households |
| Under 35 Years | 189 | 4.8% |
| 35 to 44 Years | 682 | 17.3% |
| 45 to 54 Years | 843 | 21.4% |
| 55 to 64 Years | 942 | 24.0% |
| 65 to 74 Years | 681 | 17.3% |
| 75 to 84 Years | 493 | 12.5% |
| 85 Years and Over | 101 | 2.6% |
| Total | 3,931 | 100.0% |
Housing Finances in Winfield
Median Income by Occupancy in Winfield
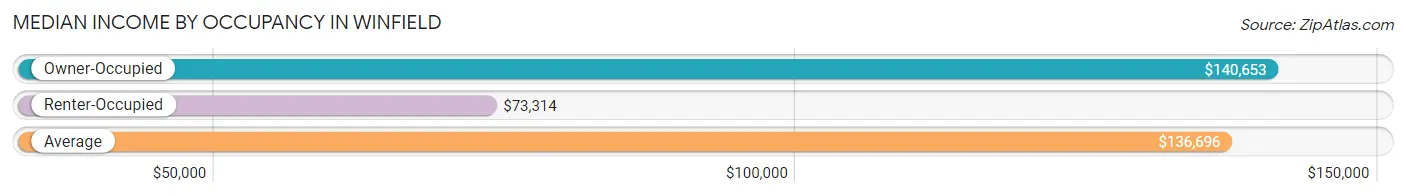
| Occupancy Type | # Households | Median Income |
| Owner-Occupied | 3,638 (92.5%) | $140,653 |
| Renter-Occupied | 293 (7.4%) | $73,314 |
| Average | 3,931 (100.0%) | $136,696 |
Occupancy by Householder Income Bracket in Winfield
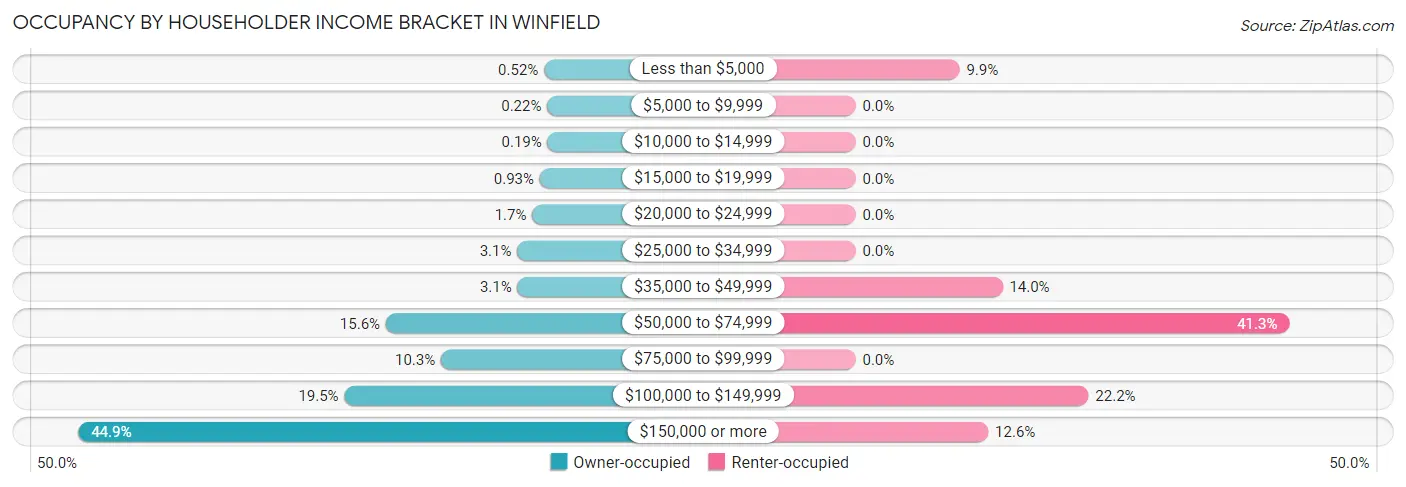
| Income Bracket | Owner-occupied | Renter-occupied |
| Less than $5,000 | 19 (0.5%) | 29 (9.9%) |
| $5,000 to $9,999 | 8 (0.2%) | 0 (0.0%) |
| $10,000 to $14,999 | 7 (0.2%) | 0 (0.0%) |
| $15,000 to $19,999 | 34 (0.9%) | 0 (0.0%) |
| $20,000 to $24,999 | 60 (1.7%) | 0 (0.0%) |
| $25,000 to $34,999 | 112 (3.1%) | 0 (0.0%) |
| $35,000 to $49,999 | 111 (3.0%) | 41 (14.0%) |
| $50,000 to $74,999 | 567 (15.6%) | 121 (41.3%) |
| $75,000 to $99,999 | 376 (10.3%) | 0 (0.0%) |
| $100,000 to $149,999 | 711 (19.5%) | 65 (22.2%) |
| $150,000 or more | 1,633 (44.9%) | 37 (12.6%) |
| Total | 3,638 (100.0%) | 293 (100.0%) |
Monthly Housing Cost Tiers in Winfield
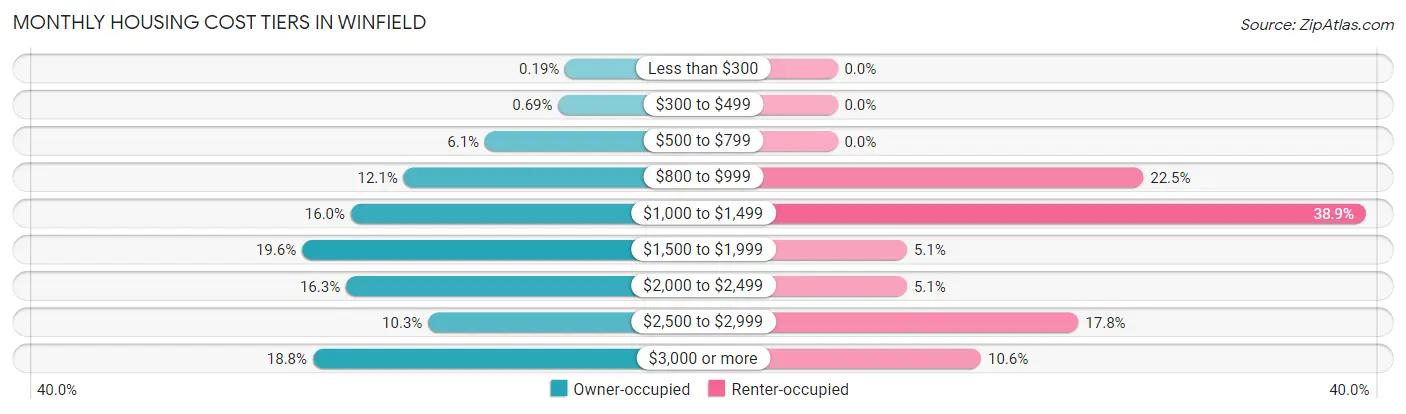
| Monthly Cost | Owner-occupied | Renter-occupied |
| Less than $300 | 7 (0.2%) | 0 (0.0%) |
| $300 to $499 | 25 (0.7%) | 0 (0.0%) |
| $500 to $799 | 222 (6.1%) | 0 (0.0%) |
| $800 to $999 | 440 (12.1%) | 66 (22.5%) |
| $1,000 to $1,499 | 581 (16.0%) | 114 (38.9%) |
| $1,500 to $1,999 | 712 (19.6%) | 15 (5.1%) |
| $2,000 to $2,499 | 594 (16.3%) | 15 (5.1%) |
| $2,500 to $2,999 | 374 (10.3%) | 52 (17.7%) |
| $3,000 or more | 683 (18.8%) | 31 (10.6%) |
| Total | 3,638 (100.0%) | 293 (100.0%) |
Physical Housing Characteristics in Winfield
Housing Structures in Winfield
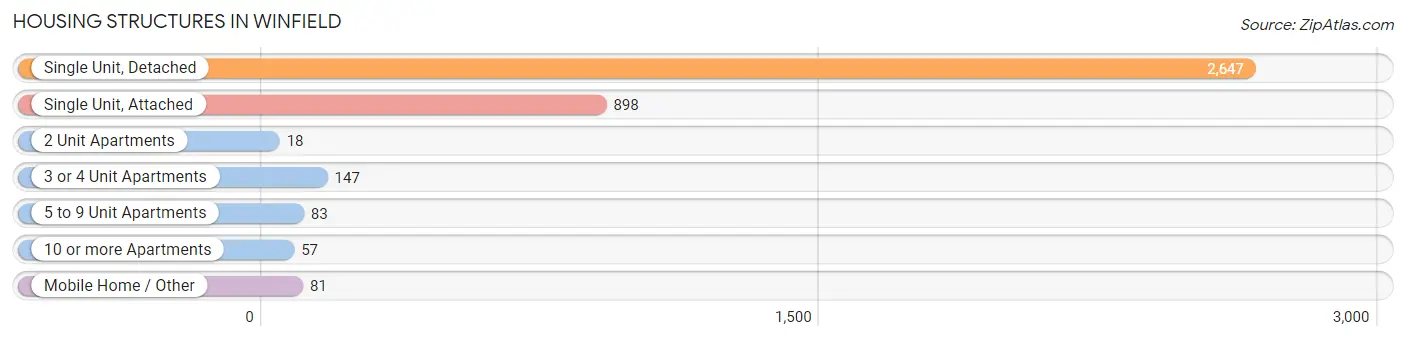
| Structure Type | # Housing Units | % Housing Units |
| Single Unit, Detached | 2,647 | 67.3% |
| Single Unit, Attached | 898 | 22.8% |
| 2 Unit Apartments | 18 | 0.5% |
| 3 or 4 Unit Apartments | 147 | 3.7% |
| 5 to 9 Unit Apartments | 83 | 2.1% |
| 10 or more Apartments | 57 | 1.5% |
| Mobile Home / Other | 81 | 2.1% |
| Total | 3,931 | 100.0% |
Housing Structures by Occupancy in Winfield
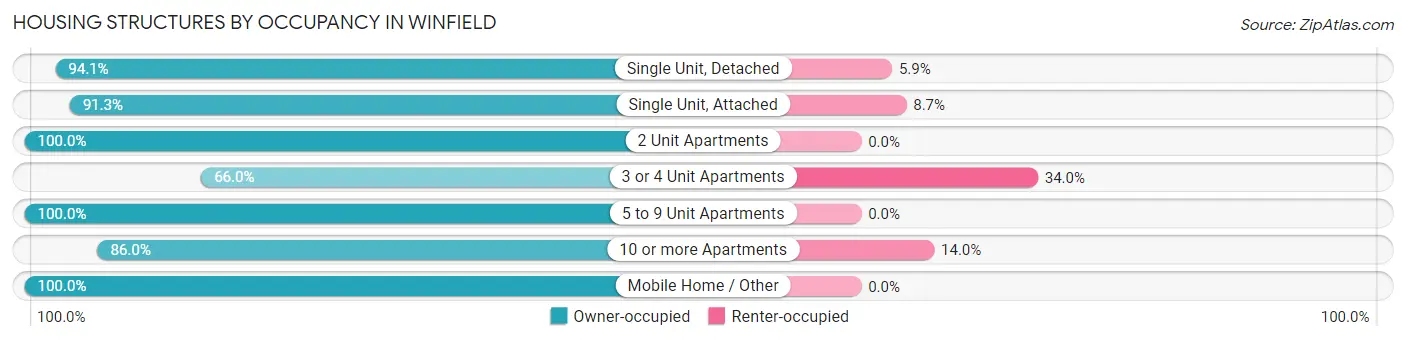
| Structure Type | Owner-occupied | Renter-occupied |
| Single Unit, Detached | 2,490 (94.1%) | 157 (5.9%) |
| Single Unit, Attached | 820 (91.3%) | 78 (8.7%) |
| 2 Unit Apartments | 18 (100.0%) | 0 (0.0%) |
| 3 or 4 Unit Apartments | 97 (66.0%) | 50 (34.0%) |
| 5 to 9 Unit Apartments | 83 (100.0%) | 0 (0.0%) |
| 10 or more Apartments | 49 (86.0%) | 8 (14.0%) |
| Mobile Home / Other | 81 (100.0%) | 0 (0.0%) |
| Total | 3,638 (92.5%) | 293 (7.4%) |
Housing Structures by Number of Rooms in Winfield
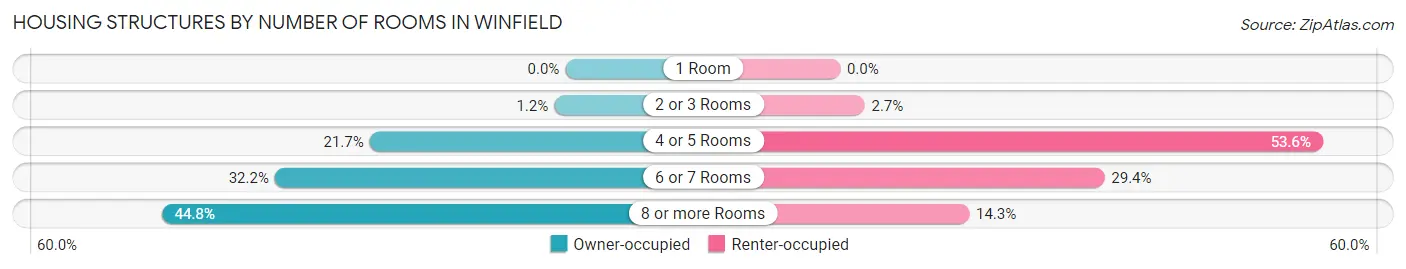
| Number of Rooms | Owner-occupied | Renter-occupied |
| 1 Room | 0 (0.0%) | 0 (0.0%) |
| 2 or 3 Rooms | 45 (1.2%) | 8 (2.7%) |
| 4 or 5 Rooms | 790 (21.7%) | 157 (53.6%) |
| 6 or 7 Rooms | 1,173 (32.2%) | 86 (29.3%) |
| 8 or more Rooms | 1,630 (44.8%) | 42 (14.3%) |
| Total | 3,638 (100.0%) | 293 (100.0%) |
Housing Structure by Heating Type in Winfield
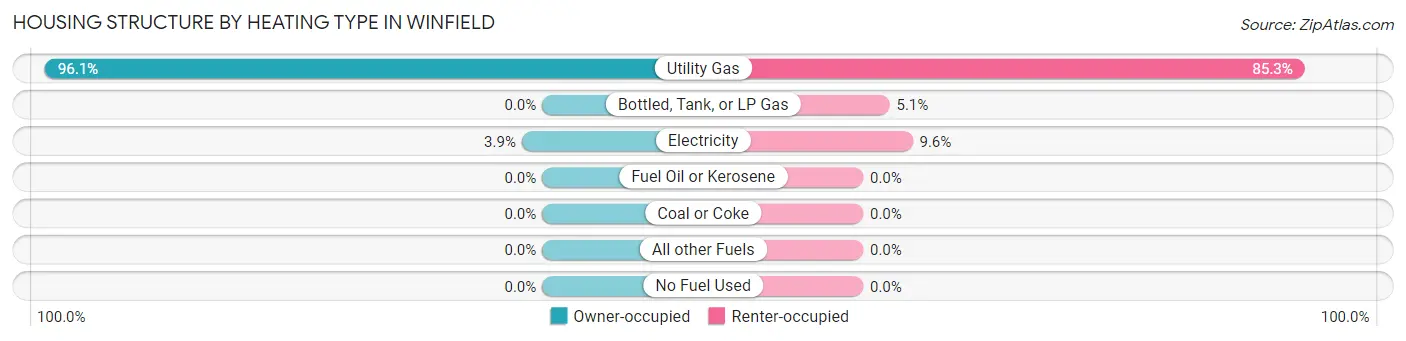
| Heating Type | Owner-occupied | Renter-occupied |
| Utility Gas | 3,495 (96.1%) | 250 (85.3%) |
| Bottled, Tank, or LP Gas | 0 (0.0%) | 15 (5.1%) |
| Electricity | 143 (3.9%) | 28 (9.6%) |
| Fuel Oil or Kerosene | 0 (0.0%) | 0 (0.0%) |
| Coal or Coke | 0 (0.0%) | 0 (0.0%) |
| All other Fuels | 0 (0.0%) | 0 (0.0%) |
| No Fuel Used | 0 (0.0%) | 0 (0.0%) |
| Total | 3,638 (100.0%) | 293 (100.0%) |
Household Vehicle Usage in Winfield
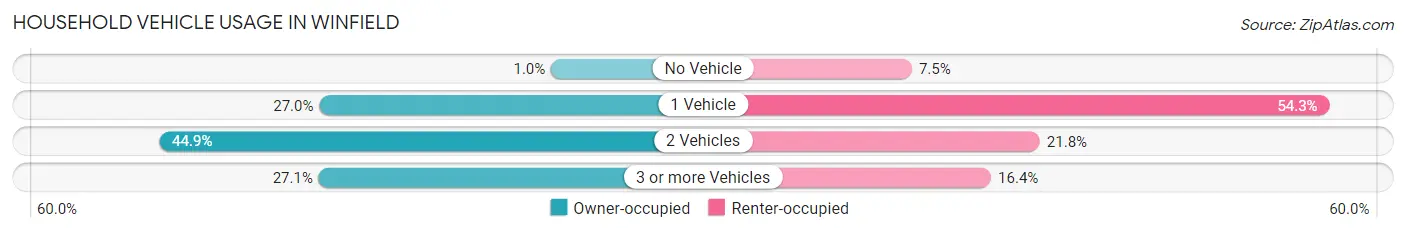
| Vehicles per Household | Owner-occupied | Renter-occupied |
| No Vehicle | 37 (1.0%) | 22 (7.5%) |
| 1 Vehicle | 982 (27.0%) | 159 (54.3%) |
| 2 Vehicles | 1,635 (44.9%) | 64 (21.8%) |
| 3 or more Vehicles | 984 (27.1%) | 48 (16.4%) |
| Total | 3,638 (100.0%) | 293 (100.0%) |
Real Estate & Mortgages in Winfield
Real Estate and Mortgage Overview in Winfield
| Characteristic | Without Mortgage | With Mortgage |
| Housing Units | 1,259 | 2,379 |
| Median Property Value | $338,000 | $356,200 |
| Median Household Income | $86,594 | $1,344 |
| Monthly Housing Costs | $968 | $673 |
| Real Estate Taxes | $7,158 | $0 |
Property Value by Mortgage Status in Winfield
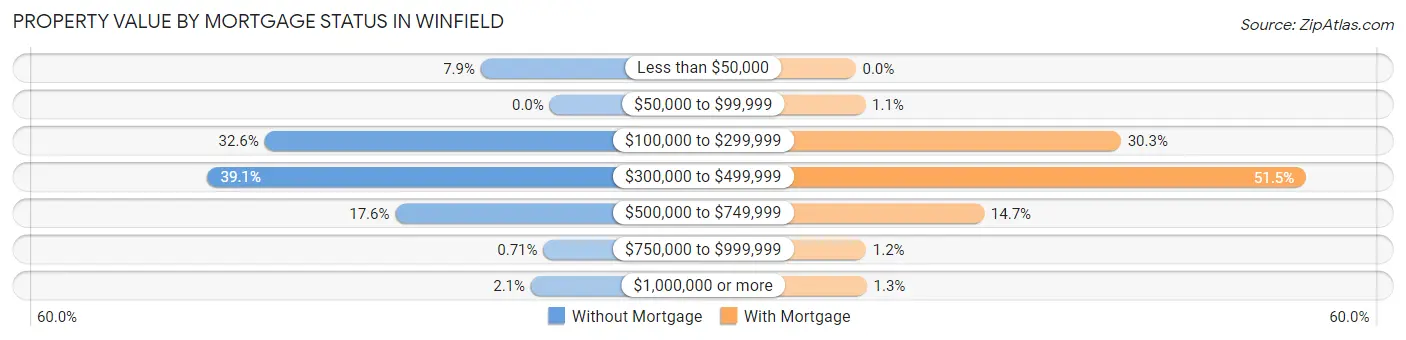
| Property Value | Without Mortgage | With Mortgage |
| Less than $50,000 | 99 (7.9%) | 0 (0.0%) |
| $50,000 to $99,999 | 0 (0.0%) | 26 (1.1%) |
| $100,000 to $299,999 | 410 (32.6%) | 721 (30.3%) |
| $300,000 to $499,999 | 492 (39.1%) | 1,225 (51.5%) |
| $500,000 to $749,999 | 222 (17.6%) | 349 (14.7%) |
| $750,000 to $999,999 | 9 (0.7%) | 28 (1.2%) |
| $1,000,000 or more | 27 (2.1%) | 30 (1.3%) |
| Total | 1,259 (100.0%) | 2,379 (100.0%) |
Household Income by Mortgage Status in Winfield
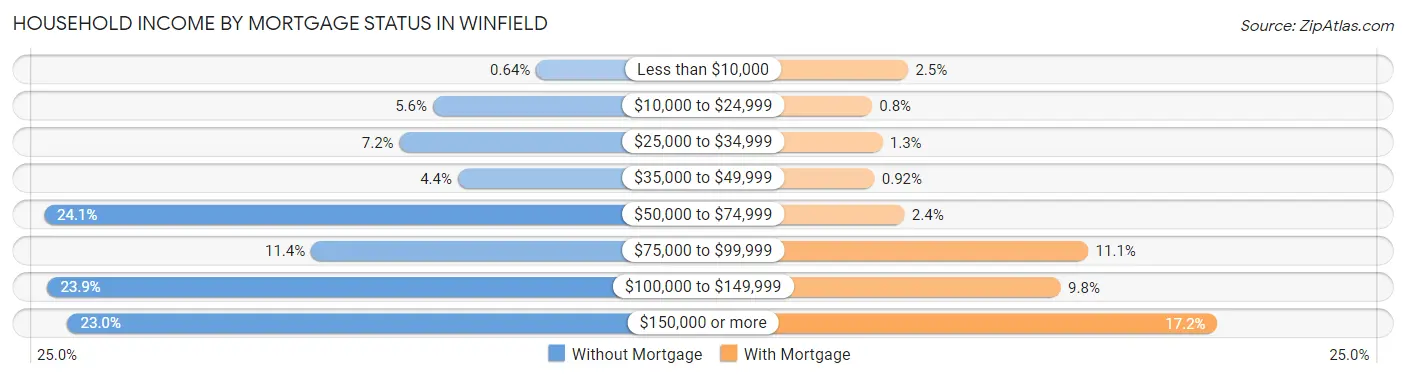
| Household Income | Without Mortgage | With Mortgage |
| Less than $10,000 | 8 (0.6%) | 60 (2.5%) |
| $10,000 to $24,999 | 70 (5.6%) | 19 (0.8%) |
| $25,000 to $34,999 | 90 (7.1%) | 31 (1.3%) |
| $35,000 to $49,999 | 55 (4.4%) | 22 (0.9%) |
| $50,000 to $74,999 | 303 (24.1%) | 56 (2.4%) |
| $75,000 to $99,999 | 143 (11.4%) | 264 (11.1%) |
| $100,000 to $149,999 | 301 (23.9%) | 233 (9.8%) |
| $150,000 or more | 289 (23.0%) | 410 (17.2%) |
| Total | 1,259 (100.0%) | 2,379 (100.0%) |
Property Value to Household Income Ratio in Winfield
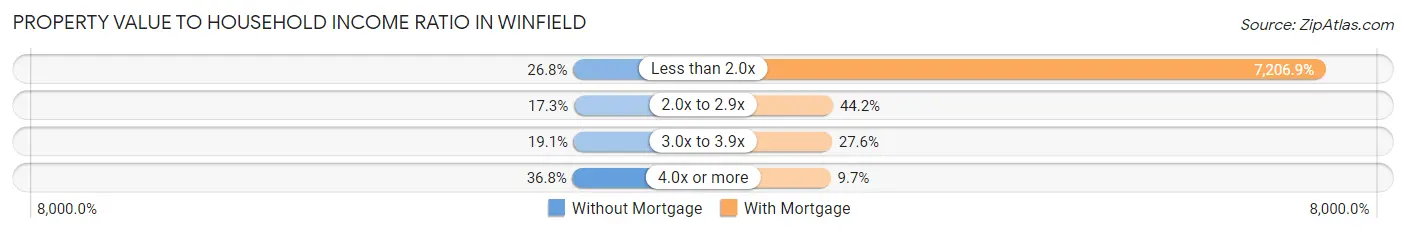
| Value-to-Income Ratio | Without Mortgage | With Mortgage |
| Less than 2.0x | 337 (26.8%) | 171,453 (7,206.9%) |
| 2.0x to 2.9x | 218 (17.3%) | 1,052 (44.2%) |
| 3.0x to 3.9x | 241 (19.1%) | 657 (27.6%) |
| 4.0x or more | 463 (36.8%) | 231 (9.7%) |
| Total | 1,259 (100.0%) | 2,379 (100.0%) |
Real Estate Taxes by Mortgage Status in Winfield
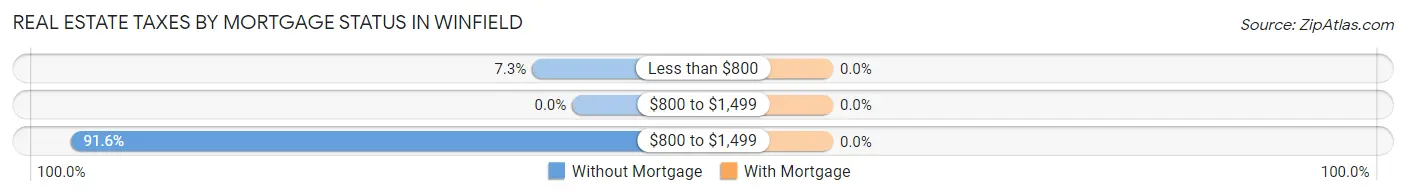
| Property Taxes | Without Mortgage | With Mortgage |
| Less than $800 | 92 (7.3%) | 0 (0.0%) |
| $800 to $1,499 | 0 (0.0%) | 0 (0.0%) |
| $800 to $1,499 | 1,153 (91.6%) | 0 (0.0%) |
| Total | 1,259 (100.0%) | 2,379 (100.0%) |
Health & Disability in Winfield
Health Insurance Coverage by Age in Winfield
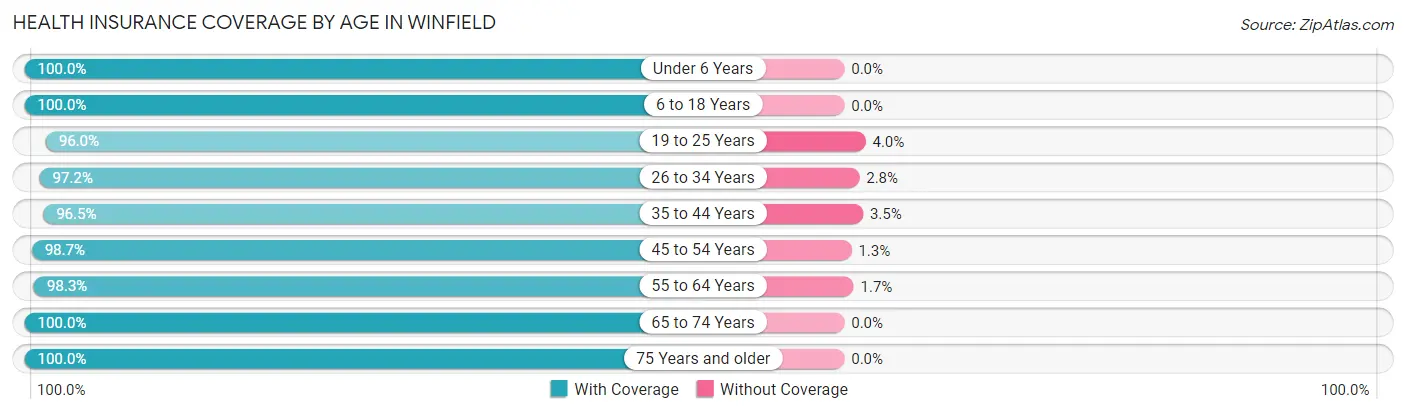
| Age Bracket | With Coverage | Without Coverage |
| Under 6 Years | 567 (100.0%) | 0 (0.0%) |
| 6 to 18 Years | 1,643 (100.0%) | 0 (0.0%) |
| 19 to 25 Years | 558 (96.0%) | 23 (4.0%) |
| 26 to 34 Years | 555 (97.2%) | 16 (2.8%) |
| 35 to 44 Years | 1,331 (96.5%) | 48 (3.5%) |
| 45 to 54 Years | 1,413 (98.7%) | 19 (1.3%) |
| 55 to 64 Years | 1,697 (98.3%) | 30 (1.7%) |
| 65 to 74 Years | 1,140 (100.0%) | 0 (0.0%) |
| 75 Years and older | 907 (100.0%) | 0 (0.0%) |
| Total | 9,811 (98.6%) | 136 (1.4%) |
Health Insurance Coverage by Citizenship Status in Winfield
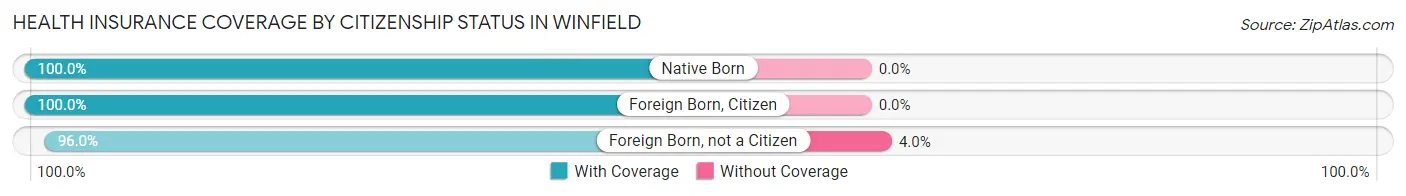
| Citizenship Status | With Coverage | Without Coverage |
| Native Born | 567 (100.0%) | 0 (0.0%) |
| Foreign Born, Citizen | 1,643 (100.0%) | 0 (0.0%) |
| Foreign Born, not a Citizen | 558 (96.0%) | 23 (4.0%) |
Health Insurance Coverage by Household Income in Winfield
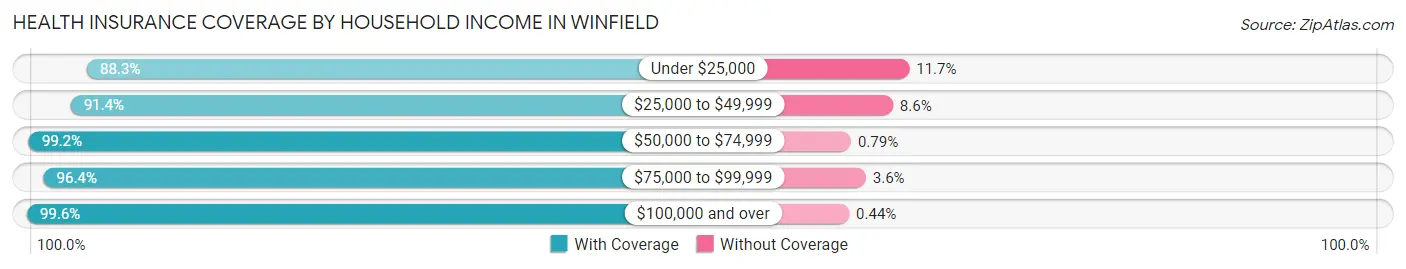
| Household Income | With Coverage | Without Coverage |
| Under $25,000 | 181 (88.3%) | 24 (11.7%) |
| $25,000 to $49,999 | 423 (91.4%) | 40 (8.6%) |
| $50,000 to $74,999 | 1,136 (99.2%) | 9 (0.8%) |
| $75,000 to $99,999 | 838 (96.4%) | 31 (3.6%) |
| $100,000 and over | 7,233 (99.6%) | 32 (0.4%) |
Public vs Private Health Insurance Coverage by Age in Winfield
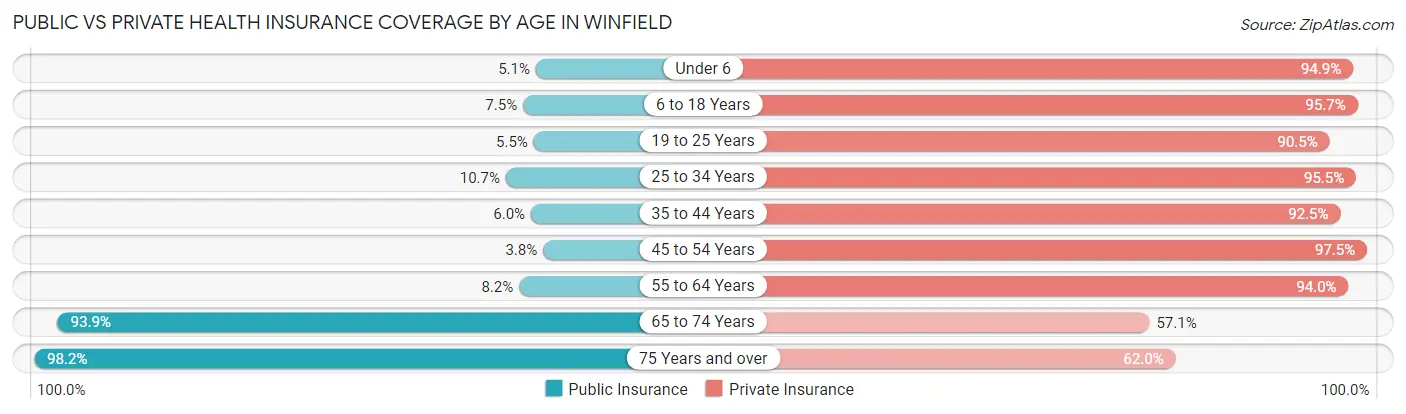
| Age Bracket | Public Insurance | Private Insurance |
| Under 6 | 29 (5.1%) | 538 (94.9%) |
| 6 to 18 Years | 123 (7.5%) | 1,573 (95.7%) |
| 19 to 25 Years | 32 (5.5%) | 526 (90.5%) |
| 25 to 34 Years | 61 (10.7%) | 545 (95.5%) |
| 35 to 44 Years | 83 (6.0%) | 1,276 (92.5%) |
| 45 to 54 Years | 54 (3.8%) | 1,396 (97.5%) |
| 55 to 64 Years | 142 (8.2%) | 1,624 (94.0%) |
| 65 to 74 Years | 1,070 (93.9%) | 651 (57.1%) |
| 75 Years and over | 891 (98.2%) | 562 (62.0%) |
| Total | 2,485 (25.0%) | 8,691 (87.4%) |
Disability Status by Sex by Age in Winfield
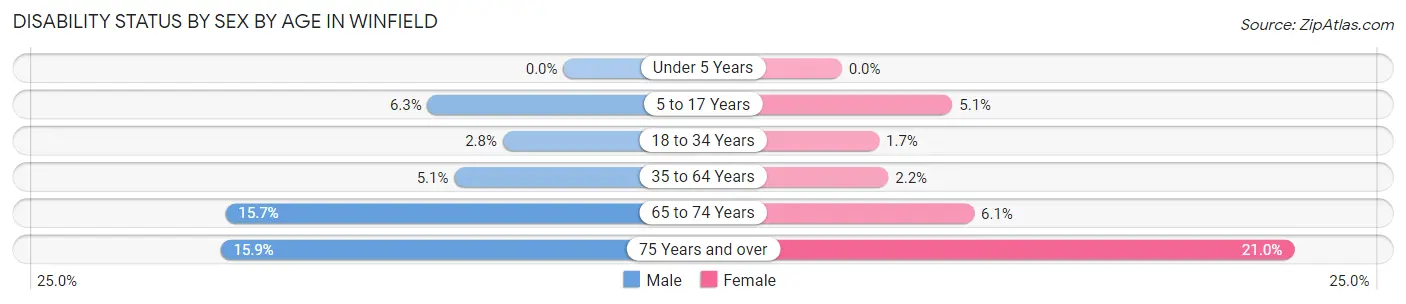
| Age Bracket | Male | Female |
| Under 5 Years | 0 (0.0%) | 0 (0.0%) |
| 5 to 17 Years | 50 (6.3%) | 42 (5.1%) |
| 18 to 34 Years | 20 (2.8%) | 10 (1.7%) |
| 35 to 64 Years | 122 (5.1%) | 46 (2.2%) |
| 65 to 74 Years | 69 (15.7%) | 43 (6.1%) |
| 75 Years and over | 67 (15.9%) | 102 (21.0%) |
Disability Class by Sex by Age in Winfield
Disability Class: Hearing Difficulty
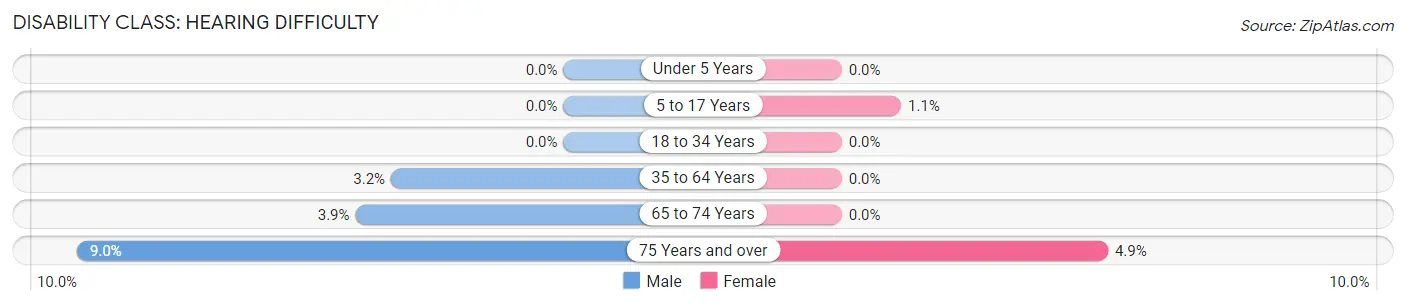
| Age Bracket | Male | Female |
| Under 5 Years | 0 (0.0%) | 0 (0.0%) |
| 5 to 17 Years | 0 (0.0%) | 9 (1.1%) |
| 18 to 34 Years | 0 (0.0%) | 0 (0.0%) |
| 35 to 64 Years | 77 (3.2%) | 0 (0.0%) |
| 65 to 74 Years | 17 (3.9%) | 0 (0.0%) |
| 75 Years and over | 38 (9.0%) | 24 (4.9%) |
Disability Class: Vision Difficulty
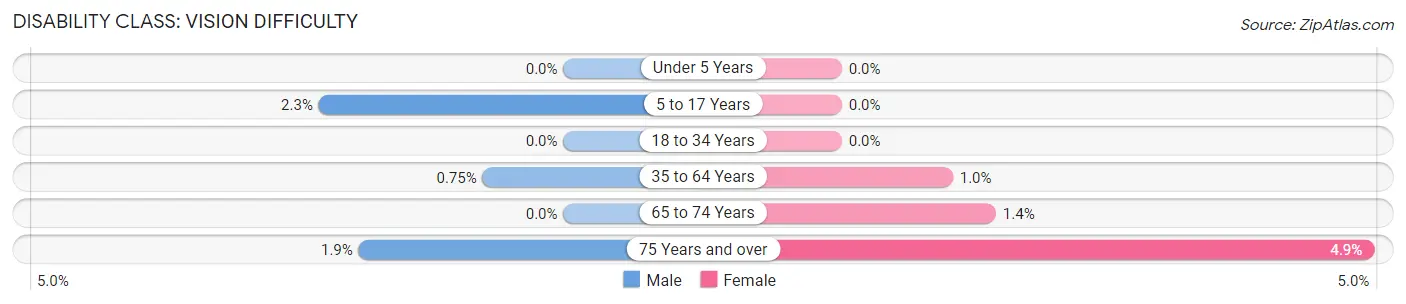
| Age Bracket | Male | Female |
| Under 5 Years | 0 (0.0%) | 0 (0.0%) |
| 5 to 17 Years | 18 (2.3%) | 0 (0.0%) |
| 18 to 34 Years | 0 (0.0%) | 0 (0.0%) |
| 35 to 64 Years | 18 (0.7%) | 22 (1.0%) |
| 65 to 74 Years | 0 (0.0%) | 10 (1.4%) |
| 75 Years and over | 8 (1.9%) | 24 (4.9%) |
Disability Class: Cognitive Difficulty
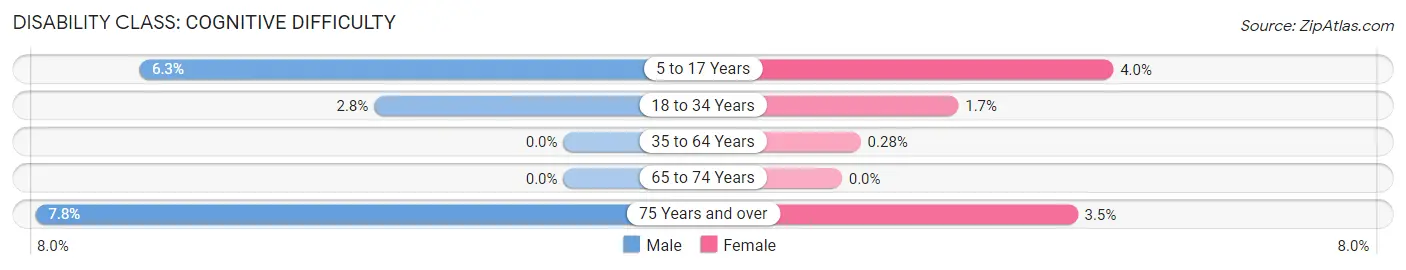
| Age Bracket | Male | Female |
| 5 to 17 Years | 50 (6.3%) | 33 (4.0%) |
| 18 to 34 Years | 20 (2.8%) | 10 (1.7%) |
| 35 to 64 Years | 0 (0.0%) | 6 (0.3%) |
| 65 to 74 Years | 0 (0.0%) | 0 (0.0%) |
| 75 Years and over | 33 (7.8%) | 17 (3.5%) |
Disability Class: Ambulatory Difficulty
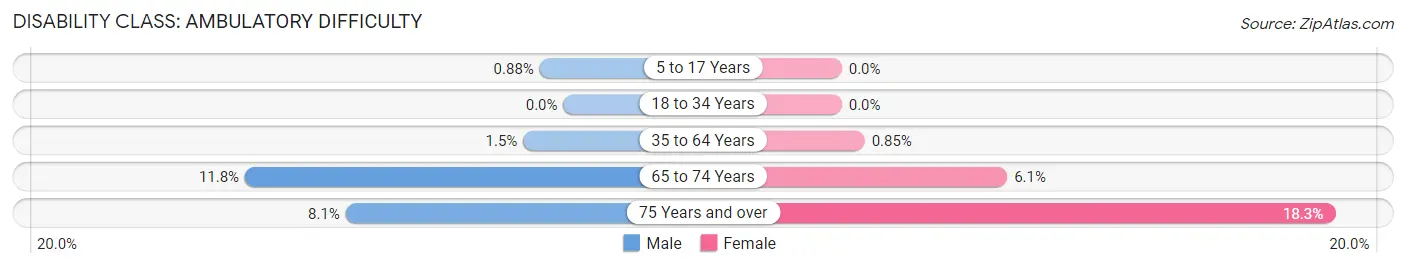
| Age Bracket | Male | Female |
| 5 to 17 Years | 7 (0.9%) | 0 (0.0%) |
| 18 to 34 Years | 0 (0.0%) | 0 (0.0%) |
| 35 to 64 Years | 36 (1.5%) | 18 (0.9%) |
| 65 to 74 Years | 52 (11.8%) | 43 (6.1%) |
| 75 Years and over | 34 (8.1%) | 89 (18.3%) |
Disability Class: Self-Care Difficulty
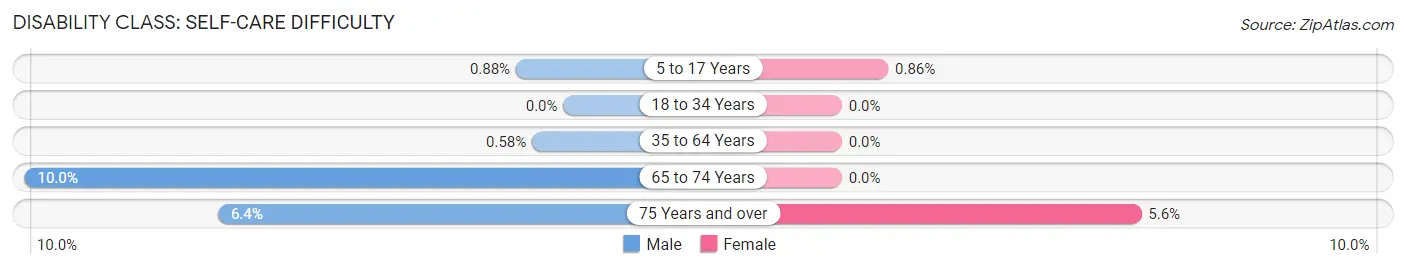
| Age Bracket | Male | Female |
| 5 to 17 Years | 7 (0.9%) | 7 (0.9%) |
| 18 to 34 Years | 0 (0.0%) | 0 (0.0%) |
| 35 to 64 Years | 14 (0.6%) | 0 (0.0%) |
| 65 to 74 Years | 44 (10.0%) | 0 (0.0%) |
| 75 Years and over | 27 (6.4%) | 27 (5.6%) |
Technology Access in Winfield
Computing Device Access in Winfield
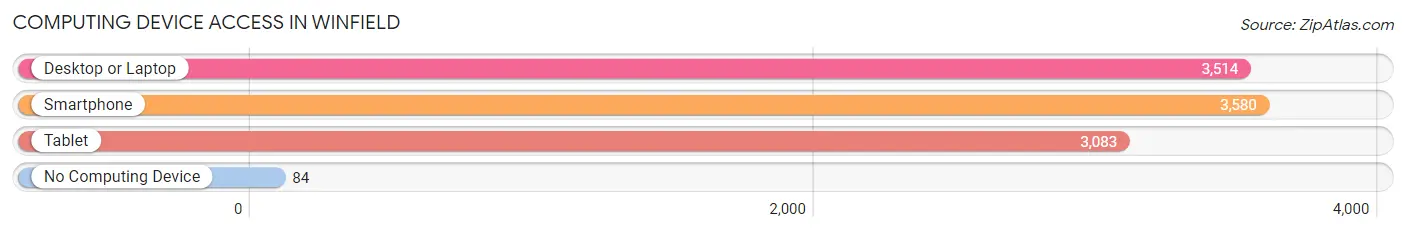
| Device Type | # Households | % Households |
| Desktop or Laptop | 3,514 | 89.4% |
| Smartphone | 3,580 | 91.1% |
| Tablet | 3,083 | 78.4% |
| No Computing Device | 84 | 2.1% |
| Total | 3,931 | 100.0% |
Internet Access in Winfield
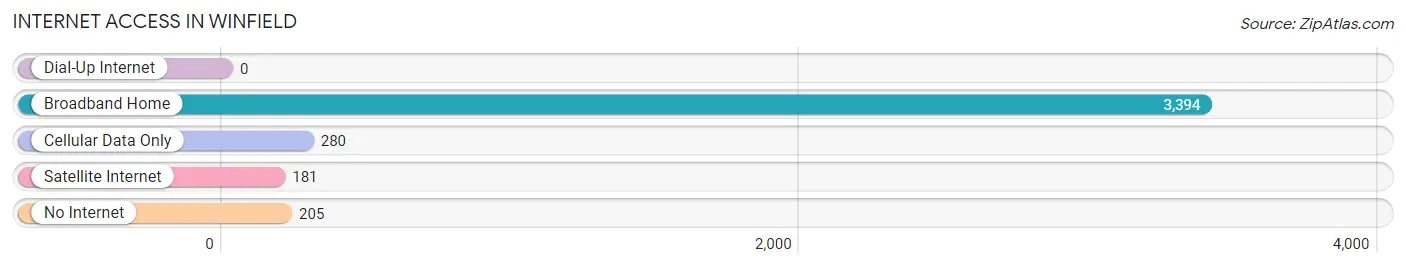
| Internet Type | # Households | % Households |
| Dial-Up Internet | 0 | 0.0% |
| Broadband Home | 3,394 | 86.3% |
| Cellular Data Only | 280 | 7.1% |
| Satellite Internet | 181 | 4.6% |
| No Internet | 205 | 5.2% |
| Total | 3,931 | 100.0% |
Winfield Summary
Winfield, Illinois is a village located in DuPage County, Illinois, United States. It is a western suburb of Chicago, located approximately 30 miles from the city. The population of Winfield was 9,719 at the 2010 census.
History
The area that is now Winfield was first settled in the 1830s by a group of German immigrants. The village was originally known as Dutchman’s Point, and was later renamed Winfield in 1854 after a local landowner, William Winfield Scott. The village was officially incorporated in 1867.
In the late 19th century, Winfield was a popular destination for wealthy Chicagoans looking to escape the city. The village was home to several large estates, including the estate of Cyrus McCormick, the inventor of the mechanical reaper.
Geography
Winfield is located in DuPage County, Illinois, approximately 30 miles west of Chicago. The village is situated on the western edge of the Chicago metropolitan area. The village is bordered by the villages of West Chicago to the north, Wheaton to the east, Warrenville to the south, and Geneva to the west.
The village is located on the DuPage River, which flows through the center of the village. The village is also located near the intersection of two major highways, Interstate 88 and Illinois Route 59.
Economy
The economy of Winfield is largely based on the service industry. The village is home to several large employers, including the Winfield Public Library, the Winfield Park District, and the Winfield Fire Protection District.
The village is also home to several small businesses, including restaurants, retail stores, and professional services. The village is also home to several industrial parks, which provide employment opportunities for local residents.
Demographics
As of the 2010 census, the population of Winfield was 9,719. The racial makeup of the village was 87.3% White, 4.2% African American, 0.3% Native American, 4.2% Asian, and 4.0% from other races. Hispanic or Latino of any race were 8.7% of the population.
The median household income in Winfield was $87,945, and the median family income was $103,945. The per capita income for the village was $41,945. About 4.2% of families and 5.3% of the population were below the poverty line, including 6.2% of those under age 18 and 4.2% of those age 65 or over.
Winfield is served by several school districts, including the Winfield School District, the Wheaton-Warrenville Community Unit School District 200, and the West Chicago Community Unit School District 94. The village is also home to several private schools, including St. John Lutheran School and St. Michael Catholic School.
Common Questions
What is Per Capita Income in Winfield?
Per Capita income in Winfield is $60,931.
What is the Median Family Income in Winfield?
Median Family Income in Winfield is $159,483.
What is the Median Household income in Winfield?
Median Household Income in Winfield is $136,696.
What is Income or Wage Gap in Winfield?
Income or Wage Gap in Winfield is 25.1%.
Women in Winfield earn 74.9 cents for every dollar earned by a man.
What is Inequality or Gini Index in Winfield?
Inequality or Gini Index in Winfield is 0.38.
What is the Total Population of Winfield?
Total Population of Winfield is 9,947.
What is the Total Male Population of Winfield?
Total Male Population of Winfield is 5,086.
What is the Total Female Population of Winfield?
Total Female Population of Winfield is 4,861.
What is the Ratio of Males per 100 Females in Winfield?
There are 104.63 Males per 100 Females in Winfield.
What is the Ratio of Females per 100 Males in Winfield?
There are 95.58 Females per 100 Males in Winfield.
What is the Median Population Age in Winfield?
Median Population Age in Winfield is 48.2 Years.
What is the Average Family Size in Winfield
Average Family Size in Winfield is 3.0 People.
What is the Average Household Size in Winfield
Average Household Size in Winfield is 2.5 People.
How Large is the Labor Force in Winfield?
There are 5,447 People in the Labor Forcein in Winfield.
What is the Percentage of People in the Labor Force in Winfield?
66.6% of People are in the Labor Force in Winfield.
What is the Unemployment Rate in Winfield?
Unemployment Rate in Winfield is 4.5%.