Cities with the Highest Percentage of Population Employed in Legal Services & Support in South Carolina
RELATED REPORTS & OPTIONS
Legal Services & Support
South Carolina
Compare Cities
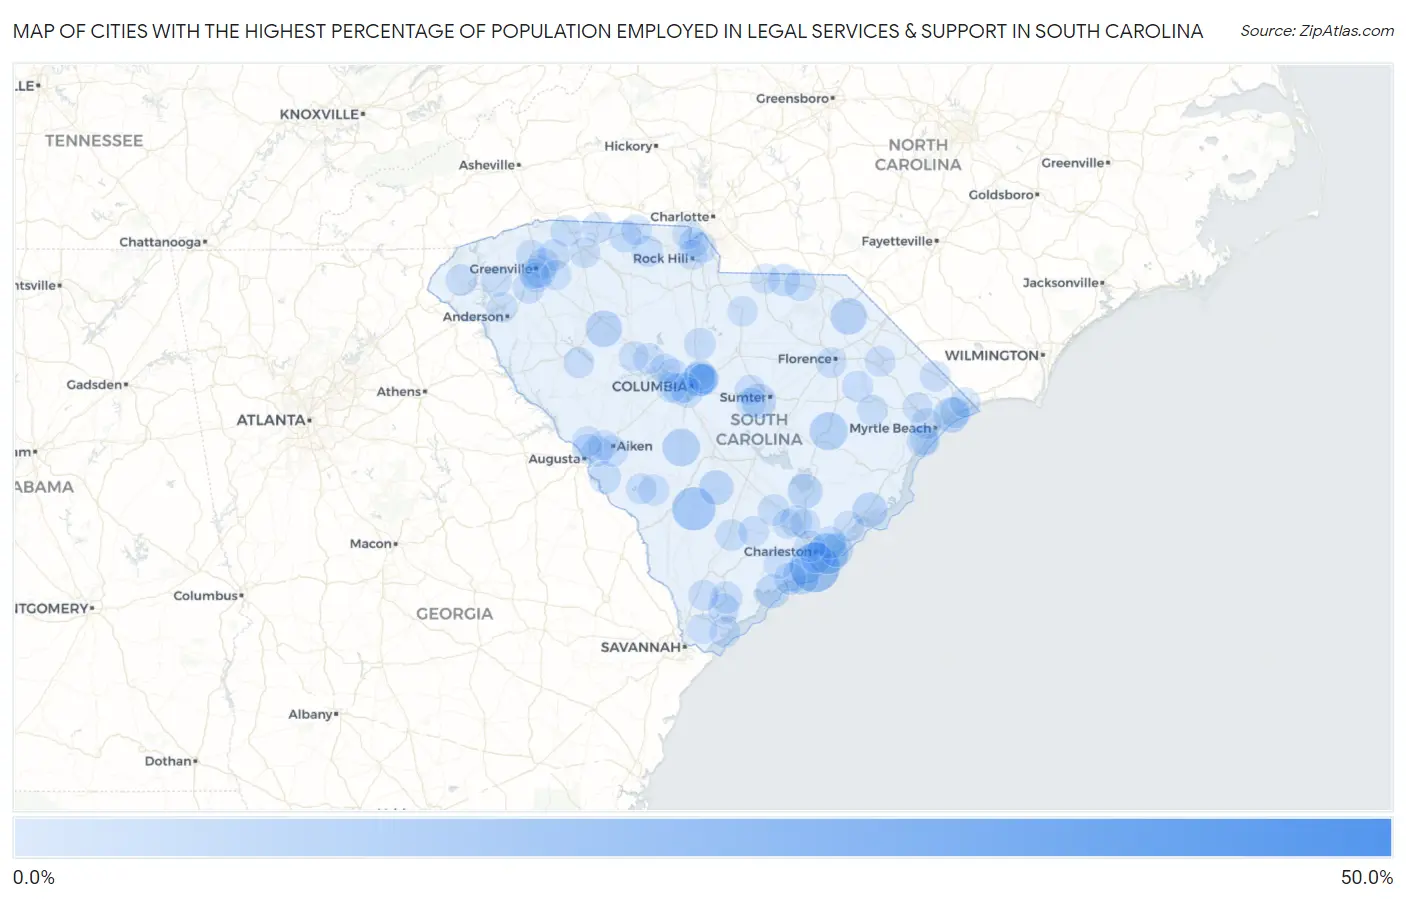
Map of Cities with the Highest Percentage of Population Employed in Legal Services & Support in South Carolina
0.0%
50.0%
Cities with the Highest Percentage of Population Employed in Legal Services & Support in South Carolina
| City | % Employed | vs State | vs National | |
| 1. | Caesars Head | 46.2% | 0.97%(+45.2)#1 | 1.2%(+45.0)#11 |
| 2. | Folly Beach | 19.2% | 0.97%(+18.2)#2 | 1.2%(+18.0)#63 |
| 3. | Ehrhardt | 13.3% | 0.97%(+12.3)#3 | 1.2%(+12.1)#137 |
| 4. | Sullivan S Island | 11.1% | 0.97%(+10.2)#4 | 1.2%(+9.96)#179 |
| 5. | Kingstree | 8.1% | 0.97%(+7.17)#5 | 1.2%(+6.96)#332 |
| 6. | Debordieu Colony | 8.0% | 0.97%(+7.04)#6 | 1.2%(+6.84)#341 |
| 7. | Livingston | 7.8% | 0.97%(+6.87)#7 | 1.2%(+6.66)#347 |
| 8. | Joanna | 7.0% | 0.97%(+6.04)#8 | 1.2%(+5.83)#438 |
| 9. | Blenheim | 6.9% | 0.97%(+5.92)#9 | 1.2%(+5.71)#451 |
| 10. | Kiawah Island | 6.8% | 0.97%(+5.82)#10 | 1.2%(+5.61)#461 |
| 11. | Briarcliffe Acres | 6.0% | 0.97%(+5.03)#11 | 1.2%(+4.82)#601 |
| 12. | Mcclellanville | 5.6% | 0.97%(+4.60)#12 | 1.2%(+4.39)#693 |
| 13. | Cane Savannah | 5.3% | 0.97%(+4.37)#13 | 1.2%(+4.16)#747 |
| 14. | Pinopolis | 5.3% | 0.97%(+4.36)#14 | 1.2%(+4.15)#749 |
| 15. | Branchville | 5.1% | 0.97%(+4.09)#15 | 1.2%(+3.88)#823 |
| 16. | Arcadia Lakes | 4.7% | 0.97%(+3.68)#16 | 1.2%(+3.47)#964 |
| 17. | Edisto Beach | 4.5% | 0.97%(+3.53)#17 | 1.2%(+3.32)#1,012 |
| 18. | Isle Of Palms | 4.3% | 0.97%(+3.34)#18 | 1.2%(+3.13)#1,084 |
| 19. | Forest Acres | 3.9% | 0.97%(+2.97)#19 | 1.2%(+2.76)#1,260 |
| 20. | Litchfield Beach | 3.6% | 0.97%(+2.62)#20 | 1.2%(+2.41)#1,466 |
| 21. | East Camden | 3.6% | 0.97%(+2.58)#21 | 1.2%(+2.37)#1,498 |
| 22. | Mount Pleasant | 3.1% | 0.97%(+2.12)#22 | 1.2%(+1.91)#1,839 |
| 23. | Mount Croghan | 3.0% | 0.97%(+2.06)#23 | 1.2%(+1.85)#1,897 |
| 24. | Greenville | 2.9% | 0.97%(+1.92)#24 | 1.2%(+1.71)#2,031 |
| 25. | East Gaffney | 2.8% | 0.97%(+1.87)#25 | 1.2%(+1.66)#2,081 |
| 26. | Beaufort | 2.7% | 0.97%(+1.76)#26 | 1.2%(+1.55)#2,209 |
| 27. | Seabrook Island | 2.7% | 0.97%(+1.74)#27 | 1.2%(+1.54)#2,223 |
| 28. | Chesterfield | 2.7% | 0.97%(+1.70)#28 | 1.2%(+1.49)#2,265 |
| 29. | Jackson | 2.7% | 0.97%(+1.68)#29 | 1.2%(+1.47)#2,281 |
| 30. | Walterboro | 2.6% | 0.97%(+1.65)#30 | 1.2%(+1.44)#2,314 |
| 31. | Piedmont | 2.6% | 0.97%(+1.63)#31 | 1.2%(+1.42)#2,340 |
| 32. | Greer | 2.4% | 0.97%(+1.45)#32 | 1.2%(+1.25)#2,537 |
| 33. | Ladson | 2.4% | 0.97%(+1.41)#33 | 1.2%(+1.20)#2,601 |
| 34. | Ridgeville | 2.3% | 0.97%(+1.36)#34 | 1.2%(+1.16)#2,670 |
| 35. | Ridgeway | 2.3% | 0.97%(+1.35)#35 | 1.2%(+1.14)#2,687 |
| 36. | Campobello | 2.3% | 0.97%(+1.32)#36 | 1.2%(+1.12)#2,721 |
| 37. | Columbia | 2.3% | 0.97%(+1.30)#37 | 1.2%(+1.09)#2,765 |
| 38. | Walhalla | 2.2% | 0.97%(+1.26)#38 | 1.2%(+1.05)#2,814 |
| 39. | Garden City | 2.2% | 0.97%(+1.21)#39 | 1.2%(+1.00)#2,890 |
| 40. | Oak Grove | 2.1% | 0.97%(+1.16)#40 | 1.2%(+0.947)#2,986 |
| 41. | Hickory Grove | 2.1% | 0.97%(+1.14)#41 | 1.2%(+0.935)#3,002 |
| 42. | Barnwell | 2.0% | 0.97%(+0.990)#42 | 1.2%(+0.780)#3,278 |
| 43. | James Island | 2.0% | 0.97%(+0.984)#43 | 1.2%(+0.775)#3,295 |
| 44. | Charleston | 2.0% | 0.97%(+0.978)#44 | 1.2%(+0.769)#3,308 |
| 45. | Wade Hampton | 1.9% | 0.97%(+0.916)#45 | 1.2%(+0.707)#3,427 |
| 46. | Little Mountain | 1.9% | 0.97%(+0.877)#46 | 1.2%(+0.668)#3,509 |
| 47. | Chesnee | 1.8% | 0.97%(+0.849)#47 | 1.2%(+0.640)#3,586 |
| 48. | Ninety Six | 1.8% | 0.97%(+0.847)#48 | 1.2%(+0.638)#3,591 |
| 49. | Pamplico | 1.8% | 0.97%(+0.807)#49 | 1.2%(+0.598)#3,678 |
| 50. | Atlantic Beach | 1.7% | 0.97%(+0.770)#50 | 1.2%(+0.560)#3,765 |
| 51. | Aiken | 1.7% | 0.97%(+0.716)#51 | 1.2%(+0.507)#3,916 |
| 52. | Awendaw | 1.7% | 0.97%(+0.707)#52 | 1.2%(+0.498)#3,933 |
| 53. | Norris | 1.7% | 0.97%(+0.698)#53 | 1.2%(+0.488)#3,957 |
| 54. | Port Royal | 1.7% | 0.97%(+0.683)#54 | 1.2%(+0.473)#3,986 |
| 55. | Florence | 1.6% | 0.97%(+0.669)#55 | 1.2%(+0.460)#4,016 |
| 56. | Fort Mill | 1.6% | 0.97%(+0.668)#56 | 1.2%(+0.458)#4,022 |
| 57. | Dentsville | 1.6% | 0.97%(+0.631)#57 | 1.2%(+0.422)#4,108 |
| 58. | Forestbrook | 1.6% | 0.97%(+0.624)#58 | 1.2%(+0.415)#4,127 |
| 59. | Burnettown | 1.6% | 0.97%(+0.591)#59 | 1.2%(+0.382)#4,210 |
| 60. | Cayce | 1.5% | 0.97%(+0.574)#60 | 1.2%(+0.365)#4,257 |
| 61. | Lake Wylie | 1.5% | 0.97%(+0.573)#61 | 1.2%(+0.364)#4,262 |
| 62. | Travelers Rest | 1.5% | 0.97%(+0.556)#62 | 1.2%(+0.346)#4,321 |
| 63. | Snelling | 1.5% | 0.97%(+0.529)#63 | 1.2%(+0.320)#4,399 |
| 64. | Loris | 1.5% | 0.97%(+0.525)#64 | 1.2%(+0.316)#4,410 |
| 65. | Johnsonville | 1.5% | 0.97%(+0.503)#65 | 1.2%(+0.294)#4,486 |
| 66. | Arkwright | 1.5% | 0.97%(+0.493)#66 | 1.2%(+0.284)#4,525 |
| 67. | Saxon | 1.5% | 0.97%(+0.488)#67 | 1.2%(+0.278)#4,541 |
| 68. | Blacksburg | 1.5% | 0.97%(+0.486)#68 | 1.2%(+0.277)#4,543 |
| 69. | Cottageville | 1.5% | 0.97%(+0.477)#69 | 1.2%(+0.268)#4,568 |
| 70. | Hilton Head Island | 1.4% | 0.97%(+0.449)#70 | 1.2%(+0.240)#4,664 |
| 71. | Marion | 1.4% | 0.97%(+0.435)#71 | 1.2%(+0.225)#4,714 |
| 72. | Irmo | 1.4% | 0.97%(+0.397)#72 | 1.2%(+0.188)#4,832 |
| 73. | Ridgeland | 1.3% | 0.97%(+0.359)#73 | 1.2%(+0.150)#4,953 |
| 74. | Stateburg | 1.3% | 0.97%(+0.346)#74 | 1.2%(+0.137)#5,003 |
| 75. | Keowee Key | 1.3% | 0.97%(+0.328)#75 | 1.2%(+0.118)#5,053 |
| 76. | Gantt | 1.3% | 0.97%(+0.295)#76 | 1.2%(+0.086)#5,166 |
| 77. | West Columbia | 1.2% | 0.97%(+0.265)#77 | 1.2%(+0.056)#5,289 |
| 78. | Lexington | 1.2% | 0.97%(+0.184)#78 | 1.2%(-0.025)#5,616 |
| 79. | Rock Hill | 1.2% | 0.97%(+0.176)#79 | 1.2%(-0.033)#5,642 |
| 80. | Kershaw | 1.1% | 0.97%(+0.161)#80 | 1.2%(-0.049)#5,709 |
| 81. | Dunean | 1.1% | 0.97%(+0.156)#81 | 1.2%(-0.053)#5,728 |
| 82. | Five Forks | 1.1% | 0.97%(+0.136)#82 | 1.2%(-0.073)#5,827 |
| 83. | Lake Murray Of Richland | 1.1% | 0.97%(+0.127)#83 | 1.2%(-0.082)#5,865 |
| 84. | Northlake | 1.1% | 0.97%(+0.118)#84 | 1.2%(-0.091)#5,911 |
| 85. | Woodfield | 1.1% | 0.97%(+0.113)#85 | 1.2%(-0.096)#5,925 |
| 86. | Wyboo | 1.0% | 0.97%(+0.065)#86 | 1.2%(-0.144)#6,169 |
| 87. | Pageland | 1.0% | 0.97%(+0.065)#87 | 1.2%(-0.144)#6,170 |
| 88. | Meggett | 1.0% | 0.97%(+0.028)#88 | 1.2%(-0.181)#6,359 |
| 89. | Little River | 1.0% | 0.97%(+0.028)#89 | 1.2%(-0.182)#6,362 |
| 90. | Bluffton | 1.00% | 0.97%(+0.024)#90 | 1.2%(-0.185)#6,376 |
| 91. | Summerville | 0.97% | 0.97%(-0.004)#91 | 1.2%(-0.214)#6,509 |
| 92. | Tega Cay | 0.97% | 0.97%(-0.008)#92 | 1.2%(-0.217)#6,527 |
| 93. | Surfside Beach | 0.96% | 0.97%(-0.015)#93 | 1.2%(-0.225)#6,568 |
| 94. | Conway | 0.96% | 0.97%(-0.017)#94 | 1.2%(-0.227)#6,585 |
| 95. | Graniteville | 0.95% | 0.97%(-0.024)#95 | 1.2%(-0.234)#6,622 |
| 96. | Goose Creek | 0.94% | 0.97%(-0.038)#96 | 1.2%(-0.247)#6,694 |
| 97. | Wedgefield | 0.92% | 0.97%(-0.057)#97 | 1.2%(-0.266)#6,790 |
| 98. | Prosperity | 0.92% | 0.97%(-0.059)#98 | 1.2%(-0.268)#6,802 |
| 99. | Murphys Estates | 0.91% | 0.97%(-0.060)#99 | 1.2%(-0.269)#6,812 |
| 100. | Belvedere | 0.91% | 0.97%(-0.067)#100 | 1.2%(-0.276)#6,845 |
Common Questions
What are the Top 10 Cities with the Highest Percentage of Population Employed in Legal Services & Support in South Carolina?
Top 10 Cities with the Highest Percentage of Population Employed in Legal Services & Support in South Carolina are:
#1
19.2%
#2
13.3%
#3
11.1%
#4
8.1%
#5
7.8%
#6
7.0%
#7
6.9%
#8
6.8%
#9
6.0%
#10
5.6%
What city has the Highest Percentage of Population Employed in Legal Services & Support in South Carolina?
Folly Beach has the Highest Percentage of Population Employed in Legal Services & Support in South Carolina with 19.2%.
What is the Percentage of Population Employed in Legal Services & Support in the State of South Carolina?
Percentage of Population Employed in Legal Services & Support in South Carolina is 0.97%.
What is the Percentage of Population Employed in Legal Services & Support in the United States?
Percentage of Population Employed in Legal Services & Support in the United States is 1.2%.