Clarendon Hills, IL Map & Demographics
Clarendon Hills Map
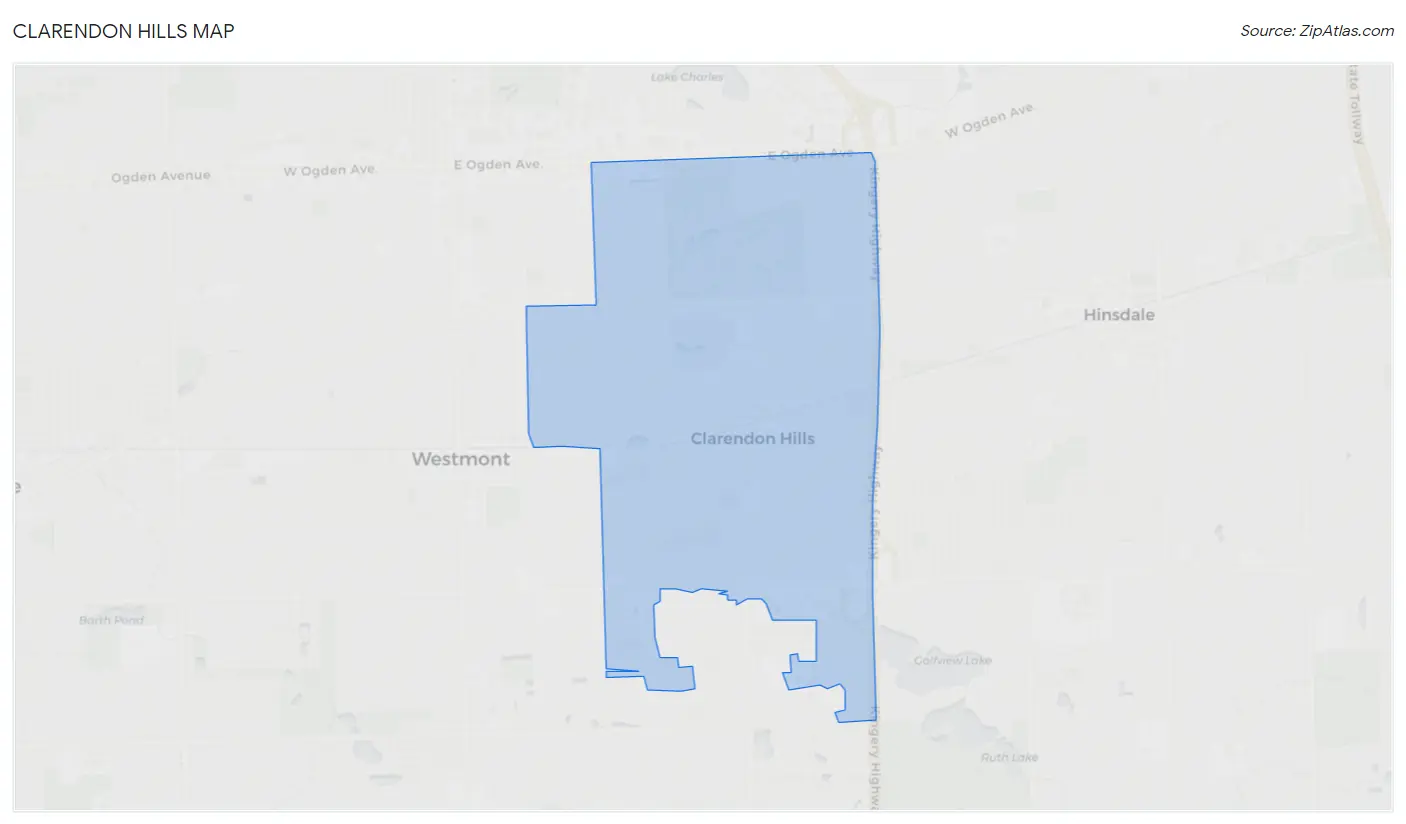
Clarendon Hills Overview
$77,133
PER CAPITA INCOME
$186,875
AVG FAMILY INCOME
$115,923
AVG HOUSEHOLD INCOME
61.8%
WAGE / INCOME GAP [ % ]
38.2¢/ $1
WAGE / INCOME GAP [ $ ]
0.56
INEQUALITY / GINI INDEX
8,658
TOTAL POPULATION
4,228
MALE POPULATION
4,430
FEMALE POPULATION
95.44
MALES / 100 FEMALES
104.78
FEMALES / 100 MALES
41.1
MEDIAN AGE
3.2
AVG FAMILY SIZE
2.6
AVG HOUSEHOLD SIZE
4,172
LABOR FORCE [ PEOPLE ]
64.8%
PERCENT IN LABOR FORCE
2.8%
UNEMPLOYMENT RATE
Clarendon Hills Zip Codes
Income in Clarendon Hills
Income Overview in Clarendon Hills
Per Capita Income in Clarendon Hills is $77,133, while median incomes of families and households are $186,875 and $115,923 respectively.
| Characteristic | Number | Measure |
| Per Capita Income | 8,658 | $77,133 |
| Median Family Income | 2,362 | $186,875 |
| Mean Family Income | 2,362 | $259,537 |
| Median Household Income | 3,277 | $115,923 |
| Mean Household Income | 3,277 | $202,326 |
| Income Deficit | 2,362 | $0 |
| Wage / Income Gap (%) | 8,658 | 61.80% |
| Wage / Income Gap ($) | 8,658 | 38.20¢ per $1 |
| Gini / Inequality Index | 8,658 | 0.56 |
Earnings by Sex in Clarendon Hills
Average Earnings in Clarendon Hills are $70,121, $127,067 for men and $48,541 for women, a difference of 61.8%.
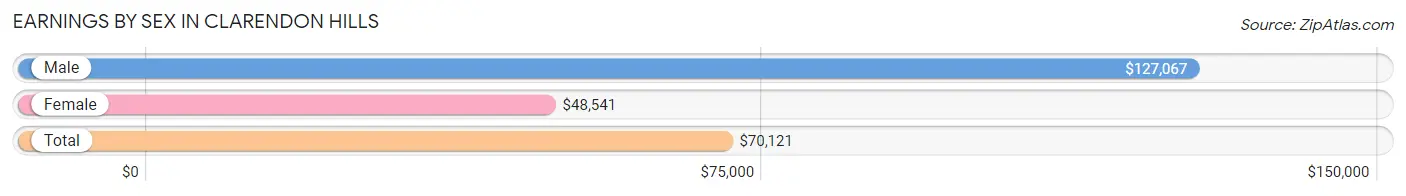
| Sex | Number | Average Earnings |
| Male | 2,051 (46.9%) | $127,067 |
| Female | 2,327 (53.1%) | $48,541 |
| Total | 4,378 (100.0%) | $70,121 |
Earnings by Sex by Income Bracket in Clarendon Hills
The most common earnings brackets in Clarendon Hills are $100,000+ for men (1,206 | 58.8%) and $100,000+ for women (588 | 25.3%).
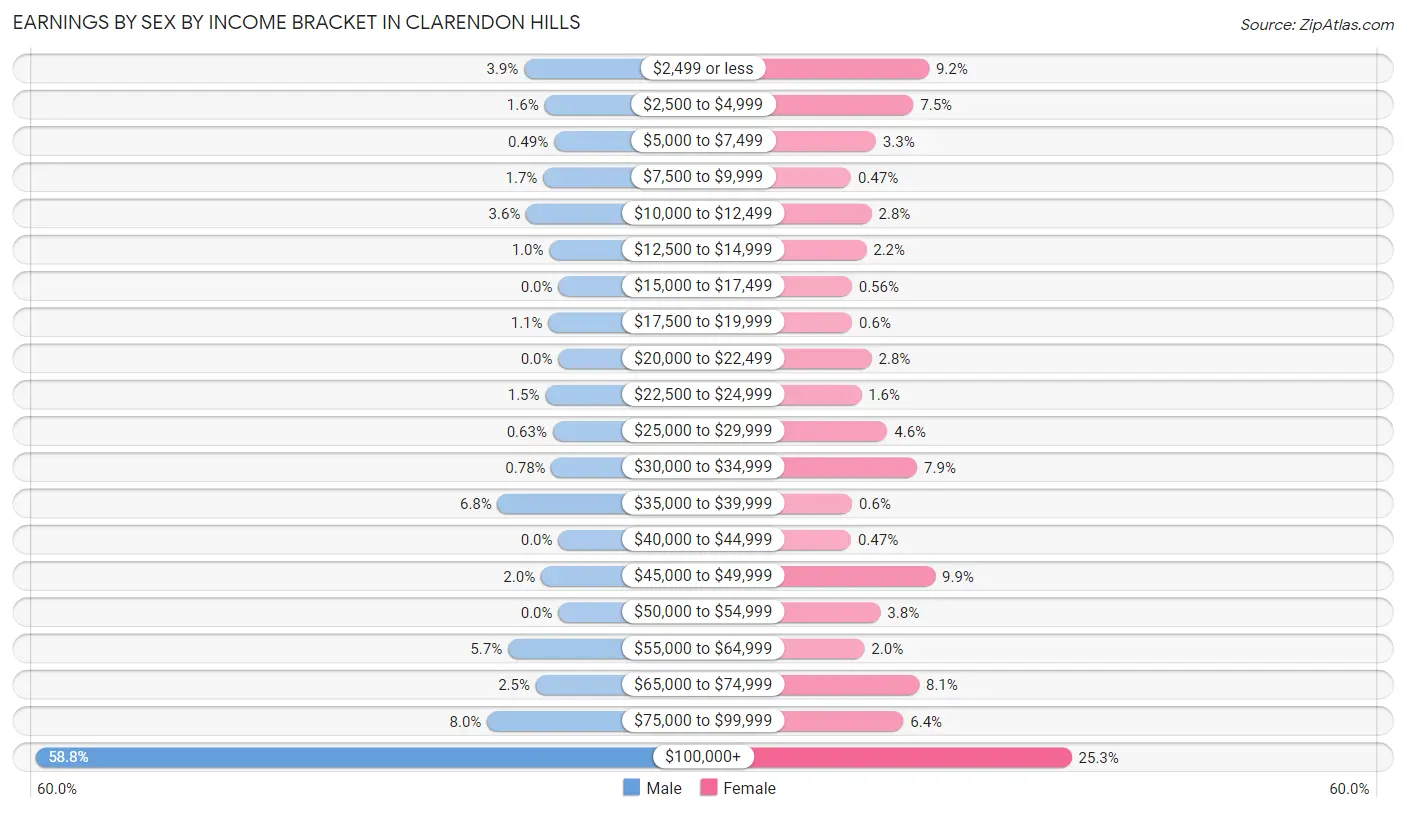
| Income | Male | Female |
| $2,499 or less | 79 (3.8%) | 215 (9.2%) |
| $2,500 to $4,999 | 32 (1.6%) | 174 (7.5%) |
| $5,000 to $7,499 | 10 (0.5%) | 76 (3.3%) |
| $7,500 to $9,999 | 35 (1.7%) | 11 (0.5%) |
| $10,000 to $12,499 | 74 (3.6%) | 65 (2.8%) |
| $12,500 to $14,999 | 21 (1.0%) | 51 (2.2%) |
| $15,000 to $17,499 | 0 (0.0%) | 13 (0.6%) |
| $17,500 to $19,999 | 23 (1.1%) | 14 (0.6%) |
| $20,000 to $22,499 | 0 (0.0%) | 65 (2.8%) |
| $22,500 to $24,999 | 30 (1.5%) | 38 (1.6%) |
| $25,000 to $29,999 | 13 (0.6%) | 106 (4.6%) |
| $30,000 to $34,999 | 16 (0.8%) | 184 (7.9%) |
| $35,000 to $39,999 | 140 (6.8%) | 14 (0.6%) |
| $40,000 to $44,999 | 0 (0.0%) | 11 (0.5%) |
| $45,000 to $49,999 | 40 (1.9%) | 231 (9.9%) |
| $50,000 to $54,999 | 0 (0.0%) | 88 (3.8%) |
| $55,000 to $64,999 | 116 (5.7%) | 46 (2.0%) |
| $65,000 to $74,999 | 52 (2.5%) | 189 (8.1%) |
| $75,000 to $99,999 | 164 (8.0%) | 148 (6.4%) |
| $100,000+ | 1,206 (58.8%) | 588 (25.3%) |
| Total | 2,051 (100.0%) | 2,327 (100.0%) |
Earnings by Sex by Educational Attainment in Clarendon Hills
Average earnings in Clarendon Hills are $134,696 for men and $54,173 for women, a difference of 59.8%. Men with an educational attainment of graduate degree enjoy the highest average annual earnings of $203,333, while those with less than high school education earn the least with $38,919. Women with an educational attainment of graduate degree earn the most with the average annual earnings of $115,379, while those with college or associate's degree education have the smallest earnings of $22,067.
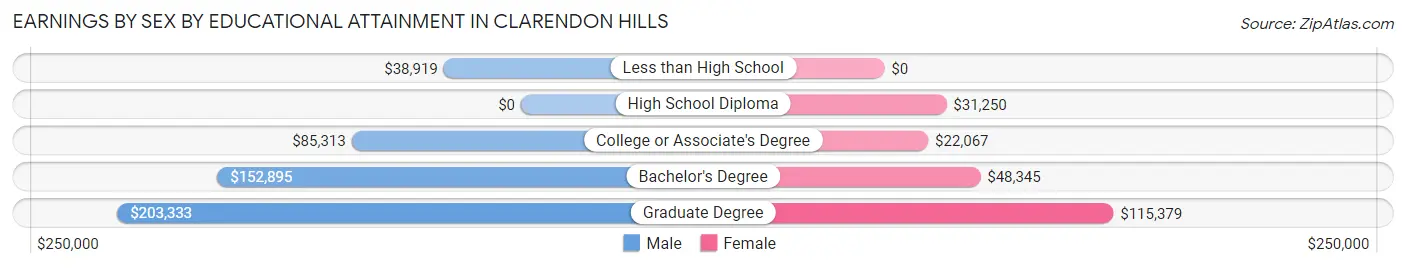
| Educational Attainment | Male Income | Female Income |
| Less than High School | $38,919 | $0 |
| High School Diploma | - | - |
| College or Associate's Degree | $85,313 | $22,067 |
| Bachelor's Degree | $152,895 | $48,345 |
| Graduate Degree | $203,333 | $115,379 |
| Total | $134,696 | $54,173 |
Family Income in Clarendon Hills
Family Income Brackets in Clarendon Hills
According to the Clarendon Hills family income data, there are 1,084 families falling into the $200,000+ income range, which is the most common income bracket and makes up 45.9% of all families. Conversely, the $10,000 to $14,999 income bracket is the least frequent group with only 14 families (0.6%) belonging to this category.
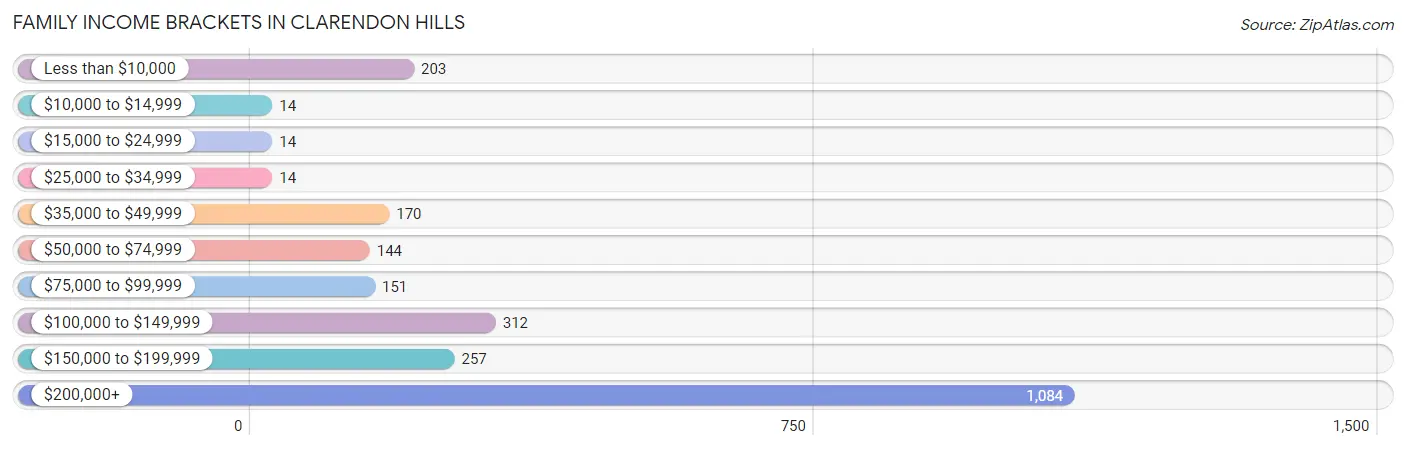
| Income Bracket | # Families | % Families |
| Less than $10,000 | 203 | 8.6% |
| $10,000 to $14,999 | 14 | 0.6% |
| $15,000 to $24,999 | 14 | 0.6% |
| $25,000 to $34,999 | 14 | 0.6% |
| $35,000 to $49,999 | 170 | 7.2% |
| $50,000 to $74,999 | 144 | 6.1% |
| $75,000 to $99,999 | 151 | 6.4% |
| $100,000 to $149,999 | 312 | 13.2% |
| $150,000 to $199,999 | 257 | 10.9% |
| $200,000+ | 1,084 | 45.9% |
Family Income by Famaliy Size in Clarendon Hills
4-person families (713 | 30.2%) account for the highest median family income in Clarendon Hills with $250,001 per family, while 2-person families (768 | 32.5%) have the highest median income of $63,404 per family member.
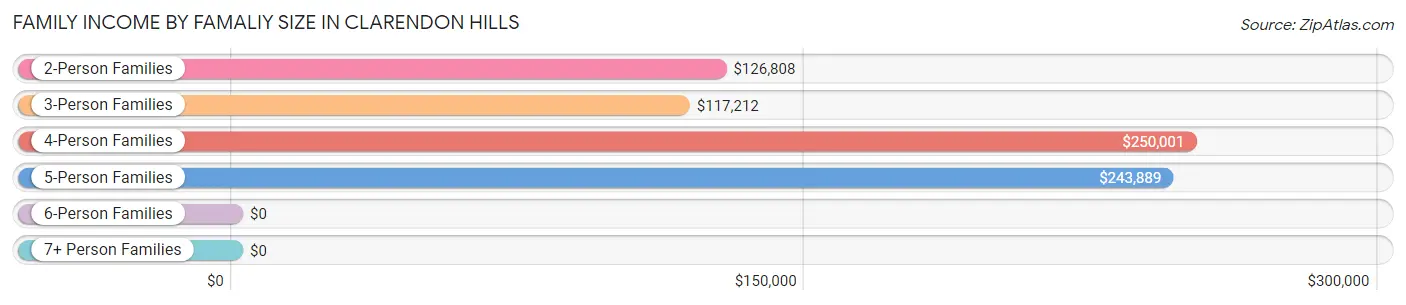
| Income Bracket | # Families | Median Income |
| 2-Person Families | 768 (32.5%) | $126,808 |
| 3-Person Families | 638 (27.0%) | $117,212 |
| 4-Person Families | 713 (30.2%) | $250,001 |
| 5-Person Families | 192 (8.1%) | $243,889 |
| 6-Person Families | 26 (1.1%) | $0 |
| 7+ Person Families | 25 (1.1%) | $0 |
| Total | 2,362 (100.0%) | $186,875 |
Family Income by Number of Earners in Clarendon Hills
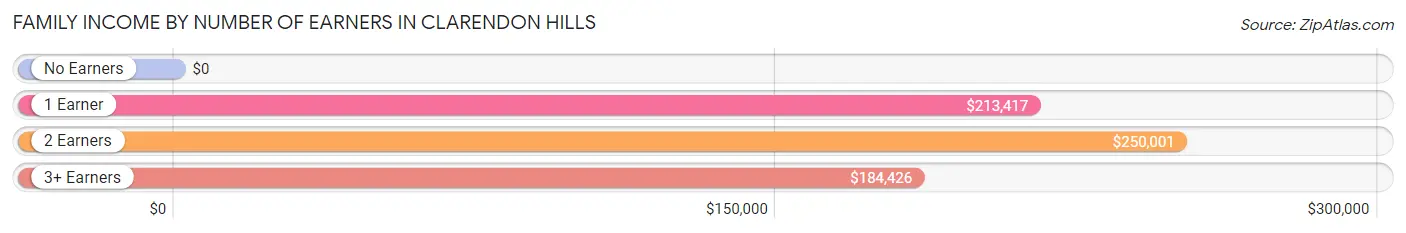
| Number of Earners | # Families | Median Income |
| No Earners | 370 (15.7%) | $0 |
| 1 Earner | 523 (22.1%) | $213,417 |
| 2 Earners | 1,188 (50.3%) | $250,001 |
| 3+ Earners | 281 (11.9%) | $184,426 |
| Total | 2,362 (100.0%) | $186,875 |
Household Income in Clarendon Hills
Household Income Brackets in Clarendon Hills
With 1,098 households falling in the category, the $200,000+ income range is the most frequent in Clarendon Hills, accounting for 33.5% of all households. In contrast, only 13 households (0.4%) fall into the $10,000 to $14,999 income bracket, making it the least populous group.
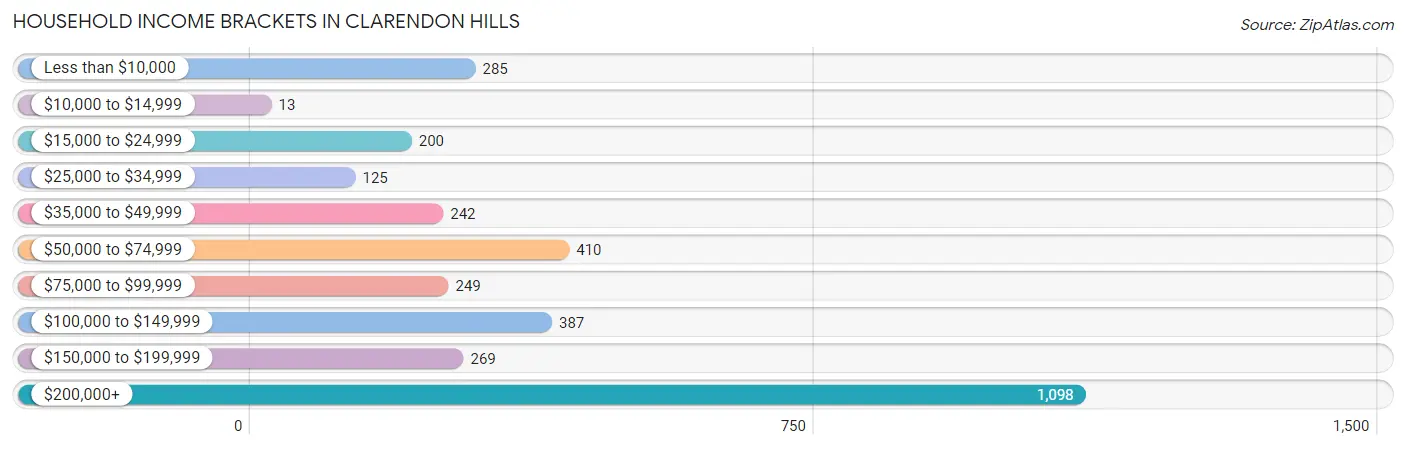
| Income Bracket | # Households | % Households |
| Less than $10,000 | 285 | 8.7% |
| $10,000 to $14,999 | 13 | 0.4% |
| $15,000 to $24,999 | 200 | 6.1% |
| $25,000 to $34,999 | 125 | 3.8% |
| $35,000 to $49,999 | 242 | 7.4% |
| $50,000 to $74,999 | 410 | 12.5% |
| $75,000 to $99,999 | 249 | 7.6% |
| $100,000 to $149,999 | 387 | 11.8% |
| $150,000 to $199,999 | 269 | 8.2% |
| $200,000+ | 1,098 | 33.5% |
Household Income by Householder Age in Clarendon Hills
The median household income in Clarendon Hills is $115,923, with the highest median household income of $184,668 found in the 45 to 64 years age bracket for the primary householder. A total of 1,325 households (40.4%) fall into this category. Meanwhile, the 15 to 24 years age bracket for the primary householder has the lowest median household income of $0, with 16 households (0.5%) in this group.
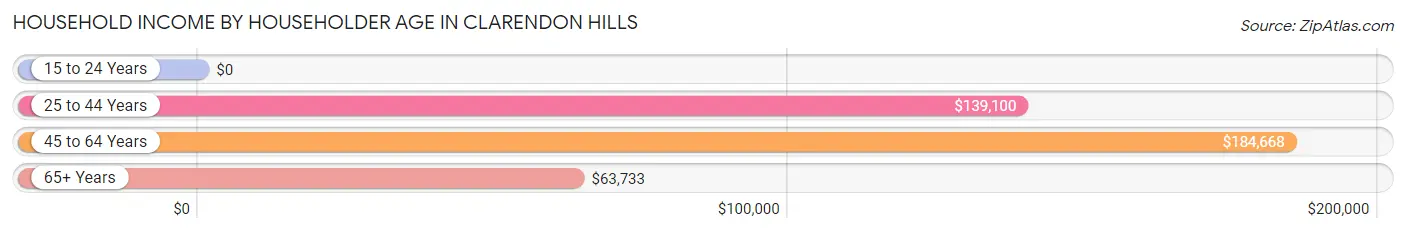
| Income Bracket | # Households | Median Income |
| 15 to 24 Years | 16 (0.5%) | $0 |
| 25 to 44 Years | 1,062 (32.4%) | $139,100 |
| 45 to 64 Years | 1,325 (40.4%) | $184,668 |
| 65+ Years | 874 (26.7%) | $63,733 |
| Total | 3,277 (100.0%) | $115,923 |
Poverty in Clarendon Hills
Income Below Poverty by Sex and Age in Clarendon Hills
With 8.4% poverty level for males and 7.8% for females among the residents of Clarendon Hills, 15 year old males and 55 to 64 year old females are the most vulnerable to poverty, with 111 males (48.5%) and 165 females (30.7%) in their respective age groups living below the poverty level.
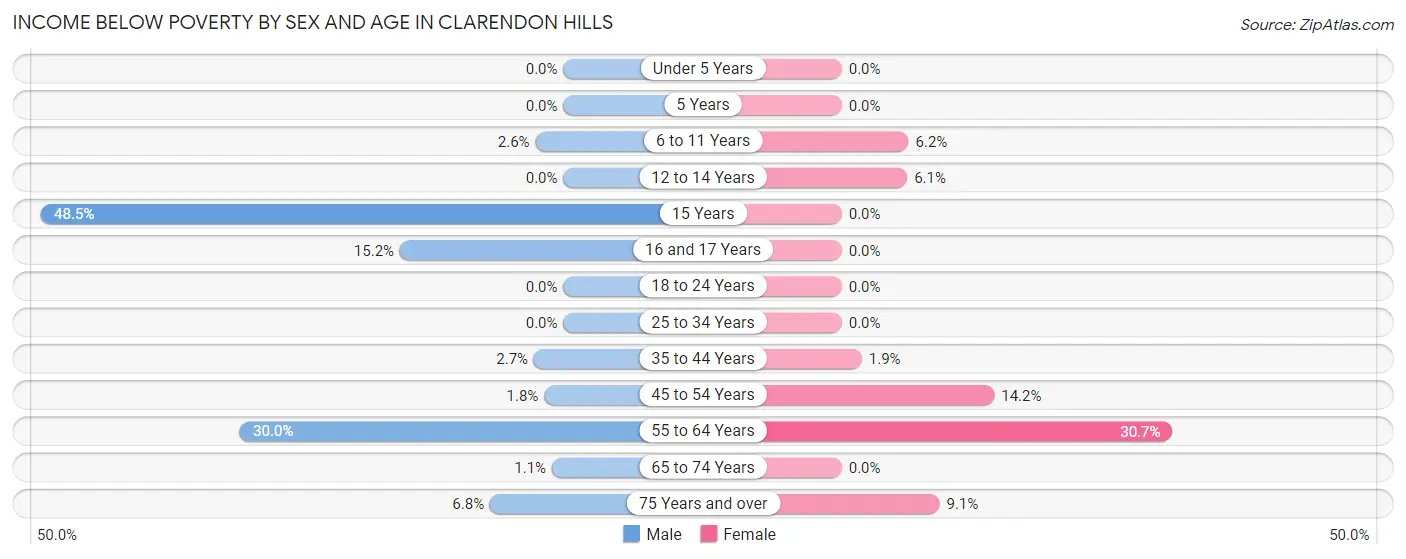
| Age Bracket | Male | Female |
| Under 5 Years | 0 (0.0%) | 0 (0.0%) |
| 5 Years | 0 (0.0%) | 0 (0.0%) |
| 6 to 11 Years | 16 (2.6%) | 16 (6.2%) |
| 12 to 14 Years | 0 (0.0%) | 13 (6.1%) |
| 15 Years | 111 (48.5%) | 0 (0.0%) |
| 16 and 17 Years | 27 (15.2%) | 0 (0.0%) |
| 18 to 24 Years | 0 (0.0%) | 0 (0.0%) |
| 25 to 34 Years | 0 (0.0%) | 0 (0.0%) |
| 35 to 44 Years | 14 (2.7%) | 15 (1.9%) |
| 45 to 54 Years | 13 (1.8%) | 91 (14.1%) |
| 55 to 64 Years | 156 (30.0%) | 165 (30.7%) |
| 65 to 74 Years | 2 (1.1%) | 0 (0.0%) |
| 75 Years and over | 16 (6.8%) | 44 (9.1%) |
| Total | 355 (8.4%) | 344 (7.8%) |
Income Above Poverty by Sex and Age in Clarendon Hills
According to the poverty statistics in Clarendon Hills, males aged under 5 years and females aged under 5 years are the age groups that are most secure financially, with 100.0% of males and 100.0% of females in these age groups living above the poverty line.
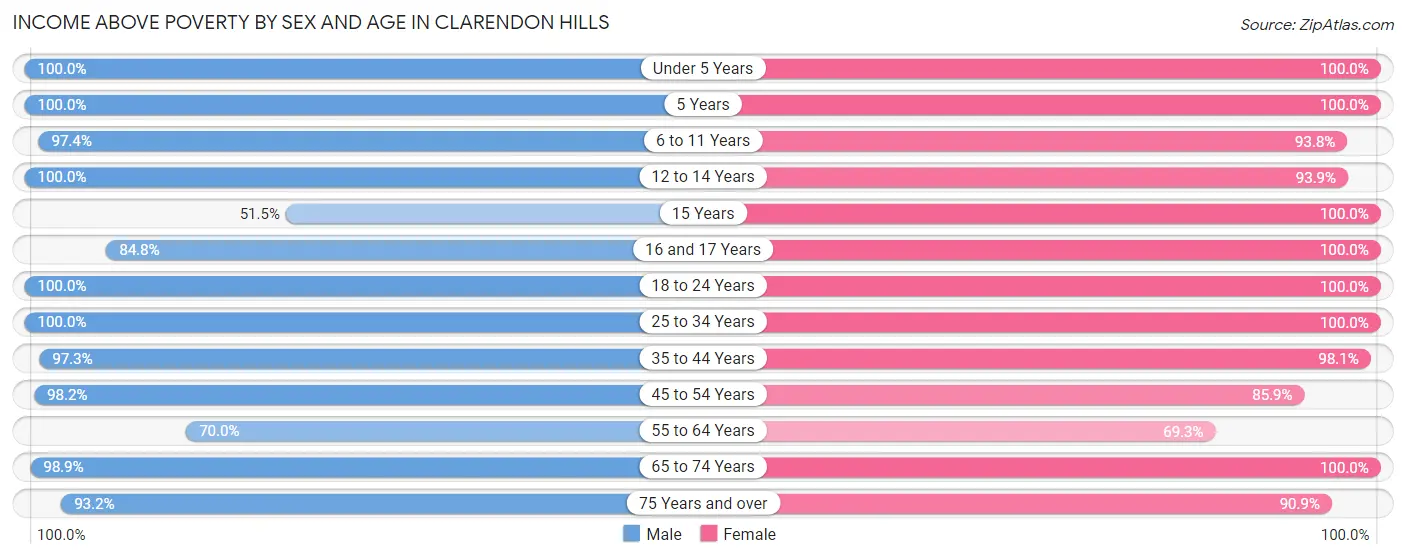
| Age Bracket | Male | Female |
| Under 5 Years | 226 (100.0%) | 258 (100.0%) |
| 5 Years | 45 (100.0%) | 44 (100.0%) |
| 6 to 11 Years | 601 (97.4%) | 242 (93.8%) |
| 12 to 14 Years | 260 (100.0%) | 201 (93.9%) |
| 15 Years | 118 (51.5%) | 68 (100.0%) |
| 16 and 17 Years | 151 (84.8%) | 279 (100.0%) |
| 18 to 24 Years | 177 (100.0%) | 277 (100.0%) |
| 25 to 34 Years | 311 (100.0%) | 229 (100.0%) |
| 35 to 44 Years | 498 (97.3%) | 792 (98.1%) |
| 45 to 54 Years | 717 (98.2%) | 552 (85.9%) |
| 55 to 64 Years | 364 (70.0%) | 373 (69.3%) |
| 65 to 74 Years | 186 (98.9%) | 330 (100.0%) |
| 75 Years and over | 219 (93.2%) | 441 (90.9%) |
| Total | 3,873 (91.6%) | 4,086 (92.2%) |
Income Below Poverty Among Married-Couple Families in Clarendon Hills
The poverty statistics for married-couple families in Clarendon Hills show that 8.5% or 181 of the total 2,125 families live below the poverty line. Families with 1 or 2 children have the highest poverty rate of 15.7%, comprising of 181 families. On the other hand, families with no children have the lowest poverty rate of 0.0%, which includes 0 families.
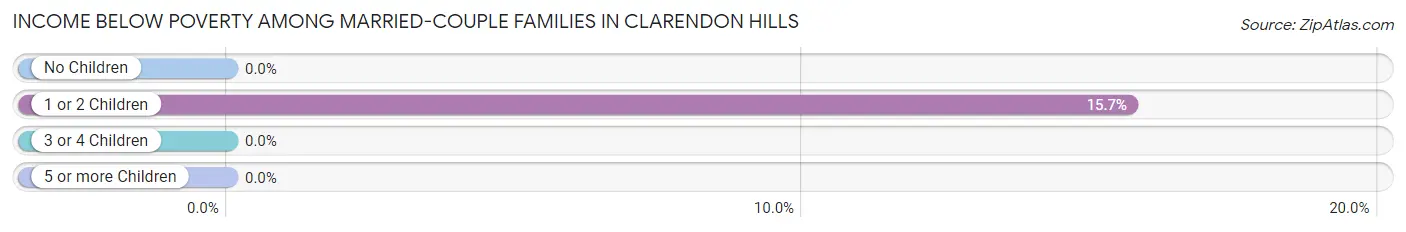
| Children | Above Poverty | Below Poverty |
| No Children | 792 (100.0%) | 0 (0.0%) |
| 1 or 2 Children | 973 (84.3%) | 181 (15.7%) |
| 3 or 4 Children | 154 (100.0%) | 0 (0.0%) |
| 5 or more Children | 25 (100.0%) | 0 (0.0%) |
| Total | 1,944 (91.5%) | 181 (8.5%) |
Income Below Poverty Among Single-Parent Households in Clarendon Hills
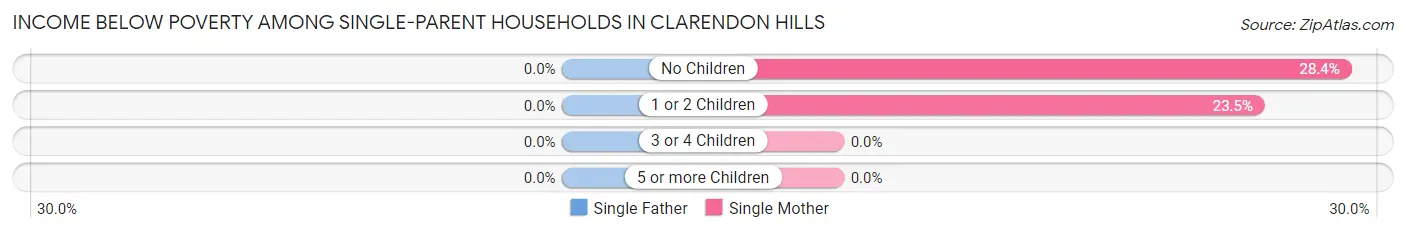
| Children | Single Father | Single Mother |
| No Children | 0 (0.0%) | 21 (28.4%) |
| 1 or 2 Children | 0 (0.0%) | 28 (23.5%) |
| 3 or 4 Children | 0 (0.0%) | 0 (0.0%) |
| 5 or more Children | 0 (0.0%) | 0 (0.0%) |
| Total | 0 (0.0%) | 49 (25.4%) |
Income Below Poverty Among Married-Couple vs Single-Parent Households in Clarendon Hills
The poverty data for Clarendon Hills shows that 181 of the married-couple family households (8.5%) and 49 of the single-parent households (20.7%) are living below the poverty level. Within the married-couple family households, those with 1 or 2 children have the highest poverty rate, with 181 households (15.7%) falling below the poverty line. Among the single-parent households, those with no children have the highest poverty rate, with 21 household (28.4%) living below poverty.
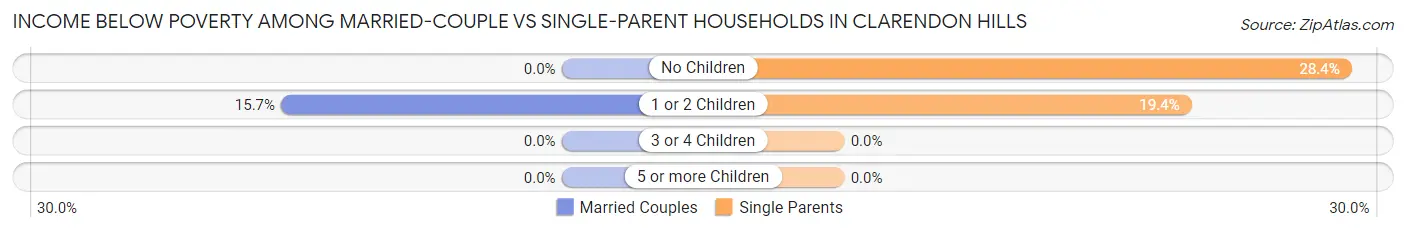
| Children | Married-Couple Families | Single-Parent Households |
| No Children | 0 (0.0%) | 21 (28.4%) |
| 1 or 2 Children | 181 (15.7%) | 28 (19.4%) |
| 3 or 4 Children | 0 (0.0%) | 0 (0.0%) |
| 5 or more Children | 0 (0.0%) | 0 (0.0%) |
| Total | 181 (8.5%) | 49 (20.7%) |
Race in Clarendon Hills
The most populous races in Clarendon Hills are White / Caucasian (7,106 | 82.1%), Asian (981 | 11.3%), and Hispanic or Latino (578 | 6.7%).
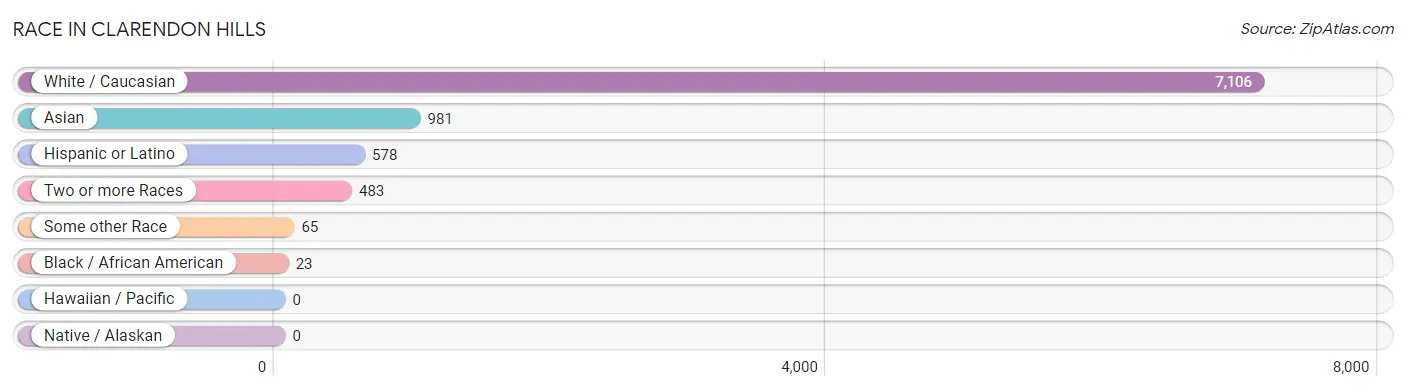
| Race | # Population | % Population |
| Asian | 981 | 11.3% |
| Black / African American | 23 | 0.3% |
| Hawaiian / Pacific | 0 | 0.0% |
| Hispanic or Latino | 578 | 6.7% |
| Native / Alaskan | 0 | 0.0% |
| White / Caucasian | 7,106 | 82.1% |
| Two or more Races | 483 | 5.6% |
| Some other Race | 65 | 0.7% |
| Total | 8,658 | 100.0% |
Ancestry in Clarendon Hills
The most populous ancestries reported in Clarendon Hills are Irish (2,237 | 25.8%), German (1,982 | 22.9%), Italian (1,109 | 12.8%), Thai (777 | 9.0%), and Polish (748 | 8.6%), together accounting for 79.1% of all Clarendon Hills residents.
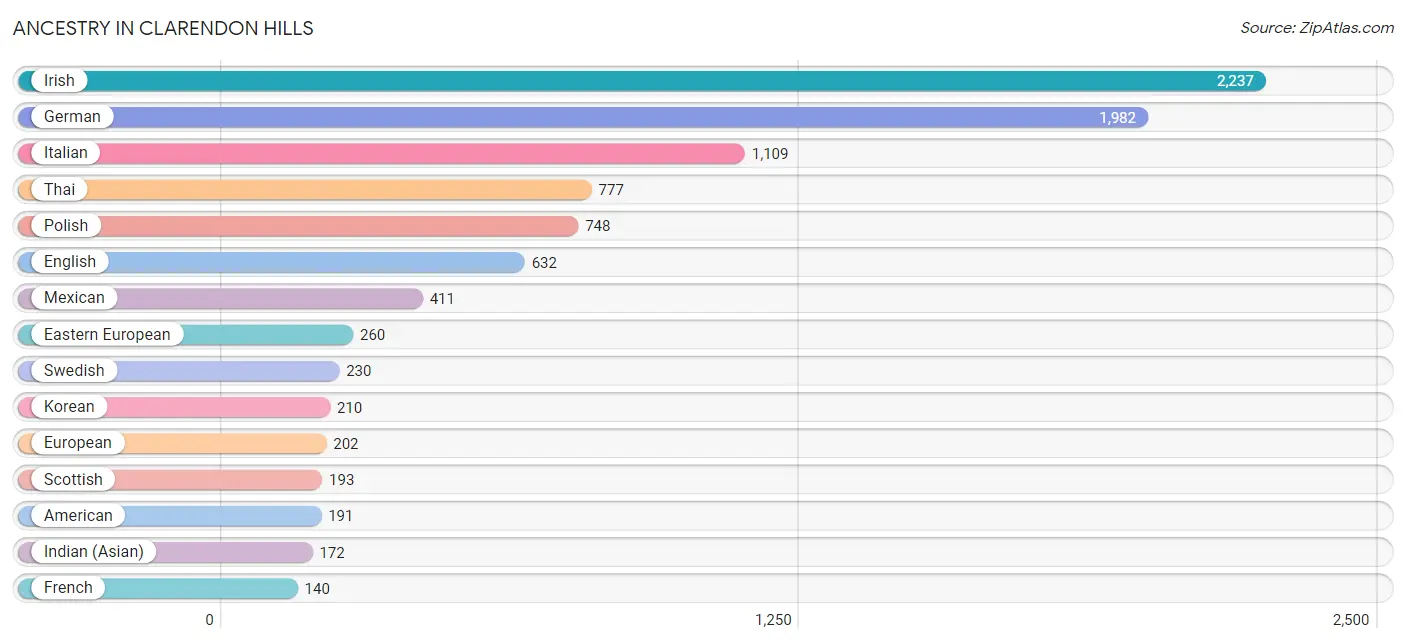
| Ancestry | # Population | % Population |
| American | 191 | 2.2% |
| Arab | 45 | 0.5% |
| Argentinean | 36 | 0.4% |
| Armenian | 60 | 0.7% |
| Belgian | 35 | 0.4% |
| Bhutanese | 25 | 0.3% |
| Burmese | 28 | 0.3% |
| Central American | 16 | 0.2% |
| Central American Indian | 29 | 0.3% |
| Colombian | 26 | 0.3% |
| Croatian | 42 | 0.5% |
| Czech | 105 | 1.2% |
| Danish | 43 | 0.5% |
| Dutch | 35 | 0.4% |
| Eastern European | 260 | 3.0% |
| English | 632 | 7.3% |
| European | 202 | 2.3% |
| Filipino | 20 | 0.2% |
| French | 140 | 1.6% |
| French Canadian | 14 | 0.2% |
| German | 1,982 | 22.9% |
| Greek | 96 | 1.1% |
| Indian (Asian) | 172 | 2.0% |
| Iranian | 124 | 1.4% |
| Irish | 2,237 | 25.8% |
| Israeli | 16 | 0.2% |
| Italian | 1,109 | 12.8% |
| Korean | 210 | 2.4% |
| Lebanese | 19 | 0.2% |
| Lithuanian | 84 | 1.0% |
| Luxembourger | 6 | 0.1% |
| Mexican | 411 | 4.8% |
| Native Hawaiian | 21 | 0.2% |
| Northern European | 25 | 0.3% |
| Norwegian | 93 | 1.1% |
| Polish | 748 | 8.6% |
| Puerto Rican | 89 | 1.0% |
| Romanian | 7 | 0.1% |
| Russian | 44 | 0.5% |
| Salvadoran | 16 | 0.2% |
| Scandinavian | 13 | 0.2% |
| Scotch-Irish | 35 | 0.4% |
| Scottish | 193 | 2.2% |
| Serbian | 25 | 0.3% |
| Slovak | 109 | 1.3% |
| Slovene | 11 | 0.1% |
| South American | 62 | 0.7% |
| Swedish | 230 | 2.7% |
| Thai | 777 | 9.0% |
| Turkish | 11 | 0.1% |
| Ukrainian | 42 | 0.5% |
| Welsh | 33 | 0.4% | View All 52 Rows |
Immigrants in Clarendon Hills
The most numerous immigrant groups reported in Clarendon Hills came from Asia (830 | 9.6%), South Central Asia (464 | 5.4%), India (422 | 4.9%), Saudi Arabia (235 | 2.7%), and Western Asia (235 | 2.7%), together accounting for 25.2% of all Clarendon Hills residents.
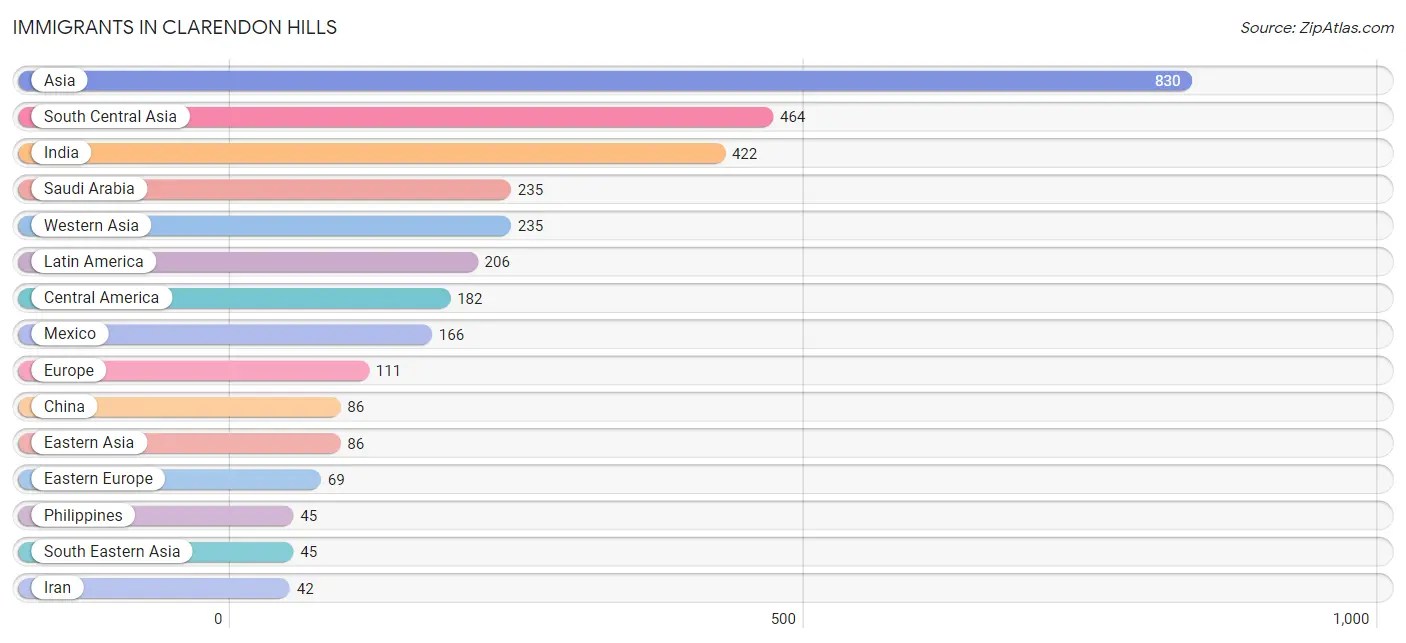
| Immigration Origin | # Population | % Population |
| Argentina | 11 | 0.1% |
| Asia | 830 | 9.6% |
| Australia | 13 | 0.2% |
| Bosnia and Herzegovina | 25 | 0.3% |
| Central America | 182 | 2.1% |
| China | 86 | 1.0% |
| Colombia | 13 | 0.2% |
| Czechoslovakia | 11 | 0.1% |
| Eastern Asia | 86 | 1.0% |
| Eastern Europe | 69 | 0.8% |
| El Salvador | 16 | 0.2% |
| Europe | 111 | 1.3% |
| Germany | 13 | 0.2% |
| India | 422 | 4.9% |
| Iran | 42 | 0.5% |
| Italy | 26 | 0.3% |
| Latin America | 206 | 2.4% |
| Lithuania | 20 | 0.2% |
| Mexico | 166 | 1.9% |
| Oceania | 13 | 0.2% |
| Philippines | 45 | 0.5% |
| Poland | 11 | 0.1% |
| Saudi Arabia | 235 | 2.7% |
| South America | 24 | 0.3% |
| South Central Asia | 464 | 5.4% |
| South Eastern Asia | 45 | 0.5% |
| Southern Europe | 29 | 0.3% |
| Spain | 3 | 0.0% |
| Taiwan | 41 | 0.5% |
| Ukraine | 2 | 0.0% |
| Western Asia | 235 | 2.7% |
| Western Europe | 13 | 0.2% | View All 32 Rows |
Sex and Age in Clarendon Hills
Sex and Age in Clarendon Hills
The most populous age groups in Clarendon Hills are 10 to 14 Years (544 | 12.9%) for men and 40 to 44 Years (486 | 11.0%) for women.
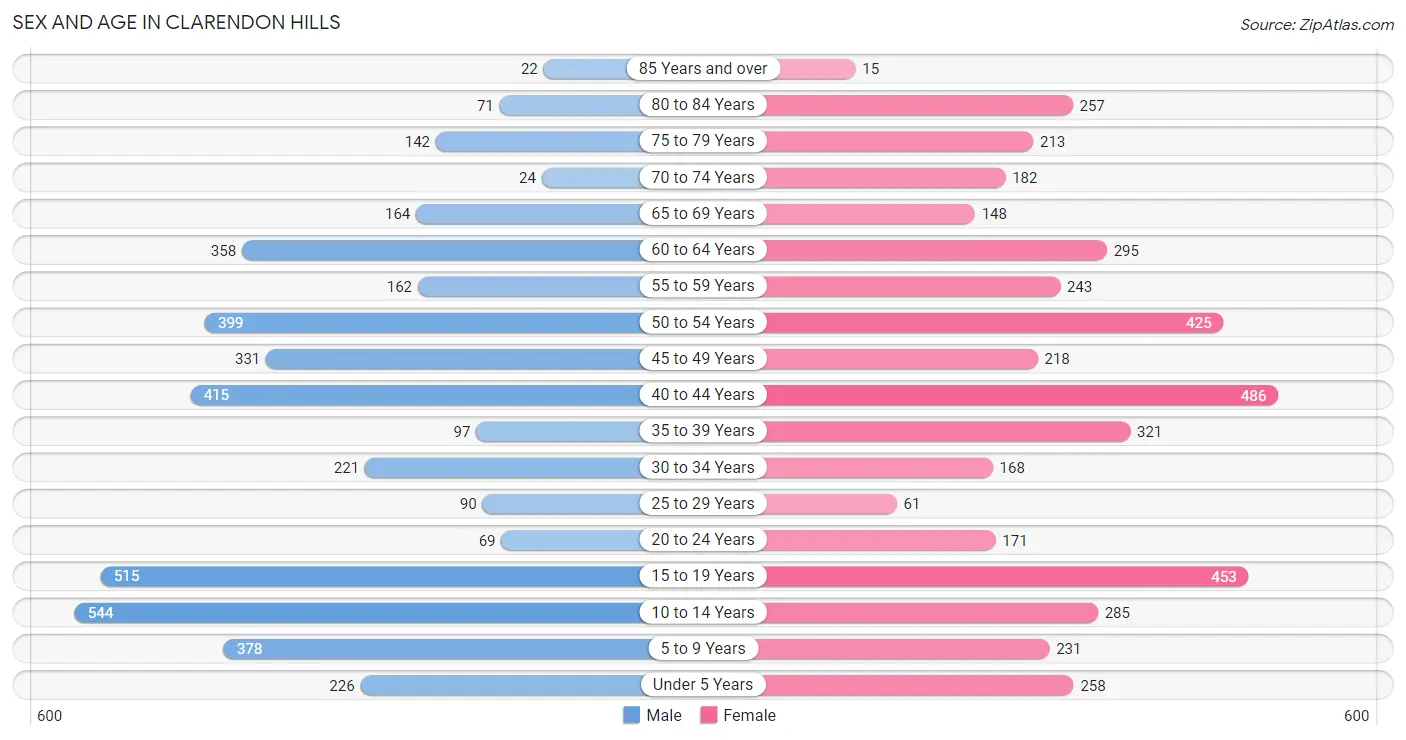
| Age Bracket | Male | Female |
| Under 5 Years | 226 (5.3%) | 258 (5.8%) |
| 5 to 9 Years | 378 (8.9%) | 231 (5.2%) |
| 10 to 14 Years | 544 (12.9%) | 285 (6.4%) |
| 15 to 19 Years | 515 (12.2%) | 453 (10.2%) |
| 20 to 24 Years | 69 (1.6%) | 171 (3.9%) |
| 25 to 29 Years | 90 (2.1%) | 61 (1.4%) |
| 30 to 34 Years | 221 (5.2%) | 168 (3.8%) |
| 35 to 39 Years | 97 (2.3%) | 321 (7.2%) |
| 40 to 44 Years | 415 (9.8%) | 486 (11.0%) |
| 45 to 49 Years | 331 (7.8%) | 218 (4.9%) |
| 50 to 54 Years | 399 (9.4%) | 425 (9.6%) |
| 55 to 59 Years | 162 (3.8%) | 243 (5.5%) |
| 60 to 64 Years | 358 (8.5%) | 295 (6.7%) |
| 65 to 69 Years | 164 (3.9%) | 148 (3.3%) |
| 70 to 74 Years | 24 (0.6%) | 182 (4.1%) |
| 75 to 79 Years | 142 (3.4%) | 213 (4.8%) |
| 80 to 84 Years | 71 (1.7%) | 257 (5.8%) |
| 85 Years and over | 22 (0.5%) | 15 (0.3%) |
| Total | 4,228 (100.0%) | 4,430 (100.0%) |
Families and Households in Clarendon Hills
Median Family Size in Clarendon Hills
The median family size in Clarendon Hills is 3.25 persons per family, with married-couple families (2,125 | 90.0%) accounting for the largest median family size of 3.32 persons per family. On the other hand, single female/mother families (193 | 8.2%) represent the smallest median family size with 2.41 persons per family.
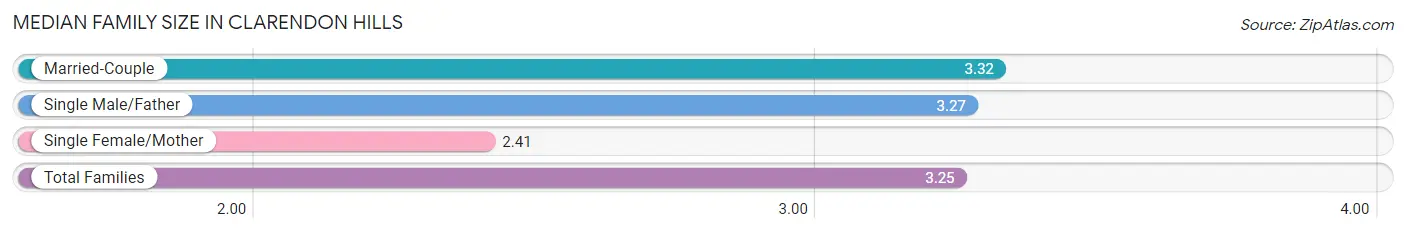
| Family Type | # Families | Family Size |
| Married-Couple | 2,125 (90.0%) | 3.32 |
| Single Male/Father | 44 (1.9%) | 3.27 |
| Single Female/Mother | 193 (8.2%) | 2.41 |
| Total Families | 2,362 (100.0%) | 3.25 |
Median Household Size in Clarendon Hills
The median household size in Clarendon Hills is 2.63 persons per household, with married-couple households (2,125 | 64.8%) accounting for the largest median household size of 3.32 persons per household. non-family households (915 | 27.9%) represent the smallest median household size with 1.03 persons per household.
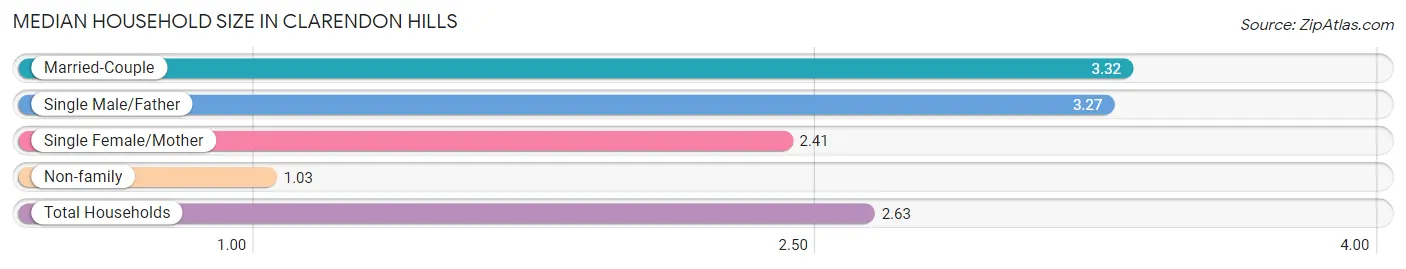
| Household Type | # Households | Household Size |
| Married-Couple | 2,125 (64.8%) | 3.32 |
| Single Male/Father | 44 (1.3%) | 3.27 |
| Single Female/Mother | 193 (5.9%) | 2.41 |
| Non-family | 915 (27.9%) | 1.03 |
| Total Households | 3,277 (100.0%) | 2.63 |
Household Size by Marriage Status in Clarendon Hills
Out of a total of 3,277 households in Clarendon Hills, 2,362 (72.1%) are family households, while 915 (27.9%) are nonfamily households. The most numerous type of family households are 2-person households, comprising 768, and the most common type of nonfamily households are 1-person households, comprising 885.
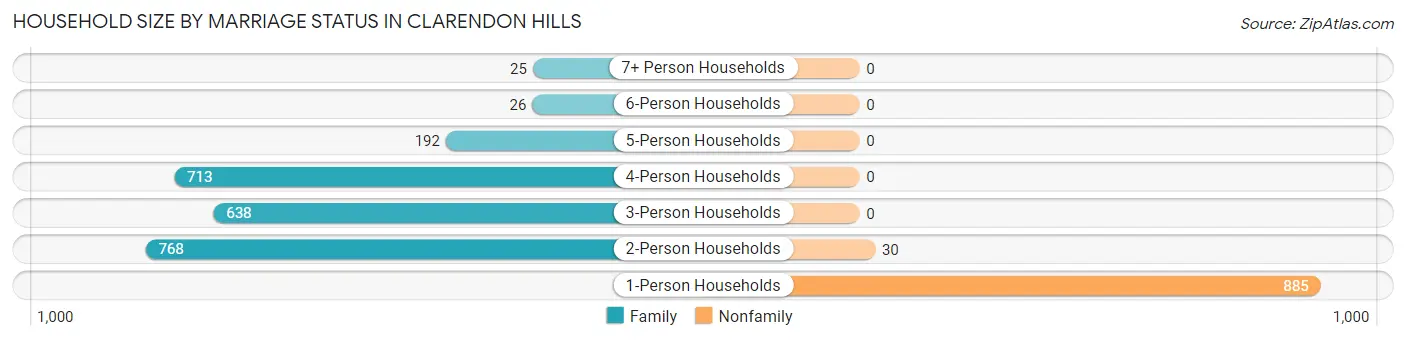
| Household Size | Family Households | Nonfamily Households |
| 1-Person Households | - | 885 (27.0%) |
| 2-Person Households | 768 (23.4%) | 30 (0.9%) |
| 3-Person Households | 638 (19.5%) | 0 (0.0%) |
| 4-Person Households | 713 (21.8%) | 0 (0.0%) |
| 5-Person Households | 192 (5.9%) | 0 (0.0%) |
| 6-Person Households | 26 (0.8%) | 0 (0.0%) |
| 7+ Person Households | 25 (0.8%) | 0 (0.0%) |
| Total | 2,362 (72.1%) | 915 (27.9%) |
Female Fertility in Clarendon Hills
Fertility by Age in Clarendon Hills
Average fertility rate in Clarendon Hills is 7.0 births per 1,000 women. Women in the age bracket of 20 to 34 years have the highest fertility rate with 35.0 births per 1,000 women. Women in the age bracket of 20 to 34 years acount for 100.0% of all women with births.
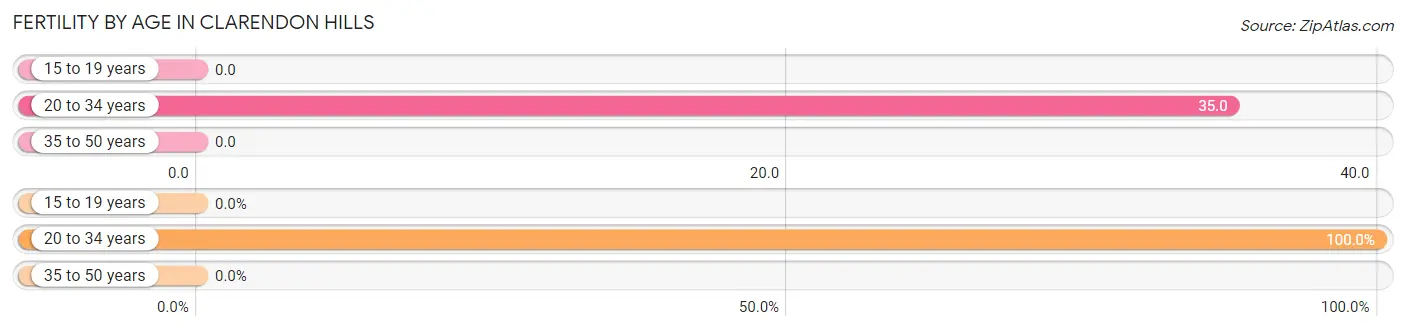
| Age Bracket | Women with Births | Births / 1,000 Women |
| 15 to 19 years | 0 (0.0%) | 0.0 |
| 20 to 34 years | 14 (100.0%) | 35.0 |
| 35 to 50 years | 0 (0.0%) | 0.0 |
| Total | 14 (100.0%) | 7.0 |
Fertility by Age by Marriage Status in Clarendon Hills
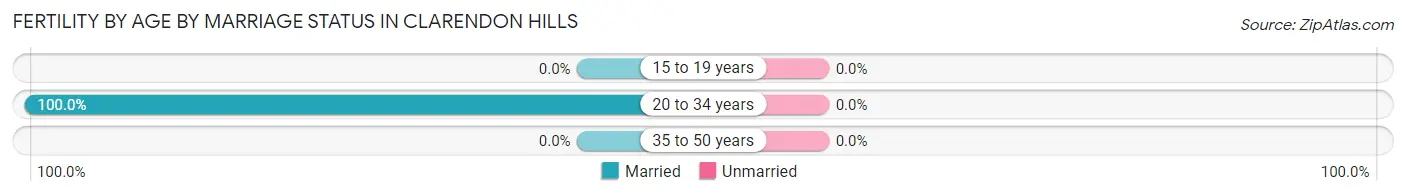
| Age Bracket | Married | Unmarried |
| 15 to 19 years | 0 (0.0%) | 0 (0.0%) |
| 20 to 34 years | 14 (100.0%) | 0 (0.0%) |
| 35 to 50 years | 0 (0.0%) | 0 (0.0%) |
| Total | 14 (100.0%) | 0 (0.0%) |
Fertility by Education in Clarendon Hills
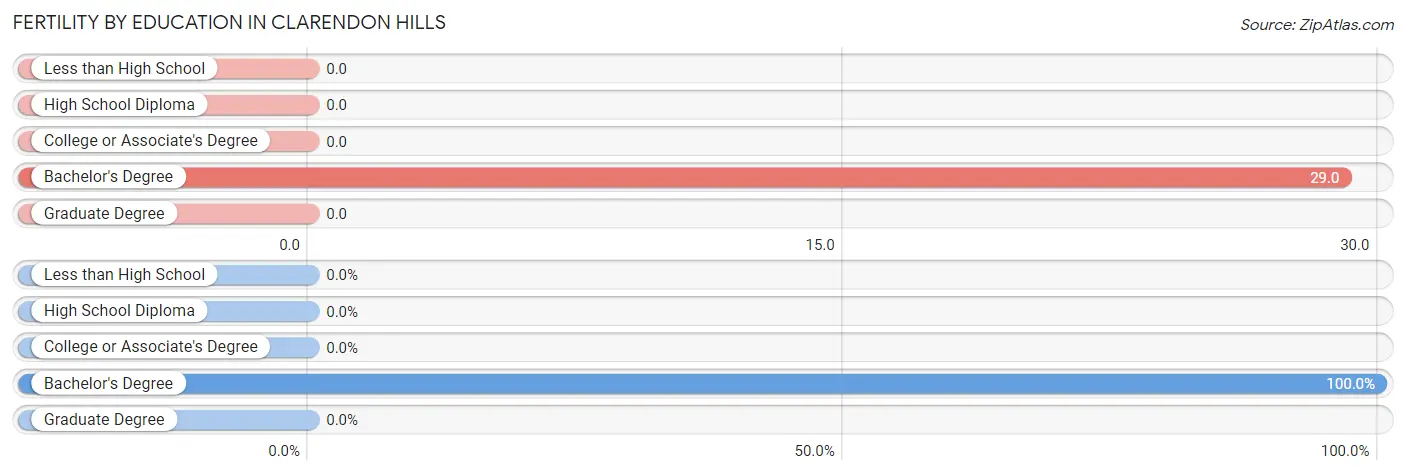
| Educational Attainment | Women with Births | Births / 1,000 Women |
| Less than High School | 0 (0.0%) | 0.0 |
| High School Diploma | 0 (0.0%) | 0.0 |
| College or Associate's Degree | 0 (0.0%) | 0.0 |
| Bachelor's Degree | 14 (100.0%) | 29.0 |
| Graduate Degree | 0 (0.0%) | 0.0 |
| Total | 14 (100.0%) | 7.0 |
Fertility by Education by Marriage Status in Clarendon Hills
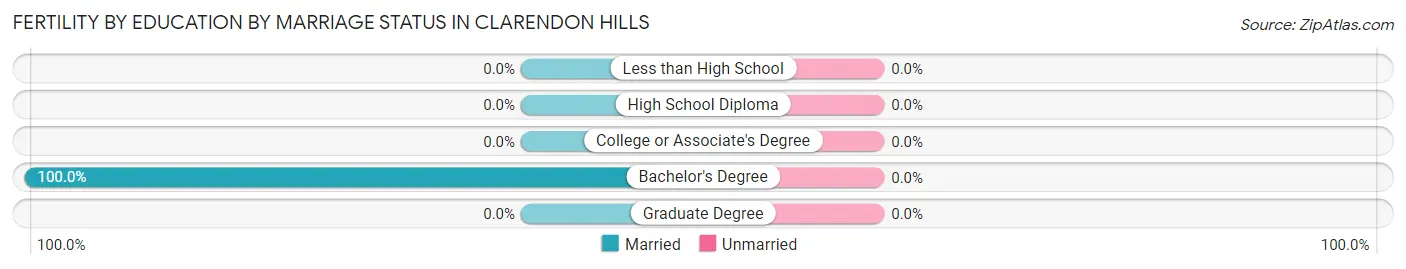
| Educational Attainment | Married | Unmarried |
| Less than High School | 0 (0.0%) | 0 (0.0%) |
| High School Diploma | 0 (0.0%) | 0 (0.0%) |
| College or Associate's Degree | 0 (0.0%) | 0 (0.0%) |
| Bachelor's Degree | 14 (100.0%) | 0 (0.0%) |
| Graduate Degree | 0 (0.0%) | 0 (0.0%) |
| Total | 14 (100.0%) | 0 (0.0%) |
Employment Characteristics in Clarendon Hills
Employment by Class of Employer in Clarendon Hills
Among the 3,917 employed individuals in Clarendon Hills, private company employees (2,679 | 68.4%), not-for-profit organizations (401 | 10.2%), and self-employed (incorporated) (324 | 8.3%) make up the most common classes of employment.
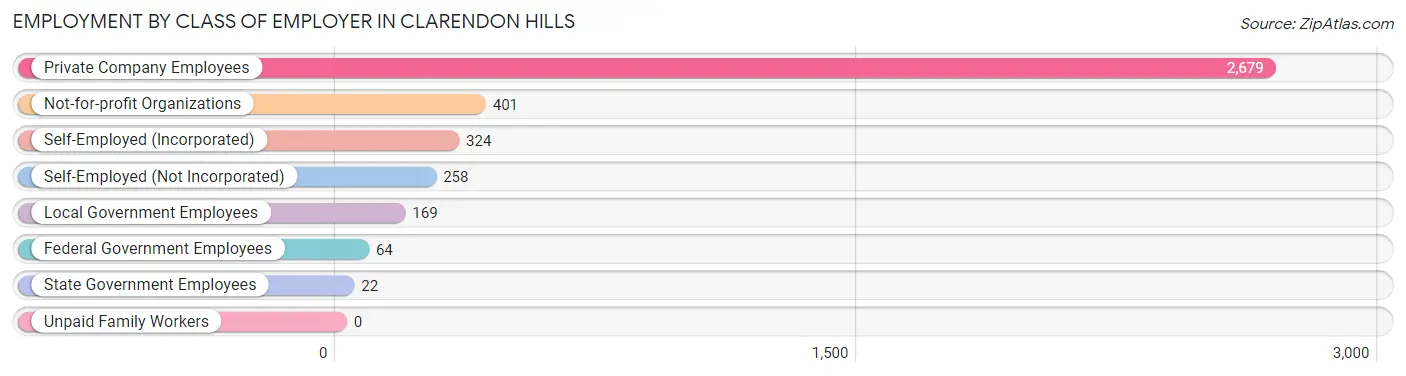
| Employer Class | # Employees | % Employees |
| Private Company Employees | 2,679 | 68.4% |
| Self-Employed (Incorporated) | 324 | 8.3% |
| Self-Employed (Not Incorporated) | 258 | 6.6% |
| Not-for-profit Organizations | 401 | 10.2% |
| Local Government Employees | 169 | 4.3% |
| State Government Employees | 22 | 0.6% |
| Federal Government Employees | 64 | 1.6% |
| Unpaid Family Workers | 0 | 0.0% |
| Total | 3,917 | 100.0% |
Employment Status by Age in Clarendon Hills
According to the labor force statistics for Clarendon Hills, out of the total population over 16 years of age (6,439), 64.8% or 4,172 individuals are in the labor force, with 2.8% or 117 of them unemployed. The age group with the highest labor force participation rate is 25 to 29 years, with 100.0% or 151 individuals in the labor force. Within the labor force, the 75 years and over age range has the highest percentage of unemployed individuals, with 14.4% or 34 of them being unemployed.
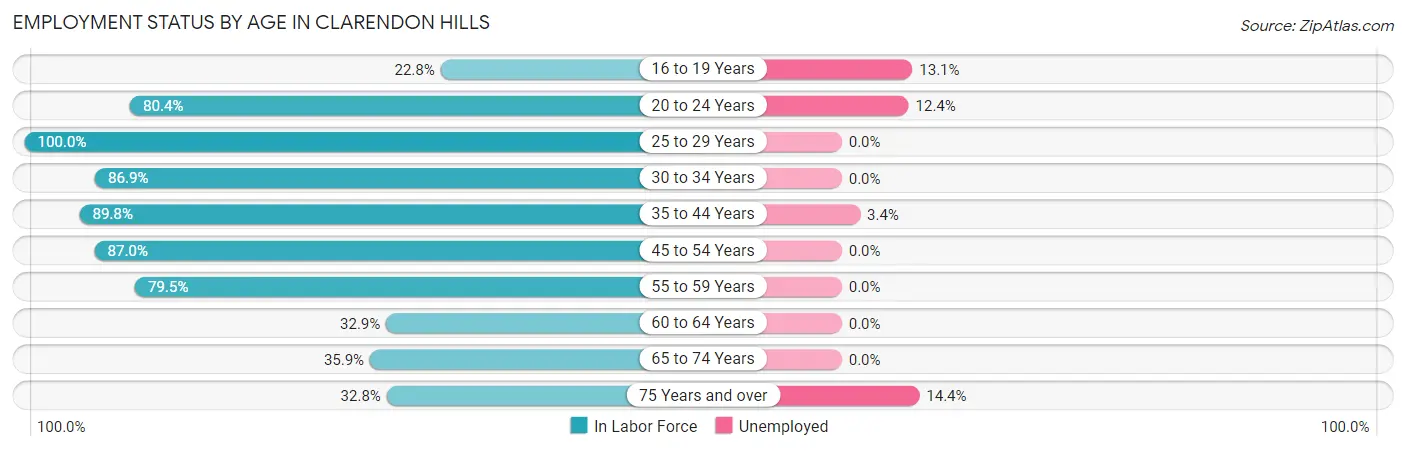
| Age Bracket | In Labor Force | Unemployed |
| 16 to 19 Years | 153 (22.8%) | 20 (13.1%) |
| 20 to 24 Years | 193 (80.4%) | 24 (12.4%) |
| 25 to 29 Years | 151 (100.0%) | 0 (0.0%) |
| 30 to 34 Years | 338 (86.9%) | 0 (0.0%) |
| 35 to 44 Years | 1,184 (89.8%) | 40 (3.4%) |
| 45 to 54 Years | 1,195 (87.0%) | 0 (0.0%) |
| 55 to 59 Years | 322 (79.5%) | 0 (0.0%) |
| 60 to 64 Years | 215 (32.9%) | 0 (0.0%) |
| 65 to 74 Years | 186 (35.9%) | 0 (0.0%) |
| 75 Years and over | 236 (32.8%) | 34 (14.4%) |
| Total | 4,172 (64.8%) | 117 (2.8%) |
Employment Status by Educational Attainment in Clarendon Hills
According to labor force statistics for Clarendon Hills, 79.4% of individuals (3,406) out of the total population between 25 and 64 years of age (4,290) are in the labor force, with 1.2% or 41 of them being unemployed. The group with the highest labor force participation rate are those with the educational attainment of high school diploma, with 100.0% or 126 individuals in the labor force. Within the labor force, individuals with high school diploma education have the highest percentage of unemployment, with 9.5% or 12 of them being unemployed.
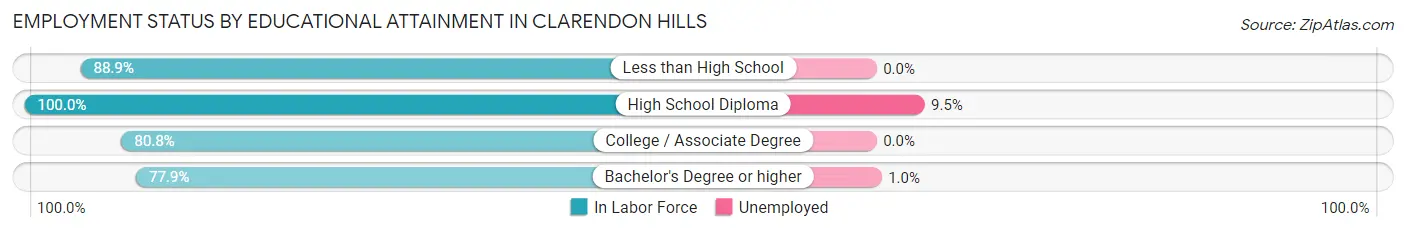
| Educational Attainment | In Labor Force | Unemployed |
| Less than High School | 168 (88.9%) | 0 (0.0%) |
| High School Diploma | 126 (100.0%) | 12 (9.5%) |
| College / Associate Degree | 384 (80.8%) | 0 (0.0%) |
| Bachelor's Degree or higher | 2,726 (77.9%) | 35 (1.0%) |
| Total | 3,406 (79.4%) | 51 (1.2%) |
Employment Occupations by Sex in Clarendon Hills
Management, Business, Science and Arts Occupations
The most common Management, Business, Science and Arts occupations in Clarendon Hills are Management (791 | 19.5%), Community & Social Service (709 | 17.5%), Health Diagnosing & Treating (402 | 9.9%), Computers, Engineering & Science (388 | 9.6%), and Health Technologists (364 | 9.0%).
Management, Business, Science and Arts Occupations by Sex
Within the Management, Business, Science and Arts occupations in Clarendon Hills, the most male-oriented occupations are Architecture & Engineering (88.7%), Management (69.3%), and Computers, Engineering & Science (68.8%), while the most female-oriented occupations are Education Instruction & Library (100.0%), Life, Physical & Social Science (74.2%), and Health Diagnosing & Treating (72.1%).
| Occupation | Male | Female |
| Management | 548 (69.3%) | 243 (30.7%) |
| Business & Financial | 136 (66.0%) | 70 (34.0%) |
| Computers, Engineering & Science | 267 (68.8%) | 121 (31.2%) |
| Computers & Mathematics | 101 (65.6%) | 53 (34.4%) |
| Architecture & Engineering | 149 (88.7%) | 19 (11.3%) |
| Life, Physical & Social Science | 17 (25.8%) | 49 (74.2%) |
| Community & Social Service | 223 (31.5%) | 486 (68.5%) |
| Education, Arts & Media | 14 (50.0%) | 14 (50.0%) |
| Legal Services & Support | 162 (47.0%) | 183 (53.0%) |
| Education Instruction & Library | 0 (0.0%) | 246 (100.0%) |
| Arts, Media & Entertainment | 47 (52.2%) | 43 (47.8%) |
| Health Diagnosing & Treating | 112 (27.9%) | 290 (72.1%) |
| Health Technologists | 112 (30.8%) | 252 (69.2%) |
| Total (Category) | 1,286 (51.5%) | 1,210 (48.5%) |
| Total (Overall) | 1,966 (48.5%) | 2,089 (51.5%) |
Services Occupations
The most common Services occupations in Clarendon Hills are Personal Care & Service (219 | 5.4%), Food Preparation & Serving (136 | 3.4%), Healthcare Support (107 | 2.6%), Security & Protection (41 | 1.0%), and Law Enforcement (32 | 0.8%).
Services Occupations by Sex
Within the Services occupations in Clarendon Hills, the most male-oriented occupations are Security & Protection (100.0%), Firefighting & Prevention (100.0%), and Law Enforcement (100.0%), while the most female-oriented occupations are Healthcare Support (100.0%), Personal Care & Service (85.4%), and Food Preparation & Serving (77.9%).
| Occupation | Male | Female |
| Healthcare Support | 0 (0.0%) | 107 (100.0%) |
| Security & Protection | 41 (100.0%) | 0 (0.0%) |
| Firefighting & Prevention | 9 (100.0%) | 0 (0.0%) |
| Law Enforcement | 32 (100.0%) | 0 (0.0%) |
| Food Preparation & Serving | 30 (22.1%) | 106 (77.9%) |
| Cleaning & Maintenance | 9 (100.0%) | 0 (0.0%) |
| Personal Care & Service | 32 (14.6%) | 187 (85.4%) |
| Total (Category) | 112 (21.9%) | 400 (78.1%) |
| Total (Overall) | 1,966 (48.5%) | 2,089 (51.5%) |
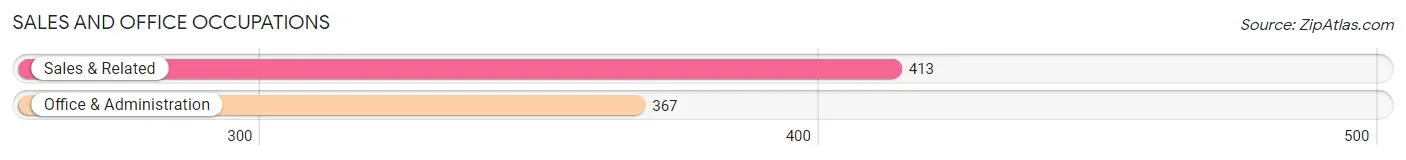
Sales and Office Occupations
The most common Sales and Office occupations in Clarendon Hills are Sales & Related (413 | 10.2%), and Office & Administration (367 | 9.0%).
Sales and Office Occupations by Sex
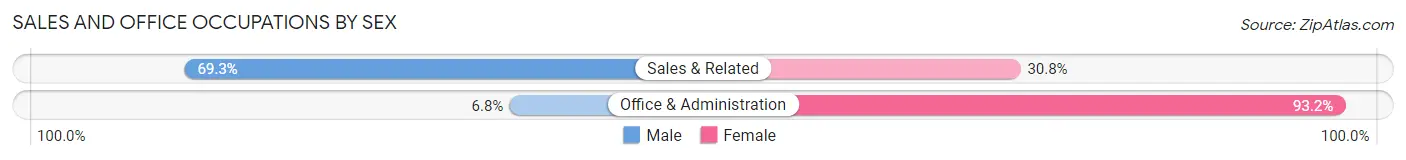
| Occupation | Male | Female |
| Sales & Related | 286 (69.3%) | 127 (30.7%) |
| Office & Administration | 25 (6.8%) | 342 (93.2%) |
| Total (Category) | 311 (39.9%) | 469 (60.1%) |
| Total (Overall) | 1,966 (48.5%) | 2,089 (51.5%) |
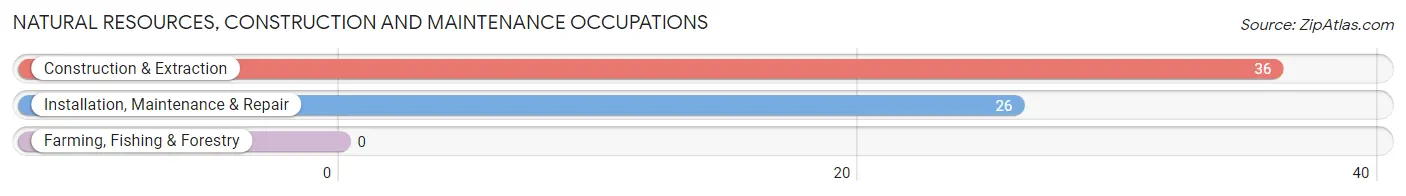
Natural Resources, Construction and Maintenance Occupations
The most common Natural Resources, Construction and Maintenance occupations in Clarendon Hills are Construction & Extraction (36 | 0.9%), and Installation, Maintenance & Repair (26 | 0.6%).
Natural Resources, Construction and Maintenance Occupations by Sex
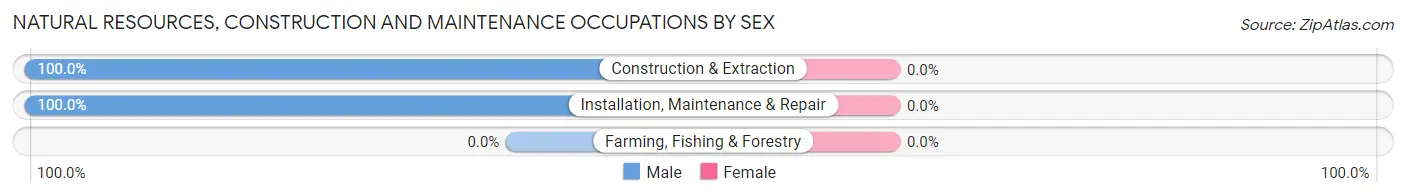
| Occupation | Male | Female |
| Farming, Fishing & Forestry | 0 (0.0%) | 0 (0.0%) |
| Construction & Extraction | 36 (100.0%) | 0 (0.0%) |
| Installation, Maintenance & Repair | 26 (100.0%) | 0 (0.0%) |
| Total (Category) | 62 (100.0%) | 0 (0.0%) |
| Total (Overall) | 1,966 (48.5%) | 2,089 (51.5%) |
Production, Transportation and Moving Occupations
The most common Production, Transportation and Moving occupations in Clarendon Hills are Transportation (97 | 2.4%), Production (85 | 2.1%), and Material Moving (23 | 0.6%).
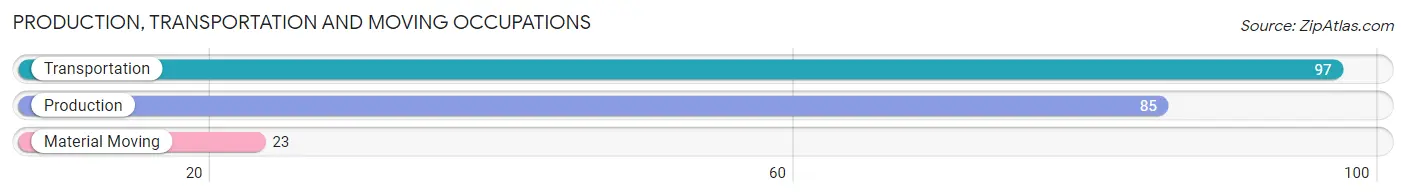
Production, Transportation and Moving Occupations by Sex
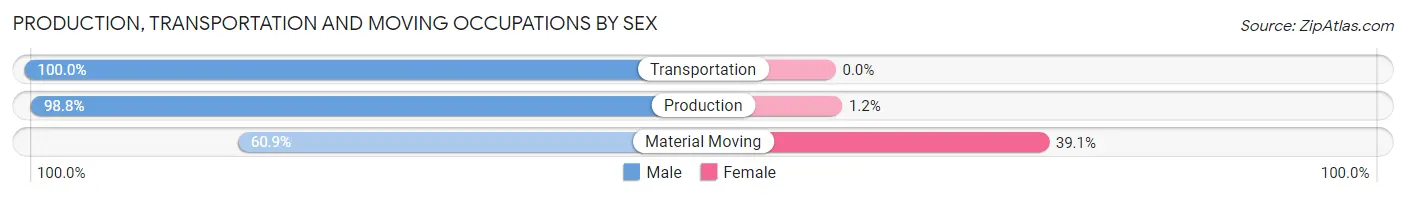
| Occupation | Male | Female |
| Production | 84 (98.8%) | 1 (1.2%) |
| Transportation | 97 (100.0%) | 0 (0.0%) |
| Material Moving | 14 (60.9%) | 9 (39.1%) |
| Total (Category) | 195 (95.1%) | 10 (4.9%) |
| Total (Overall) | 1,966 (48.5%) | 2,089 (51.5%) |
Employment Industries by Sex in Clarendon Hills
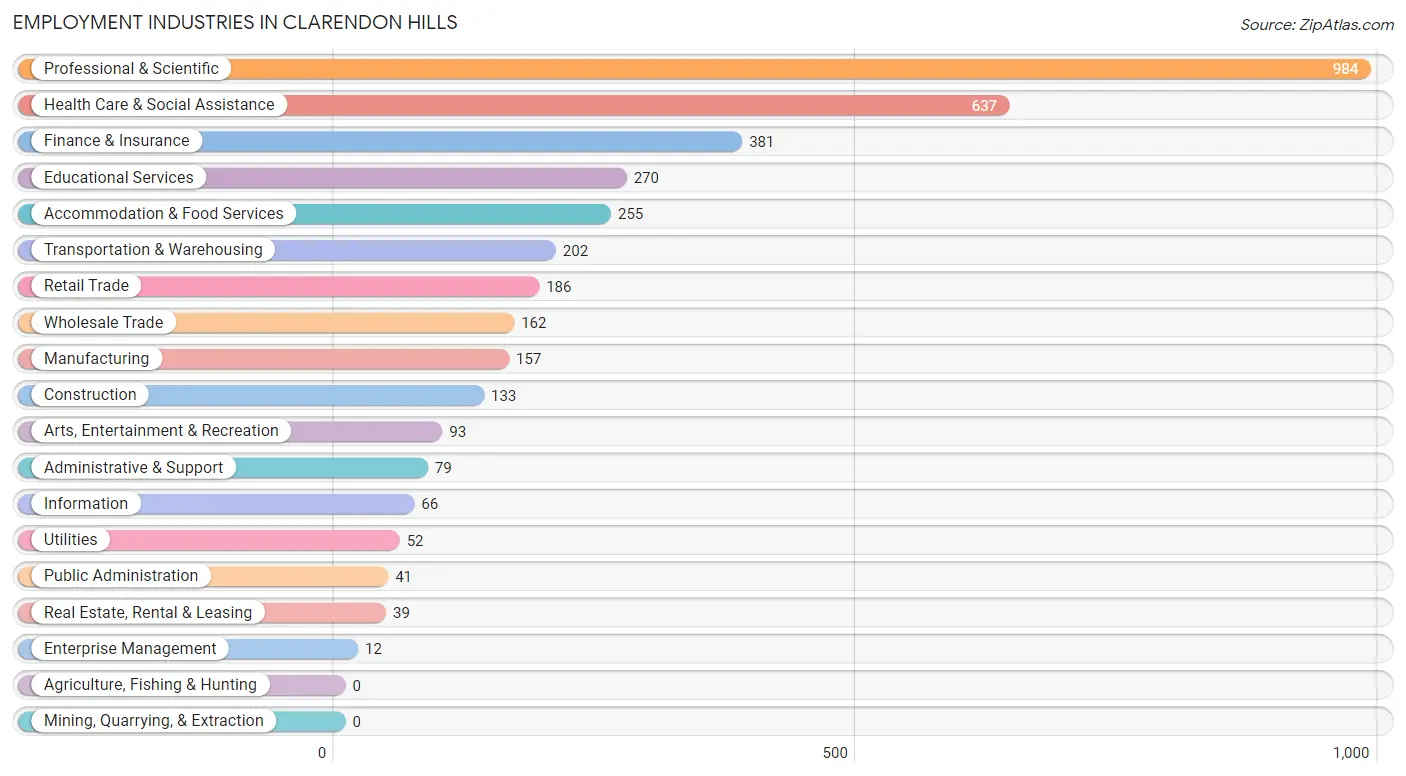
Employment Industries in Clarendon Hills
The major employment industries in Clarendon Hills include Professional & Scientific (984 | 24.3%), Health Care & Social Assistance (637 | 15.7%), Finance & Insurance (381 | 9.4%), Educational Services (270 | 6.7%), and Accommodation & Food Services (255 | 6.3%).
Employment Industries by Sex in Clarendon Hills
The Clarendon Hills industries that see more men than women are Utilities (100.0%), Enterprise Management (100.0%), and Public Administration (100.0%), whereas the industries that tend to have a higher number of women are Real Estate, Rental & Leasing (100.0%), Transportation & Warehousing (88.6%), and Health Care & Social Assistance (80.7%).
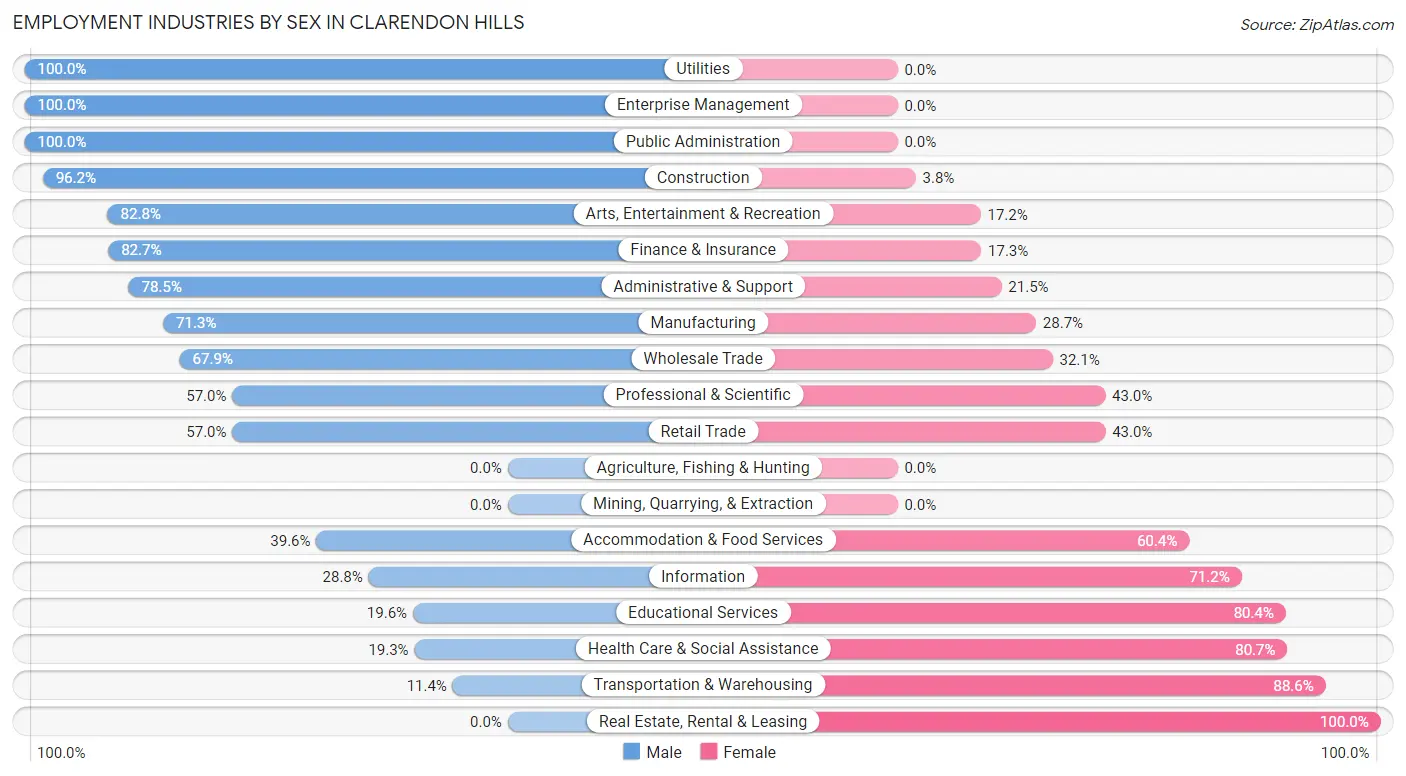
| Industry | Male | Female |
| Agriculture, Fishing & Hunting | 0 (0.0%) | 0 (0.0%) |
| Mining, Quarrying, & Extraction | 0 (0.0%) | 0 (0.0%) |
| Construction | 128 (96.2%) | 5 (3.8%) |
| Manufacturing | 112 (71.3%) | 45 (28.7%) |
| Wholesale Trade | 110 (67.9%) | 52 (32.1%) |
| Retail Trade | 106 (57.0%) | 80 (43.0%) |
| Transportation & Warehousing | 23 (11.4%) | 179 (88.6%) |
| Utilities | 52 (100.0%) | 0 (0.0%) |
| Information | 19 (28.8%) | 47 (71.2%) |
| Finance & Insurance | 315 (82.7%) | 66 (17.3%) |
| Real Estate, Rental & Leasing | 0 (0.0%) | 39 (100.0%) |
| Professional & Scientific | 561 (57.0%) | 423 (43.0%) |
| Enterprise Management | 12 (100.0%) | 0 (0.0%) |
| Administrative & Support | 62 (78.5%) | 17 (21.5%) |
| Educational Services | 53 (19.6%) | 217 (80.4%) |
| Health Care & Social Assistance | 123 (19.3%) | 514 (80.7%) |
| Arts, Entertainment & Recreation | 77 (82.8%) | 16 (17.2%) |
| Accommodation & Food Services | 101 (39.6%) | 154 (60.4%) |
| Public Administration | 41 (100.0%) | 0 (0.0%) |
| Total | 1,966 (48.5%) | 2,089 (51.5%) |
Education in Clarendon Hills
School Enrollment in Clarendon Hills
The most common levels of schooling among the 2,891 students in Clarendon Hills are high school (897 | 31.0%), middle school (720 | 24.9%), and elementary school (500 | 17.3%).
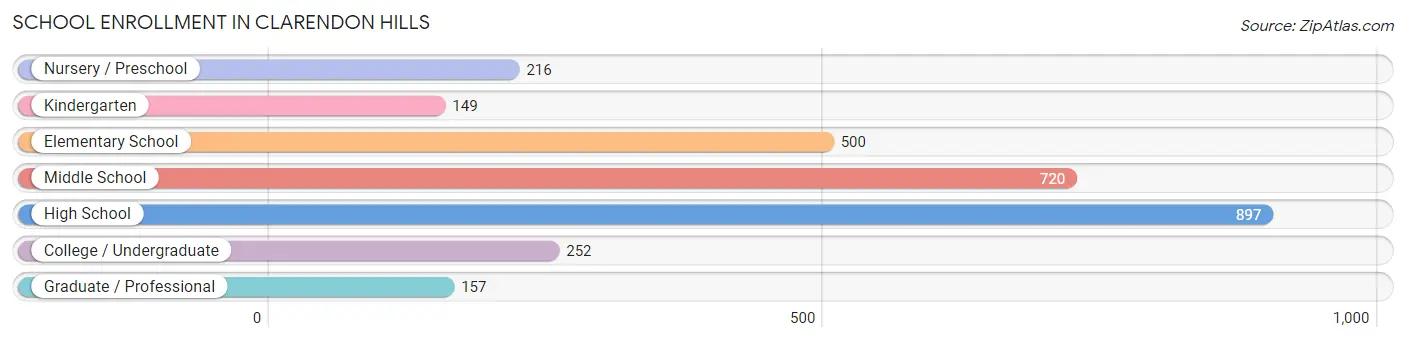
| School Level | # Students | % Students |
| Nursery / Preschool | 216 | 7.5% |
| Kindergarten | 149 | 5.1% |
| Elementary School | 500 | 17.3% |
| Middle School | 720 | 24.9% |
| High School | 897 | 31.0% |
| College / Undergraduate | 252 | 8.7% |
| Graduate / Professional | 157 | 5.4% |
| Total | 2,891 | 100.0% |
School Enrollment by Age by Funding Source in Clarendon Hills
Out of a total of 2,891 students who are enrolled in schools in Clarendon Hills, 604 (20.9%) attend a private institution, while the remaining 2,287 (79.1%) are enrolled in public schools. The age group of 3 to 4 year olds has the highest likelihood of being enrolled in private schools, with 140 (67.3% in the age bracket) enrolled. Conversely, the age group of 25 to 34 year olds has the lowest likelihood of being enrolled in a private school, with 21 (100.0% in the age bracket) attending a public institution.
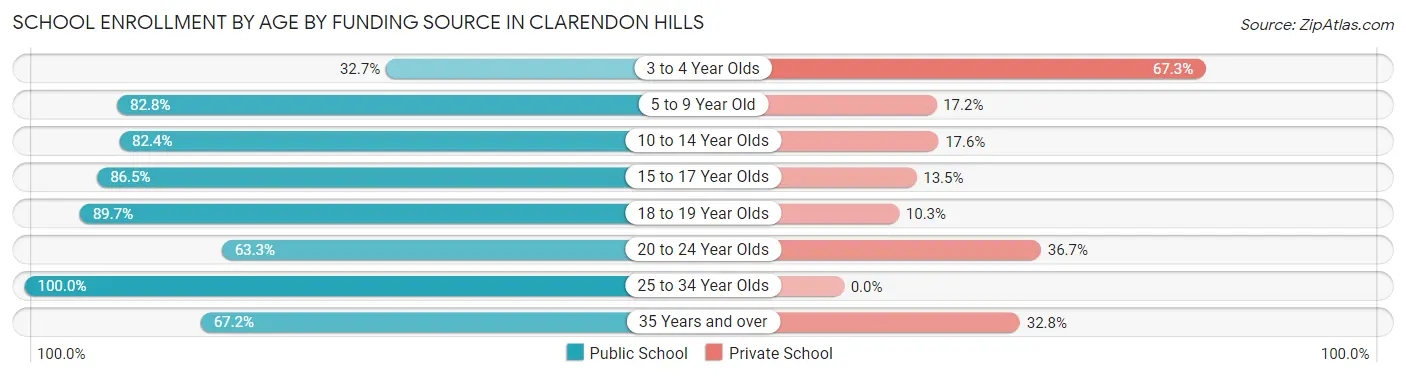
| Age Bracket | Public School | Private School |
| 3 to 4 Year Olds | 68 (32.7%) | 140 (67.3%) |
| 5 to 9 Year Old | 504 (82.8%) | 105 (17.2%) |
| 10 to 14 Year Olds | 683 (82.4%) | 146 (17.6%) |
| 15 to 17 Year Olds | 652 (86.5%) | 102 (13.5%) |
| 18 to 19 Year Olds | 192 (89.7%) | 22 (10.3%) |
| 20 to 24 Year Olds | 81 (63.3%) | 47 (36.7%) |
| 25 to 34 Year Olds | 21 (100.0%) | 0 (0.0%) |
| 35 Years and over | 86 (67.2%) | 42 (32.8%) |
| Total | 2,287 (79.1%) | 604 (20.9%) |
Educational Attainment by Field of Study in Clarendon Hills
Business (961 | 20.2%), engineering (702 | 14.7%), education (455 | 9.6%), science & technology (396 | 8.3%), and social sciences (388 | 8.2%) are the most common fields of study among 4,762 individuals in Clarendon Hills who have obtained a bachelor's degree or higher.
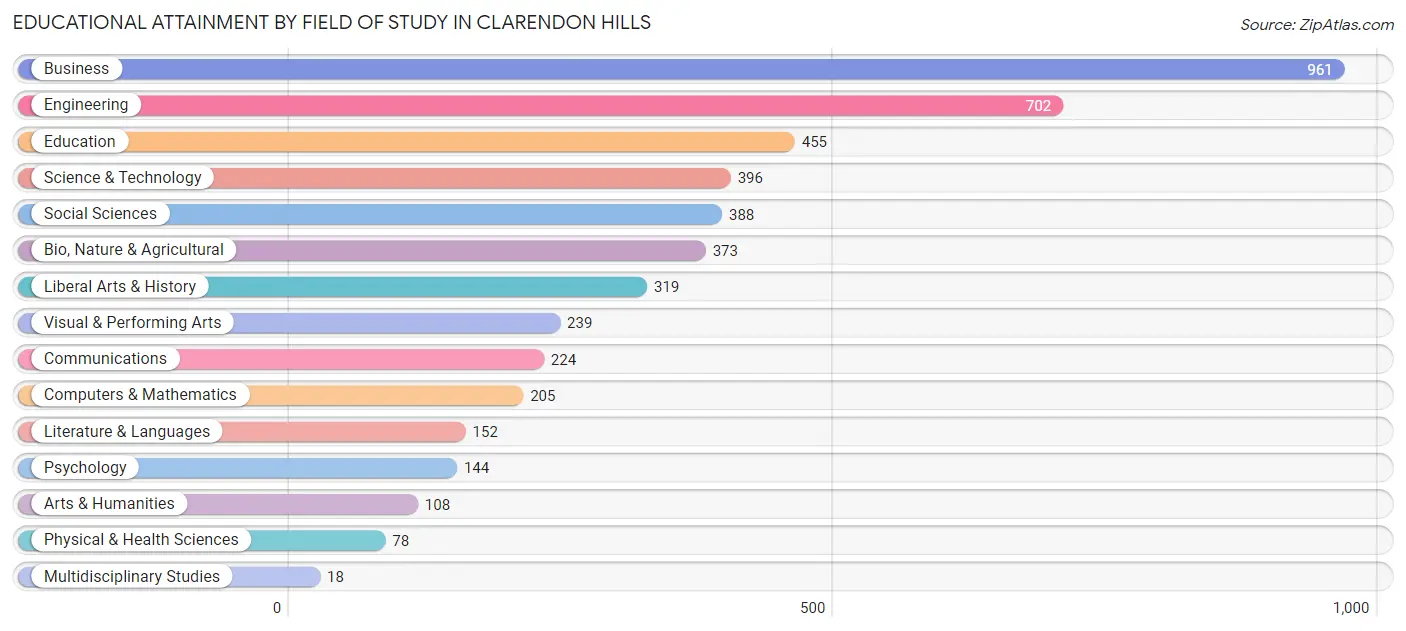
| Field of Study | # Graduates | % Graduates |
| Computers & Mathematics | 205 | 4.3% |
| Bio, Nature & Agricultural | 373 | 7.8% |
| Physical & Health Sciences | 78 | 1.6% |
| Psychology | 144 | 3.0% |
| Social Sciences | 388 | 8.2% |
| Engineering | 702 | 14.7% |
| Multidisciplinary Studies | 18 | 0.4% |
| Science & Technology | 396 | 8.3% |
| Business | 961 | 20.2% |
| Education | 455 | 9.6% |
| Literature & Languages | 152 | 3.2% |
| Liberal Arts & History | 319 | 6.7% |
| Visual & Performing Arts | 239 | 5.0% |
| Communications | 224 | 4.7% |
| Arts & Humanities | 108 | 2.3% |
| Total | 4,762 | 100.0% |
Transportation & Commute in Clarendon Hills
Vehicle Availability by Sex in Clarendon Hills
The most prevalent vehicle ownership categories in Clarendon Hills are males with 2 vehicles (1,273, accounting for 65.4%) and females with 2 vehicles (1,162, making up 64.7%).
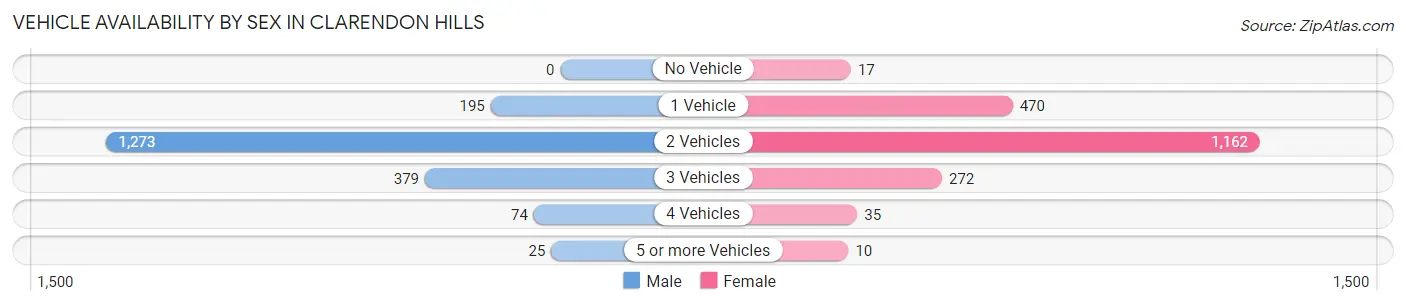
| Vehicles Available | Male | Female |
| No Vehicle | 0 (0.0%) | 17 (0.9%) |
| 1 Vehicle | 195 (10.0%) | 470 (23.9%) |
| 2 Vehicles | 1,273 (65.4%) | 1,162 (59.1%) |
| 3 Vehicles | 379 (19.5%) | 272 (13.8%) |
| 4 Vehicles | 74 (3.8%) | 35 (1.8%) |
| 5 or more Vehicles | 25 (1.3%) | 10 (0.5%) |
| Total | 1,946 (100.0%) | 1,966 (100.0%) |
Commute Time in Clarendon Hills
The most frequently occuring commute durations in Clarendon Hills are 45 to 59 minutes (440 commuters, 16.2%), 10 to 14 minutes (387 commuters, 14.2%), and 20 to 24 minutes (342 commuters, 12.6%).
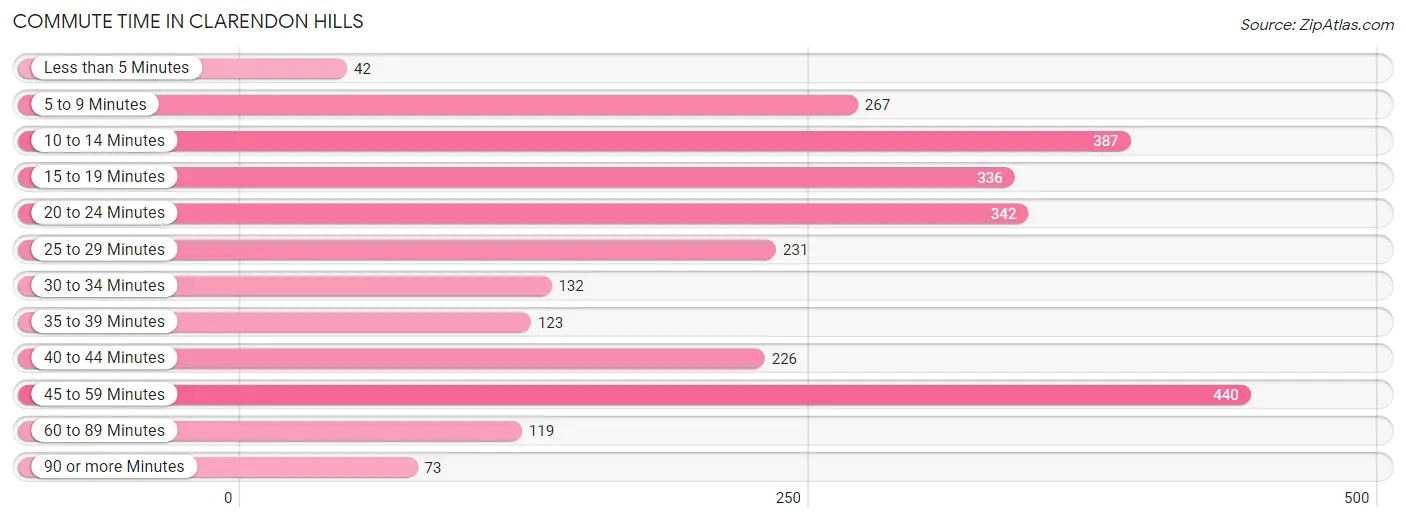
| Commute Time | # Commuters | % Commuters |
| Less than 5 Minutes | 42 | 1.5% |
| 5 to 9 Minutes | 267 | 9.8% |
| 10 to 14 Minutes | 387 | 14.2% |
| 15 to 19 Minutes | 336 | 12.4% |
| 20 to 24 Minutes | 342 | 12.6% |
| 25 to 29 Minutes | 231 | 8.5% |
| 30 to 34 Minutes | 132 | 4.9% |
| 35 to 39 Minutes | 123 | 4.5% |
| 40 to 44 Minutes | 226 | 8.3% |
| 45 to 59 Minutes | 440 | 16.2% |
| 60 to 89 Minutes | 119 | 4.4% |
| 90 or more Minutes | 73 | 2.7% |
Commute Time by Sex in Clarendon Hills
The most common commute times in Clarendon Hills are 45 to 59 minutes (302 commuters, 20.9%) for males and 10 to 14 minutes (198 commuters, 15.5%) for females.
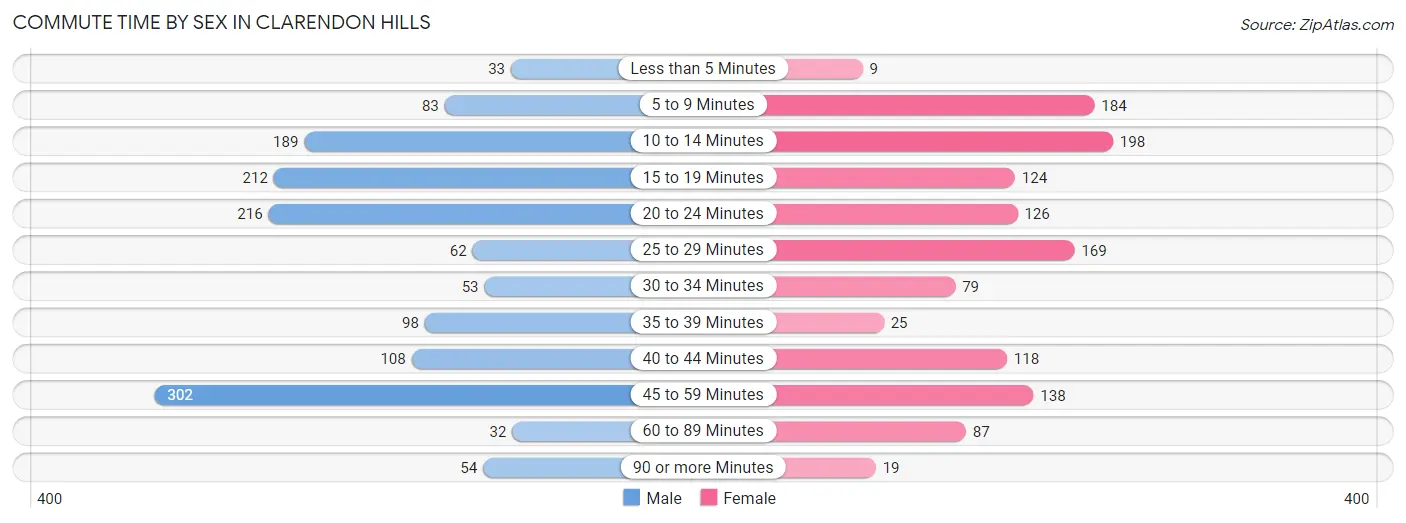
| Commute Time | Male | Female |
| Less than 5 Minutes | 33 (2.3%) | 9 (0.7%) |
| 5 to 9 Minutes | 83 (5.8%) | 184 (14.4%) |
| 10 to 14 Minutes | 189 (13.1%) | 198 (15.5%) |
| 15 to 19 Minutes | 212 (14.7%) | 124 (9.7%) |
| 20 to 24 Minutes | 216 (15.0%) | 126 (9.9%) |
| 25 to 29 Minutes | 62 (4.3%) | 169 (13.2%) |
| 30 to 34 Minutes | 53 (3.7%) | 79 (6.2%) |
| 35 to 39 Minutes | 98 (6.8%) | 25 (2.0%) |
| 40 to 44 Minutes | 108 (7.5%) | 118 (9.2%) |
| 45 to 59 Minutes | 302 (20.9%) | 138 (10.8%) |
| 60 to 89 Minutes | 32 (2.2%) | 87 (6.8%) |
| 90 or more Minutes | 54 (3.7%) | 19 (1.5%) |
Time of Departure to Work by Sex in Clarendon Hills
The most frequent times of departure to work in Clarendon Hills are 7:30 AM to 7:59 AM (282, 19.6%) for males and 6:30 AM to 6:59 AM (270, 21.2%) for females.
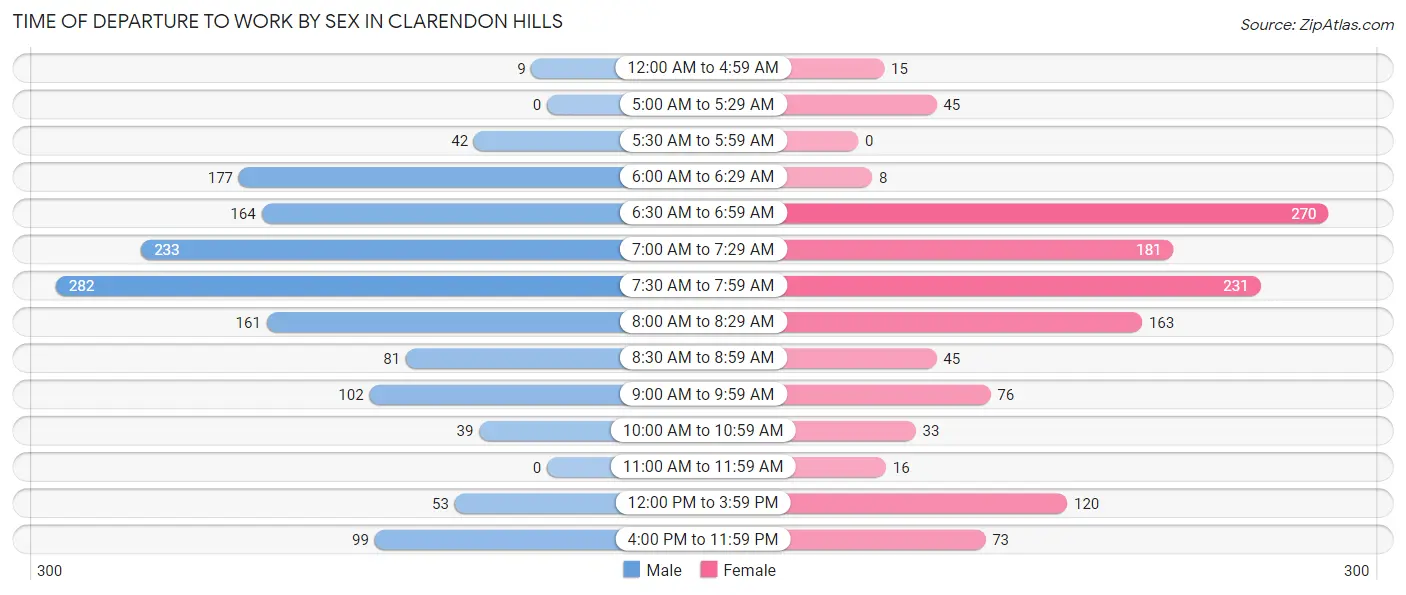
| Time of Departure | Male | Female |
| 12:00 AM to 4:59 AM | 9 (0.6%) | 15 (1.2%) |
| 5:00 AM to 5:29 AM | 0 (0.0%) | 45 (3.5%) |
| 5:30 AM to 5:59 AM | 42 (2.9%) | 0 (0.0%) |
| 6:00 AM to 6:29 AM | 177 (12.3%) | 8 (0.6%) |
| 6:30 AM to 6:59 AM | 164 (11.4%) | 270 (21.2%) |
| 7:00 AM to 7:29 AM | 233 (16.2%) | 181 (14.2%) |
| 7:30 AM to 7:59 AM | 282 (19.6%) | 231 (18.1%) |
| 8:00 AM to 8:29 AM | 161 (11.2%) | 163 (12.8%) |
| 8:30 AM to 8:59 AM | 81 (5.6%) | 45 (3.5%) |
| 9:00 AM to 9:59 AM | 102 (7.1%) | 76 (6.0%) |
| 10:00 AM to 10:59 AM | 39 (2.7%) | 33 (2.6%) |
| 11:00 AM to 11:59 AM | 0 (0.0%) | 16 (1.3%) |
| 12:00 PM to 3:59 PM | 53 (3.7%) | 120 (9.4%) |
| 4:00 PM to 11:59 PM | 99 (6.9%) | 73 (5.7%) |
| Total | 1,442 (100.0%) | 1,276 (100.0%) |
Housing Occupancy in Clarendon Hills
Occupancy by Ownership in Clarendon Hills
Of the total 3,277 dwellings in Clarendon Hills, owner-occupied units account for 2,757 (84.1%), while renter-occupied units make up 520 (15.9%).
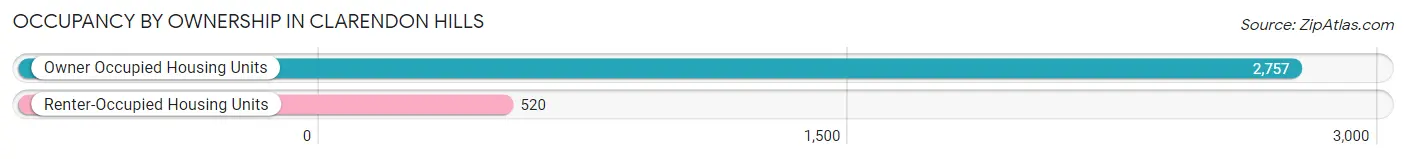
| Occupancy | # Housing Units | % Housing Units |
| Owner Occupied Housing Units | 2,757 | 84.1% |
| Renter-Occupied Housing Units | 520 | 15.9% |
| Total Occupied Housing Units | 3,277 | 100.0% |
Occupancy by Household Size in Clarendon Hills
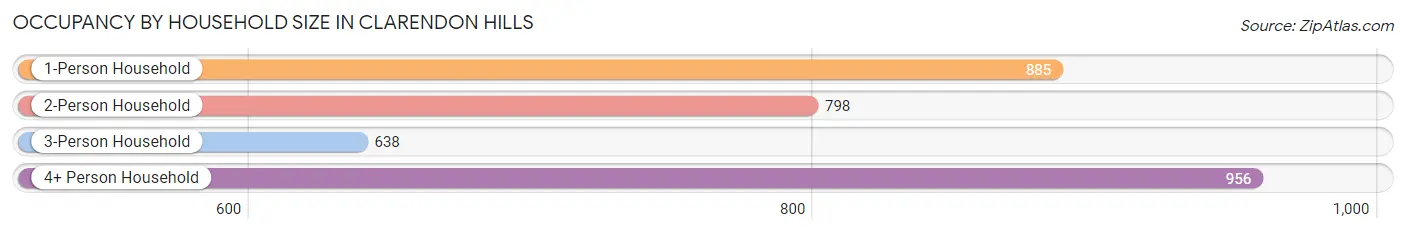
| Household Size | # Housing Units | % Housing Units |
| 1-Person Household | 885 | 27.0% |
| 2-Person Household | 798 | 24.3% |
| 3-Person Household | 638 | 19.5% |
| 4+ Person Household | 956 | 29.2% |
| Total Housing Units | 3,277 | 100.0% |
Occupancy by Ownership by Household Size in Clarendon Hills
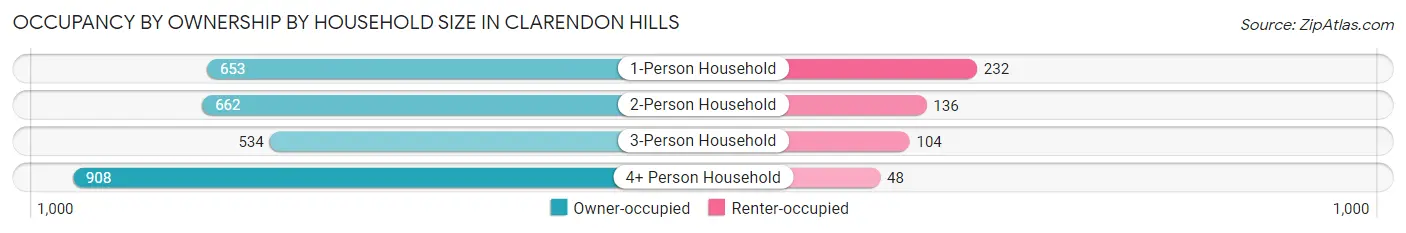
| Household Size | Owner-occupied | Renter-occupied |
| 1-Person Household | 653 (73.8%) | 232 (26.2%) |
| 2-Person Household | 662 (83.0%) | 136 (17.0%) |
| 3-Person Household | 534 (83.7%) | 104 (16.3%) |
| 4+ Person Household | 908 (95.0%) | 48 (5.0%) |
| Total Housing Units | 2,757 (84.1%) | 520 (15.9%) |
Occupancy by Educational Attainment in Clarendon Hills
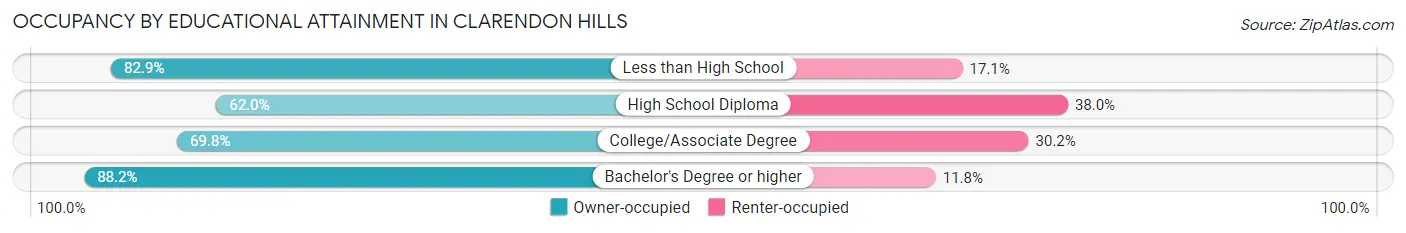
| Household Size | Owner-occupied | Renter-occupied |
| Less than High School | 87 (82.9%) | 18 (17.1%) |
| High School Diploma | 119 (62.0%) | 73 (38.0%) |
| College/Associate Degree | 291 (69.8%) | 126 (30.2%) |
| Bachelor's Degree or higher | 2,260 (88.2%) | 303 (11.8%) |
Occupancy by Age of Householder in Clarendon Hills
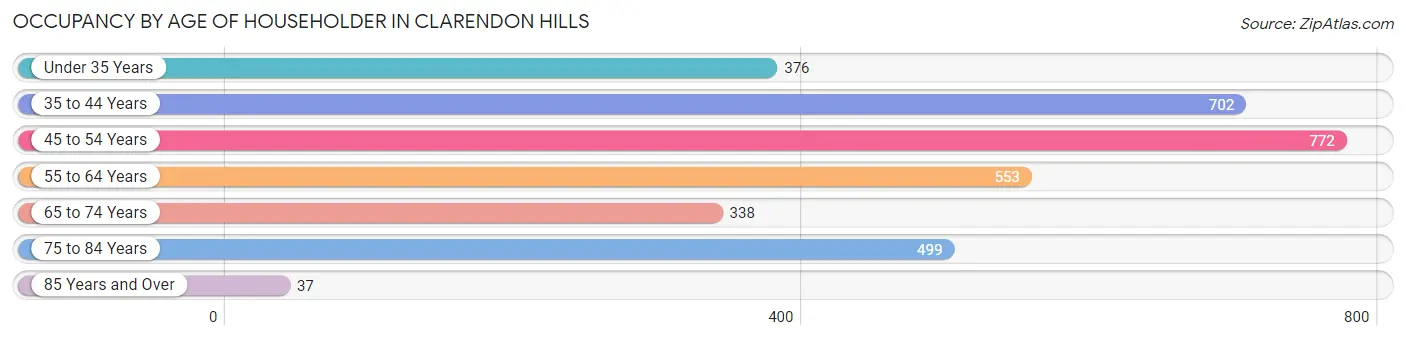
| Age Bracket | # Households | % Households |
| Under 35 Years | 376 | 11.5% |
| 35 to 44 Years | 702 | 21.4% |
| 45 to 54 Years | 772 | 23.6% |
| 55 to 64 Years | 553 | 16.9% |
| 65 to 74 Years | 338 | 10.3% |
| 75 to 84 Years | 499 | 15.2% |
| 85 Years and Over | 37 | 1.1% |
| Total | 3,277 | 100.0% |
Housing Finances in Clarendon Hills
Median Income by Occupancy in Clarendon Hills
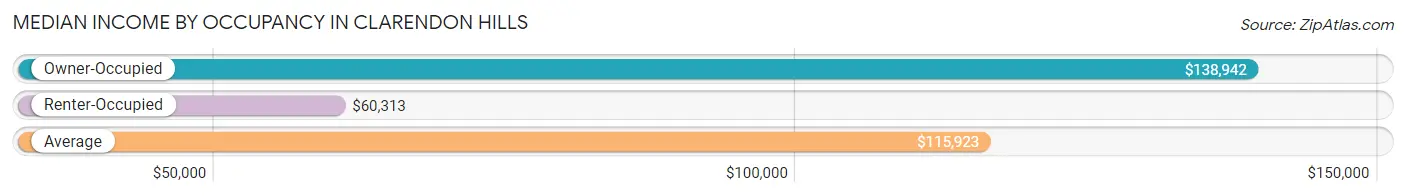
| Occupancy Type | # Households | Median Income |
| Owner-Occupied | 2,757 (84.1%) | $138,942 |
| Renter-Occupied | 520 (15.9%) | $60,313 |
| Average | 3,277 (100.0%) | $115,923 |
Occupancy by Householder Income Bracket in Clarendon Hills
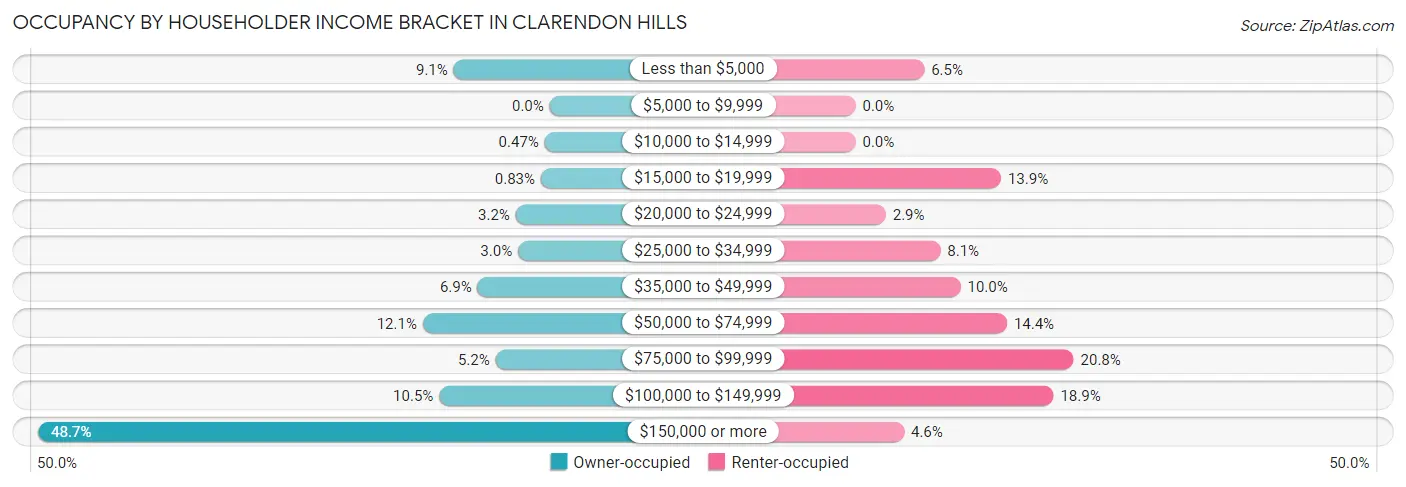
| Income Bracket | Owner-occupied | Renter-occupied |
| Less than $5,000 | 252 (9.1%) | 34 (6.5%) |
| $5,000 to $9,999 | 0 (0.0%) | 0 (0.0%) |
| $10,000 to $14,999 | 13 (0.5%) | 0 (0.0%) |
| $15,000 to $19,999 | 23 (0.8%) | 72 (13.9%) |
| $20,000 to $24,999 | 89 (3.2%) | 15 (2.9%) |
| $25,000 to $34,999 | 83 (3.0%) | 42 (8.1%) |
| $35,000 to $49,999 | 189 (6.9%) | 52 (10.0%) |
| $50,000 to $74,999 | 333 (12.1%) | 75 (14.4%) |
| $75,000 to $99,999 | 142 (5.1%) | 108 (20.8%) |
| $100,000 to $149,999 | 290 (10.5%) | 98 (18.9%) |
| $150,000 or more | 1,343 (48.7%) | 24 (4.6%) |
| Total | 2,757 (100.0%) | 520 (100.0%) |
Monthly Housing Cost Tiers in Clarendon Hills
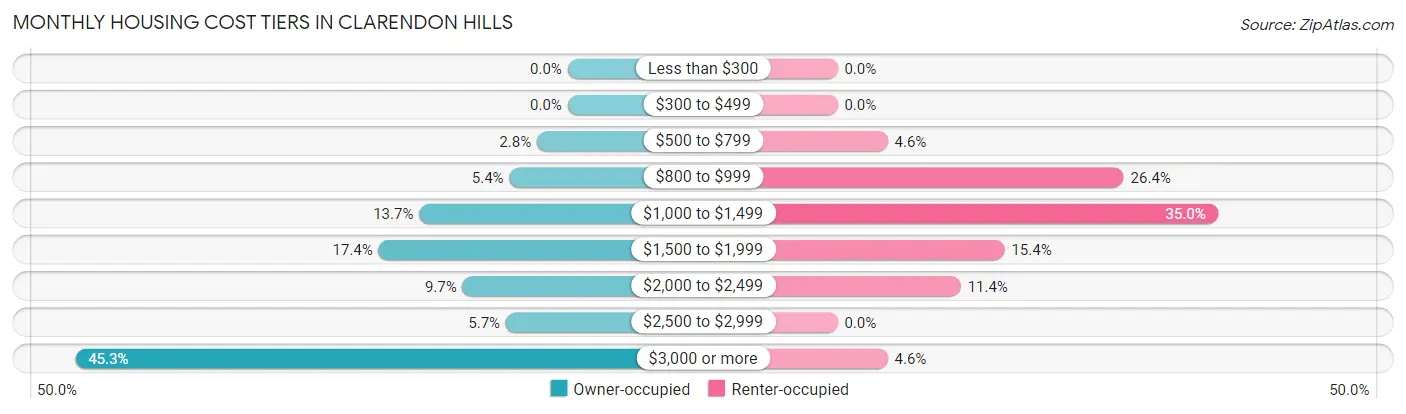
| Monthly Cost | Owner-occupied | Renter-occupied |
| Less than $300 | 0 (0.0%) | 0 (0.0%) |
| $300 to $499 | 0 (0.0%) | 0 (0.0%) |
| $500 to $799 | 78 (2.8%) | 24 (4.6%) |
| $800 to $999 | 148 (5.4%) | 137 (26.4%) |
| $1,000 to $1,499 | 377 (13.7%) | 182 (35.0%) |
| $1,500 to $1,999 | 480 (17.4%) | 80 (15.4%) |
| $2,000 to $2,499 | 267 (9.7%) | 59 (11.4%) |
| $2,500 to $2,999 | 157 (5.7%) | 0 (0.0%) |
| $3,000 or more | 1,250 (45.3%) | 24 (4.6%) |
| Total | 2,757 (100.0%) | 520 (100.0%) |
Physical Housing Characteristics in Clarendon Hills
Housing Structures in Clarendon Hills
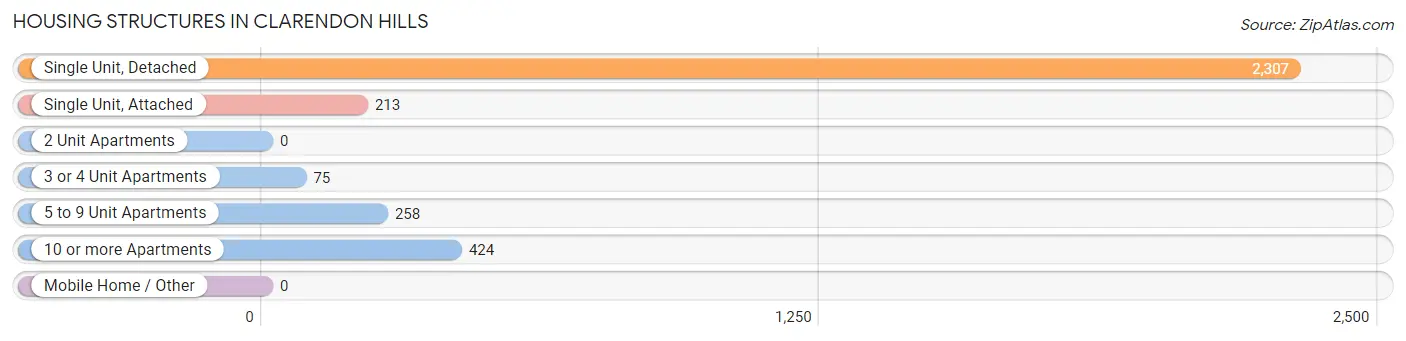
| Structure Type | # Housing Units | % Housing Units |
| Single Unit, Detached | 2,307 | 70.4% |
| Single Unit, Attached | 213 | 6.5% |
| 2 Unit Apartments | 0 | 0.0% |
| 3 or 4 Unit Apartments | 75 | 2.3% |
| 5 to 9 Unit Apartments | 258 | 7.9% |
| 10 or more Apartments | 424 | 12.9% |
| Mobile Home / Other | 0 | 0.0% |
| Total | 3,277 | 100.0% |
Housing Structures by Occupancy in Clarendon Hills
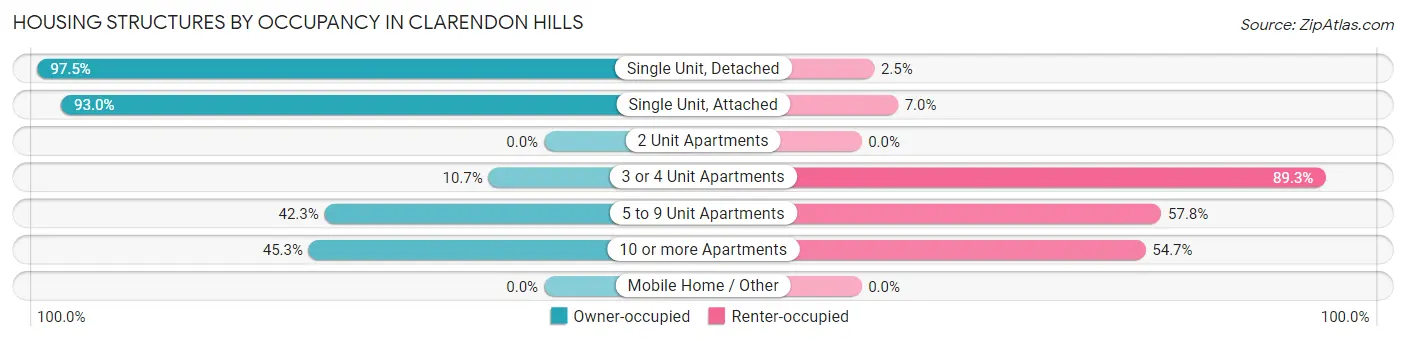
| Structure Type | Owner-occupied | Renter-occupied |
| Single Unit, Detached | 2,250 (97.5%) | 57 (2.5%) |
| Single Unit, Attached | 198 (93.0%) | 15 (7.0%) |
| 2 Unit Apartments | 0 (0.0%) | 0 (0.0%) |
| 3 or 4 Unit Apartments | 8 (10.7%) | 67 (89.3%) |
| 5 to 9 Unit Apartments | 109 (42.2%) | 149 (57.8%) |
| 10 or more Apartments | 192 (45.3%) | 232 (54.7%) |
| Mobile Home / Other | 0 (0.0%) | 0 (0.0%) |
| Total | 2,757 (84.1%) | 520 (15.9%) |
Housing Structures by Number of Rooms in Clarendon Hills
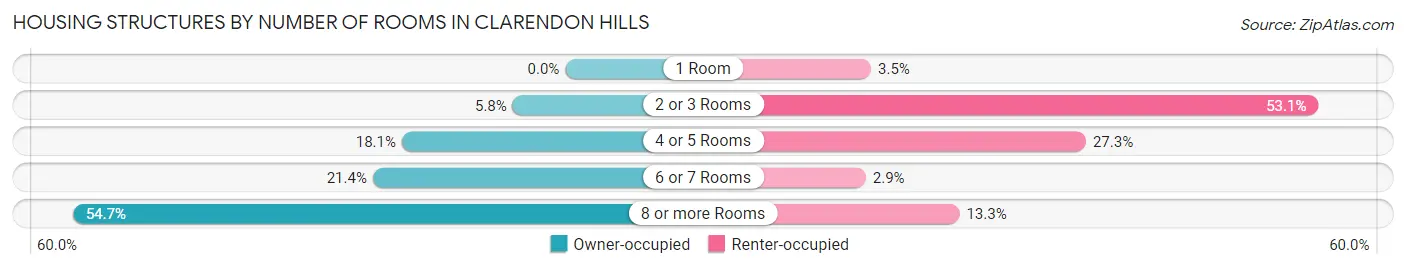
| Number of Rooms | Owner-occupied | Renter-occupied |
| 1 Room | 0 (0.0%) | 18 (3.5%) |
| 2 or 3 Rooms | 161 (5.8%) | 276 (53.1%) |
| 4 or 5 Rooms | 500 (18.1%) | 142 (27.3%) |
| 6 or 7 Rooms | 589 (21.4%) | 15 (2.9%) |
| 8 or more Rooms | 1,507 (54.7%) | 69 (13.3%) |
| Total | 2,757 (100.0%) | 520 (100.0%) |
Housing Structure by Heating Type in Clarendon Hills
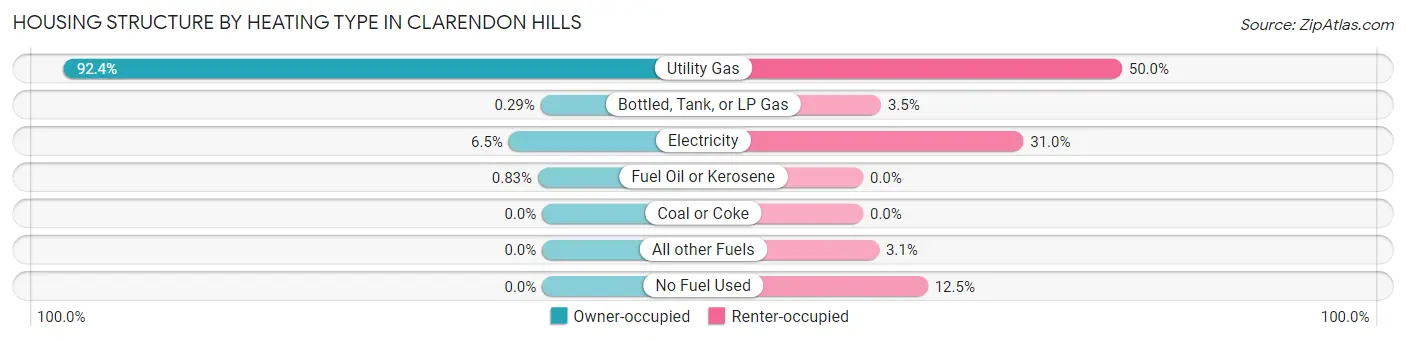
| Heating Type | Owner-occupied | Renter-occupied |
| Utility Gas | 2,548 (92.4%) | 260 (50.0%) |
| Bottled, Tank, or LP Gas | 8 (0.3%) | 18 (3.5%) |
| Electricity | 178 (6.5%) | 161 (31.0%) |
| Fuel Oil or Kerosene | 23 (0.8%) | 0 (0.0%) |
| Coal or Coke | 0 (0.0%) | 0 (0.0%) |
| All other Fuels | 0 (0.0%) | 16 (3.1%) |
| No Fuel Used | 0 (0.0%) | 65 (12.5%) |
| Total | 2,757 (100.0%) | 520 (100.0%) |
Household Vehicle Usage in Clarendon Hills
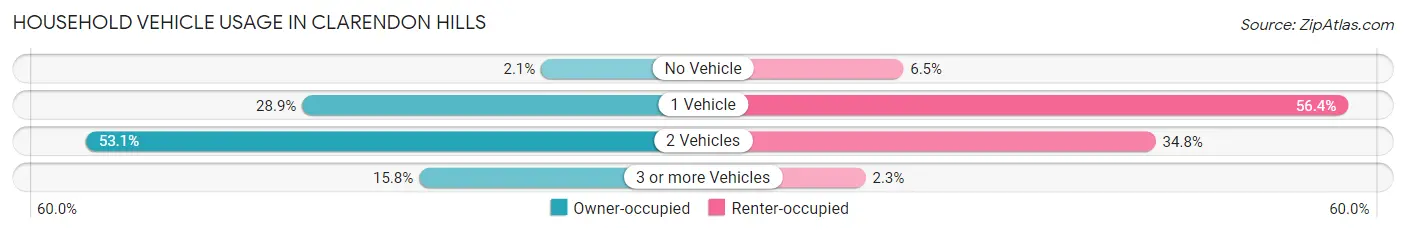
| Vehicles per Household | Owner-occupied | Renter-occupied |
| No Vehicle | 59 (2.1%) | 34 (6.5%) |
| 1 Vehicle | 797 (28.9%) | 293 (56.4%) |
| 2 Vehicles | 1,465 (53.1%) | 181 (34.8%) |
| 3 or more Vehicles | 436 (15.8%) | 12 (2.3%) |
| Total | 2,757 (100.0%) | 520 (100.0%) |
Real Estate & Mortgages in Clarendon Hills
Real Estate and Mortgage Overview in Clarendon Hills
| Characteristic | Without Mortgage | With Mortgage |
| Housing Units | 712 | 2,045 |
| Median Property Value | $548,900 | $576,100 |
| Median Household Income | $98,462 | $1,068 |
| Monthly Housing Costs | $1,357 | $1,233 |
| Real Estate Taxes | $10,001 | $0 |
Property Value by Mortgage Status in Clarendon Hills
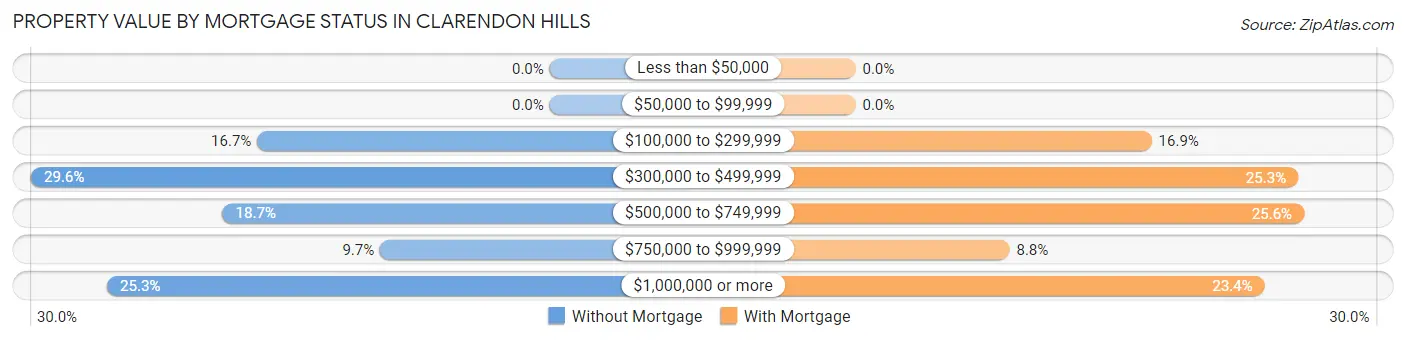
| Property Value | Without Mortgage | With Mortgage |
| Less than $50,000 | 0 (0.0%) | 0 (0.0%) |
| $50,000 to $99,999 | 0 (0.0%) | 0 (0.0%) |
| $100,000 to $299,999 | 119 (16.7%) | 346 (16.9%) |
| $300,000 to $499,999 | 211 (29.6%) | 517 (25.3%) |
| $500,000 to $749,999 | 133 (18.7%) | 524 (25.6%) |
| $750,000 to $999,999 | 69 (9.7%) | 180 (8.8%) |
| $1,000,000 or more | 180 (25.3%) | 478 (23.4%) |
| Total | 712 (100.0%) | 2,045 (100.0%) |
Household Income by Mortgage Status in Clarendon Hills
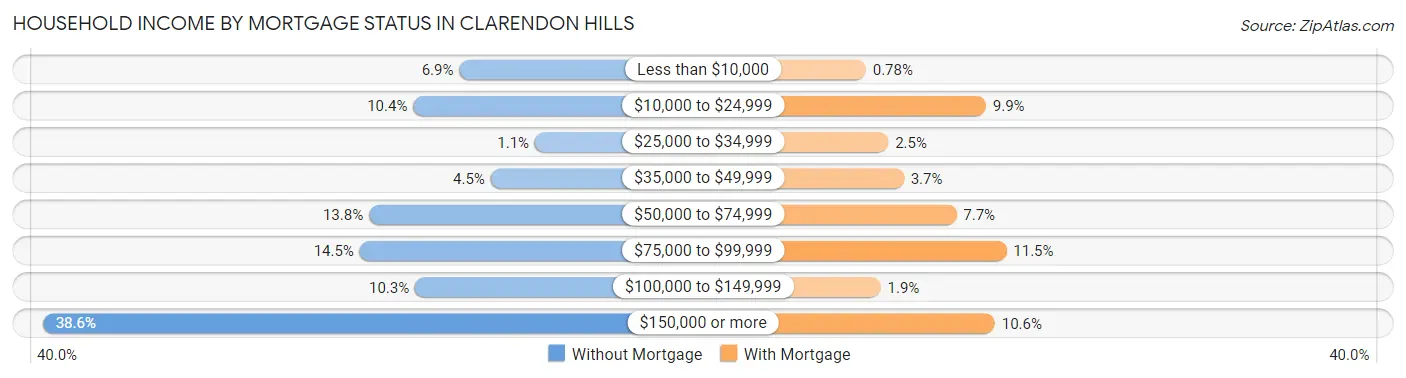
| Household Income | Without Mortgage | With Mortgage |
| Less than $10,000 | 49 (6.9%) | 16 (0.8%) |
| $10,000 to $24,999 | 74 (10.4%) | 203 (9.9%) |
| $25,000 to $34,999 | 8 (1.1%) | 51 (2.5%) |
| $35,000 to $49,999 | 32 (4.5%) | 75 (3.7%) |
| $50,000 to $74,999 | 98 (13.8%) | 157 (7.7%) |
| $75,000 to $99,999 | 103 (14.5%) | 235 (11.5%) |
| $100,000 to $149,999 | 73 (10.2%) | 39 (1.9%) |
| $150,000 or more | 275 (38.6%) | 217 (10.6%) |
| Total | 712 (100.0%) | 2,045 (100.0%) |
Property Value to Household Income Ratio in Clarendon Hills
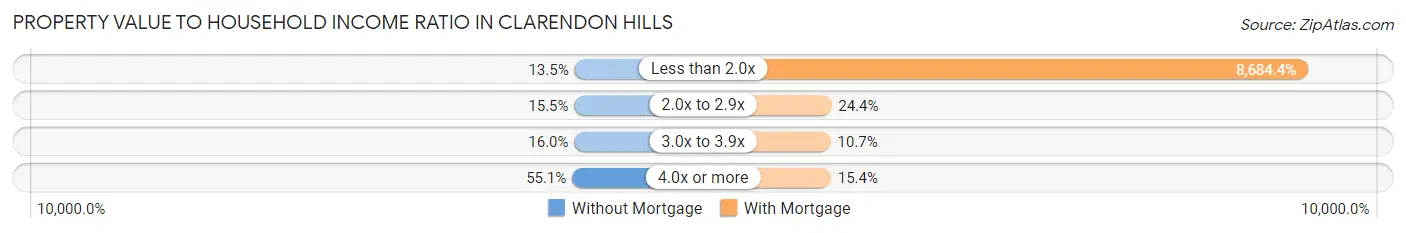
| Value-to-Income Ratio | Without Mortgage | With Mortgage |
| Less than 2.0x | 96 (13.5%) | 177,596 (8,684.4%) |
| 2.0x to 2.9x | 110 (15.4%) | 499 (24.4%) |
| 3.0x to 3.9x | 114 (16.0%) | 218 (10.7%) |
| 4.0x or more | 392 (55.1%) | 315 (15.4%) |
| Total | 712 (100.0%) | 2,045 (100.0%) |
Real Estate Taxes by Mortgage Status in Clarendon Hills
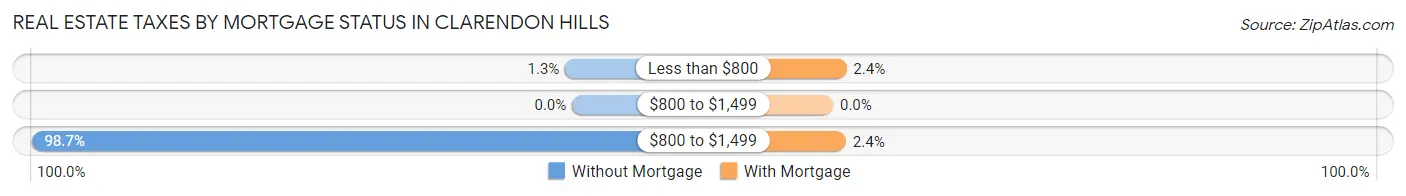
| Property Taxes | Without Mortgage | With Mortgage |
| Less than $800 | 9 (1.3%) | 50 (2.4%) |
| $800 to $1,499 | 0 (0.0%) | 0 (0.0%) |
| $800 to $1,499 | 703 (98.7%) | 48 (2.4%) |
| Total | 712 (100.0%) | 2,045 (100.0%) |
Health & Disability in Clarendon Hills
Health Insurance Coverage by Age in Clarendon Hills
| Age Bracket | With Coverage | Without Coverage |
| Under 6 Years | 573 (100.0%) | 0 (0.0%) |
| 6 to 18 Years | 2,216 (97.8%) | 50 (2.2%) |
| 19 to 25 Years | 312 (92.9%) | 24 (7.1%) |
| 26 to 34 Years | 434 (87.7%) | 61 (12.3%) |
| 35 to 44 Years | 1,152 (87.3%) | 167 (12.7%) |
| 45 to 54 Years | 1,334 (97.2%) | 39 (2.8%) |
| 55 to 64 Years | 948 (89.6%) | 110 (10.4%) |
| 65 to 74 Years | 501 (96.7%) | 17 (3.3%) |
| 75 Years and older | 720 (100.0%) | 0 (0.0%) |
| Total | 8,190 (94.6%) | 468 (5.4%) |
Health Insurance Coverage by Citizenship Status in Clarendon Hills
| Citizenship Status | With Coverage | Without Coverage |
| Native Born | 573 (100.0%) | 0 (0.0%) |
| Foreign Born, Citizen | 2,216 (97.8%) | 50 (2.2%) |
| Foreign Born, not a Citizen | 312 (92.9%) | 24 (7.1%) |
Health Insurance Coverage by Household Income in Clarendon Hills
| Household Income | With Coverage | Without Coverage |
| Under $25,000 | 823 (93.7%) | 55 (6.3%) |
| $25,000 to $49,999 | 532 (62.4%) | 321 (37.6%) |
| $50,000 to $74,999 | 563 (97.6%) | 14 (2.4%) |
| $75,000 to $99,999 | 515 (100.0%) | 0 (0.0%) |
| $100,000 and over | 5,719 (98.7%) | 75 (1.3%) |
Public vs Private Health Insurance Coverage by Age in Clarendon Hills
| Age Bracket | Public Insurance | Private Insurance |
| Under 6 | 70 (12.2%) | 503 (87.8%) |
| 6 to 18 Years | 368 (16.2%) | 2,002 (88.3%) |
| 19 to 25 Years | 27 (8.0%) | 285 (84.8%) |
| 25 to 34 Years | 23 (4.6%) | 411 (83.0%) |
| 35 to 44 Years | 62 (4.7%) | 1,130 (85.7%) |
| 45 to 54 Years | 0 (0.0%) | 1,334 (97.2%) |
| 55 to 64 Years | 331 (31.3%) | 632 (59.7%) |
| 65 to 74 Years | 428 (82.6%) | 340 (65.6%) |
| 75 Years and over | 720 (100.0%) | 462 (64.2%) |
| Total | 2,029 (23.4%) | 7,099 (82.0%) |
Disability Status by Sex by Age in Clarendon Hills
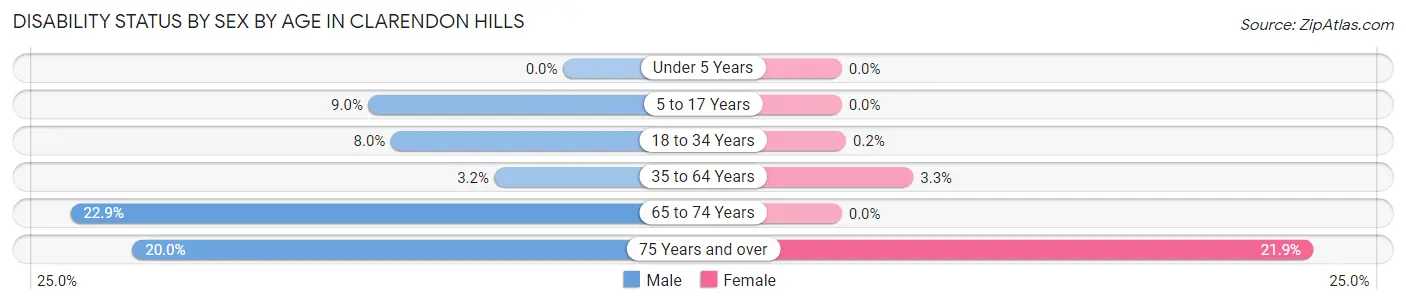
| Age Bracket | Male | Female |
| Under 5 Years | 0 (0.0%) | 0 (0.0%) |
| 5 to 17 Years | 120 (9.0%) | 0 (0.0%) |
| 18 to 34 Years | 39 (8.0%) | 1 (0.2%) |
| 35 to 64 Years | 56 (3.2%) | 66 (3.3%) |
| 65 to 74 Years | 43 (22.9%) | 0 (0.0%) |
| 75 Years and over | 47 (20.0%) | 106 (21.9%) |
Disability Class by Sex by Age in Clarendon Hills
Disability Class: Hearing Difficulty
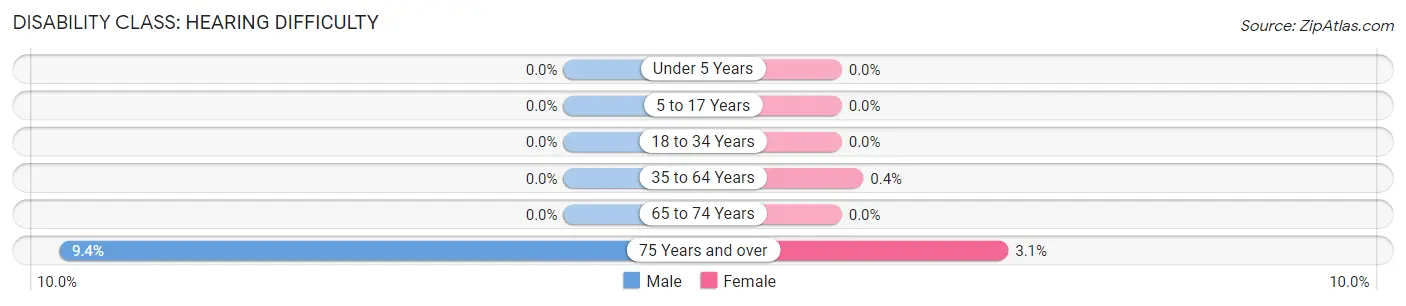
| Age Bracket | Male | Female |
| Under 5 Years | 0 (0.0%) | 0 (0.0%) |
| 5 to 17 Years | 0 (0.0%) | 0 (0.0%) |
| 18 to 34 Years | 0 (0.0%) | 0 (0.0%) |
| 35 to 64 Years | 0 (0.0%) | 8 (0.4%) |
| 65 to 74 Years | 0 (0.0%) | 0 (0.0%) |
| 75 Years and over | 22 (9.4%) | 15 (3.1%) |
Disability Class: Vision Difficulty
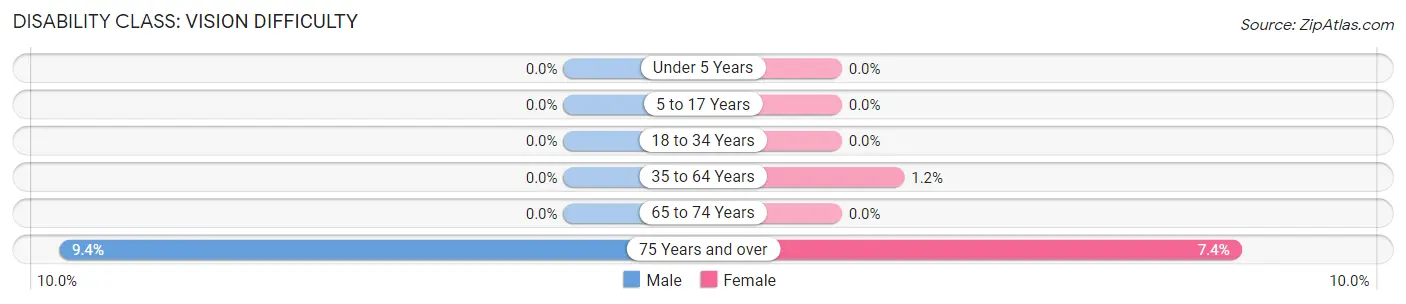
| Age Bracket | Male | Female |
| Under 5 Years | 0 (0.0%) | 0 (0.0%) |
| 5 to 17 Years | 0 (0.0%) | 0 (0.0%) |
| 18 to 34 Years | 0 (0.0%) | 0 (0.0%) |
| 35 to 64 Years | 0 (0.0%) | 23 (1.2%) |
| 65 to 74 Years | 0 (0.0%) | 0 (0.0%) |
| 75 Years and over | 22 (9.4%) | 36 (7.4%) |
Disability Class: Cognitive Difficulty
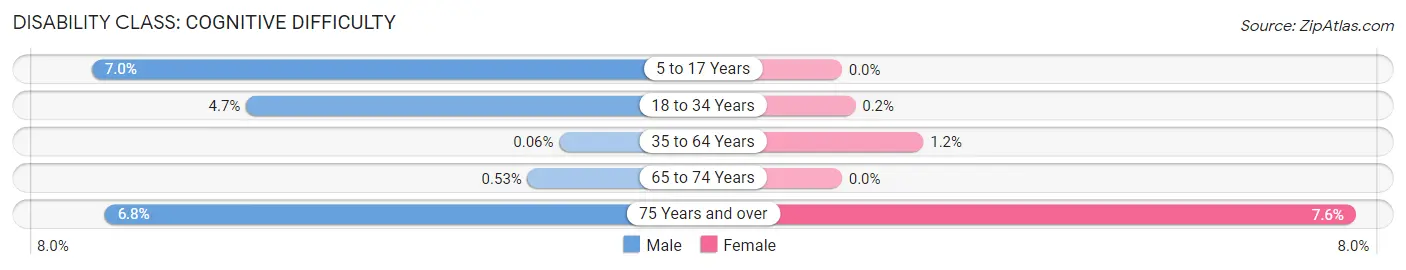
| Age Bracket | Male | Female |
| 5 to 17 Years | 93 (7.0%) | 0 (0.0%) |
| 18 to 34 Years | 23 (4.7%) | 1 (0.2%) |
| 35 to 64 Years | 1 (0.1%) | 24 (1.2%) |
| 65 to 74 Years | 1 (0.5%) | 0 (0.0%) |
| 75 Years and over | 16 (6.8%) | 37 (7.6%) |
Disability Class: Ambulatory Difficulty
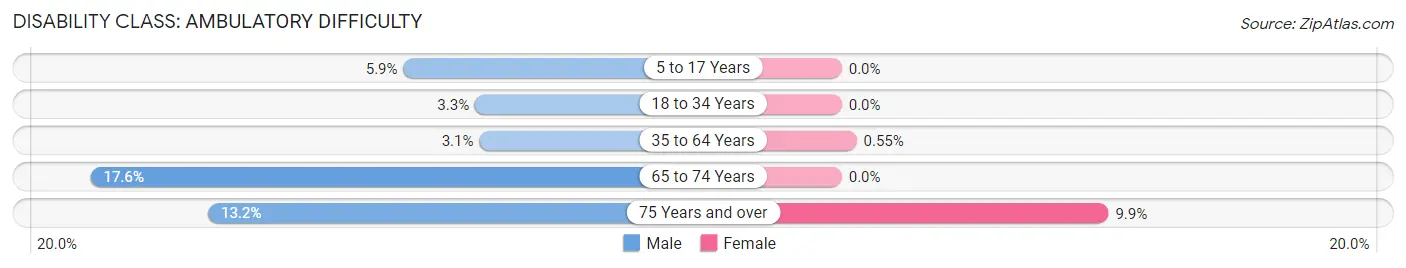
| Age Bracket | Male | Female |
| 5 to 17 Years | 79 (5.9%) | 0 (0.0%) |
| 18 to 34 Years | 16 (3.3%) | 0 (0.0%) |
| 35 to 64 Years | 55 (3.1%) | 11 (0.5%) |
| 65 to 74 Years | 33 (17.5%) | 0 (0.0%) |
| 75 Years and over | 31 (13.2%) | 48 (9.9%) |
Disability Class: Self-Care Difficulty
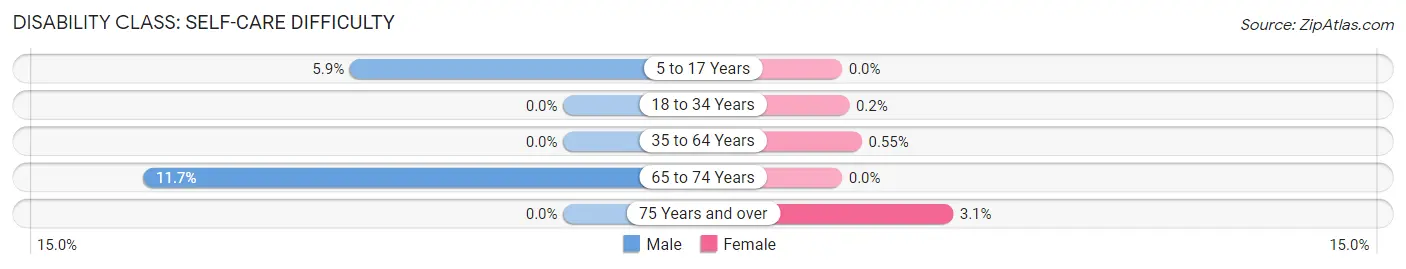
| Age Bracket | Male | Female |
| 5 to 17 Years | 79 (5.9%) | 0 (0.0%) |
| 18 to 34 Years | 0 (0.0%) | 1 (0.2%) |
| 35 to 64 Years | 0 (0.0%) | 11 (0.5%) |
| 65 to 74 Years | 22 (11.7%) | 0 (0.0%) |
| 75 Years and over | 0 (0.0%) | 15 (3.1%) |
Technology Access in Clarendon Hills
Computing Device Access in Clarendon Hills
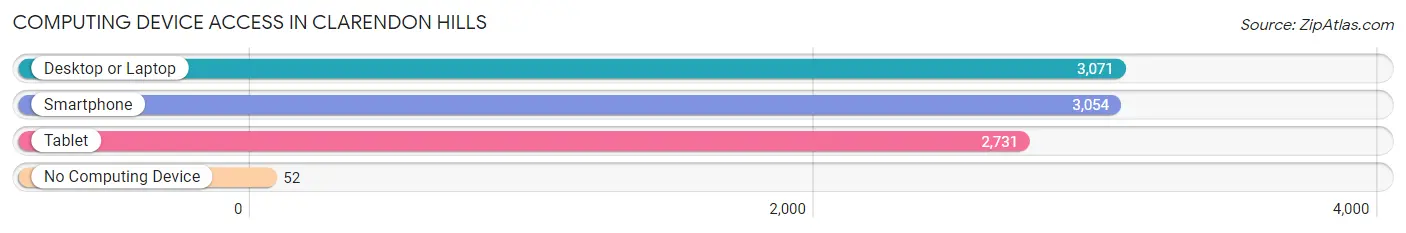
| Device Type | # Households | % Households |
| Desktop or Laptop | 3,071 | 93.7% |
| Smartphone | 3,054 | 93.2% |
| Tablet | 2,731 | 83.3% |
| No Computing Device | 52 | 1.6% |
| Total | 3,277 | 100.0% |
Internet Access in Clarendon Hills
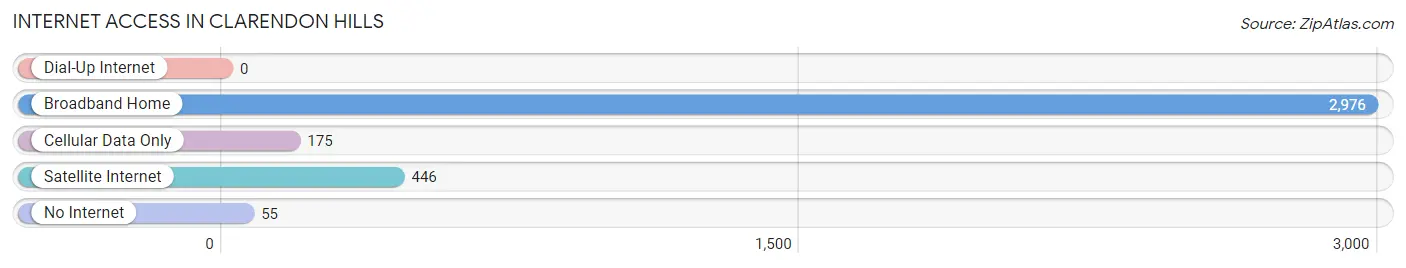
| Internet Type | # Households | % Households |
| Dial-Up Internet | 0 | 0.0% |
| Broadband Home | 2,976 | 90.8% |
| Cellular Data Only | 175 | 5.3% |
| Satellite Internet | 446 | 13.6% |
| No Internet | 55 | 1.7% |
| Total | 3,277 | 100.0% |
Clarendon Hills Summary
Clarendon Hills is a village located in DuPage County, Illinois, United States. The population was 8,427 at the 2010 census. It is a suburb of Chicago, located approximately 20 miles west of the city.
History
Clarendon Hills was first settled in the 1830s by a group of German immigrants. The village was originally known as “Clarendon” and was incorporated in 1924. The name was changed to “Clarendon Hills” in 1927.
The village was originally a farming community, but in the 1950s and 1960s, it began to develop into a residential suburb of Chicago. The village has since become a popular destination for families looking for a quiet, safe place to live.
Geography
Clarendon Hills is located at 41°48'17" North, 87°58'45" West (41.804609, -87.979167). According to the 2010 census, the village has a total area of 2.7 square miles, all of it land.
The village is bordered by Hinsdale to the north, Westmont to the east, Darien to the south, and Oak Brook to the west.
Economy
Clarendon Hills is primarily a residential community, but it does have a few businesses. The village is home to several restaurants, a grocery store, a bank, and a few other small businesses.
The village is also home to a number of corporate offices, including a regional office of the American Red Cross, a regional office of the American Cancer Society, and a regional office of the American Heart Association.
Demographics
As of the 2010 census, the population of Clarendon Hills was 8,427. The racial makeup of the village was 94.2% White, 0.7% African American, 0.1% Native American, 3.2% Asian, 0.1% Pacific Islander, 0.7% from other races, and 1.1% from two or more races. Hispanic or Latino of any race were 3.2% of the population.
The median household income in Clarendon Hills was $118,945 in 2019, and the median family income was $133,945. The per capita income for the village was $58,945.
The village is served by two school districts: Hinsdale Township High School District 86 and Community Consolidated School District 181. The village is also home to a number of private schools, including St. Isaac Jogues Catholic School and Clarendon Hills Montessori School.
Common Questions
What is Per Capita Income in Clarendon Hills?
Per Capita income in Clarendon Hills is $77,133.
What is the Median Family Income in Clarendon Hills?
Median Family Income in Clarendon Hills is $186,875.
What is the Median Household income in Clarendon Hills?
Median Household Income in Clarendon Hills is $115,923.
What is Income or Wage Gap in Clarendon Hills?
Income or Wage Gap in Clarendon Hills is 61.8%.
Women in Clarendon Hills earn 38.2 cents for every dollar earned by a man.
What is Inequality or Gini Index in Clarendon Hills?
Inequality or Gini Index in Clarendon Hills is 0.56.
What is the Total Population of Clarendon Hills?
Total Population of Clarendon Hills is 8,658.
What is the Total Male Population of Clarendon Hills?
Total Male Population of Clarendon Hills is 4,228.
What is the Total Female Population of Clarendon Hills?
Total Female Population of Clarendon Hills is 4,430.
What is the Ratio of Males per 100 Females in Clarendon Hills?
There are 95.44 Males per 100 Females in Clarendon Hills.
What is the Ratio of Females per 100 Males in Clarendon Hills?
There are 104.78 Females per 100 Males in Clarendon Hills.
What is the Median Population Age in Clarendon Hills?
Median Population Age in Clarendon Hills is 41.1 Years.
What is the Average Family Size in Clarendon Hills
Average Family Size in Clarendon Hills is 3.2 People.
What is the Average Household Size in Clarendon Hills
Average Household Size in Clarendon Hills is 2.6 People.
How Large is the Labor Force in Clarendon Hills?
There are 4,172 People in the Labor Forcein in Clarendon Hills.
What is the Percentage of People in the Labor Force in Clarendon Hills?
64.8% of People are in the Labor Force in Clarendon Hills.
What is the Unemployment Rate in Clarendon Hills?
Unemployment Rate in Clarendon Hills is 2.8%.