Cities with the Highest Percentage of Population Employed in Legal Services & Support in Massachusetts
RELATED REPORTS & OPTIONS
Legal Services & Support
Massachusetts
Compare Cities
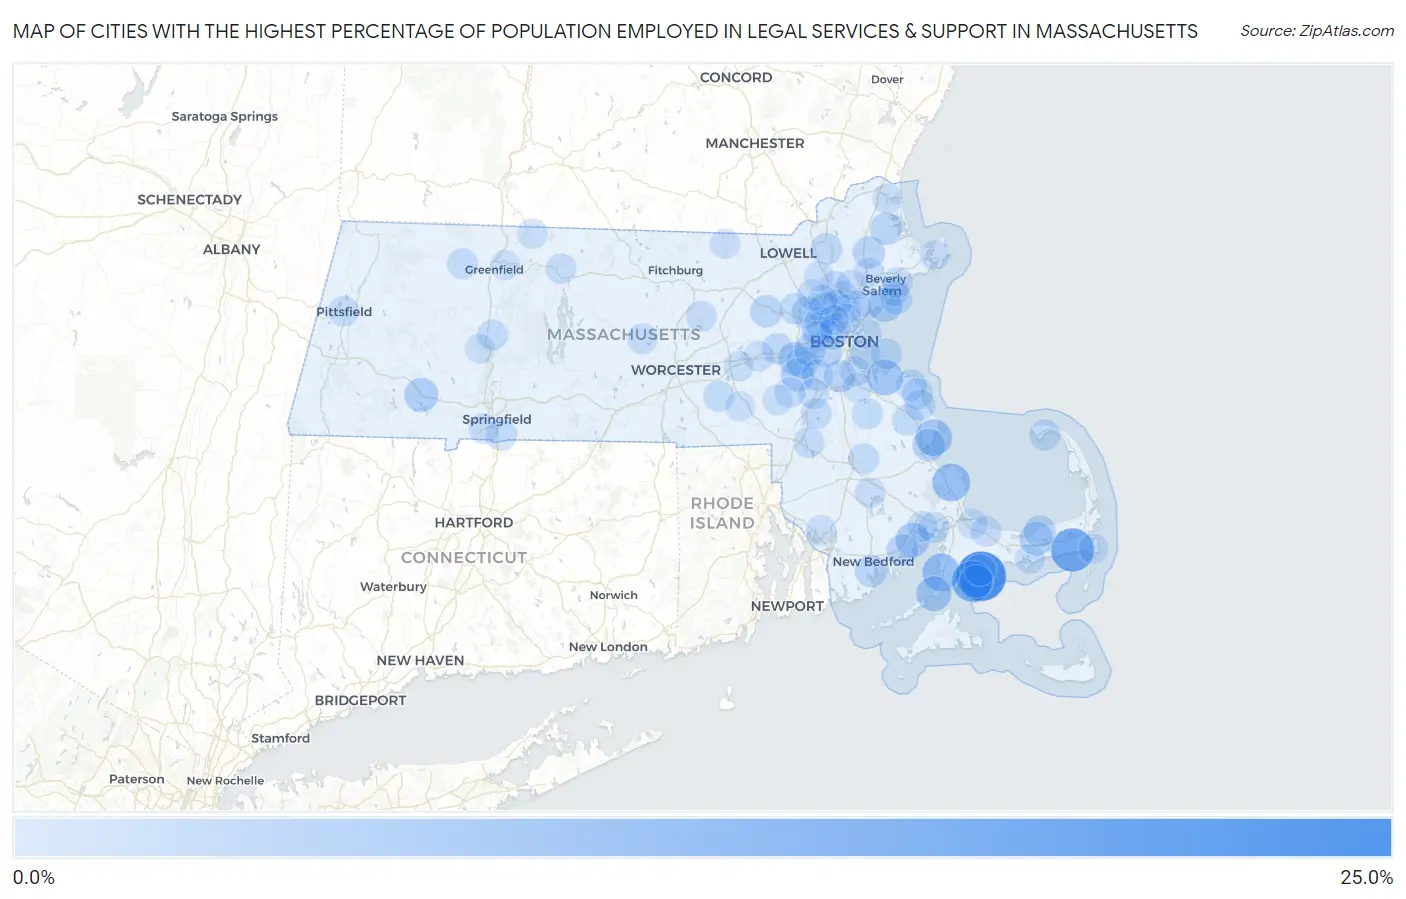
Map of Cities with the Highest Percentage of Population Employed in Legal Services & Support in Massachusetts
0.0%
25.0%
Cities with the Highest Percentage of Population Employed in Legal Services & Support in Massachusetts
| City | % Employed | vs State | vs National | |
| 1. | Popponesset Island | 23.1% | 1.5%(+21.6)#1 | 1.2%(+21.9)#43 |
| 2. | Harwich Port | 15.9% | 1.5%(+14.4)#2 | 1.2%(+14.7)#92 |
| 3. | Monomoscoy Island | 13.2% | 1.5%(+11.7)#3 | 1.2%(+12.1)#138 |
| 4. | The Pinehills | 9.6% | 1.5%(+8.06)#4 | 1.2%(+8.37)#249 |
| 5. | West Falmouth | 9.3% | 1.5%(+7.77)#5 | 1.2%(+8.08)#259 |
| 6. | Duxbury | 8.1% | 1.5%(+6.63)#6 | 1.2%(+6.93)#334 |
| 7. | Hingham | 7.5% | 1.5%(+6.00)#7 | 1.2%(+6.31)#380 |
| 8. | Woods Hole | 6.5% | 1.5%(+5.02)#8 | 1.2%(+5.32)#509 |
| 9. | Marion Center | 5.9% | 1.5%(+4.44)#9 | 1.2%(+4.74)#617 |
| 10. | Swampscott | 5.6% | 1.5%(+4.13)#10 | 1.2%(+4.44)#679 |
| 11. | Blandford | 5.6% | 1.5%(+4.13)#11 | 1.2%(+4.43)#680 |
| 12. | Wellesley | 5.0% | 1.5%(+3.50)#12 | 1.2%(+3.80)#843 |
| 13. | Yarmouth Port | 4.9% | 1.5%(+3.40)#13 | 1.2%(+3.70)#875 |
| 14. | Winchester | 4.7% | 1.5%(+3.16)#14 | 1.2%(+3.47)#969 |
| 15. | Dover | 4.4% | 1.5%(+2.88)#15 | 1.2%(+3.19)#1,053 |
| 16. | New Seabury | 4.3% | 1.5%(+2.80)#16 | 1.2%(+3.11)#1,091 |
| 17. | South Duxbury | 4.1% | 1.5%(+2.56)#17 | 1.2%(+2.87)#1,206 |
| 18. | Topsfield | 3.8% | 1.5%(+2.31)#18 | 1.2%(+2.61)#1,326 |
| 19. | Needham | 3.7% | 1.5%(+2.25)#19 | 1.2%(+2.56)#1,362 |
| 20. | Milton | 3.7% | 1.5%(+2.19)#20 | 1.2%(+2.49)#1,416 |
| 21. | West Concord | 3.7% | 1.5%(+2.17)#21 | 1.2%(+2.48)#1,424 |
| 22. | Bliss Corner | 3.7% | 1.5%(+2.17)#22 | 1.2%(+2.47)#1,427 |
| 23. | Rowley | 3.6% | 1.5%(+2.15)#23 | 1.2%(+2.45)#1,441 |
| 24. | Brookline | 3.6% | 1.5%(+2.07)#24 | 1.2%(+2.38)#1,495 |
| 25. | Newton | 3.5% | 1.5%(+1.98)#25 | 1.2%(+2.29)#1,561 |
| 26. | Dennis | 3.4% | 1.5%(+1.94)#26 | 1.2%(+2.24)#1,591 |
| 27. | Belmont | 3.3% | 1.5%(+1.85)#27 | 1.2%(+2.16)#1,647 |
| 28. | Cedar Crest | 3.3% | 1.5%(+1.77)#28 | 1.2%(+2.07)#1,712 |
| 29. | Mattapoisett Center | 3.2% | 1.5%(+1.73)#29 | 1.2%(+2.03)#1,744 |
| 30. | Marblehead | 3.1% | 1.5%(+1.62)#30 | 1.2%(+1.92)#1,833 |
| 31. | Andover | 3.0% | 1.5%(+1.53)#31 | 1.2%(+1.84)#1,905 |
| 32. | Lexington | 3.0% | 1.5%(+1.48)#32 | 1.2%(+1.79)#1,959 |
| 33. | Mashpee Neck | 2.9% | 1.5%(+1.37)#33 | 1.2%(+1.68)#2,055 |
| 34. | Provincetown | 2.8% | 1.5%(+1.31)#34 | 1.2%(+1.62)#2,131 |
| 35. | Longmeadow | 2.7% | 1.5%(+1.24)#35 | 1.2%(+1.55)#2,208 |
| 36. | Cambridge | 2.7% | 1.5%(+1.20)#36 | 1.2%(+1.51)#2,246 |
| 37. | Dedham | 2.6% | 1.5%(+1.10)#37 | 1.2%(+1.41)#2,359 |
| 38. | Cochituate | 2.6% | 1.5%(+1.10)#38 | 1.2%(+1.40)#2,365 |
| 39. | North Scituate | 2.5% | 1.5%(+1.02)#39 | 1.2%(+1.33)#2,434 |
| 40. | Hanscom Afb | 2.5% | 1.5%(+0.968)#40 | 1.2%(+1.27)#2,497 |
| 41. | Onset | 2.4% | 1.5%(+0.951)#41 | 1.2%(+1.26)#2,518 |
| 42. | Boston | 2.4% | 1.5%(+0.890)#42 | 1.2%(+1.20)#2,612 |
| 43. | Hull | 2.4% | 1.5%(+0.871)#43 | 1.2%(+1.18)#2,638 |
| 44. | Shelburne Falls | 2.4% | 1.5%(+0.866)#44 | 1.2%(+1.17)#2,644 |
| 45. | Scituate | 2.4% | 1.5%(+0.863)#45 | 1.2%(+1.17)#2,650 |
| 46. | North Pembroke | 2.3% | 1.5%(+0.824)#46 | 1.2%(+1.13)#2,699 |
| 47. | Mansfield Center | 2.3% | 1.5%(+0.811)#47 | 1.2%(+1.12)#2,718 |
| 48. | Marshfield Hills | 2.3% | 1.5%(+0.789)#48 | 1.2%(+1.09)#2,748 |
| 49. | Upton | 2.2% | 1.5%(+0.734)#49 | 1.2%(+1.04)#2,839 |
| 50. | Arlington | 2.2% | 1.5%(+0.715)#50 | 1.2%(+1.02)#2,865 |
| 51. | Bridgewater Town | 2.2% | 1.5%(+0.703)#51 | 1.2%(+1.01)#2,885 |
| 52. | Wakefield | 2.2% | 1.5%(+0.688)#52 | 1.2%(+0.993)#2,910 |
| 53. | Hatfield | 2.2% | 1.5%(+0.668)#53 | 1.2%(+0.973)#2,948 |
| 54. | Abington | 2.1% | 1.5%(+0.619)#54 | 1.2%(+0.923)#3,022 |
| 55. | Sharon | 2.1% | 1.5%(+0.584)#55 | 1.2%(+0.889)#3,085 |
| 56. | Burlington | 2.0% | 1.5%(+0.549)#56 | 1.2%(+0.854)#3,147 |
| 57. | Winthrop Town | 2.0% | 1.5%(+0.544)#57 | 1.2%(+0.848)#3,155 |
| 58. | South Lancaster | 2.0% | 1.5%(+0.501)#58 | 1.2%(+0.806)#3,234 |
| 59. | Norwood | 2.0% | 1.5%(+0.498)#59 | 1.2%(+0.802)#3,241 |
| 60. | Rutland | 1.9% | 1.5%(+0.423)#60 | 1.2%(+0.728)#3,382 |
| 61. | East Sandwich | 1.9% | 1.5%(+0.377)#61 | 1.2%(+0.682)#3,481 |
| 62. | Agawam Town | 1.8% | 1.5%(+0.359)#62 | 1.2%(+0.664)#3,519 |
| 63. | Quincy | 1.8% | 1.5%(+0.347)#63 | 1.2%(+0.652)#3,542 |
| 64. | Medfield | 1.8% | 1.5%(+0.315)#64 | 1.2%(+0.619)#3,631 |
| 65. | Wareham Center | 1.8% | 1.5%(+0.306)#65 | 1.2%(+0.611)#3,659 |
| 66. | Orange | 1.8% | 1.5%(+0.270)#66 | 1.2%(+0.575)#3,731 |
| 67. | Reading | 1.8% | 1.5%(+0.269)#67 | 1.2%(+0.574)#3,737 |
| 68. | Pittsfield | 1.7% | 1.5%(+0.250)#68 | 1.2%(+0.555)#3,782 |
| 69. | Saugus | 1.7% | 1.5%(+0.242)#69 | 1.2%(+0.547)#3,799 |
| 70. | Beverly | 1.7% | 1.5%(+0.226)#70 | 1.2%(+0.531)#3,846 |
| 71. | Framingham | 1.7% | 1.5%(+0.172)#71 | 1.2%(+0.476)#3,982 |
| 72. | Melrose | 1.6% | 1.5%(+0.161)#72 | 1.2%(+0.466)#4,003 |
| 73. | Somerville | 1.6% | 1.5%(+0.123)#73 | 1.2%(+0.427)#4,089 |
| 74. | North Lakeville | 1.6% | 1.5%(+0.102)#74 | 1.2%(+0.407)#4,144 |
| 75. | Stoneham | 1.6% | 1.5%(+0.100)#75 | 1.2%(+0.404)#4,148 |
| 76. | Watertown Town | 1.6% | 1.5%(+0.096)#76 | 1.2%(+0.401)#4,160 |
| 77. | Millis Clicquot | 1.6% | 1.5%(+0.088)#77 | 1.2%(+0.392)#4,180 |
| 78. | Malden | 1.5% | 1.5%(+0.049)#78 | 1.2%(+0.354)#4,297 |
| 79. | Medford | 1.5% | 1.5%(-0.005)#79 | 1.2%(+0.300)#4,467 |
| 80. | Northfield | 1.5% | 1.5%(-0.012)#80 | 1.2%(+0.292)#4,500 |
| 81. | Gloucester | 1.5% | 1.5%(-0.014)#81 | 1.2%(+0.291)#4,504 |
| 82. | Lynnfield | 1.5% | 1.5%(-0.034)#82 | 1.2%(+0.271)#4,560 |
| 83. | Sandwich | 1.4% | 1.5%(-0.048)#83 | 1.2%(+0.257)#4,611 |
| 84. | Greenfield | 1.4% | 1.5%(-0.054)#84 | 1.2%(+0.251)#4,633 |
| 85. | North Attleborough | 1.4% | 1.5%(-0.067)#85 | 1.2%(+0.238)#4,677 |
| 86. | Woburn | 1.4% | 1.5%(-0.080)#86 | 1.2%(+0.225)#4,715 |
| 87. | Salem | 1.4% | 1.5%(-0.113)#87 | 1.2%(+0.191)#4,823 |
| 88. | Danvers | 1.4% | 1.5%(-0.120)#88 | 1.2%(+0.185)#4,842 |
| 89. | Pepperell | 1.4% | 1.5%(-0.131)#89 | 1.2%(+0.174)#4,874 |
| 90. | Cordaville | 1.4% | 1.5%(-0.137)#90 | 1.2%(+0.168)#4,897 |
| 91. | West Yarmouth | 1.3% | 1.5%(-0.145)#91 | 1.2%(+0.160)#4,925 |
| 92. | Newburyport | 1.3% | 1.5%(-0.145)#92 | 1.2%(+0.160)#4,926 |
| 93. | Somerset | 1.3% | 1.5%(-0.154)#93 | 1.2%(+0.151)#4,950 |
| 94. | Lynn | 1.3% | 1.5%(-0.212)#94 | 1.2%(+0.093)#5,139 |
| 95. | Turners Falls | 1.3% | 1.5%(-0.227)#95 | 1.2%(+0.078)#5,200 |
| 96. | Chatham | 1.2% | 1.5%(-0.254)#96 | 1.2%(+0.051)#5,303 |
| 97. | Northampton | 1.2% | 1.5%(-0.279)#97 | 1.2%(+0.026)#5,425 |
| 98. | Wilmington | 1.2% | 1.5%(-0.291)#98 | 1.2%(+0.013)#5,465 |
| 99. | Milford | 1.2% | 1.5%(-0.317)#99 | 1.2%(-0.012)#5,560 |
| 100. | Braintree Town | 1.2% | 1.5%(-0.330)#100 | 1.2%(-0.025)#5,614 |
Common Questions
What are the Top 10 Cities with the Highest Percentage of Population Employed in Legal Services & Support in Massachusetts?
Top 10 Cities with the Highest Percentage of Population Employed in Legal Services & Support in Massachusetts are:
#1
23.1%
#2
15.9%
#3
13.2%
#4
9.6%
#5
9.3%
#6
8.1%
#7
7.5%
#8
6.5%
#9
5.9%
#10
5.6%
What city has the Highest Percentage of Population Employed in Legal Services & Support in Massachusetts?
Popponesset Island has the Highest Percentage of Population Employed in Legal Services & Support in Massachusetts with 23.1%.
What is the Percentage of Population Employed in Legal Services & Support in the State of Massachusetts?
Percentage of Population Employed in Legal Services & Support in Massachusetts is 1.5%.
What is the Percentage of Population Employed in Legal Services & Support in the United States?
Percentage of Population Employed in Legal Services & Support in the United States is 1.2%.