Lebanon, IL Map & Demographics
Lebanon Map
Lebanon Overview
$34,375
PER CAPITA INCOME
$92,002
AVG FAMILY INCOME
$86,548
AVG HOUSEHOLD INCOME
14.3%
WAGE / INCOME GAP [ % ]
85.7¢/ $1
WAGE / INCOME GAP [ $ ]
0.36
INEQUALITY / GINI INDEX
4,683
TOTAL POPULATION
2,136
MALE POPULATION
2,547
FEMALE POPULATION
83.86
MALES / 100 FEMALES
119.24
FEMALES / 100 MALES
32.7
MEDIAN AGE
2.8
AVG FAMILY SIZE
2.4
AVG HOUSEHOLD SIZE
2,596
LABOR FORCE [ PEOPLE ]
61.5%
PERCENT IN LABOR FORCE
1.2%
UNEMPLOYMENT RATE
Lebanon Zip Codes
Lebanon Area Codes
Income in Lebanon
Income Overview in Lebanon
Per Capita Income in Lebanon is $34,375, while median incomes of families and households are $92,002 and $86,548 respectively.
| Characteristic | Number | Measure |
| Per Capita Income | 4,683 | $34,375 |
| Median Family Income | 1,051 | $92,002 |
| Mean Family Income | 1,051 | $112,139 |
| Median Household Income | 1,728 | $86,548 |
| Mean Household Income | 1,728 | $91,450 |
| Income Deficit | 1,051 | $0 |
| Wage / Income Gap (%) | 4,683 | 14.28% |
| Wage / Income Gap ($) | 4,683 | 85.72¢ per $1 |
| Gini / Inequality Index | 4,683 | 0.36 |
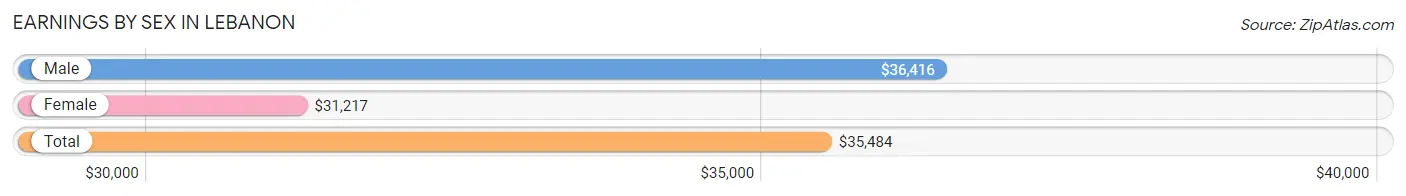
Earnings by Sex in Lebanon
Average Earnings in Lebanon are $35,484, $36,416 for men and $31,217 for women, a difference of 14.3%.
| Sex | Number | Average Earnings |
| Male | 1,272 (47.0%) | $36,416 |
| Female | 1,435 (53.0%) | $31,217 |
| Total | 2,707 (100.0%) | $35,484 |
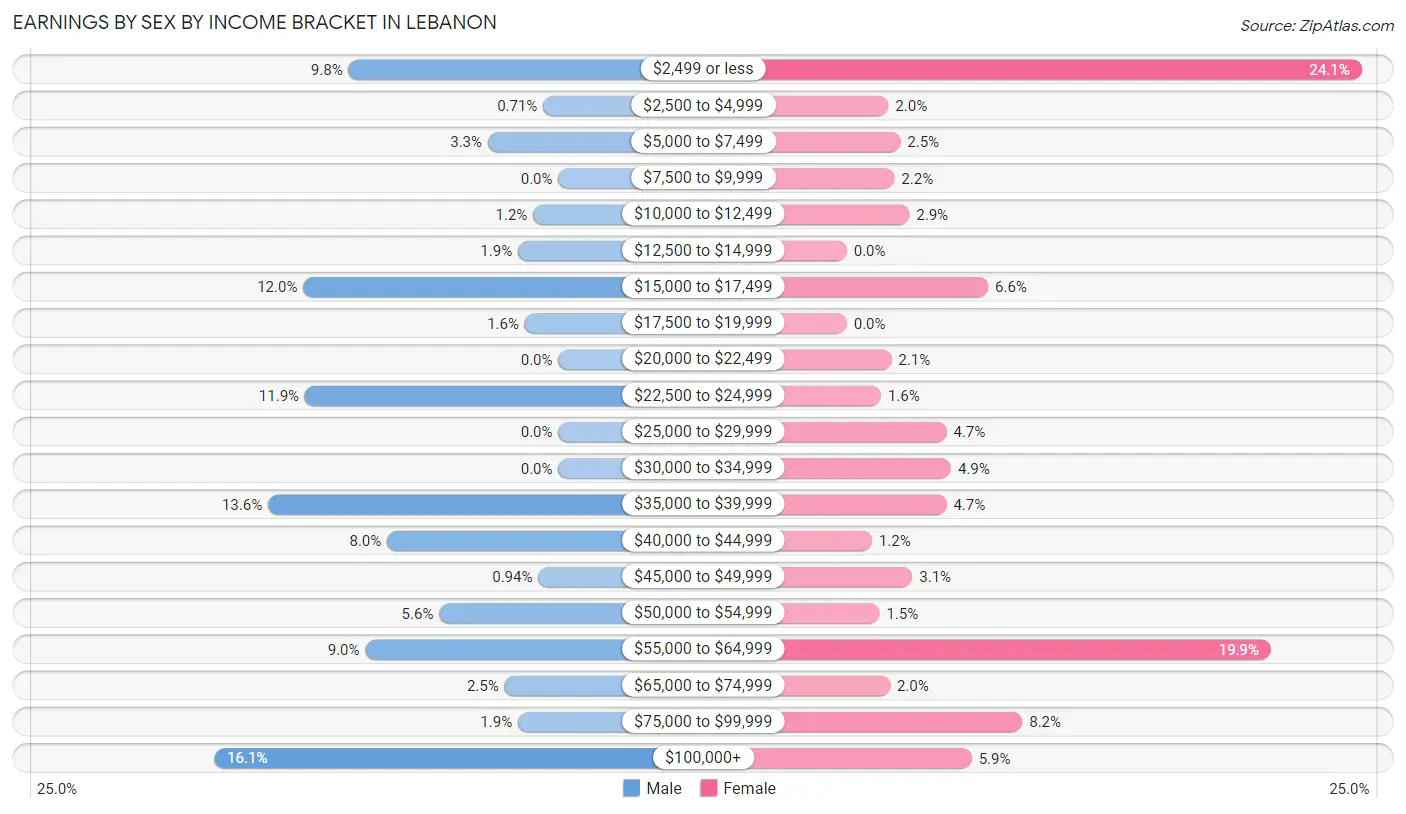
Earnings by Sex by Income Bracket in Lebanon
The most common earnings brackets in Lebanon are $100,000+ for men (205 | 16.1%) and $2,499 or less for women (346 | 24.1%).
| Income | Male | Female |
| $2,499 or less | 125 (9.8%) | 346 (24.1%) |
| $2,500 to $4,999 | 9 (0.7%) | 28 (1.9%) |
| $5,000 to $7,499 | 42 (3.3%) | 36 (2.5%) |
| $7,500 to $9,999 | 0 (0.0%) | 32 (2.2%) |
| $10,000 to $12,499 | 15 (1.2%) | 42 (2.9%) |
| $12,500 to $14,999 | 24 (1.9%) | 0 (0.0%) |
| $15,000 to $17,499 | 152 (11.9%) | 95 (6.6%) |
| $17,500 to $19,999 | 20 (1.6%) | 0 (0.0%) |
| $20,000 to $22,499 | 0 (0.0%) | 30 (2.1%) |
| $22,500 to $24,999 | 151 (11.9%) | 23 (1.6%) |
| $25,000 to $29,999 | 0 (0.0%) | 67 (4.7%) |
| $30,000 to $34,999 | 0 (0.0%) | 70 (4.9%) |
| $35,000 to $39,999 | 173 (13.6%) | 67 (4.7%) |
| $40,000 to $44,999 | 102 (8.0%) | 17 (1.2%) |
| $45,000 to $49,999 | 12 (0.9%) | 44 (3.1%) |
| $50,000 to $54,999 | 71 (5.6%) | 22 (1.5%) |
| $55,000 to $64,999 | 115 (9.0%) | 285 (19.9%) |
| $65,000 to $74,999 | 32 (2.5%) | 29 (2.0%) |
| $75,000 to $99,999 | 24 (1.9%) | 118 (8.2%) |
| $100,000+ | 205 (16.1%) | 84 (5.9%) |
| Total | 1,272 (100.0%) | 1,435 (100.0%) |
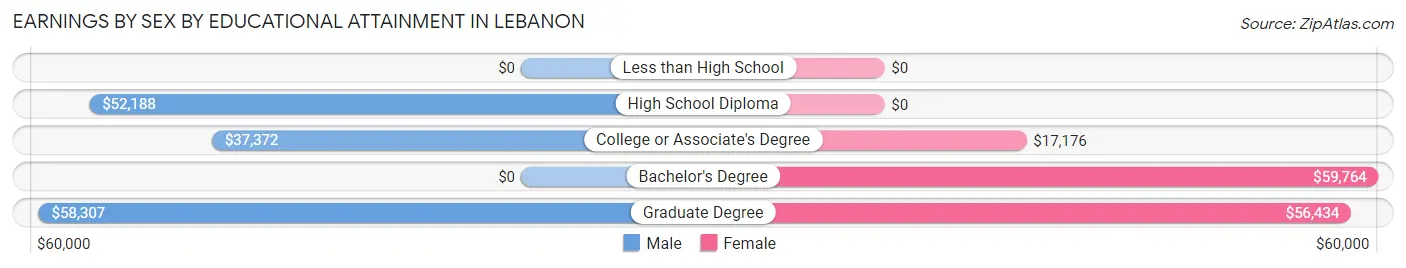
Earnings by Sex by Educational Attainment in Lebanon
Average earnings in Lebanon are $50,984 for men and $55,509 for women, a difference of 8.2%. Men with an educational attainment of graduate degree enjoy the highest average annual earnings of $58,307, while those with college or associate's degree education earn the least with $37,372. Women with an educational attainment of bachelor's degree earn the most with the average annual earnings of $59,764, while those with college or associate's degree education have the smallest earnings of $17,176.
| Educational Attainment | Male Income | Female Income |
| Less than High School | - | - |
| High School Diploma | $52,188 | $0 |
| College or Associate's Degree | $37,372 | $17,176 |
| Bachelor's Degree | - | - |
| Graduate Degree | $58,307 | $56,434 |
| Total | $50,984 | $55,509 |
Family Income in Lebanon
Family Income Brackets in Lebanon
According to the Lebanon family income data, there are 358 families falling into the $75,000 to $99,999 income range, which is the most common income bracket and makes up 34.1% of all families.
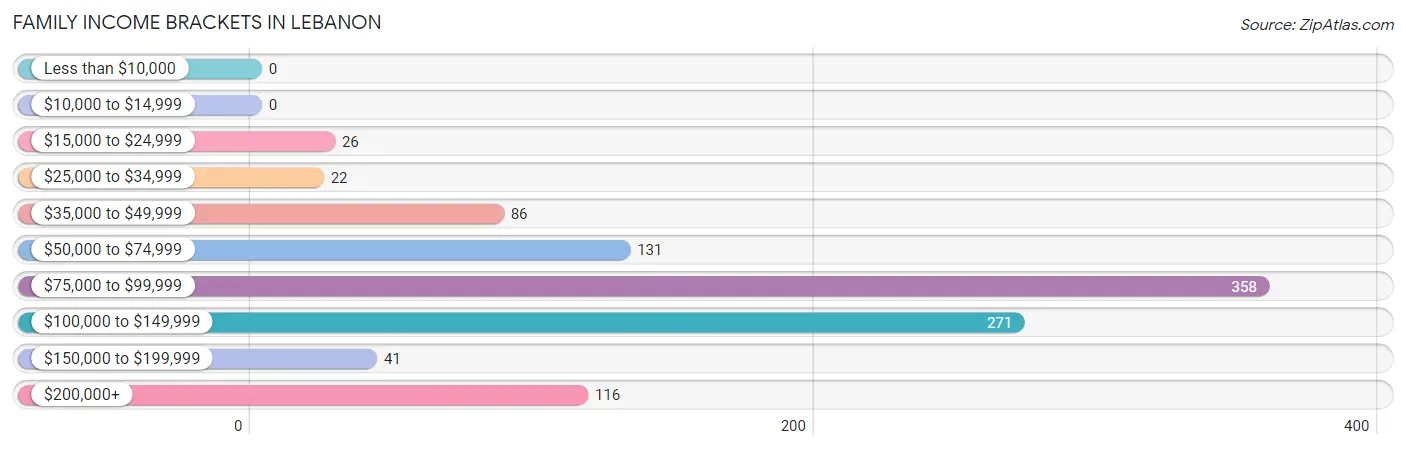
| Income Bracket | # Families | % Families |
| Less than $10,000 | 0 | 0.0% |
| $10,000 to $14,999 | 0 | 0.0% |
| $15,000 to $24,999 | 26 | 2.5% |
| $25,000 to $34,999 | 22 | 2.1% |
| $35,000 to $49,999 | 86 | 8.2% |
| $50,000 to $74,999 | 131 | 12.5% |
| $75,000 to $99,999 | 358 | 34.1% |
| $100,000 to $149,999 | 271 | 25.8% |
| $150,000 to $199,999 | 41 | 3.9% |
| $200,000+ | 116 | 11.0% |
Family Income by Famaliy Size in Lebanon
6-person families (85 | 8.1%) account for the highest median family income in Lebanon with $121,458 per family, while 2-person families (635 | 60.4%) have the highest median income of $45,196 per family member.
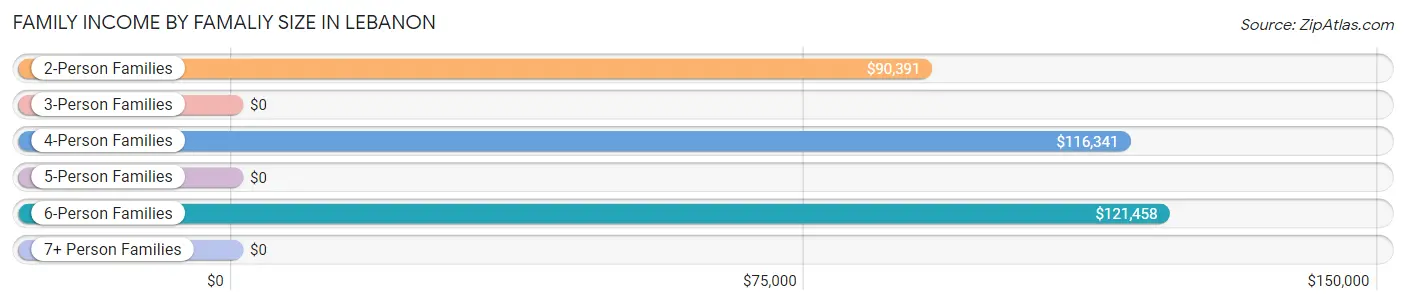
| Income Bracket | # Families | Median Income |
| 2-Person Families | 635 (60.4%) | $90,391 |
| 3-Person Families | 229 (21.8%) | $0 |
| 4-Person Families | 102 (9.7%) | $116,341 |
| 5-Person Families | 0 (0.0%) | $0 |
| 6-Person Families | 85 (8.1%) | $121,458 |
| 7+ Person Families | 0 (0.0%) | $0 |
| Total | 1,051 (100.0%) | $92,002 |
Family Income by Number of Earners in Lebanon
The median family income in Lebanon is $92,002, with families comprising 3+ earners (172) having the highest median family income of $199,500, while families with no earners (134) have the lowest median family income of $63,750, accounting for 16.4% and 12.8% of families, respectively.
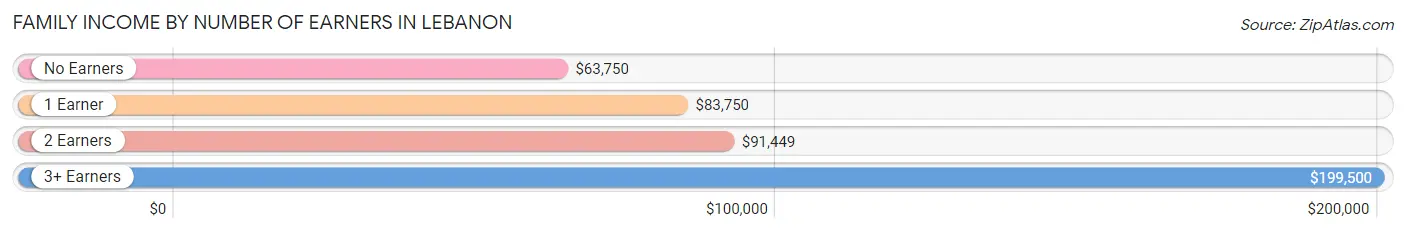
| Number of Earners | # Families | Median Income |
| No Earners | 134 (12.8%) | $63,750 |
| 1 Earner | 278 (26.5%) | $83,750 |
| 2 Earners | 467 (44.4%) | $91,449 |
| 3+ Earners | 172 (16.4%) | $199,500 |
| Total | 1,051 (100.0%) | $92,002 |
Household Income in Lebanon
Household Income Brackets in Lebanon
With 492 households falling in the category, the $75,000 to $99,999 income range is the most frequent in Lebanon, accounting for 28.5% of all households. In contrast, only 19 households (1.1%) fall into the $10,000 to $14,999 income bracket, making it the least populous group.
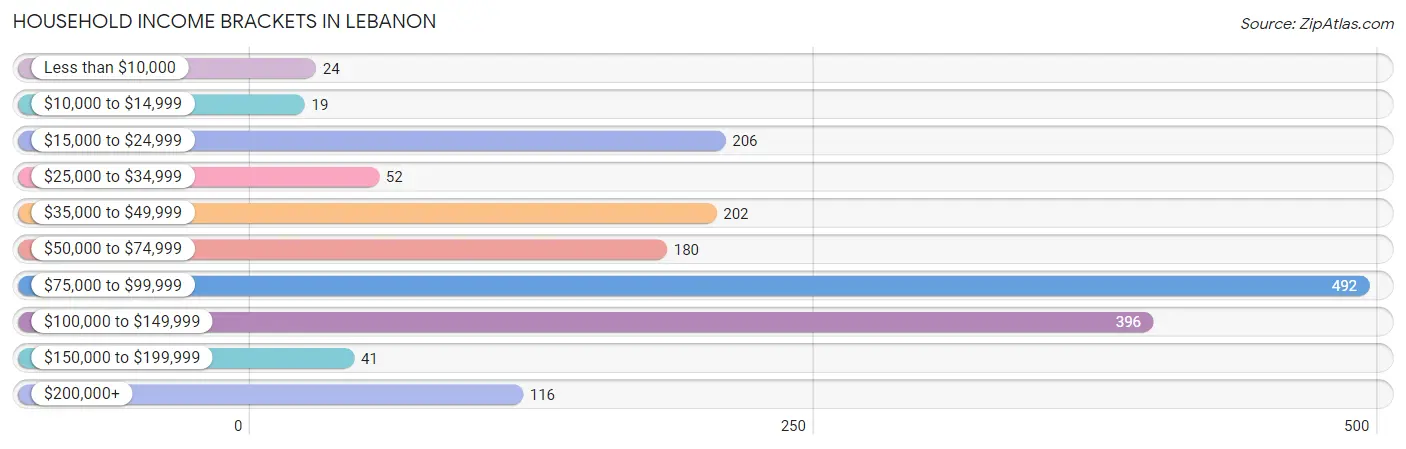
| Income Bracket | # Households | % Households |
| Less than $10,000 | 24 | 1.4% |
| $10,000 to $14,999 | 19 | 1.1% |
| $15,000 to $24,999 | 206 | 11.9% |
| $25,000 to $34,999 | 52 | 3.0% |
| $35,000 to $49,999 | 202 | 11.7% |
| $50,000 to $74,999 | 180 | 10.4% |
| $75,000 to $99,999 | 492 | 28.5% |
| $100,000 to $149,999 | 396 | 22.9% |
| $150,000 to $199,999 | 41 | 2.4% |
| $200,000+ | 116 | 6.7% |
Household Income by Householder Age in Lebanon
The median household income in Lebanon is $86,548, with the highest median household income of $100,854 found in the 45 to 64 years age bracket for the primary householder. A total of 568 households (32.9%) fall into this category. Meanwhile, the 65+ years age bracket for the primary householder has the lowest median household income of $0, with 440 households (25.5%) in this group.
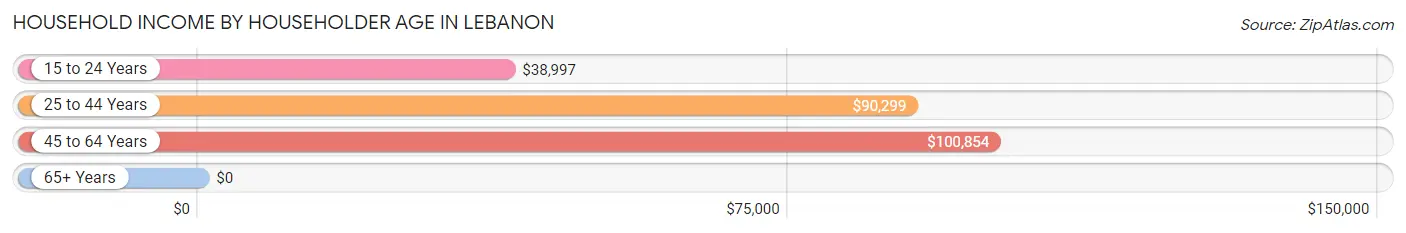
| Income Bracket | # Households | Median Income |
| 15 to 24 Years | 107 (6.2%) | $38,997 |
| 25 to 44 Years | 613 (35.5%) | $90,299 |
| 45 to 64 Years | 568 (32.9%) | $100,854 |
| 65+ Years | 440 (25.5%) | $0 |
| Total | 1,728 (100.0%) | $86,548 |
Poverty in Lebanon
Income Below Poverty by Sex and Age in Lebanon
With 5.8% poverty level for males and 6.6% for females among the residents of Lebanon, 18 to 24 year old males and 16 and 17 year old females are the most vulnerable to poverty, with 101 males (22.2%) and 13 females (25.0%) in their respective age groups living below the poverty level.
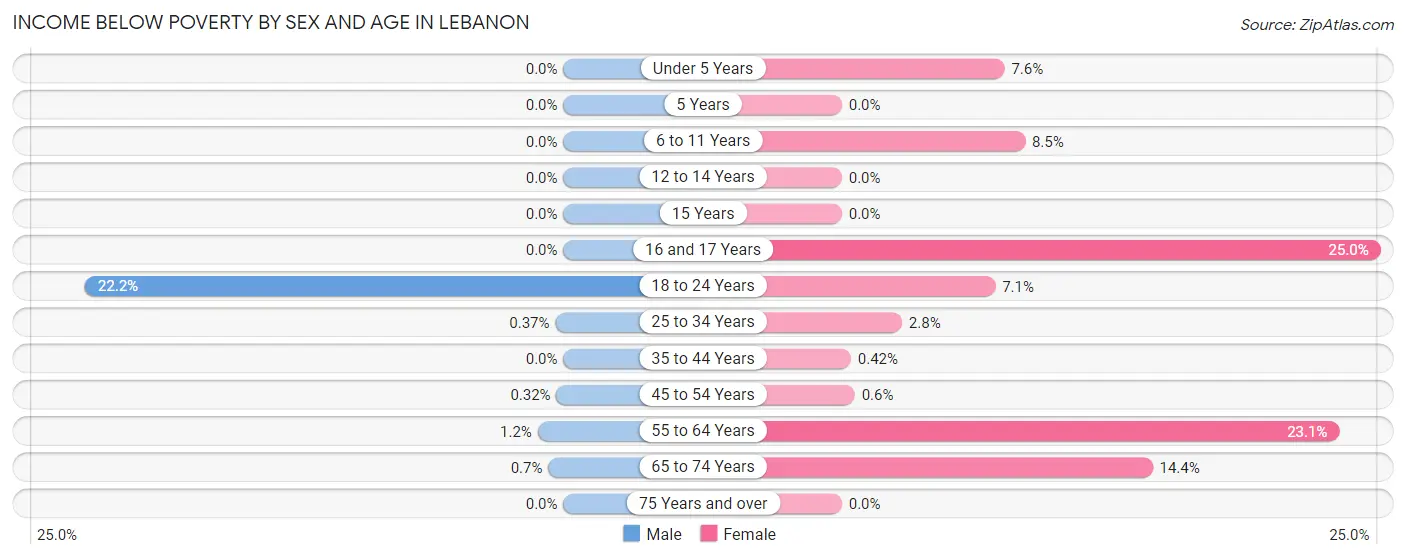
| Age Bracket | Male | Female |
| Under 5 Years | 0 (0.0%) | 4 (7.5%) |
| 5 Years | 0 (0.0%) | 0 (0.0%) |
| 6 to 11 Years | 0 (0.0%) | 13 (8.5%) |
| 12 to 14 Years | 0 (0.0%) | 0 (0.0%) |
| 15 Years | 0 (0.0%) | 0 (0.0%) |
| 16 and 17 Years | 0 (0.0%) | 13 (25.0%) |
| 18 to 24 Years | 101 (22.2%) | 26 (7.1%) |
| 25 to 34 Years | 1 (0.4%) | 11 (2.8%) |
| 35 to 44 Years | 0 (0.0%) | 1 (0.4%) |
| 45 to 54 Years | 1 (0.3%) | 2 (0.6%) |
| 55 to 64 Years | 2 (1.2%) | 36 (23.1%) |
| 65 to 74 Years | 1 (0.7%) | 45 (14.4%) |
| 75 Years and over | 0 (0.0%) | 0 (0.0%) |
| Total | 106 (5.8%) | 151 (6.6%) |
Income Above Poverty by Sex and Age in Lebanon
According to the poverty statistics in Lebanon, males aged under 5 years and females aged 5 years are the age groups that are most secure financially, with 100.0% of males and 100.0% of females in these age groups living above the poverty line.
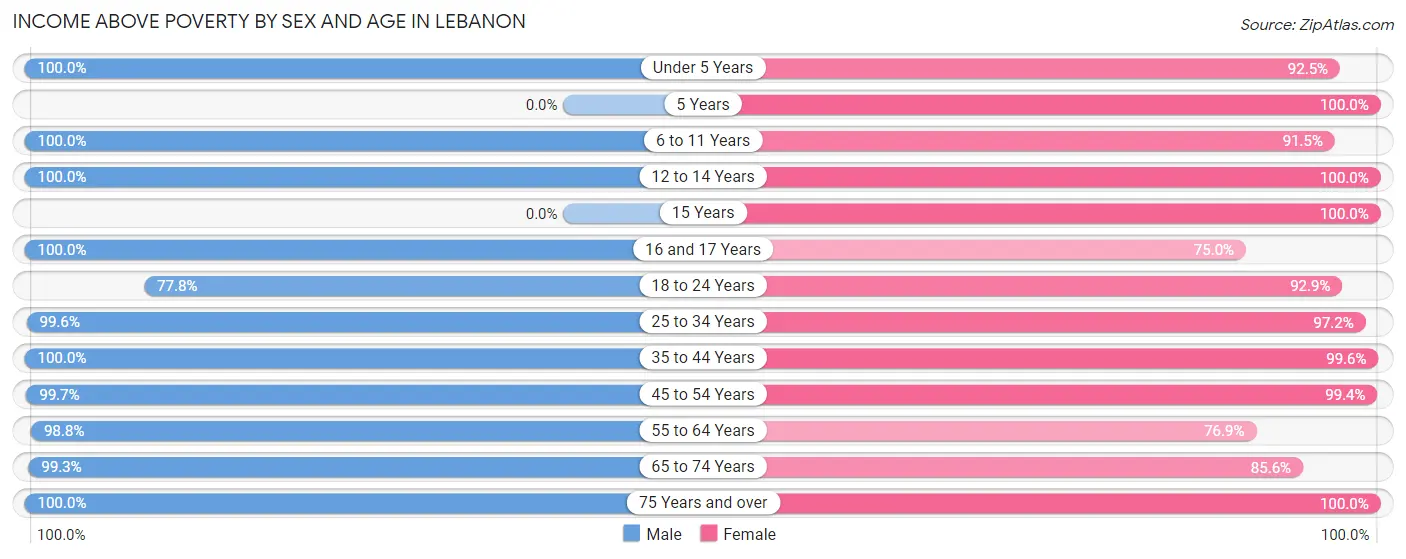
| Age Bracket | Male | Female |
| Under 5 Years | 12 (100.0%) | 49 (92.4%) |
| 5 Years | 0 (0.0%) | 19 (100.0%) |
| 6 to 11 Years | 61 (100.0%) | 140 (91.5%) |
| 12 to 14 Years | 38 (100.0%) | 107 (100.0%) |
| 15 Years | 0 (0.0%) | 19 (100.0%) |
| 16 and 17 Years | 74 (100.0%) | 39 (75.0%) |
| 18 to 24 Years | 354 (77.8%) | 339 (92.9%) |
| 25 to 34 Years | 270 (99.6%) | 383 (97.2%) |
| 35 to 44 Years | 109 (100.0%) | 235 (99.6%) |
| 45 to 54 Years | 313 (99.7%) | 332 (99.4%) |
| 55 to 64 Years | 166 (98.8%) | 120 (76.9%) |
| 65 to 74 Years | 141 (99.3%) | 267 (85.6%) |
| 75 Years and over | 182 (100.0%) | 99 (100.0%) |
| Total | 1,720 (94.2%) | 2,148 (93.4%) |
Income Below Poverty Among Married-Couple Families in Lebanon
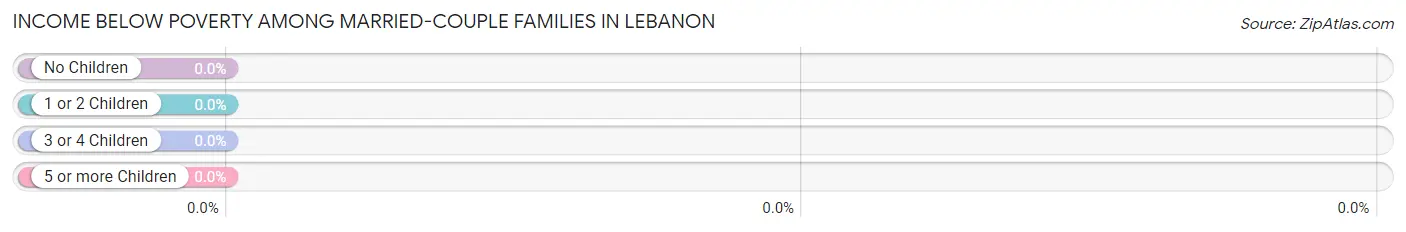
| Children | Above Poverty | Below Poverty |
| No Children | 703 (100.0%) | 0 (0.0%) |
| 1 or 2 Children | 177 (100.0%) | 0 (0.0%) |
| 3 or 4 Children | 60 (100.0%) | 0 (0.0%) |
| 5 or more Children | 0 (0.0%) | 0 (0.0%) |
| Total | 940 (100.0%) | 0 (0.0%) |
Income Below Poverty Among Single-Parent Households in Lebanon
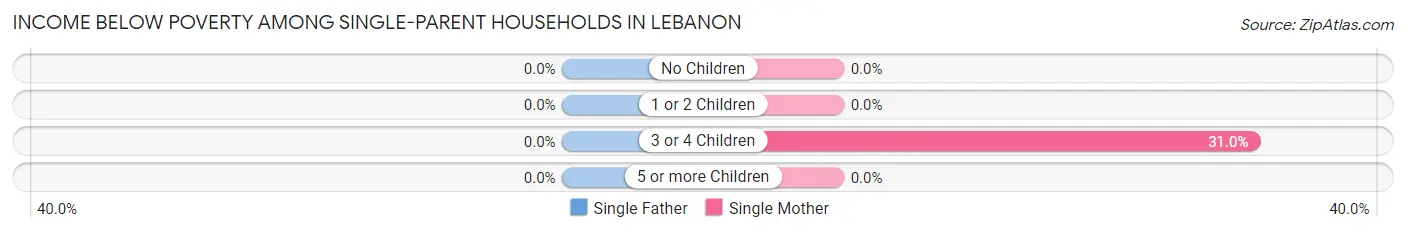
| Children | Single Father | Single Mother |
| No Children | 0 (0.0%) | 0 (0.0%) |
| 1 or 2 Children | 0 (0.0%) | 0 (0.0%) |
| 3 or 4 Children | 0 (0.0%) | 9 (31.0%) |
| 5 or more Children | 0 (0.0%) | 0 (0.0%) |
| Total | 0 (0.0%) | 9 (11.1%) |
Income Below Poverty Among Married-Couple vs Single-Parent Households in Lebanon
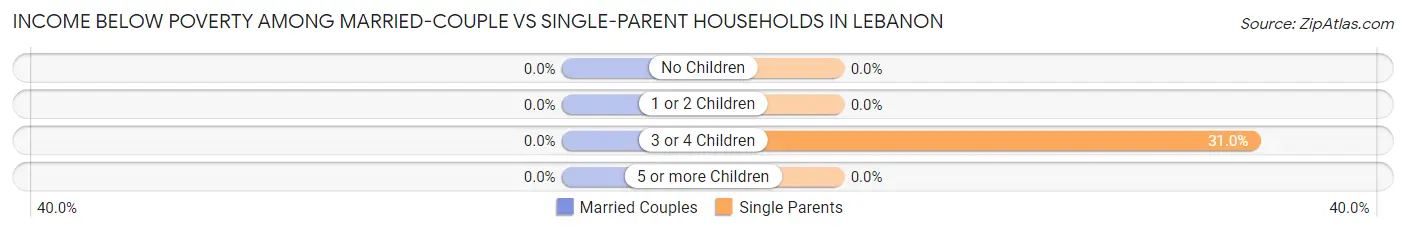
| Children | Married-Couple Families | Single-Parent Households |
| No Children | 0 (0.0%) | 0 (0.0%) |
| 1 or 2 Children | 0 (0.0%) | 0 (0.0%) |
| 3 or 4 Children | 0 (0.0%) | 9 (31.0%) |
| 5 or more Children | 0 (0.0%) | 0 (0.0%) |
| Total | 0 (0.0%) | 9 (8.1%) |
Race in Lebanon
The most populous races in Lebanon are White / Caucasian (3,806 | 81.3%), Black / African American (606 | 12.9%), and Two or more Races (207 | 4.4%).
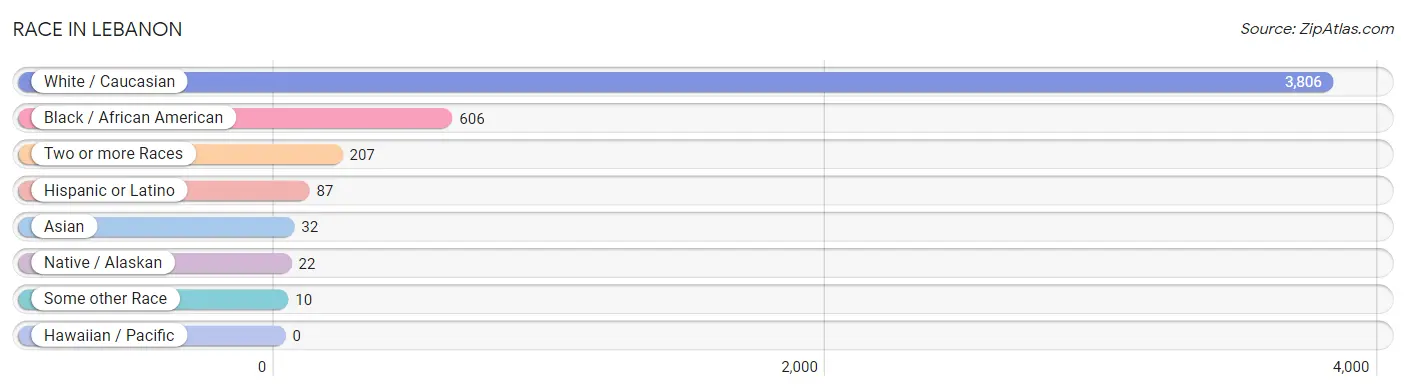
| Race | # Population | % Population |
| Asian | 32 | 0.7% |
| Black / African American | 606 | 12.9% |
| Hawaiian / Pacific | 0 | 0.0% |
| Hispanic or Latino | 87 | 1.9% |
| Native / Alaskan | 22 | 0.5% |
| White / Caucasian | 3,806 | 81.3% |
| Two or more Races | 207 | 4.4% |
| Some other Race | 10 | 0.2% |
| Total | 4,683 | 100.0% |
Ancestry in Lebanon
The most populous ancestries reported in Lebanon are German (1,334 | 28.5%), English (746 | 15.9%), Irish (407 | 8.7%), American (339 | 7.2%), and Italian (202 | 4.3%), together accounting for 64.7% of all Lebanon residents.
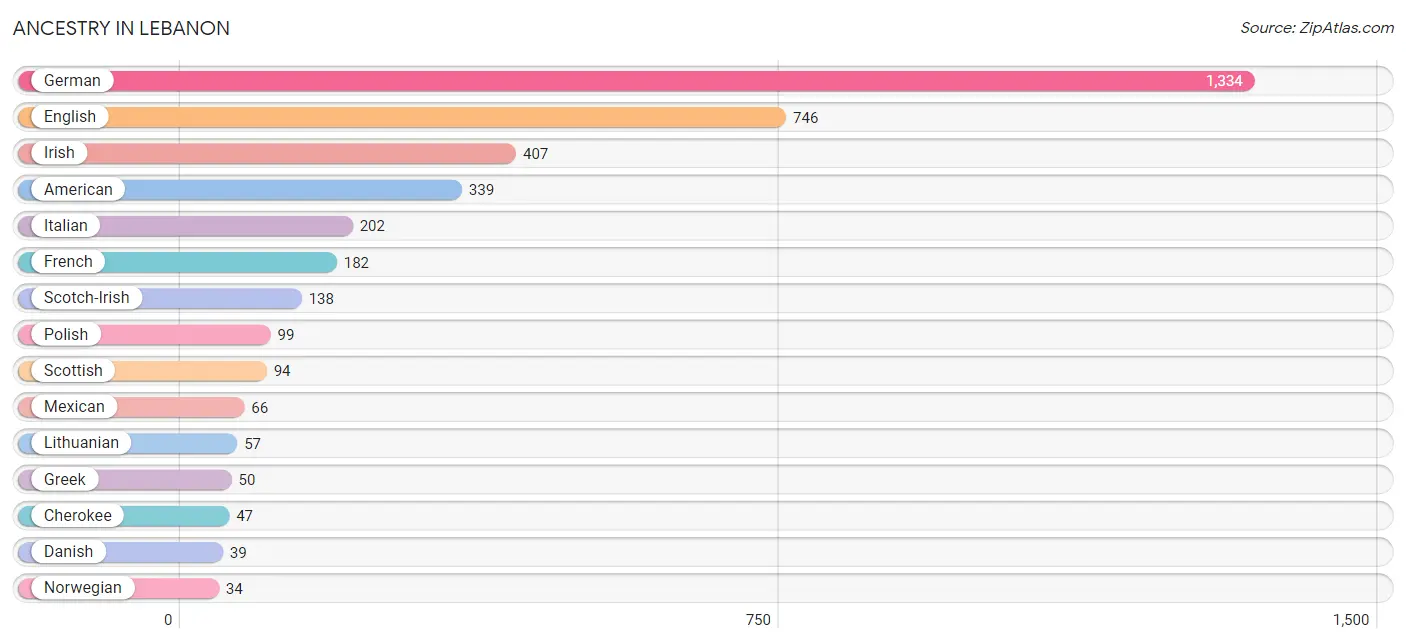
| Ancestry | # Population | % Population |
| American | 339 | 7.2% |
| Arab | 29 | 0.6% |
| Bhutanese | 1 | 0.0% |
| British | 1 | 0.0% |
| Canadian | 9 | 0.2% |
| Central American | 3 | 0.1% |
| Cherokee | 47 | 1.0% |
| Croatian | 14 | 0.3% |
| Danish | 39 | 0.8% |
| Dutch | 15 | 0.3% |
| English | 746 | 15.9% |
| European | 8 | 0.2% |
| French | 182 | 3.9% |
| French Canadian | 27 | 0.6% |
| German | 1,334 | 28.5% |
| Greek | 50 | 1.1% |
| Guatemalan | 3 | 0.1% |
| Irish | 407 | 8.7% |
| Italian | 202 | 4.3% |
| Korean | 22 | 0.5% |
| Lithuanian | 57 | 1.2% |
| Mexican | 66 | 1.4% |
| Northern European | 14 | 0.3% |
| Norwegian | 34 | 0.7% |
| Palestinian | 29 | 0.6% |
| Polish | 99 | 2.1% |
| Portuguese | 2 | 0.0% |
| Puerto Rican | 17 | 0.4% |
| Scotch-Irish | 138 | 2.9% |
| Scottish | 94 | 2.0% |
| Sri Lankan | 10 | 0.2% |
| Swedish | 3 | 0.1% |
| Swiss | 12 | 0.3% | View All 33 Rows |
Immigrants in Lebanon
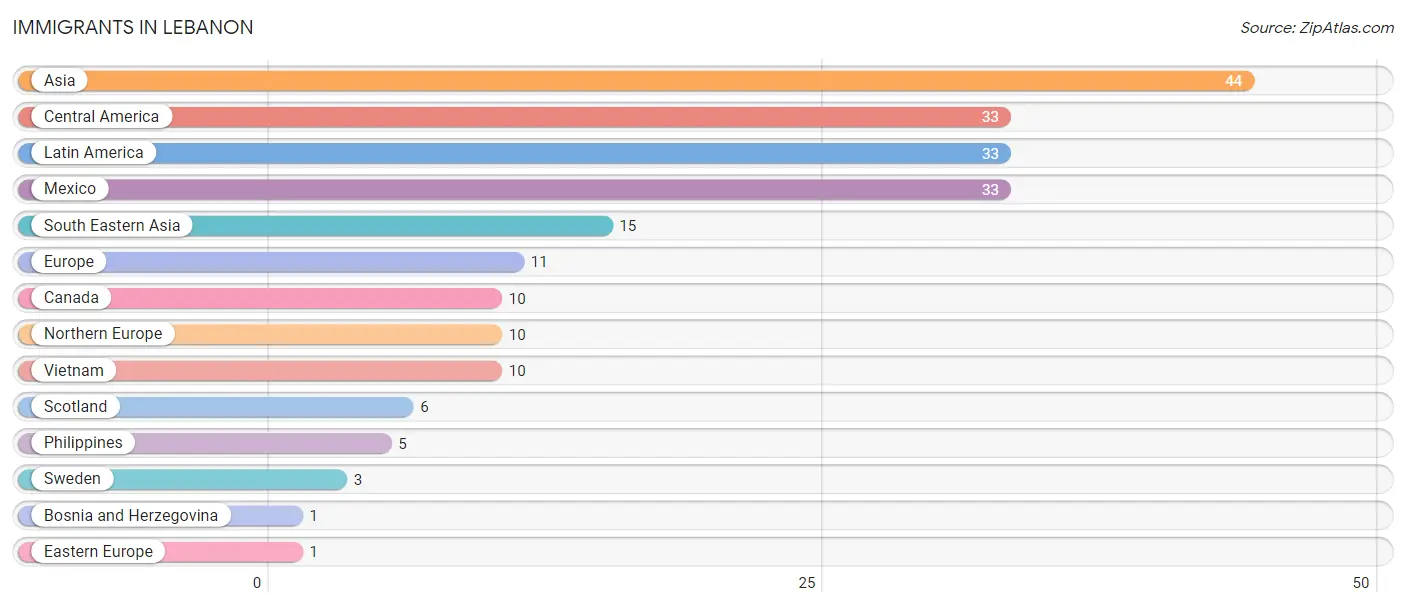
The most numerous immigrant groups reported in Lebanon came from Asia (44 | 0.9%), Central America (33 | 0.7%), Latin America (33 | 0.7%), Mexico (33 | 0.7%), and South Eastern Asia (15 | 0.3%), together accounting for 3.4% of all Lebanon residents.
| Immigration Origin | # Population | % Population |
| Asia | 44 | 0.9% |
| Bosnia and Herzegovina | 1 | 0.0% |
| Canada | 10 | 0.2% |
| Central America | 33 | 0.7% |
| Eastern Europe | 1 | 0.0% |
| Europe | 11 | 0.2% |
| Latin America | 33 | 0.7% |
| Mexico | 33 | 0.7% |
| Northern Europe | 10 | 0.2% |
| Philippines | 5 | 0.1% |
| Scotland | 6 | 0.1% |
| South Eastern Asia | 15 | 0.3% |
| Sweden | 3 | 0.1% |
| Vietnam | 10 | 0.2% | View All 14 Rows |
Sex and Age in Lebanon
Sex and Age in Lebanon
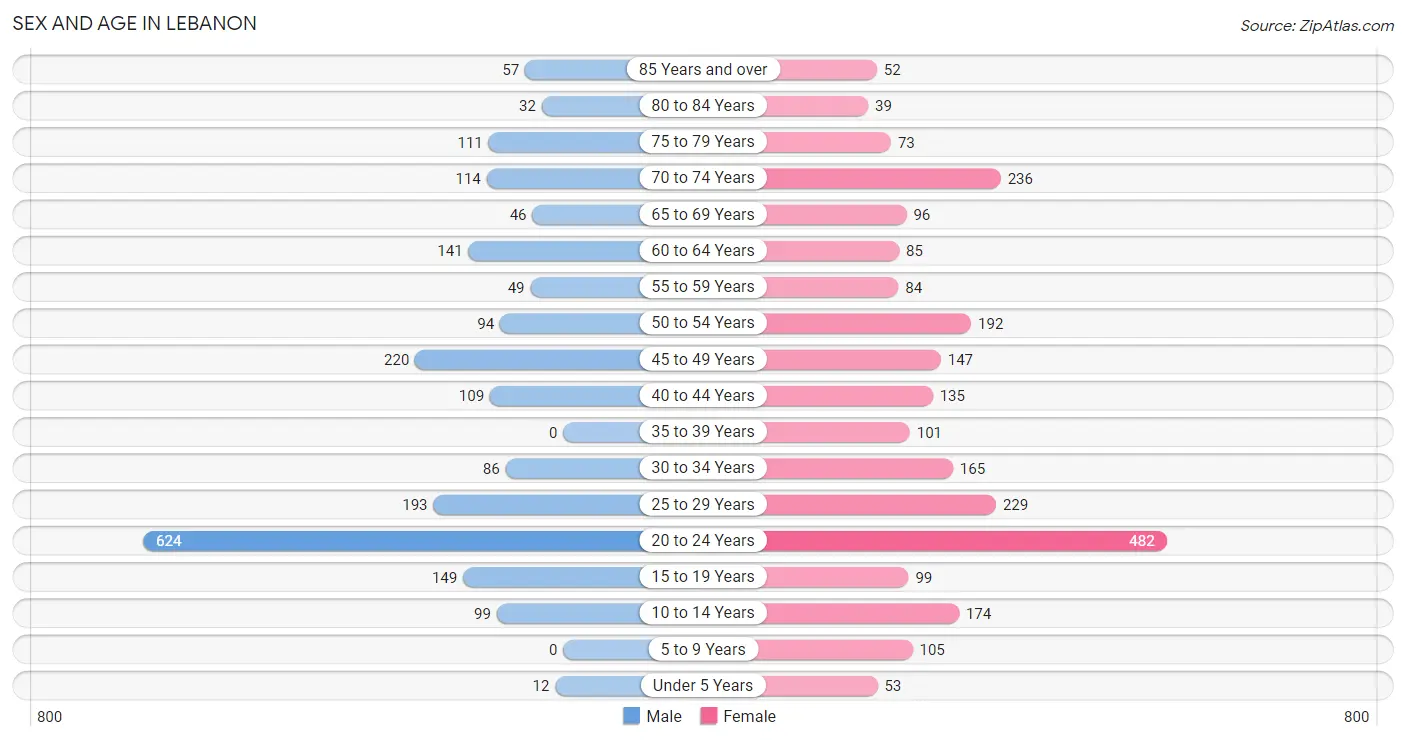
The most populous age groups in Lebanon are 20 to 24 Years (624 | 29.2%) for men and 20 to 24 Years (482 | 18.9%) for women.
| Age Bracket | Male | Female |
| Under 5 Years | 12 (0.6%) | 53 (2.1%) |
| 5 to 9 Years | 0 (0.0%) | 105 (4.1%) |
| 10 to 14 Years | 99 (4.6%) | 174 (6.8%) |
| 15 to 19 Years | 149 (7.0%) | 99 (3.9%) |
| 20 to 24 Years | 624 (29.2%) | 482 (18.9%) |
| 25 to 29 Years | 193 (9.0%) | 229 (9.0%) |
| 30 to 34 Years | 86 (4.0%) | 165 (6.5%) |
| 35 to 39 Years | 0 (0.0%) | 101 (4.0%) |
| 40 to 44 Years | 109 (5.1%) | 135 (5.3%) |
| 45 to 49 Years | 220 (10.3%) | 147 (5.8%) |
| 50 to 54 Years | 94 (4.4%) | 192 (7.5%) |
| 55 to 59 Years | 49 (2.3%) | 84 (3.3%) |
| 60 to 64 Years | 141 (6.6%) | 85 (3.3%) |
| 65 to 69 Years | 46 (2.1%) | 96 (3.8%) |
| 70 to 74 Years | 114 (5.3%) | 236 (9.3%) |
| 75 to 79 Years | 111 (5.2%) | 73 (2.9%) |
| 80 to 84 Years | 32 (1.5%) | 39 (1.5%) |
| 85 Years and over | 57 (2.7%) | 52 (2.0%) |
| Total | 2,136 (100.0%) | 2,547 (100.0%) |
Families and Households in Lebanon
Median Family Size in Lebanon
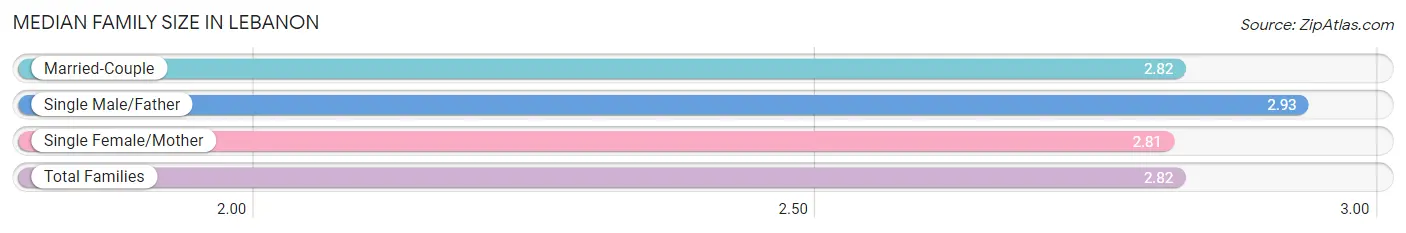
The median family size in Lebanon is 2.82 persons per family, with single male/father families (30 | 2.9%) accounting for the largest median family size of 2.93 persons per family. On the other hand, single female/mother families (81 | 7.7%) represent the smallest median family size with 2.81 persons per family.
| Family Type | # Families | Family Size |
| Married-Couple | 940 (89.4%) | 2.82 |
| Single Male/Father | 30 (2.9%) | 2.93 |
| Single Female/Mother | 81 (7.7%) | 2.81 |
| Total Families | 1,051 (100.0%) | 2.82 |
Median Household Size in Lebanon
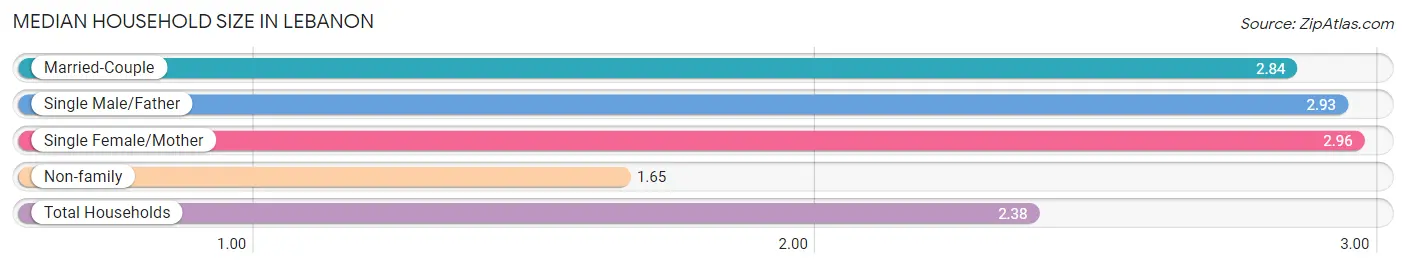
The median household size in Lebanon is 2.38 persons per household, with single female/mother households (81 | 4.7%) accounting for the largest median household size of 2.96 persons per household. non-family households (677 | 39.2%) represent the smallest median household size with 1.65 persons per household.
| Household Type | # Households | Household Size |
| Married-Couple | 940 (54.4%) | 2.84 |
| Single Male/Father | 30 (1.7%) | 2.93 |
| Single Female/Mother | 81 (4.7%) | 2.96 |
| Non-family | 677 (39.2%) | 1.65 |
| Total Households | 1,728 (100.0%) | 2.38 |
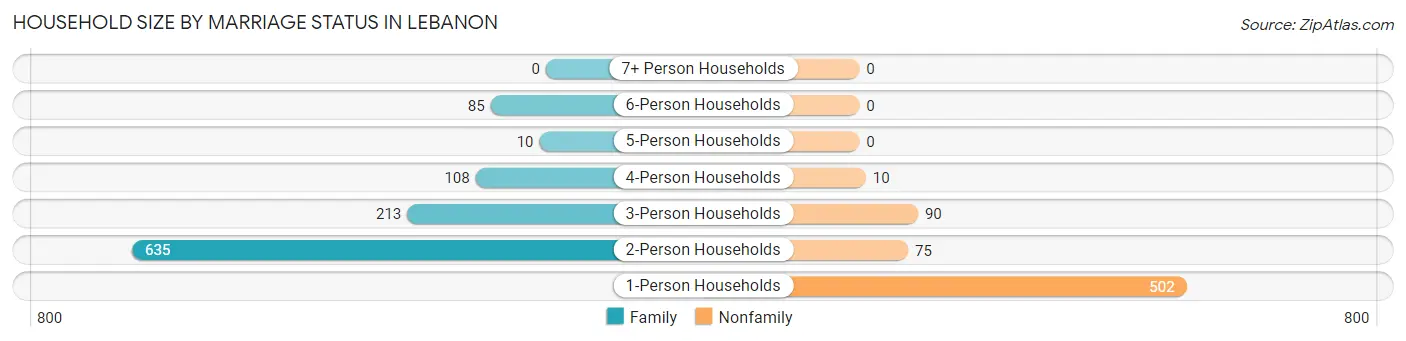
Household Size by Marriage Status in Lebanon
Out of a total of 1,728 households in Lebanon, 1,051 (60.8%) are family households, while 677 (39.2%) are nonfamily households. The most numerous type of family households are 2-person households, comprising 635, and the most common type of nonfamily households are 1-person households, comprising 502.
| Household Size | Family Households | Nonfamily Households |
| 1-Person Households | - | 502 (29.0%) |
| 2-Person Households | 635 (36.7%) | 75 (4.3%) |
| 3-Person Households | 213 (12.3%) | 90 (5.2%) |
| 4-Person Households | 108 (6.2%) | 10 (0.6%) |
| 5-Person Households | 10 (0.6%) | 0 (0.0%) |
| 6-Person Households | 85 (4.9%) | 0 (0.0%) |
| 7+ Person Households | 0 (0.0%) | 0 (0.0%) |
| Total | 1,051 (60.8%) | 677 (39.2%) |
Female Fertility in Lebanon
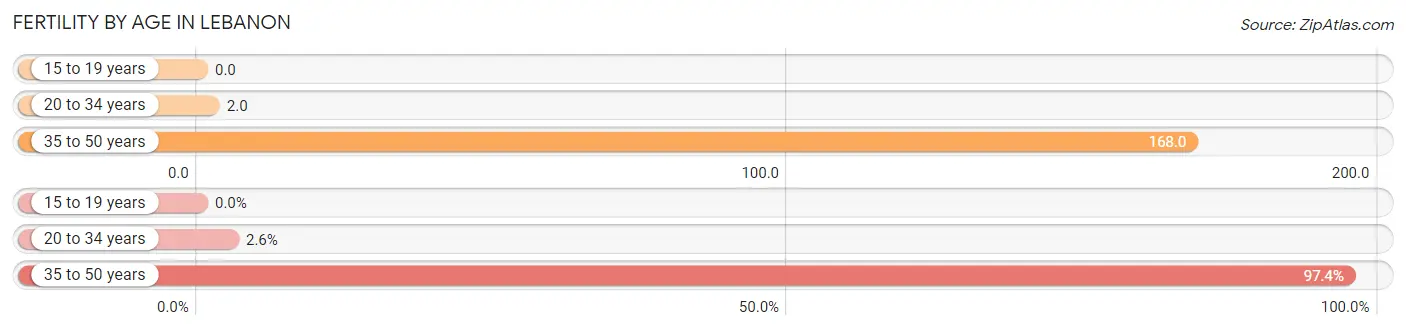
Fertility by Age in Lebanon
Average fertility rate in Lebanon is 54.0 births per 1,000 women. Women in the age bracket of 35 to 50 years have the highest fertility rate with 168.0 births per 1,000 women. Women in the age bracket of 35 to 50 years acount for 97.4% of all women with births.
| Age Bracket | Women with Births | Births / 1,000 Women |
| 15 to 19 years | 0 (0.0%) | 0.0 |
| 20 to 34 years | 2 (2.6%) | 2.0 |
| 35 to 50 years | 74 (97.4%) | 168.0 |
| Total | 76 (100.0%) | 54.0 |
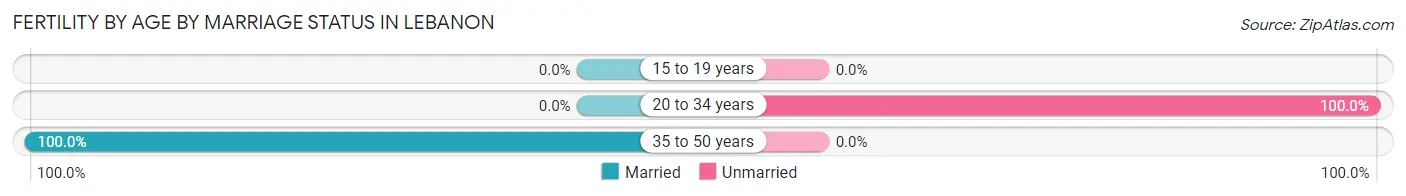
Fertility by Age by Marriage Status in Lebanon
97.4% of women with births (76) in Lebanon are married. The highest percentage of unmarried women with births falls into 20 to 34 years age bracket with 100.0% of them unmarried at the time of birth, while the lowest percentage of unmarried women with births belong to 35 to 50 years age bracket with 0.0% of them unmarried.
| Age Bracket | Married | Unmarried |
| 15 to 19 years | 0 (0.0%) | 0 (0.0%) |
| 20 to 34 years | 0 (0.0%) | 2 (100.0%) |
| 35 to 50 years | 74 (100.0%) | 0 (0.0%) |
| Total | 74 (97.4%) | 2 (2.6%) |
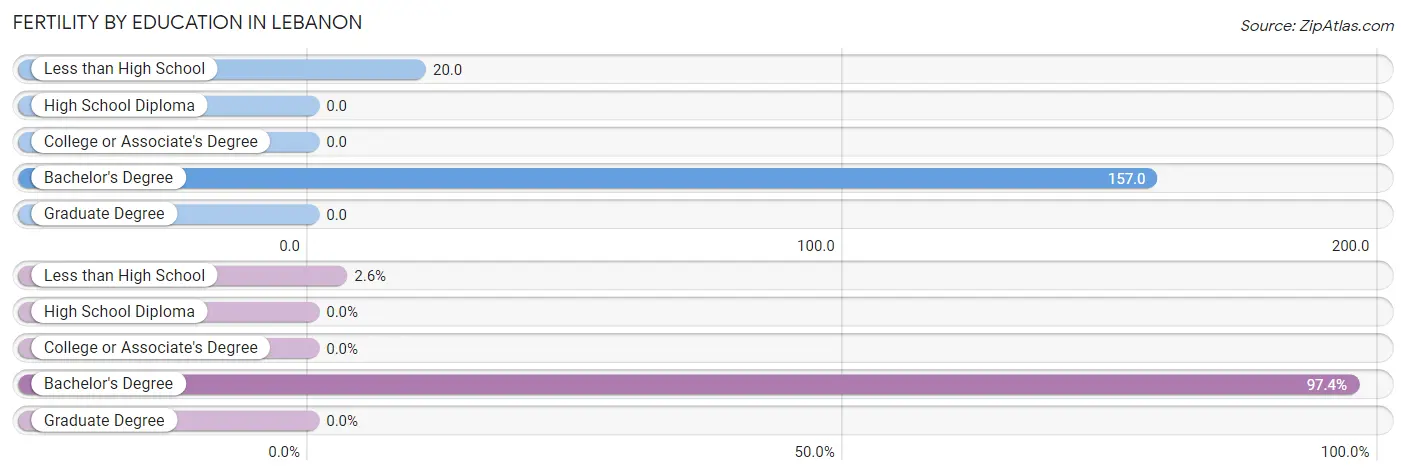
Fertility by Education in Lebanon
| Educational Attainment | Women with Births | Births / 1,000 Women |
| Less than High School | 2 (2.6%) | 20.0 |
| High School Diploma | 0 (0.0%) | 0.0 |
| College or Associate's Degree | 0 (0.0%) | 0.0 |
| Bachelor's Degree | 74 (97.4%) | 157.0 |
| Graduate Degree | 0 (0.0%) | 0.0 |
| Total | 76 (100.0%) | 54.0 |
Fertility by Education by Marriage Status in Lebanon
2.6% of women with births in Lebanon are unmarried. Women with the educational attainment of bachelor's degree are most likely to be married with 100.0% of them married at childbirth, while women with the educational attainment of less than high school are least likely to be married with 100.0% of them unmarried at childbirth.
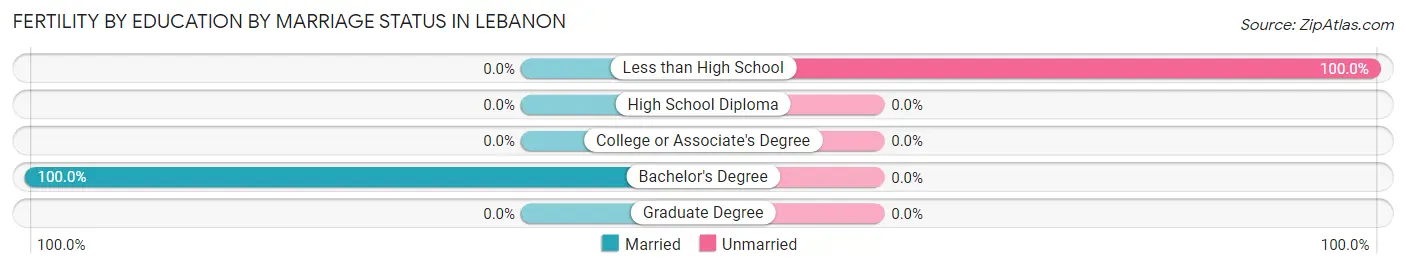
| Educational Attainment | Married | Unmarried |
| Less than High School | 0 (0.0%) | 2 (100.0%) |
| High School Diploma | 0 (0.0%) | 0 (0.0%) |
| College or Associate's Degree | 0 (0.0%) | 0 (0.0%) |
| Bachelor's Degree | 74 (100.0%) | 0 (0.0%) |
| Graduate Degree | 0 (0.0%) | 0 (0.0%) |
| Total | 74 (97.4%) | 2 (2.6%) |
Employment Characteristics in Lebanon
Employment by Class of Employer in Lebanon
Among the 2,547 employed individuals in Lebanon, private company employees (1,576 | 61.9%), federal government employees (337 | 13.2%), and local government employees (265 | 10.4%) make up the most common classes of employment.
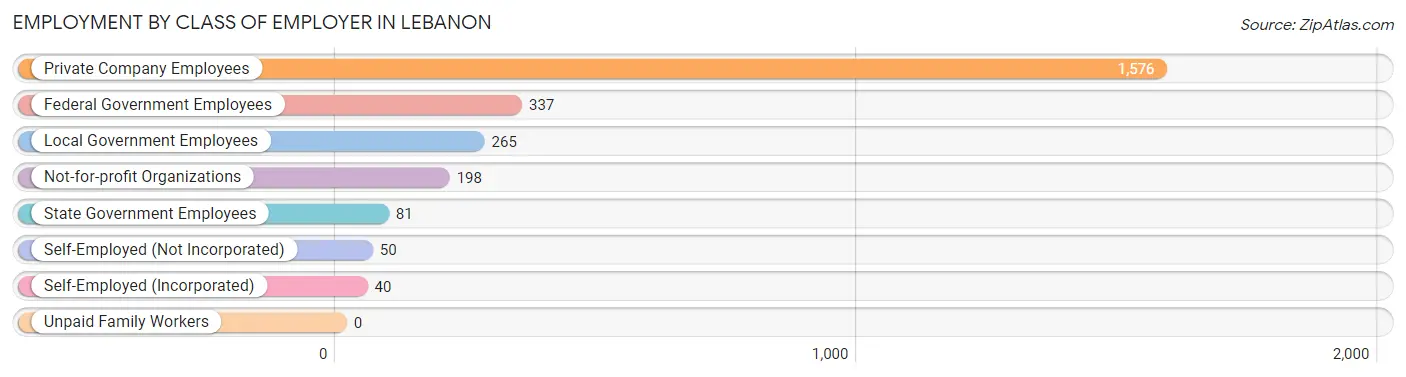
| Employer Class | # Employees | % Employees |
| Private Company Employees | 1,576 | 61.9% |
| Self-Employed (Incorporated) | 40 | 1.6% |
| Self-Employed (Not Incorporated) | 50 | 2.0% |
| Not-for-profit Organizations | 198 | 7.8% |
| Local Government Employees | 265 | 10.4% |
| State Government Employees | 81 | 3.2% |
| Federal Government Employees | 337 | 13.2% |
| Unpaid Family Workers | 0 | 0.0% |
| Total | 2,547 | 100.0% |
Employment Status by Age in Lebanon
According to the labor force statistics for Lebanon, out of the total population over 16 years of age (4,221), 61.5% or 2,596 individuals are in the labor force, with 1.2% or 31 of them unemployed. The age group with the highest labor force participation rate is 25 to 29 years, with 99.3% or 419 individuals in the labor force. Within the labor force, the 65 to 74 years age range has the highest percentage of unemployed individuals, with 28.6% or 14 of them being unemployed.
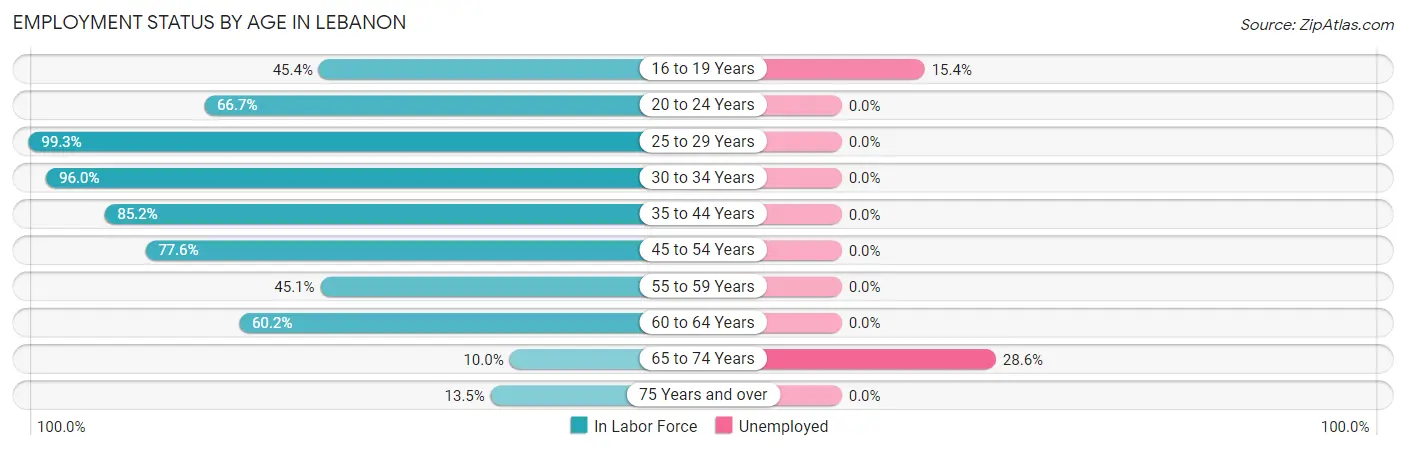
| Age Bracket | In Labor Force | Unemployed |
| 16 to 19 Years | 104 (45.4%) | 16 (15.4%) |
| 20 to 24 Years | 738 (66.7%) | 0 (0.0%) |
| 25 to 29 Years | 419 (99.3%) | 0 (0.0%) |
| 30 to 34 Years | 241 (96.0%) | 0 (0.0%) |
| 35 to 44 Years | 294 (85.2%) | 0 (0.0%) |
| 45 to 54 Years | 507 (77.6%) | 0 (0.0%) |
| 55 to 59 Years | 60 (45.1%) | 0 (0.0%) |
| 60 to 64 Years | 136 (60.2%) | 0 (0.0%) |
| 65 to 74 Years | 49 (10.0%) | 14 (28.6%) |
| 75 Years and over | 49 (13.5%) | 0 (0.0%) |
| Total | 2,596 (61.5%) | 31 (1.2%) |
Employment Status by Educational Attainment in Lebanon
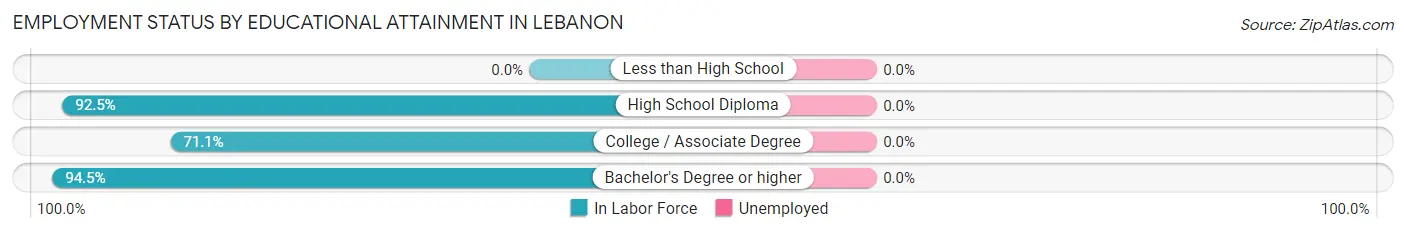
| Educational Attainment | In Labor Force | Unemployed |
| Less than High School | 0 (0.0%) | 0 (0.0%) |
| High School Diploma | 273 (92.5%) | 0 (0.0%) |
| College / Associate Degree | 621 (71.1%) | 0 (0.0%) |
| Bachelor's Degree or higher | 763 (94.5%) | 0 (0.0%) |
| Total | 1,656 (81.6%) | 0 (0.0%) |
Employment Occupations by Sex in Lebanon
Management, Business, Science and Arts Occupations
The most common Management, Business, Science and Arts occupations in Lebanon are Community & Social Service (361 | 14.9%), Management (195 | 8.1%), Legal Services & Support (163 | 6.8%), Business & Financial (123 | 5.1%), and Education Instruction & Library (116 | 4.8%).

Management, Business, Science and Arts Occupations by Sex
Within the Management, Business, Science and Arts occupations in Lebanon, the most male-oriented occupations are Computers & Mathematics (100.0%), Architecture & Engineering (100.0%), and Computers, Engineering & Science (80.5%), while the most female-oriented occupations are Life, Physical & Social Science (100.0%), Education, Arts & Media (100.0%), and Legal Services & Support (100.0%).
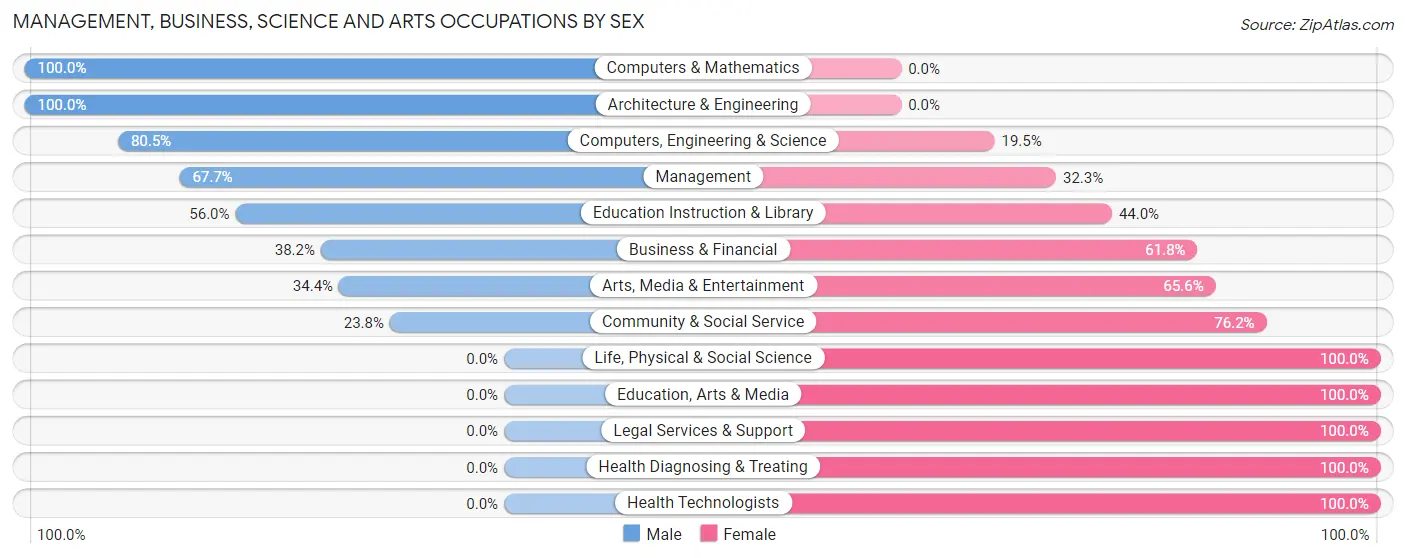
| Occupation | Male | Female |
| Management | 132 (67.7%) | 63 (32.3%) |
| Business & Financial | 47 (38.2%) | 76 (61.8%) |
| Computers, Engineering & Science | 62 (80.5%) | 15 (19.5%) |
| Computers & Mathematics | 42 (100.0%) | 0 (0.0%) |
| Architecture & Engineering | 20 (100.0%) | 0 (0.0%) |
| Life, Physical & Social Science | 0 (0.0%) | 15 (100.0%) |
| Community & Social Service | 86 (23.8%) | 275 (76.2%) |
| Education, Arts & Media | 0 (0.0%) | 21 (100.0%) |
| Legal Services & Support | 0 (0.0%) | 163 (100.0%) |
| Education Instruction & Library | 65 (56.0%) | 51 (44.0%) |
| Arts, Media & Entertainment | 21 (34.4%) | 40 (65.6%) |
| Health Diagnosing & Treating | 0 (0.0%) | 85 (100.0%) |
| Health Technologists | 0 (0.0%) | 85 (100.0%) |
| Total (Category) | 327 (38.9%) | 514 (61.1%) |
| Total (Overall) | 1,030 (42.6%) | 1,386 (57.4%) |
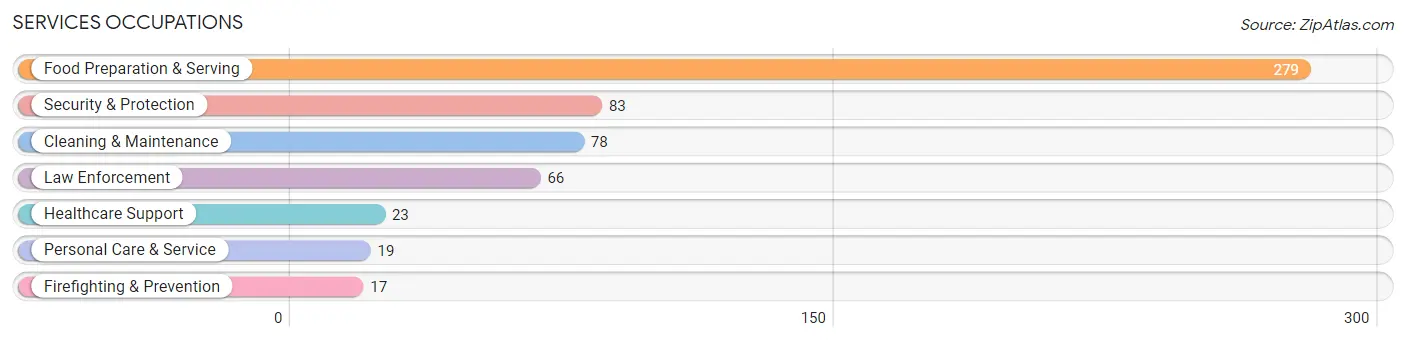
Services Occupations
The most common Services occupations in Lebanon are Food Preparation & Serving (279 | 11.6%), Security & Protection (83 | 3.4%), Cleaning & Maintenance (78 | 3.2%), Law Enforcement (66 | 2.7%), and Healthcare Support (23 | 0.9%).
Services Occupations by Sex
Within the Services occupations in Lebanon, the most male-oriented occupations are Cleaning & Maintenance (69.2%), Food Preparation & Serving (64.5%), and Law Enforcement (16.7%), while the most female-oriented occupations are Healthcare Support (100.0%), Personal Care & Service (100.0%), and Firefighting & Prevention (94.1%).
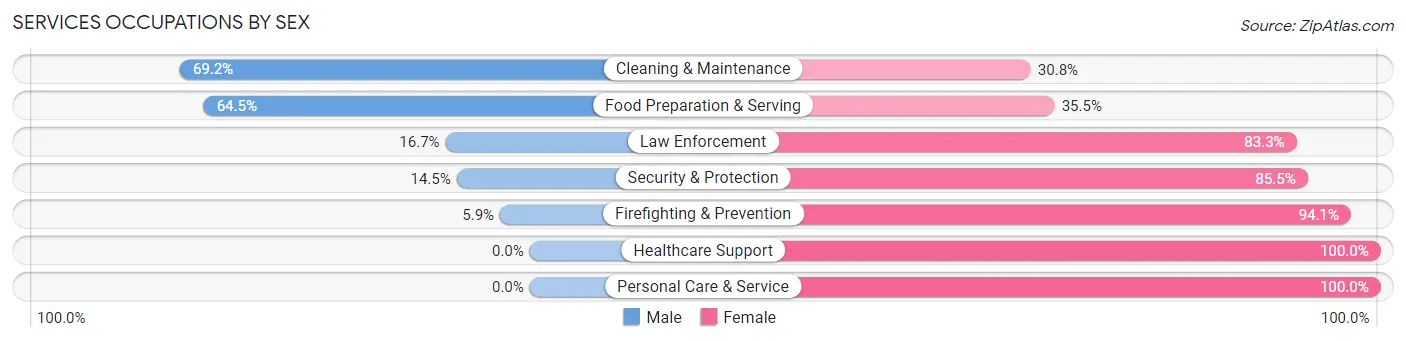
| Occupation | Male | Female |
| Healthcare Support | 0 (0.0%) | 23 (100.0%) |
| Security & Protection | 12 (14.5%) | 71 (85.5%) |
| Firefighting & Prevention | 1 (5.9%) | 16 (94.1%) |
| Law Enforcement | 11 (16.7%) | 55 (83.3%) |
| Food Preparation & Serving | 180 (64.5%) | 99 (35.5%) |
| Cleaning & Maintenance | 54 (69.2%) | 24 (30.8%) |
| Personal Care & Service | 0 (0.0%) | 19 (100.0%) |
| Total (Category) | 246 (51.0%) | 236 (49.0%) |
| Total (Overall) | 1,030 (42.6%) | 1,386 (57.4%) |
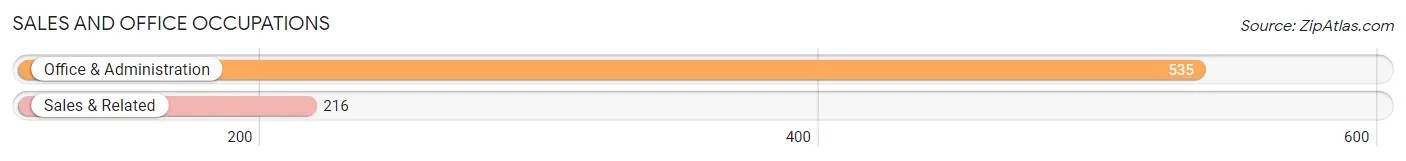
Sales and Office Occupations
The most common Sales and Office occupations in Lebanon are Office & Administration (535 | 22.1%), and Sales & Related (216 | 8.9%).
Sales and Office Occupations by Sex
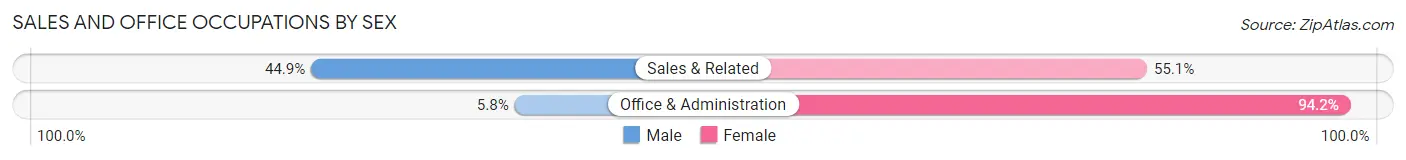
| Occupation | Male | Female |
| Sales & Related | 97 (44.9%) | 119 (55.1%) |
| Office & Administration | 31 (5.8%) | 504 (94.2%) |
| Total (Category) | 128 (17.0%) | 623 (83.0%) |
| Total (Overall) | 1,030 (42.6%) | 1,386 (57.4%) |
Natural Resources, Construction and Maintenance Occupations
The most common Natural Resources, Construction and Maintenance occupations in Lebanon are Construction & Extraction (41 | 1.7%), and Installation, Maintenance & Repair (31 | 1.3%).
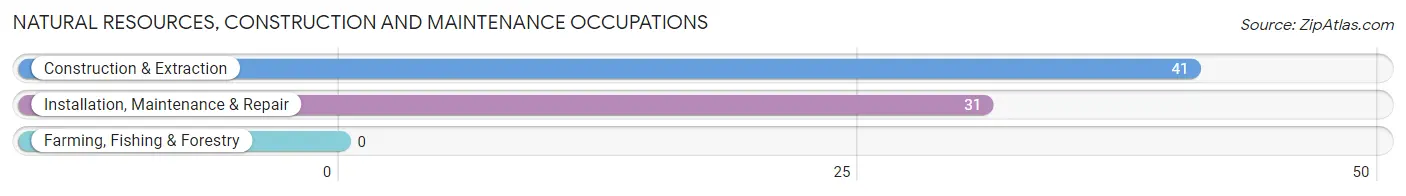
Natural Resources, Construction and Maintenance Occupations by Sex
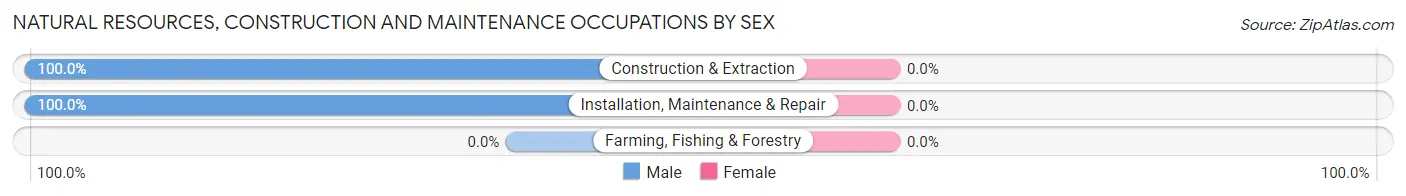
| Occupation | Male | Female |
| Farming, Fishing & Forestry | 0 (0.0%) | 0 (0.0%) |
| Construction & Extraction | 41 (100.0%) | 0 (0.0%) |
| Installation, Maintenance & Repair | 31 (100.0%) | 0 (0.0%) |
| Total (Category) | 72 (100.0%) | 0 (0.0%) |
| Total (Overall) | 1,030 (42.6%) | 1,386 (57.4%) |
Production, Transportation and Moving Occupations
The most common Production, Transportation and Moving occupations in Lebanon are Material Moving (149 | 6.2%), Production (105 | 4.3%), and Transportation (16 | 0.7%).
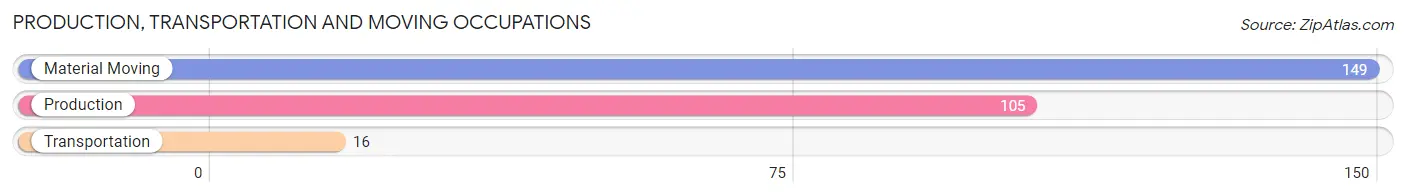
Production, Transportation and Moving Occupations by Sex
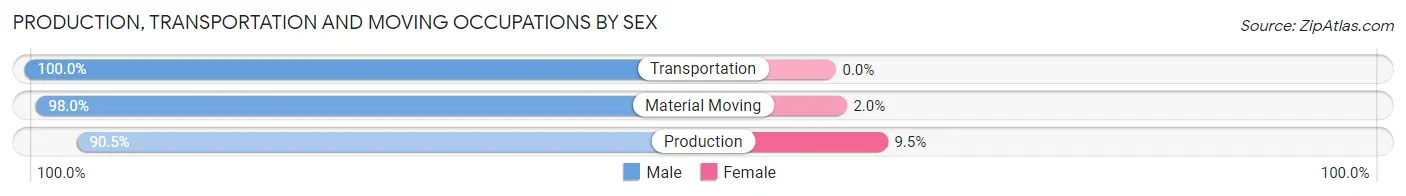
| Occupation | Male | Female |
| Production | 95 (90.5%) | 10 (9.5%) |
| Transportation | 16 (100.0%) | 0 (0.0%) |
| Material Moving | 146 (98.0%) | 3 (2.0%) |
| Total (Category) | 257 (95.2%) | 13 (4.8%) |
| Total (Overall) | 1,030 (42.6%) | 1,386 (57.4%) |
Employment Industries by Sex in Lebanon
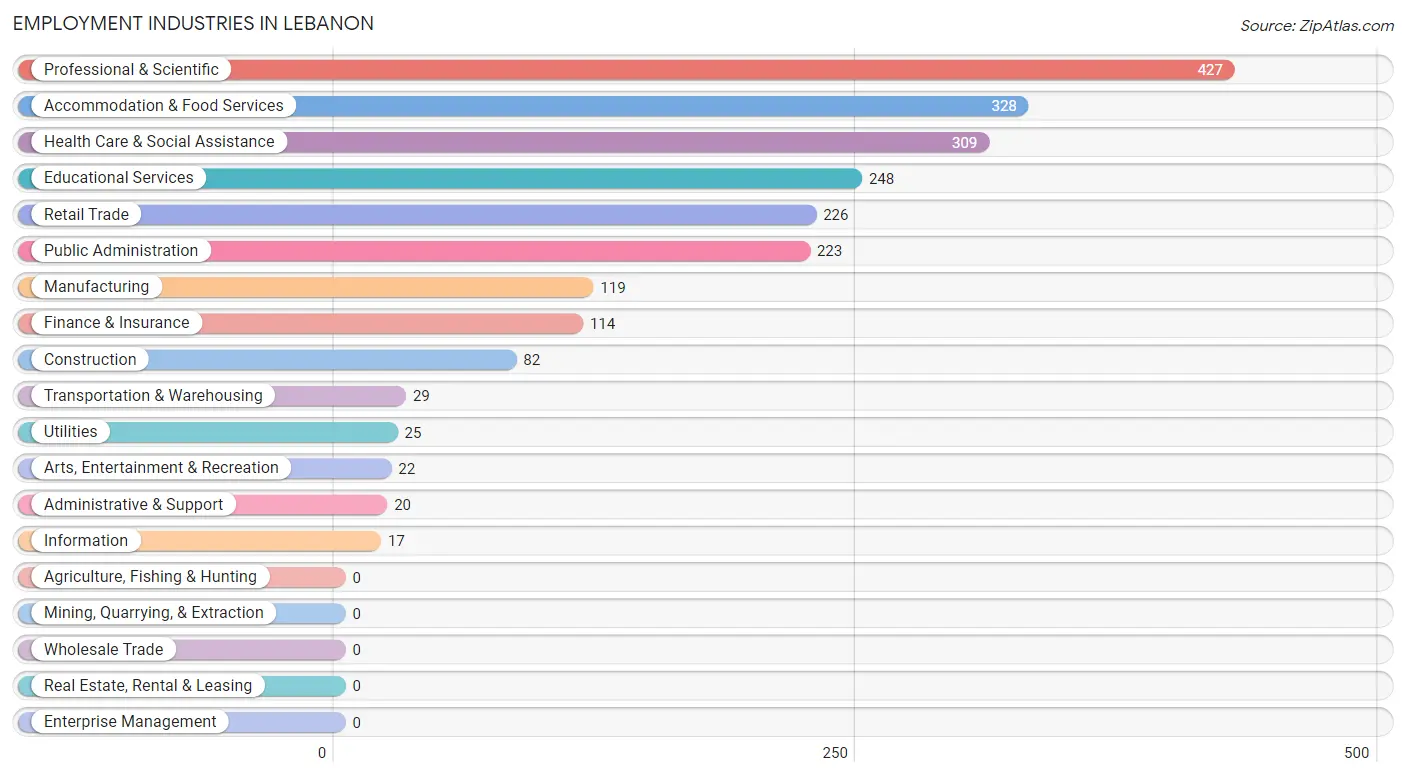
Employment Industries in Lebanon
The major employment industries in Lebanon include Professional & Scientific (427 | 17.7%), Accommodation & Food Services (328 | 13.6%), Health Care & Social Assistance (309 | 12.8%), Educational Services (248 | 10.3%), and Retail Trade (226 | 9.3%).
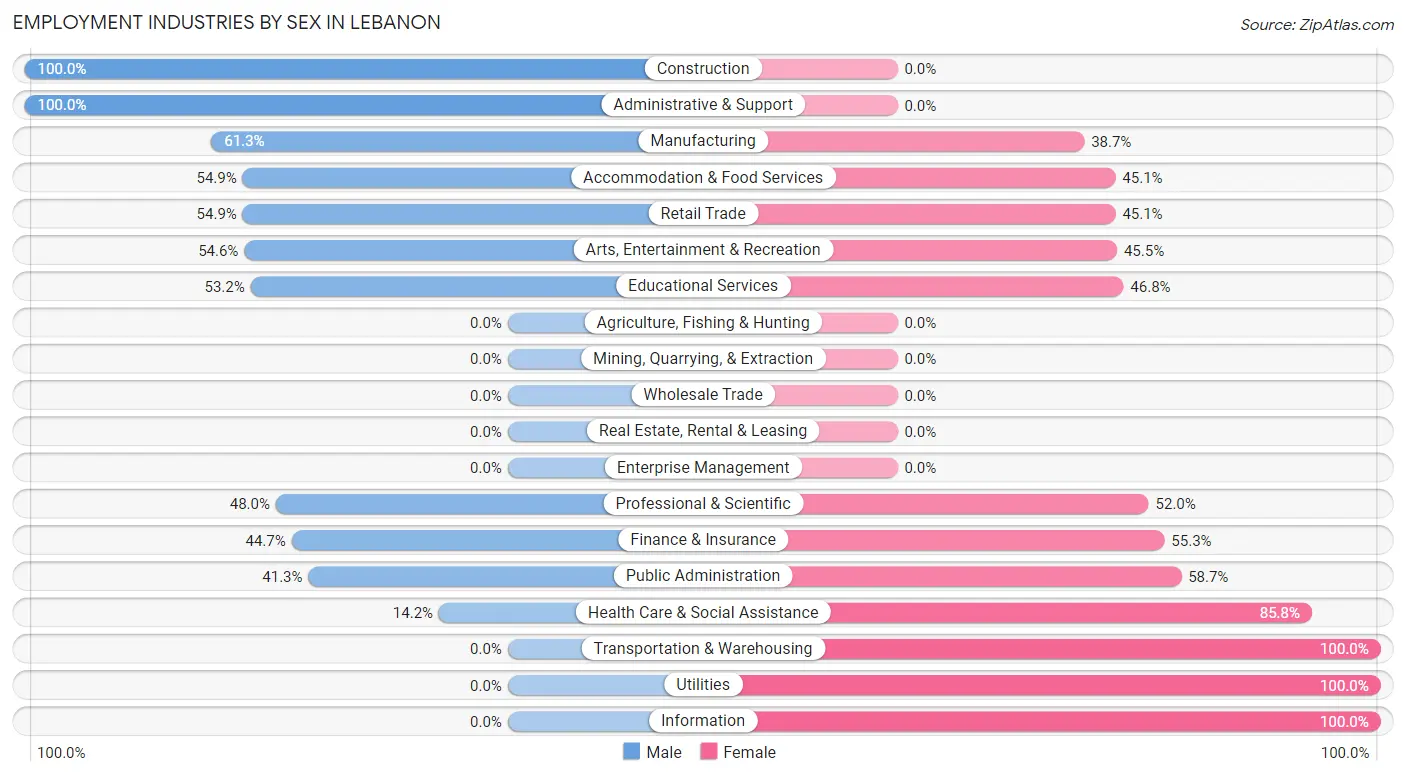
Employment Industries by Sex in Lebanon
The Lebanon industries that see more men than women are Construction (100.0%), Administrative & Support (100.0%), and Manufacturing (61.3%), whereas the industries that tend to have a higher number of women are Transportation & Warehousing (100.0%), Utilities (100.0%), and Information (100.0%).
| Industry | Male | Female |
| Agriculture, Fishing & Hunting | 0 (0.0%) | 0 (0.0%) |
| Mining, Quarrying, & Extraction | 0 (0.0%) | 0 (0.0%) |
| Construction | 82 (100.0%) | 0 (0.0%) |
| Manufacturing | 73 (61.3%) | 46 (38.7%) |
| Wholesale Trade | 0 (0.0%) | 0 (0.0%) |
| Retail Trade | 124 (54.9%) | 102 (45.1%) |
| Transportation & Warehousing | 0 (0.0%) | 29 (100.0%) |
| Utilities | 0 (0.0%) | 25 (100.0%) |
| Information | 0 (0.0%) | 17 (100.0%) |
| Finance & Insurance | 51 (44.7%) | 63 (55.3%) |
| Real Estate, Rental & Leasing | 0 (0.0%) | 0 (0.0%) |
| Professional & Scientific | 205 (48.0%) | 222 (52.0%) |
| Enterprise Management | 0 (0.0%) | 0 (0.0%) |
| Administrative & Support | 20 (100.0%) | 0 (0.0%) |
| Educational Services | 132 (53.2%) | 116 (46.8%) |
| Health Care & Social Assistance | 44 (14.2%) | 265 (85.8%) |
| Arts, Entertainment & Recreation | 12 (54.5%) | 10 (45.5%) |
| Accommodation & Food Services | 180 (54.9%) | 148 (45.1%) |
| Public Administration | 92 (41.3%) | 131 (58.7%) |
| Total | 1,030 (42.6%) | 1,386 (57.4%) |
Education in Lebanon
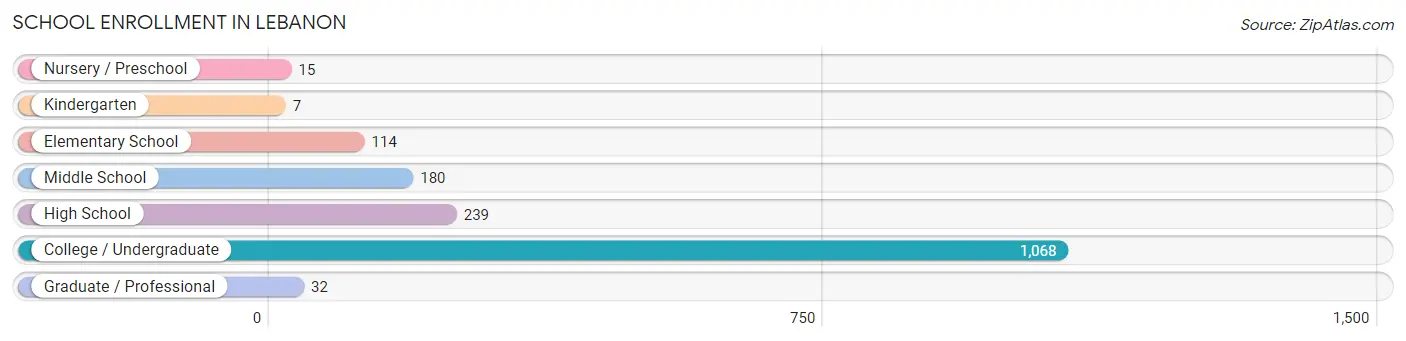
School Enrollment in Lebanon
The most common levels of schooling among the 1,655 students in Lebanon are college / undergraduate (1,068 | 64.5%), high school (239 | 14.4%), and middle school (180 | 10.9%).
| School Level | # Students | % Students |
| Nursery / Preschool | 15 | 0.9% |
| Kindergarten | 7 | 0.4% |
| Elementary School | 114 | 6.9% |
| Middle School | 180 | 10.9% |
| High School | 239 | 14.4% |
| College / Undergraduate | 1,068 | 64.5% |
| Graduate / Professional | 32 | 1.9% |
| Total | 1,655 | 100.0% |
School Enrollment by Age by Funding Source in Lebanon
Out of a total of 1,655 students who are enrolled in schools in Lebanon, 885 (53.5%) attend a private institution, while the remaining 770 (46.5%) are enrolled in public schools. The age group of 25 to 34 year olds has the highest likelihood of being enrolled in private schools, with 146 (78.9% in the age bracket) enrolled. Conversely, the age group of 3 to 4 year olds has the lowest likelihood of being enrolled in a private school, with 15 (100.0% in the age bracket) attending a public institution.
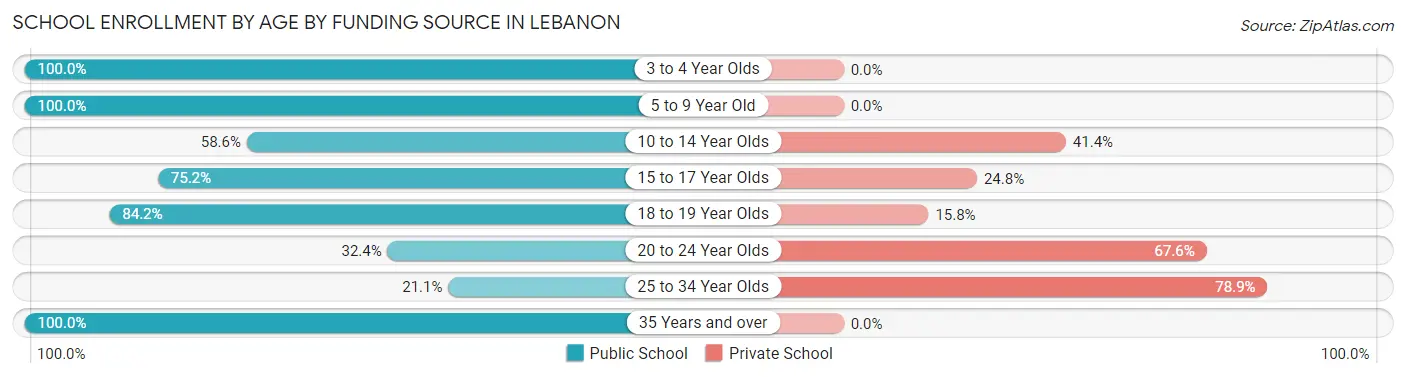
| Age Bracket | Public School | Private School |
| 3 to 4 Year Olds | 15 (100.0%) | 0 (0.0%) |
| 5 to 9 Year Old | 86 (100.0%) | 0 (0.0%) |
| 10 to 14 Year Olds | 160 (58.6%) | 113 (41.4%) |
| 15 to 17 Year Olds | 109 (75.2%) | 36 (24.8%) |
| 18 to 19 Year Olds | 64 (84.2%) | 12 (15.8%) |
| 20 to 24 Year Olds | 277 (32.4%) | 578 (67.6%) |
| 25 to 34 Year Olds | 39 (21.1%) | 146 (78.9%) |
| 35 Years and over | 20 (100.0%) | 0 (0.0%) |
| Total | 770 (46.5%) | 885 (53.5%) |
Educational Attainment by Field of Study in Lebanon
Business (315 | 27.0%), education (229 | 19.7%), computers & mathematics (157 | 13.5%), arts & humanities (106 | 9.1%), and social sciences (76 | 6.5%) are the most common fields of study among 1,165 individuals in Lebanon who have obtained a bachelor's degree or higher.
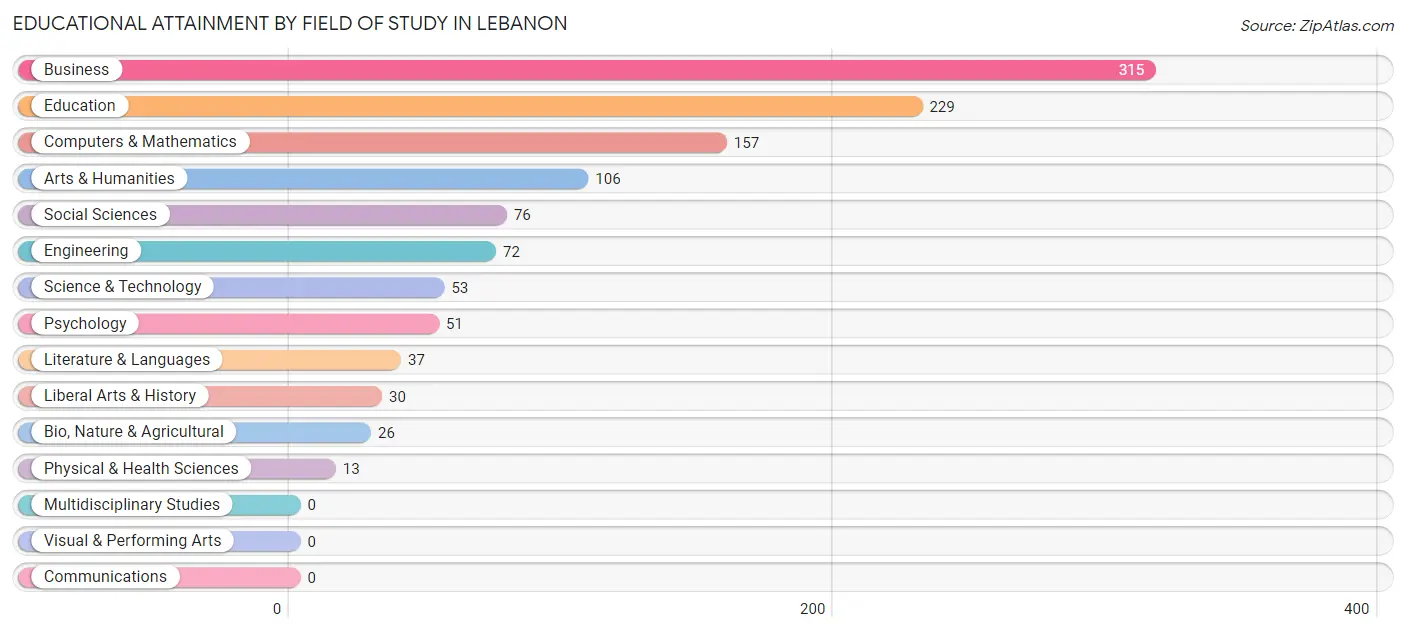
| Field of Study | # Graduates | % Graduates |
| Computers & Mathematics | 157 | 13.5% |
| Bio, Nature & Agricultural | 26 | 2.2% |
| Physical & Health Sciences | 13 | 1.1% |
| Psychology | 51 | 4.4% |
| Social Sciences | 76 | 6.5% |
| Engineering | 72 | 6.2% |
| Multidisciplinary Studies | 0 | 0.0% |
| Science & Technology | 53 | 4.5% |
| Business | 315 | 27.0% |
| Education | 229 | 19.7% |
| Literature & Languages | 37 | 3.2% |
| Liberal Arts & History | 30 | 2.6% |
| Visual & Performing Arts | 0 | 0.0% |
| Communications | 0 | 0.0% |
| Arts & Humanities | 106 | 9.1% |
| Total | 1,165 | 100.0% |
Transportation & Commute in Lebanon
Vehicle Availability by Sex in Lebanon
The most prevalent vehicle ownership categories in Lebanon are males with 2 vehicles (451, accounting for 39.8%) and females with 2 vehicles (473, making up 34.8%).
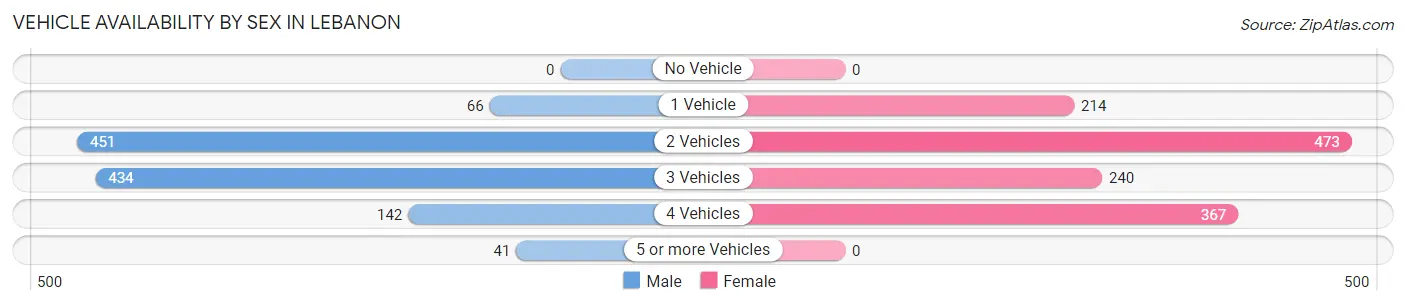
| Vehicles Available | Male | Female |
| No Vehicle | 0 (0.0%) | 0 (0.0%) |
| 1 Vehicle | 66 (5.8%) | 214 (16.5%) |
| 2 Vehicles | 451 (39.8%) | 473 (36.5%) |
| 3 Vehicles | 434 (38.3%) | 240 (18.5%) |
| 4 Vehicles | 142 (12.5%) | 367 (28.4%) |
| 5 or more Vehicles | 41 (3.6%) | 0 (0.0%) |
| Total | 1,134 (100.0%) | 1,294 (100.0%) |
Commute Time in Lebanon
The most frequently occuring commute durations in Lebanon are 20 to 24 minutes (611 commuters, 29.4%), 15 to 19 minutes (316 commuters, 15.2%), and 25 to 29 minutes (279 commuters, 13.4%).
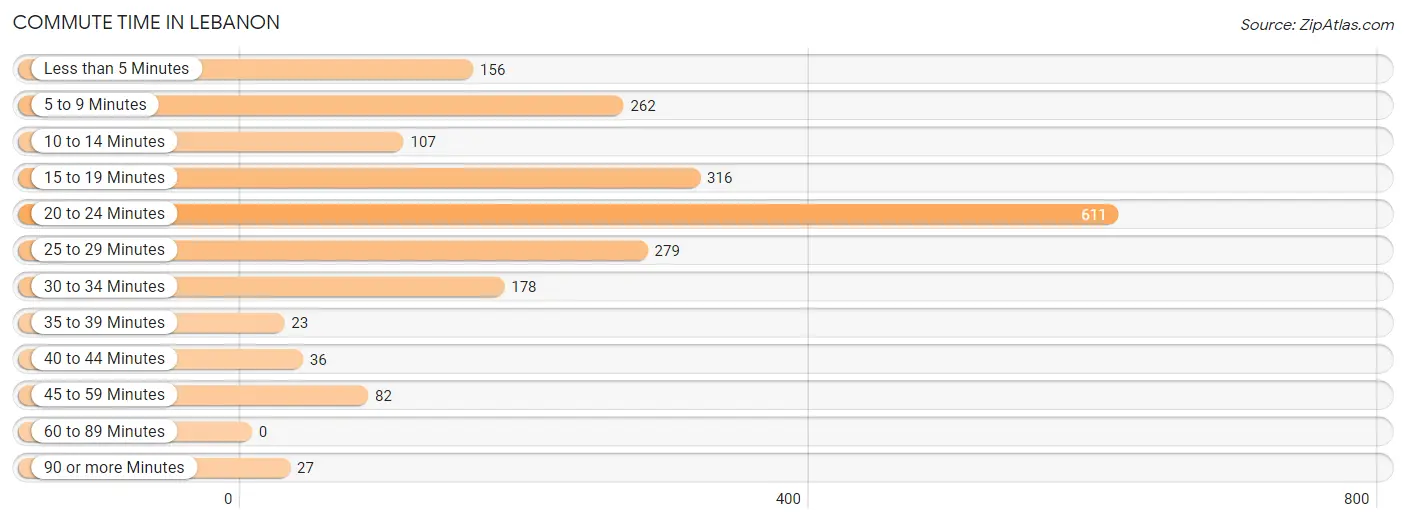
| Commute Time | # Commuters | % Commuters |
| Less than 5 Minutes | 156 | 7.5% |
| 5 to 9 Minutes | 262 | 12.6% |
| 10 to 14 Minutes | 107 | 5.1% |
| 15 to 19 Minutes | 316 | 15.2% |
| 20 to 24 Minutes | 611 | 29.4% |
| 25 to 29 Minutes | 279 | 13.4% |
| 30 to 34 Minutes | 178 | 8.6% |
| 35 to 39 Minutes | 23 | 1.1% |
| 40 to 44 Minutes | 36 | 1.7% |
| 45 to 59 Minutes | 82 | 4.0% |
| 60 to 89 Minutes | 0 | 0.0% |
| 90 or more Minutes | 27 | 1.3% |
Commute Time by Sex in Lebanon
The most common commute times in Lebanon are 15 to 19 minutes (246 commuters, 28.2%) for males and 20 to 24 minutes (370 commuters, 30.7%) for females.
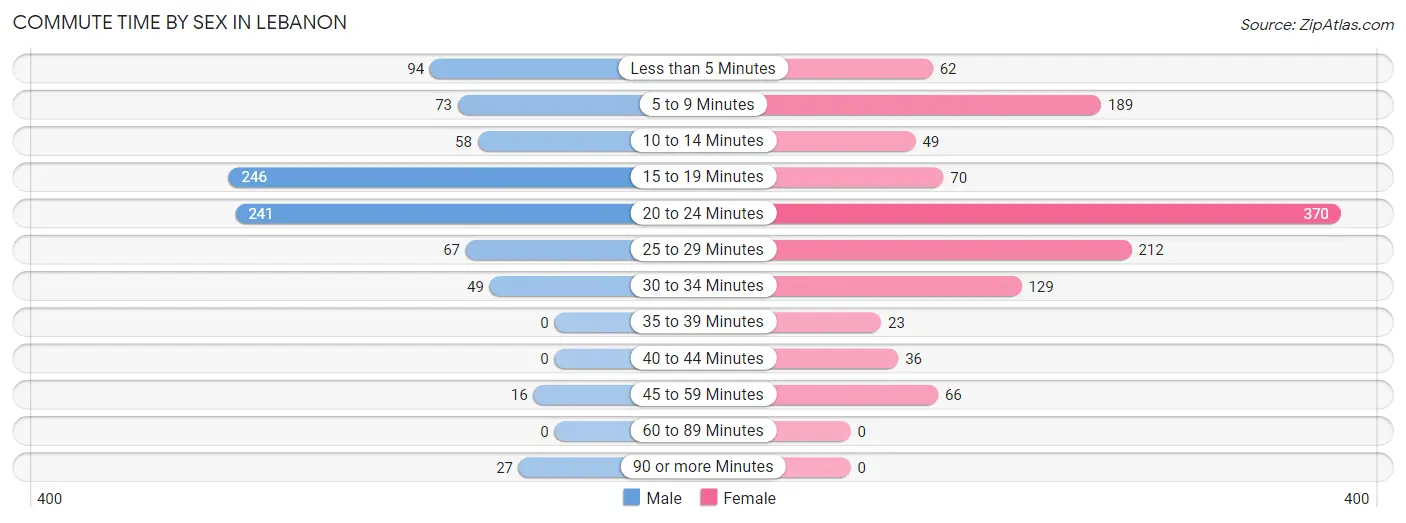
| Commute Time | Male | Female |
| Less than 5 Minutes | 94 (10.8%) | 62 (5.1%) |
| 5 to 9 Minutes | 73 (8.4%) | 189 (15.7%) |
| 10 to 14 Minutes | 58 (6.7%) | 49 (4.1%) |
| 15 to 19 Minutes | 246 (28.2%) | 70 (5.8%) |
| 20 to 24 Minutes | 241 (27.7%) | 370 (30.7%) |
| 25 to 29 Minutes | 67 (7.7%) | 212 (17.6%) |
| 30 to 34 Minutes | 49 (5.6%) | 129 (10.7%) |
| 35 to 39 Minutes | 0 (0.0%) | 23 (1.9%) |
| 40 to 44 Minutes | 0 (0.0%) | 36 (3.0%) |
| 45 to 59 Minutes | 16 (1.8%) | 66 (5.5%) |
| 60 to 89 Minutes | 0 (0.0%) | 0 (0.0%) |
| 90 or more Minutes | 27 (3.1%) | 0 (0.0%) |
Time of Departure to Work by Sex in Lebanon
The most frequent times of departure to work in Lebanon are 6:00 AM to 6:29 AM (188, 21.6%) for males and 7:30 AM to 7:59 AM (481, 39.9%) for females.
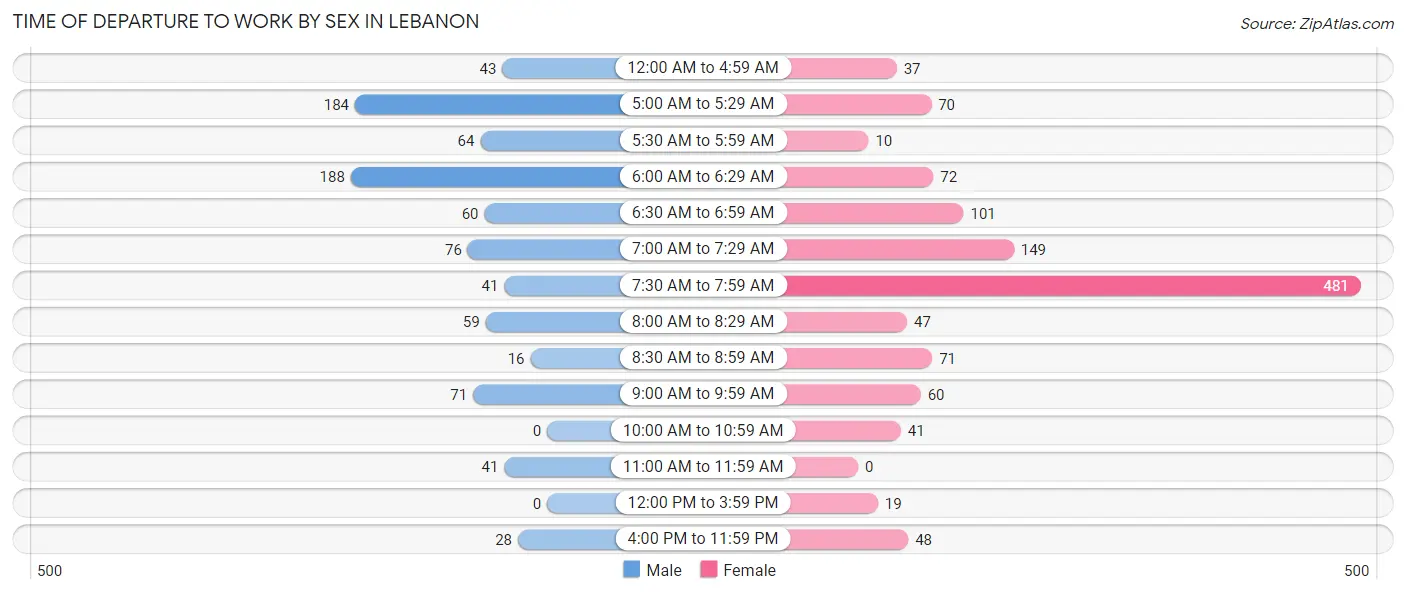
| Time of Departure | Male | Female |
| 12:00 AM to 4:59 AM | 43 (4.9%) | 37 (3.1%) |
| 5:00 AM to 5:29 AM | 184 (21.1%) | 70 (5.8%) |
| 5:30 AM to 5:59 AM | 64 (7.3%) | 10 (0.8%) |
| 6:00 AM to 6:29 AM | 188 (21.6%) | 72 (6.0%) |
| 6:30 AM to 6:59 AM | 60 (6.9%) | 101 (8.4%) |
| 7:00 AM to 7:29 AM | 76 (8.7%) | 149 (12.3%) |
| 7:30 AM to 7:59 AM | 41 (4.7%) | 481 (39.9%) |
| 8:00 AM to 8:29 AM | 59 (6.8%) | 47 (3.9%) |
| 8:30 AM to 8:59 AM | 16 (1.8%) | 71 (5.9%) |
| 9:00 AM to 9:59 AM | 71 (8.2%) | 60 (5.0%) |
| 10:00 AM to 10:59 AM | 0 (0.0%) | 41 (3.4%) |
| 11:00 AM to 11:59 AM | 41 (4.7%) | 0 (0.0%) |
| 12:00 PM to 3:59 PM | 0 (0.0%) | 19 (1.6%) |
| 4:00 PM to 11:59 PM | 28 (3.2%) | 48 (4.0%) |
| Total | 871 (100.0%) | 1,206 (100.0%) |
Housing Occupancy in Lebanon
Occupancy by Ownership in Lebanon
Of the total 1,728 dwellings in Lebanon, owner-occupied units account for 1,108 (64.1%), while renter-occupied units make up 620 (35.9%).
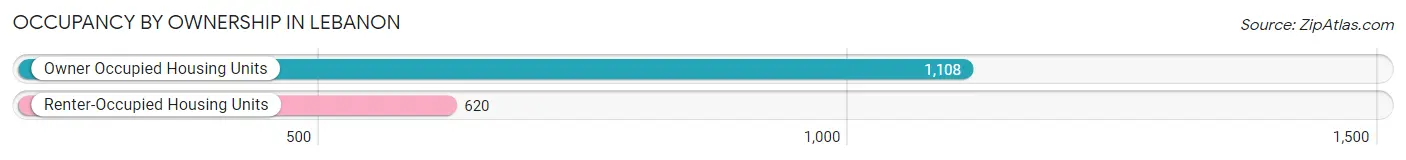
| Occupancy | # Housing Units | % Housing Units |
| Owner Occupied Housing Units | 1,108 | 64.1% |
| Renter-Occupied Housing Units | 620 | 35.9% |
| Total Occupied Housing Units | 1,728 | 100.0% |
Occupancy by Household Size in Lebanon
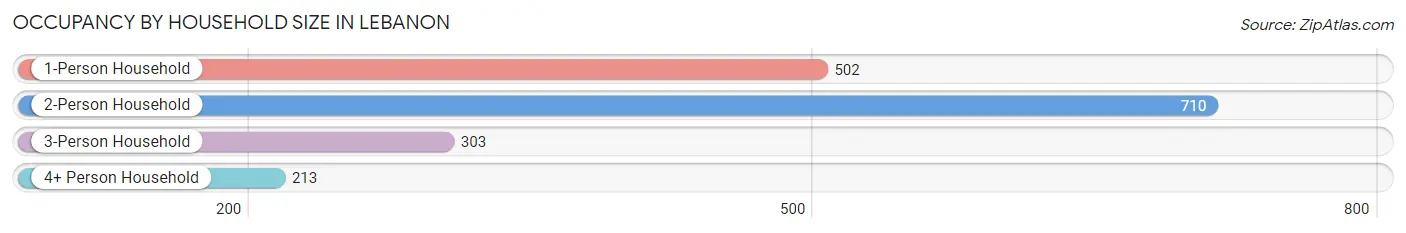
| Household Size | # Housing Units | % Housing Units |
| 1-Person Household | 502 | 29.0% |
| 2-Person Household | 710 | 41.1% |
| 3-Person Household | 303 | 17.5% |
| 4+ Person Household | 213 | 12.3% |
| Total Housing Units | 1,728 | 100.0% |
Occupancy by Ownership by Household Size in Lebanon
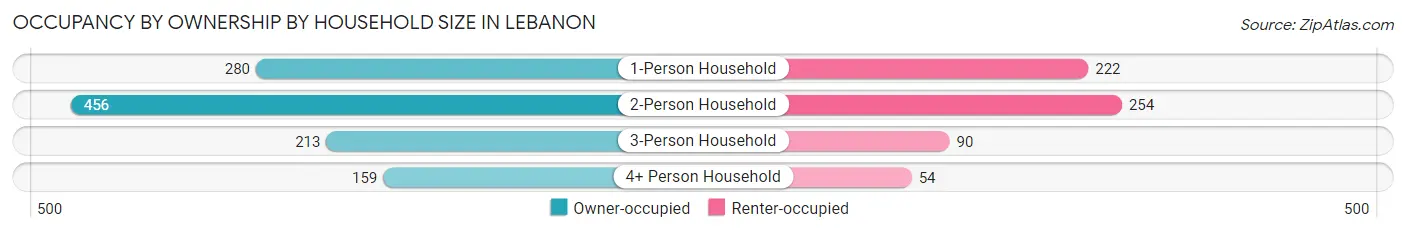
| Household Size | Owner-occupied | Renter-occupied |
| 1-Person Household | 280 (55.8%) | 222 (44.2%) |
| 2-Person Household | 456 (64.2%) | 254 (35.8%) |
| 3-Person Household | 213 (70.3%) | 90 (29.7%) |
| 4+ Person Household | 159 (74.7%) | 54 (25.4%) |
| Total Housing Units | 1,108 (64.1%) | 620 (35.9%) |
Occupancy by Educational Attainment in Lebanon
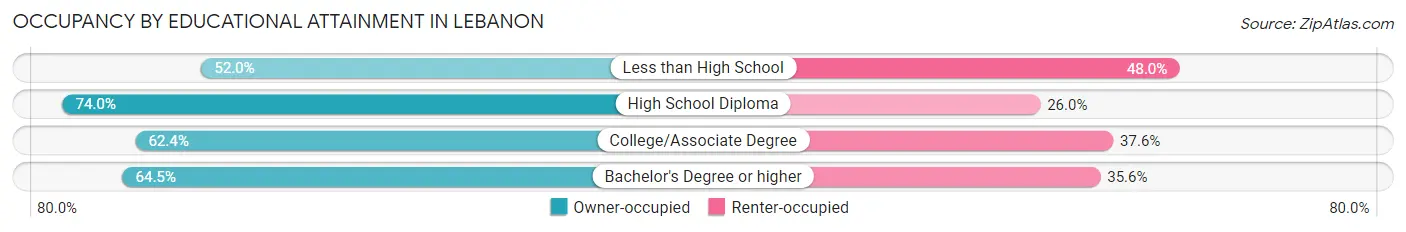
| Household Size | Owner-occupied | Renter-occupied |
| Less than High School | 53 (52.0%) | 49 (48.0%) |
| High School Diploma | 145 (74.0%) | 51 (26.0%) |
| College/Associate Degree | 357 (62.4%) | 215 (37.6%) |
| Bachelor's Degree or higher | 553 (64.4%) | 305 (35.5%) |
Occupancy by Age of Householder in Lebanon
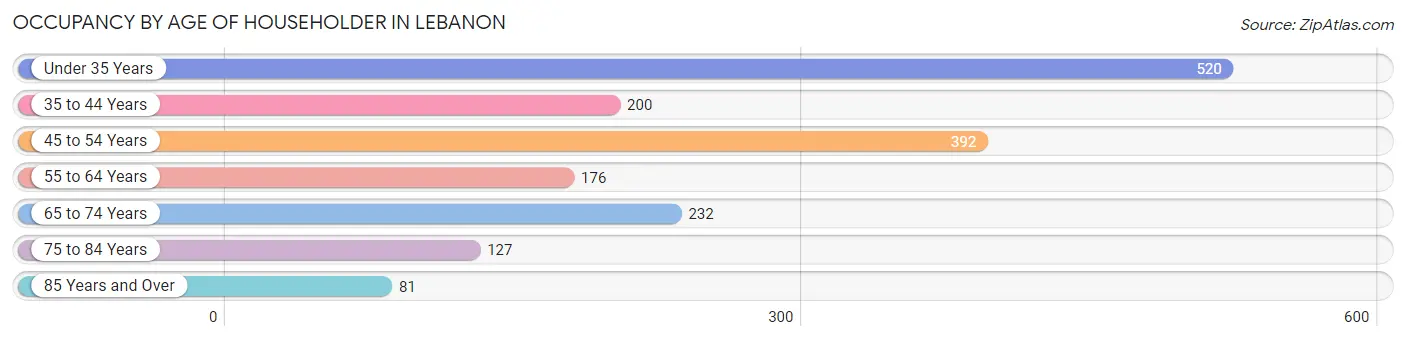
| Age Bracket | # Households | % Households |
| Under 35 Years | 520 | 30.1% |
| 35 to 44 Years | 200 | 11.6% |
| 45 to 54 Years | 392 | 22.7% |
| 55 to 64 Years | 176 | 10.2% |
| 65 to 74 Years | 232 | 13.4% |
| 75 to 84 Years | 127 | 7.3% |
| 85 Years and Over | 81 | 4.7% |
| Total | 1,728 | 100.0% |
Housing Finances in Lebanon
Median Income by Occupancy in Lebanon
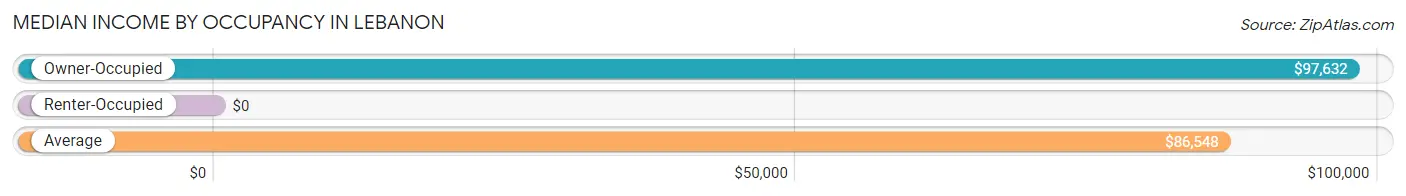
| Occupancy Type | # Households | Median Income |
| Owner-Occupied | 1,108 (64.1%) | $97,632 |
| Renter-Occupied | 620 (35.9%) | $0 |
| Average | 1,728 (100.0%) | $86,548 |
Occupancy by Householder Income Bracket in Lebanon
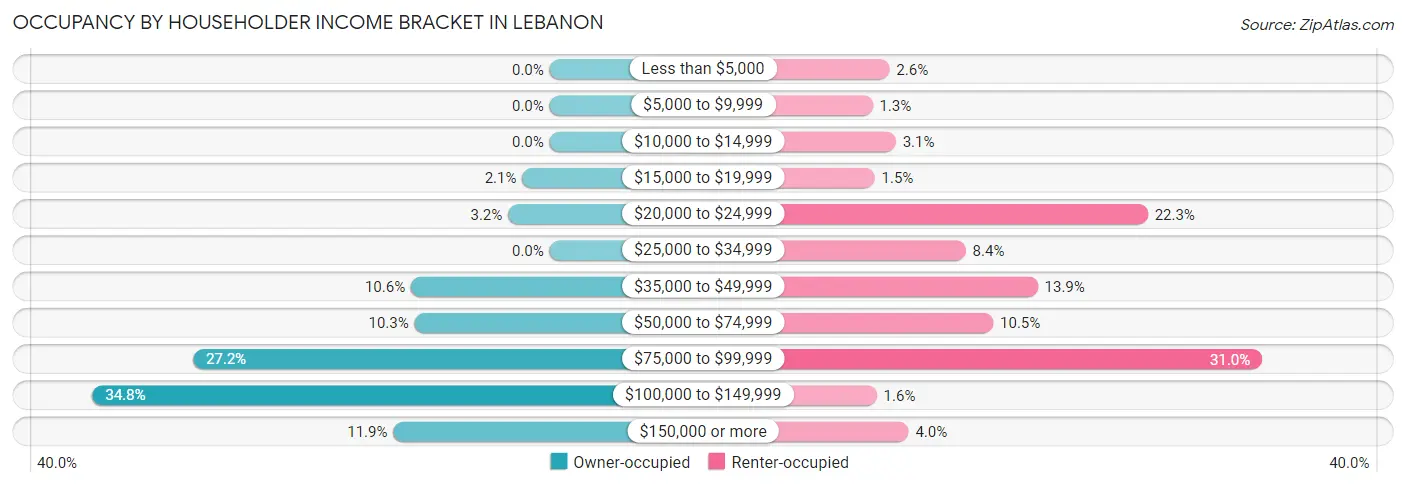
| Income Bracket | Owner-occupied | Renter-occupied |
| Less than $5,000 | 0 (0.0%) | 16 (2.6%) |
| $5,000 to $9,999 | 0 (0.0%) | 8 (1.3%) |
| $10,000 to $14,999 | 0 (0.0%) | 19 (3.1%) |
| $15,000 to $19,999 | 23 (2.1%) | 9 (1.5%) |
| $20,000 to $24,999 | 35 (3.2%) | 138 (22.3%) |
| $25,000 to $34,999 | 0 (0.0%) | 52 (8.4%) |
| $35,000 to $49,999 | 117 (10.6%) | 86 (13.9%) |
| $50,000 to $74,999 | 114 (10.3%) | 65 (10.5%) |
| $75,000 to $99,999 | 301 (27.2%) | 192 (31.0%) |
| $100,000 to $149,999 | 386 (34.8%) | 10 (1.6%) |
| $150,000 or more | 132 (11.9%) | 25 (4.0%) |
| Total | 1,108 (100.0%) | 620 (100.0%) |
Monthly Housing Cost Tiers in Lebanon
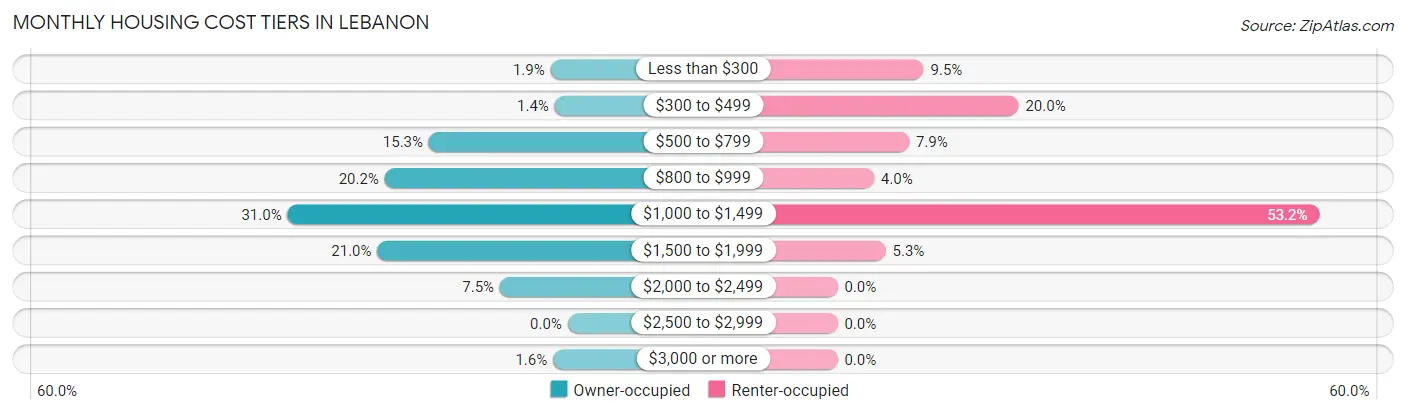
| Monthly Cost | Owner-occupied | Renter-occupied |
| Less than $300 | 21 (1.9%) | 59 (9.5%) |
| $300 to $499 | 16 (1.4%) | 124 (20.0%) |
| $500 to $799 | 170 (15.3%) | 49 (7.9%) |
| $800 to $999 | 224 (20.2%) | 25 (4.0%) |
| $1,000 to $1,499 | 343 (31.0%) | 330 (53.2%) |
| $1,500 to $1,999 | 233 (21.0%) | 33 (5.3%) |
| $2,000 to $2,499 | 83 (7.5%) | 0 (0.0%) |
| $2,500 to $2,999 | 0 (0.0%) | 0 (0.0%) |
| $3,000 or more | 18 (1.6%) | 0 (0.0%) |
| Total | 1,108 (100.0%) | 620 (100.0%) |
Physical Housing Characteristics in Lebanon
Housing Structures in Lebanon
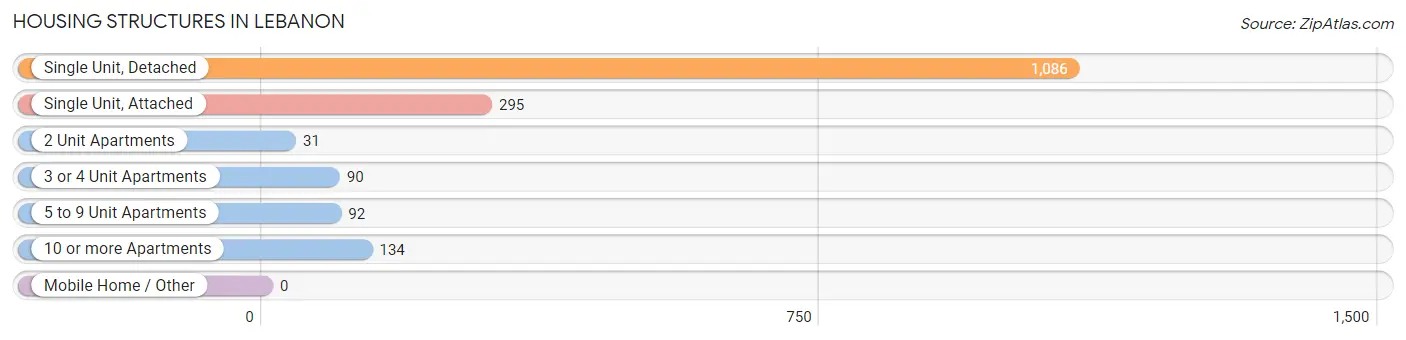
| Structure Type | # Housing Units | % Housing Units |
| Single Unit, Detached | 1,086 | 62.8% |
| Single Unit, Attached | 295 | 17.1% |
| 2 Unit Apartments | 31 | 1.8% |
| 3 or 4 Unit Apartments | 90 | 5.2% |
| 5 to 9 Unit Apartments | 92 | 5.3% |
| 10 or more Apartments | 134 | 7.7% |
| Mobile Home / Other | 0 | 0.0% |
| Total | 1,728 | 100.0% |
Housing Structures by Occupancy in Lebanon
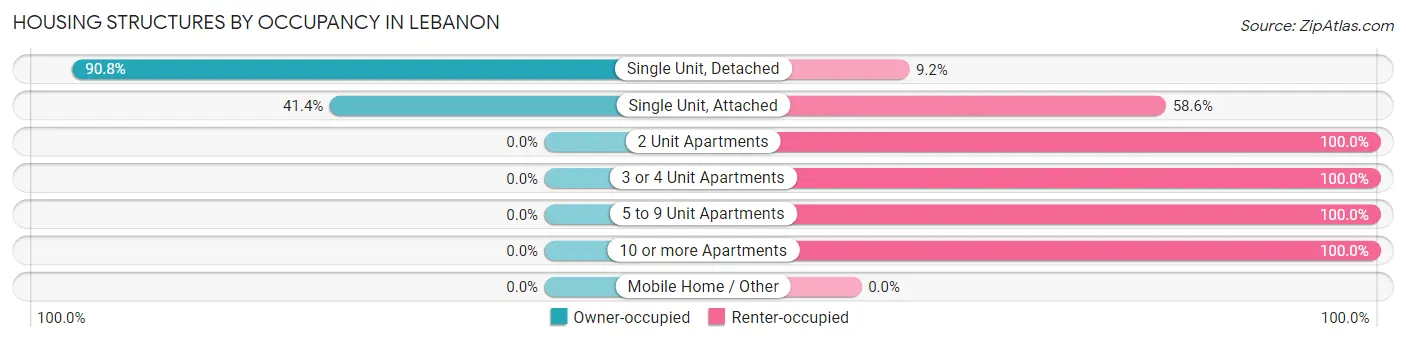
| Structure Type | Owner-occupied | Renter-occupied |
| Single Unit, Detached | 986 (90.8%) | 100 (9.2%) |
| Single Unit, Attached | 122 (41.4%) | 173 (58.6%) |
| 2 Unit Apartments | 0 (0.0%) | 31 (100.0%) |
| 3 or 4 Unit Apartments | 0 (0.0%) | 90 (100.0%) |
| 5 to 9 Unit Apartments | 0 (0.0%) | 92 (100.0%) |
| 10 or more Apartments | 0 (0.0%) | 134 (100.0%) |
| Mobile Home / Other | 0 (0.0%) | 0 (0.0%) |
| Total | 1,108 (64.1%) | 620 (35.9%) |
Housing Structures by Number of Rooms in Lebanon
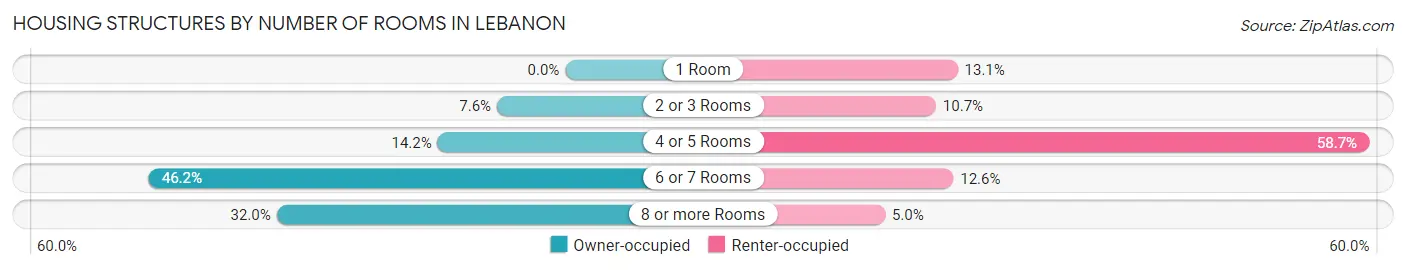
| Number of Rooms | Owner-occupied | Renter-occupied |
| 1 Room | 0 (0.0%) | 81 (13.1%) |
| 2 or 3 Rooms | 84 (7.6%) | 66 (10.6%) |
| 4 or 5 Rooms | 157 (14.2%) | 364 (58.7%) |
| 6 or 7 Rooms | 512 (46.2%) | 78 (12.6%) |
| 8 or more Rooms | 355 (32.0%) | 31 (5.0%) |
| Total | 1,108 (100.0%) | 620 (100.0%) |
Housing Structure by Heating Type in Lebanon
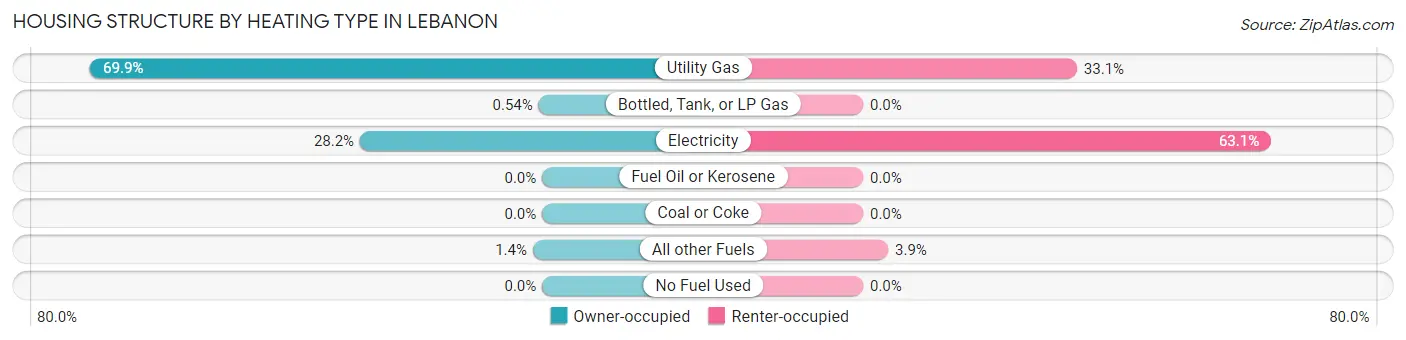
| Heating Type | Owner-occupied | Renter-occupied |
| Utility Gas | 774 (69.9%) | 205 (33.1%) |
| Bottled, Tank, or LP Gas | 6 (0.5%) | 0 (0.0%) |
| Electricity | 312 (28.2%) | 391 (63.1%) |
| Fuel Oil or Kerosene | 0 (0.0%) | 0 (0.0%) |
| Coal or Coke | 0 (0.0%) | 0 (0.0%) |
| All other Fuels | 16 (1.4%) | 24 (3.9%) |
| No Fuel Used | 0 (0.0%) | 0 (0.0%) |
| Total | 1,108 (100.0%) | 620 (100.0%) |
Household Vehicle Usage in Lebanon
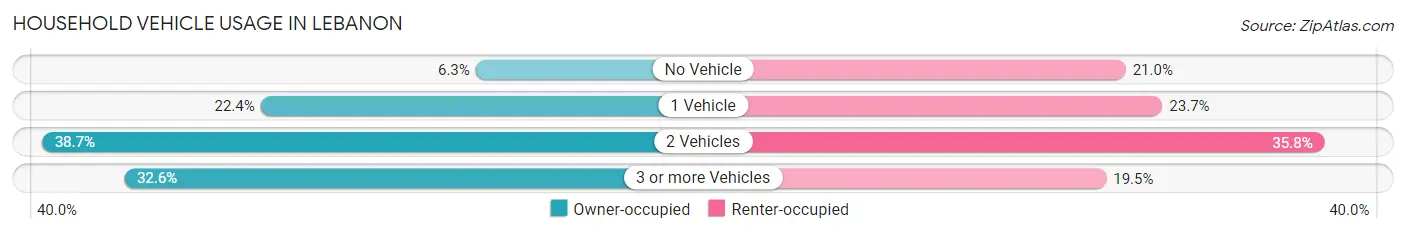
| Vehicles per Household | Owner-occupied | Renter-occupied |
| No Vehicle | 70 (6.3%) | 130 (21.0%) |
| 1 Vehicle | 248 (22.4%) | 147 (23.7%) |
| 2 Vehicles | 429 (38.7%) | 222 (35.8%) |
| 3 or more Vehicles | 361 (32.6%) | 121 (19.5%) |
| Total | 1,108 (100.0%) | 620 (100.0%) |
Real Estate & Mortgages in Lebanon
Real Estate and Mortgage Overview in Lebanon
| Characteristic | Without Mortgage | With Mortgage |
| Housing Units | 255 | 853 |
| Median Property Value | $136,300 | $124,200 |
| Median Household Income | $90,703 | $105 |
| Monthly Housing Costs | $671 | $18 |
| Real Estate Taxes | $3,462 | $0 |
Property Value by Mortgage Status in Lebanon
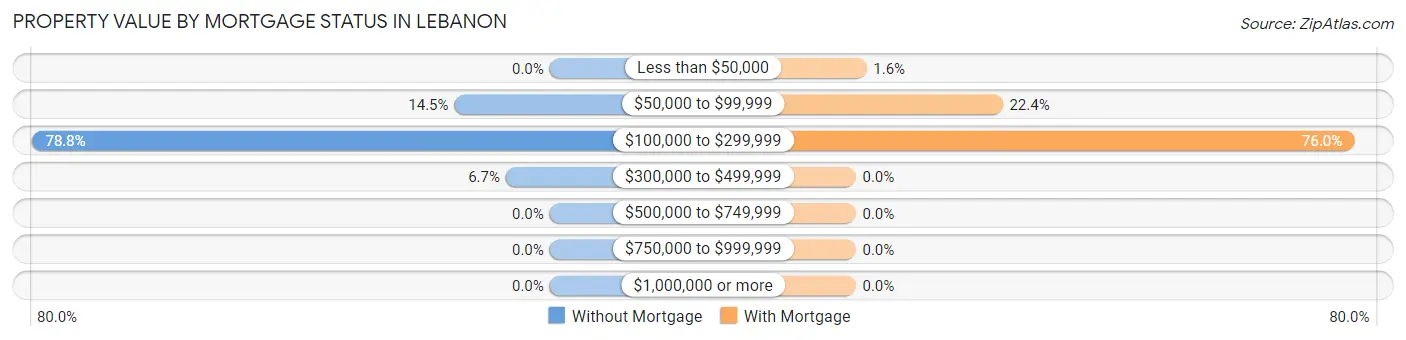
| Property Value | Without Mortgage | With Mortgage |
| Less than $50,000 | 0 (0.0%) | 14 (1.6%) |
| $50,000 to $99,999 | 37 (14.5%) | 191 (22.4%) |
| $100,000 to $299,999 | 201 (78.8%) | 648 (76.0%) |
| $300,000 to $499,999 | 17 (6.7%) | 0 (0.0%) |
| $500,000 to $749,999 | 0 (0.0%) | 0 (0.0%) |
| $750,000 to $999,999 | 0 (0.0%) | 0 (0.0%) |
| $1,000,000 or more | 0 (0.0%) | 0 (0.0%) |
| Total | 255 (100.0%) | 853 (100.0%) |
Household Income by Mortgage Status in Lebanon
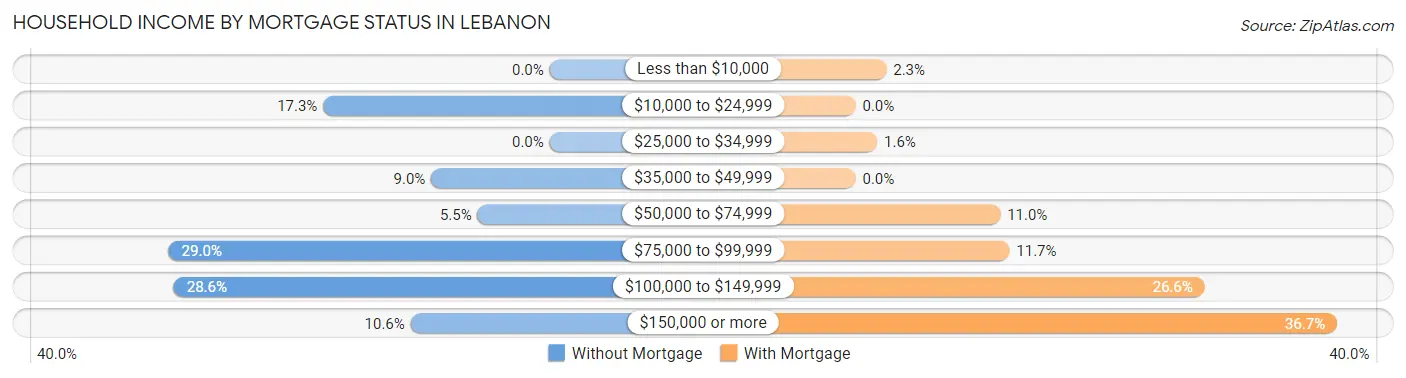
| Household Income | Without Mortgage | With Mortgage |
| Less than $10,000 | 0 (0.0%) | 20 (2.3%) |
| $10,000 to $24,999 | 44 (17.2%) | 0 (0.0%) |
| $25,000 to $34,999 | 0 (0.0%) | 14 (1.6%) |
| $35,000 to $49,999 | 23 (9.0%) | 0 (0.0%) |
| $50,000 to $74,999 | 14 (5.5%) | 94 (11.0%) |
| $75,000 to $99,999 | 74 (29.0%) | 100 (11.7%) |
| $100,000 to $149,999 | 73 (28.6%) | 227 (26.6%) |
| $150,000 or more | 27 (10.6%) | 313 (36.7%) |
| Total | 255 (100.0%) | 853 (100.0%) |
Property Value to Household Income Ratio in Lebanon
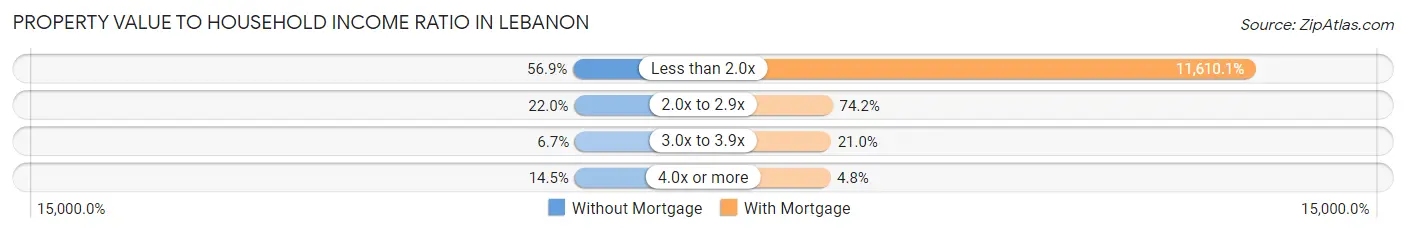
| Value-to-Income Ratio | Without Mortgage | With Mortgage |
| Less than 2.0x | 145 (56.9%) | 99,034 (11,610.1%) |
| 2.0x to 2.9x | 56 (22.0%) | 633 (74.2%) |
| 3.0x to 3.9x | 17 (6.7%) | 179 (21.0%) |
| 4.0x or more | 37 (14.5%) | 41 (4.8%) |
| Total | 255 (100.0%) | 853 (100.0%) |
Real Estate Taxes by Mortgage Status in Lebanon
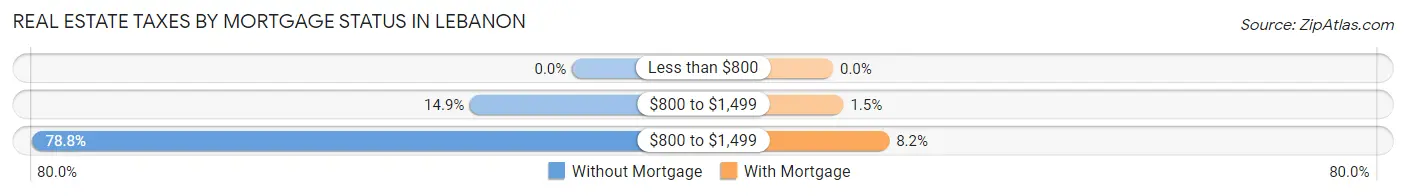
| Property Taxes | Without Mortgage | With Mortgage |
| Less than $800 | 0 (0.0%) | 0 (0.0%) |
| $800 to $1,499 | 38 (14.9%) | 13 (1.5%) |
| $800 to $1,499 | 201 (78.8%) | 70 (8.2%) |
| Total | 255 (100.0%) | 853 (100.0%) |
Health & Disability in Lebanon
Health Insurance Coverage by Age in Lebanon
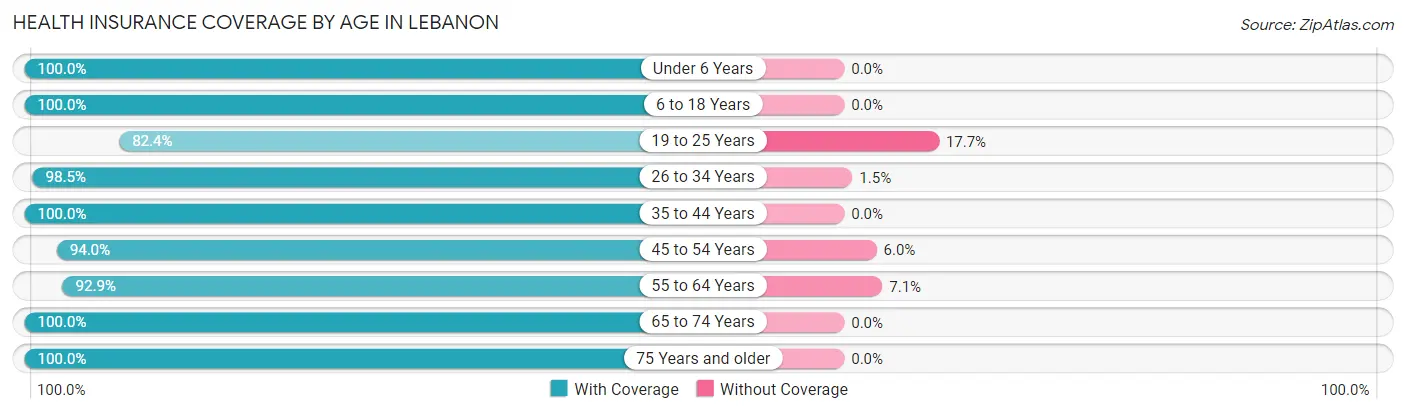
| Age Bracket | With Coverage | Without Coverage |
| Under 6 Years | 84 (100.0%) | 0 (0.0%) |
| 6 to 18 Years | 533 (100.0%) | 0 (0.0%) |
| 19 to 25 Years | 849 (82.4%) | 182 (17.6%) |
| 26 to 34 Years | 653 (98.5%) | 10 (1.5%) |
| 35 to 44 Years | 345 (100.0%) | 0 (0.0%) |
| 45 to 54 Years | 609 (94.0%) | 39 (6.0%) |
| 55 to 64 Years | 301 (92.9%) | 23 (7.1%) |
| 65 to 74 Years | 454 (100.0%) | 0 (0.0%) |
| 75 Years and older | 281 (100.0%) | 0 (0.0%) |
| Total | 4,109 (94.2%) | 254 (5.8%) |
Health Insurance Coverage by Citizenship Status in Lebanon
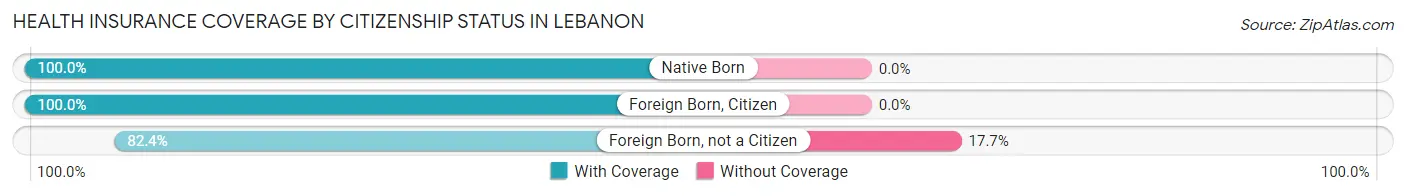
| Citizenship Status | With Coverage | Without Coverage |
| Native Born | 84 (100.0%) | 0 (0.0%) |
| Foreign Born, Citizen | 533 (100.0%) | 0 (0.0%) |
| Foreign Born, not a Citizen | 849 (82.4%) | 182 (17.6%) |
Health Insurance Coverage by Household Income in Lebanon
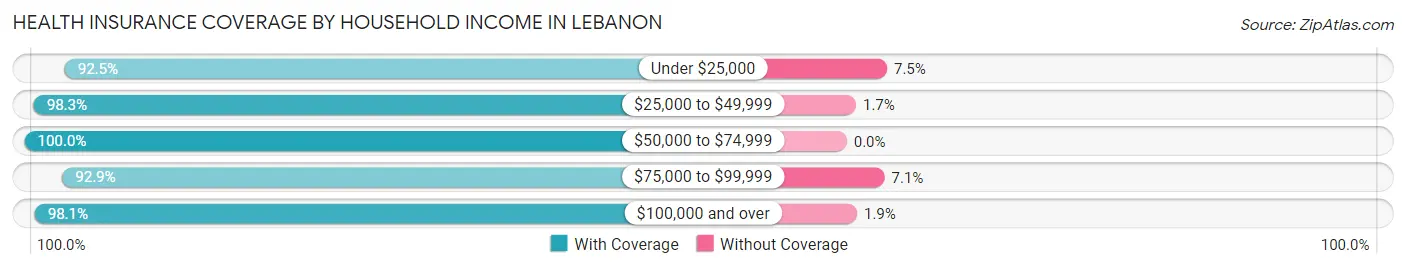
| Household Income | With Coverage | Without Coverage |
| Under $25,000 | 282 (92.5%) | 23 (7.5%) |
| $25,000 to $49,999 | 569 (98.3%) | 10 (1.7%) |
| $50,000 to $74,999 | 389 (100.0%) | 0 (0.0%) |
| $75,000 to $99,999 | 998 (92.9%) | 76 (7.1%) |
| $100,000 and over | 1,582 (98.1%) | 31 (1.9%) |
Public vs Private Health Insurance Coverage by Age in Lebanon
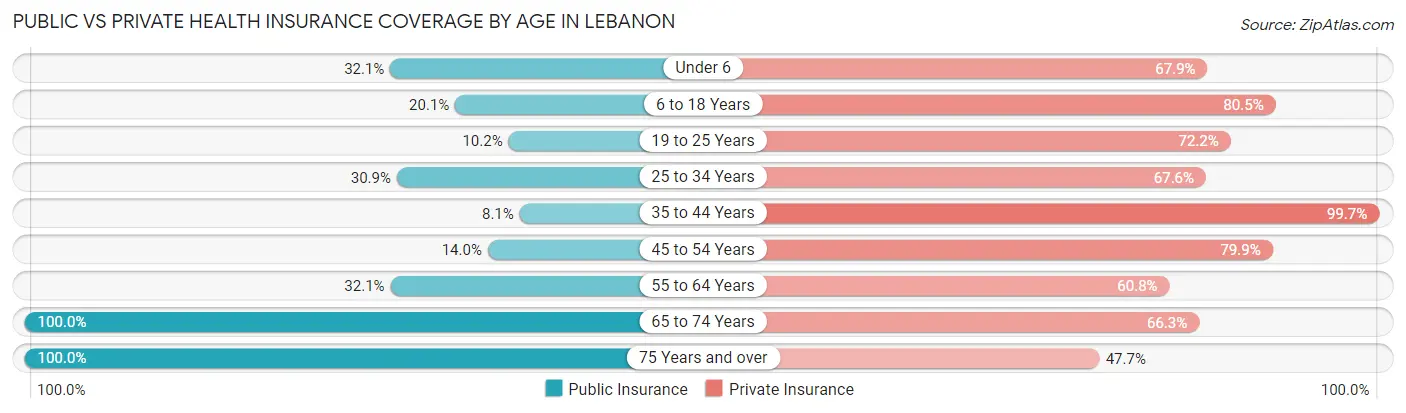
| Age Bracket | Public Insurance | Private Insurance |
| Under 6 | 27 (32.1%) | 57 (67.9%) |
| 6 to 18 Years | 107 (20.1%) | 429 (80.5%) |
| 19 to 25 Years | 105 (10.2%) | 744 (72.2%) |
| 25 to 34 Years | 205 (30.9%) | 448 (67.6%) |
| 35 to 44 Years | 28 (8.1%) | 344 (99.7%) |
| 45 to 54 Years | 91 (14.0%) | 518 (79.9%) |
| 55 to 64 Years | 104 (32.1%) | 197 (60.8%) |
| 65 to 74 Years | 454 (100.0%) | 301 (66.3%) |
| 75 Years and over | 281 (100.0%) | 134 (47.7%) |
| Total | 1,402 (32.1%) | 3,172 (72.7%) |
Disability Status by Sex by Age in Lebanon
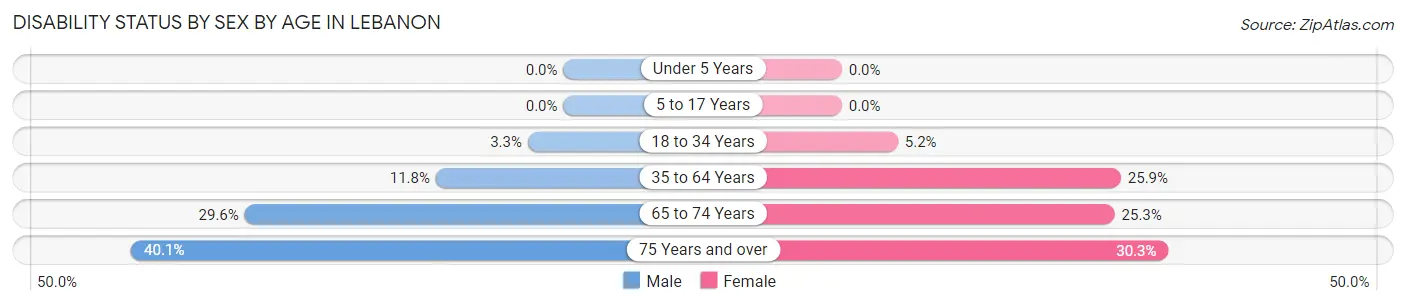
| Age Bracket | Male | Female |
| Under 5 Years | 0 (0.0%) | 0 (0.0%) |
| 5 to 17 Years | 0 (0.0%) | 0 (0.0%) |
| 18 to 34 Years | 27 (3.3%) | 47 (5.2%) |
| 35 to 64 Years | 70 (11.8%) | 188 (25.9%) |
| 65 to 74 Years | 42 (29.6%) | 79 (25.3%) |
| 75 Years and over | 73 (40.1%) | 30 (30.3%) |
Disability Class by Sex by Age in Lebanon
Disability Class: Hearing Difficulty
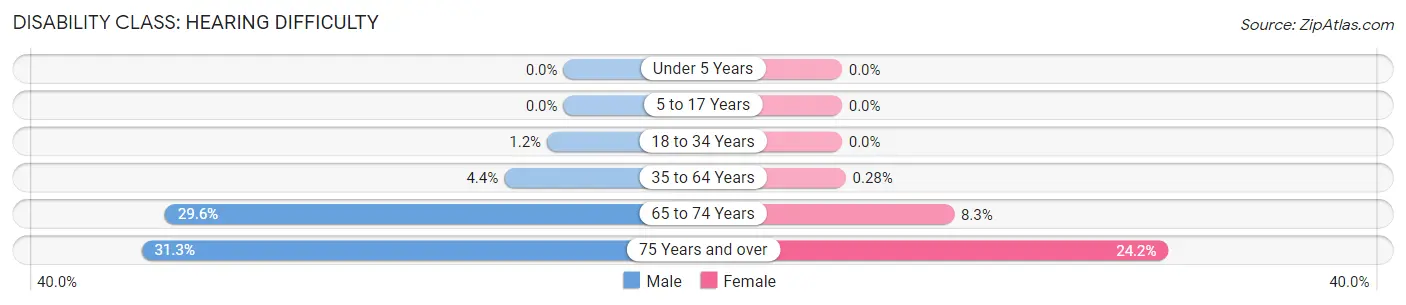
| Age Bracket | Male | Female |
| Under 5 Years | 0 (0.0%) | 0 (0.0%) |
| 5 to 17 Years | 0 (0.0%) | 0 (0.0%) |
| 18 to 34 Years | 10 (1.2%) | 0 (0.0%) |
| 35 to 64 Years | 26 (4.4%) | 2 (0.3%) |
| 65 to 74 Years | 42 (29.6%) | 26 (8.3%) |
| 75 Years and over | 57 (31.3%) | 24 (24.2%) |
Disability Class: Vision Difficulty
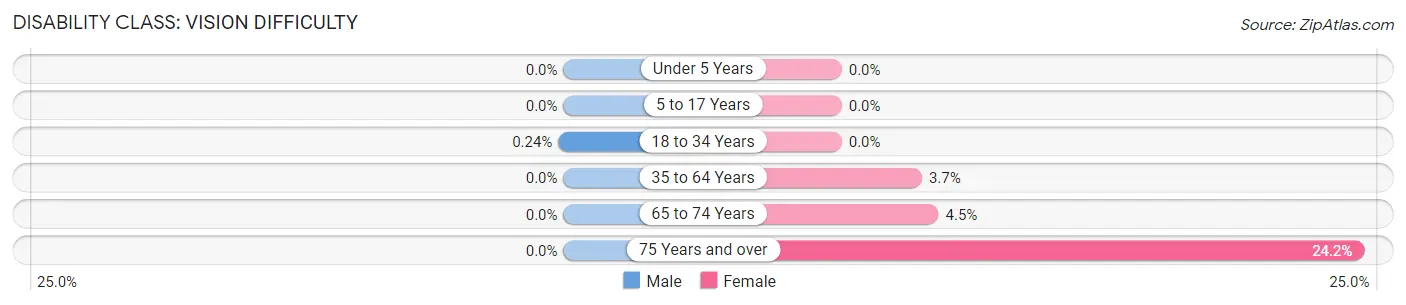
| Age Bracket | Male | Female |
| Under 5 Years | 0 (0.0%) | 0 (0.0%) |
| 5 to 17 Years | 0 (0.0%) | 0 (0.0%) |
| 18 to 34 Years | 2 (0.2%) | 0 (0.0%) |
| 35 to 64 Years | 0 (0.0%) | 27 (3.7%) |
| 65 to 74 Years | 0 (0.0%) | 14 (4.5%) |
| 75 Years and over | 0 (0.0%) | 24 (24.2%) |
Disability Class: Cognitive Difficulty
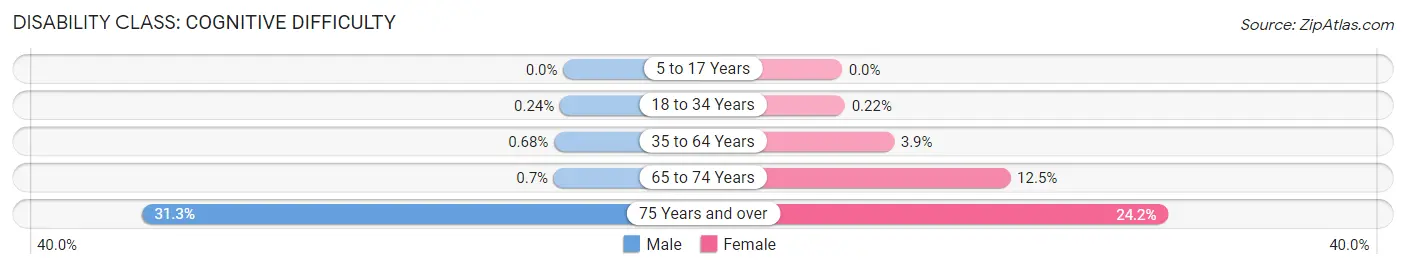
| Age Bracket | Male | Female |
| 5 to 17 Years | 0 (0.0%) | 0 (0.0%) |
| 18 to 34 Years | 2 (0.2%) | 2 (0.2%) |
| 35 to 64 Years | 4 (0.7%) | 28 (3.9%) |
| 65 to 74 Years | 1 (0.7%) | 39 (12.5%) |
| 75 Years and over | 57 (31.3%) | 24 (24.2%) |
Disability Class: Ambulatory Difficulty
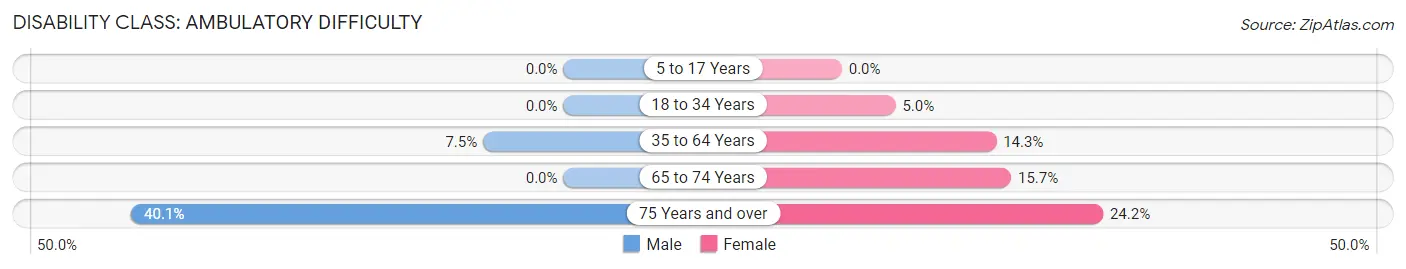
| Age Bracket | Male | Female |
| 5 to 17 Years | 0 (0.0%) | 0 (0.0%) |
| 18 to 34 Years | 0 (0.0%) | 45 (5.0%) |
| 35 to 64 Years | 44 (7.4%) | 104 (14.3%) |
| 65 to 74 Years | 0 (0.0%) | 49 (15.7%) |
| 75 Years and over | 73 (40.1%) | 24 (24.2%) |
Disability Class: Self-Care Difficulty
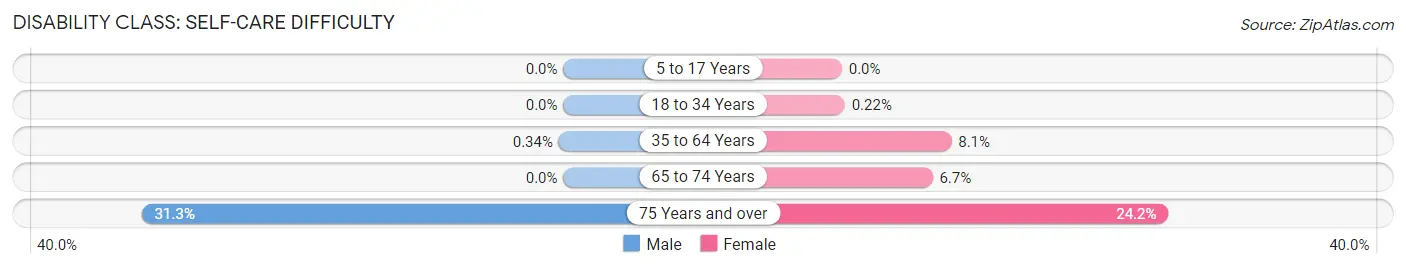
| Age Bracket | Male | Female |
| 5 to 17 Years | 0 (0.0%) | 0 (0.0%) |
| 18 to 34 Years | 0 (0.0%) | 2 (0.2%) |
| 35 to 64 Years | 2 (0.3%) | 59 (8.1%) |
| 65 to 74 Years | 0 (0.0%) | 21 (6.7%) |
| 75 Years and over | 57 (31.3%) | 24 (24.2%) |
Technology Access in Lebanon
Computing Device Access in Lebanon
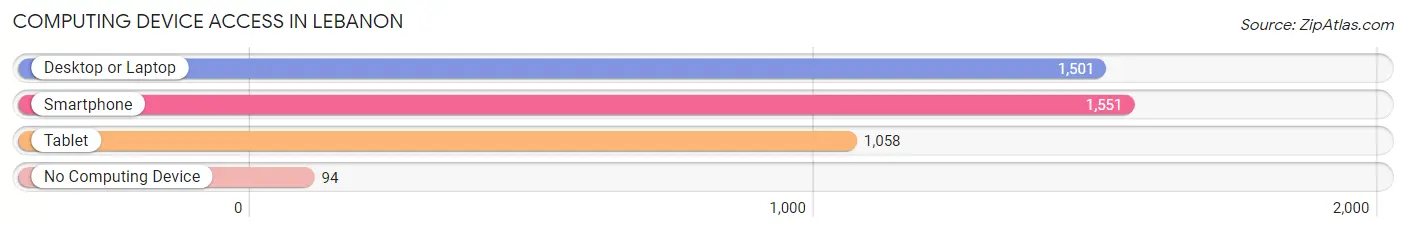
| Device Type | # Households | % Households |
| Desktop or Laptop | 1,501 | 86.9% |
| Smartphone | 1,551 | 89.8% |
| Tablet | 1,058 | 61.2% |
| No Computing Device | 94 | 5.4% |
| Total | 1,728 | 100.0% |
Internet Access in Lebanon
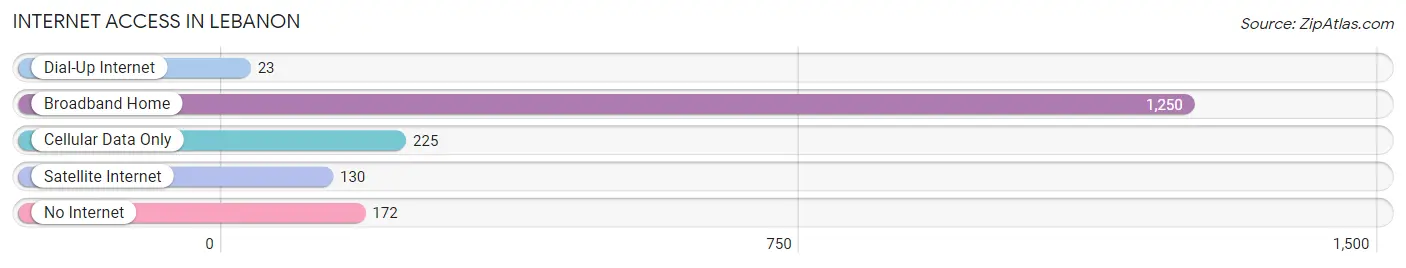
| Internet Type | # Households | % Households |
| Dial-Up Internet | 23 | 1.3% |
| Broadband Home | 1,250 | 72.3% |
| Cellular Data Only | 225 | 13.0% |
| Satellite Internet | 130 | 7.5% |
| No Internet | 172 | 10.0% |
| Total | 1,728 | 100.0% |
Lebanon Summary
Lebanon, Illinois is a small city located in St. Clair County, Illinois, United States. It is situated on the banks of the Kaskaskia River, approximately 25 miles east of St. Louis, Missouri. The city has a population of approximately 8,000 people and is the county seat of St. Clair County.
History
Lebanon was founded in 1814 by a group of settlers from Kentucky and Tennessee. The city was named after the biblical city of Lebanon, which is located in present-day Lebanon. The settlers chose the name because of the abundance of cedar trees in the area, which reminded them of the cedars of Lebanon.
The city was incorporated in 1819 and quickly became a center of commerce and industry. The first post office was established in 1820 and the first newspaper, the Lebanon Gazette, was published in 1821. The city was also home to the first bank in St. Clair County, which opened in 1822.
In the late 19th century, Lebanon was a major center for the production of bricks and tile. The city was also home to several factories, including a flour mill, a sawmill, a furniture factory, and a canning factory.
Geography
Lebanon is located in the southwestern corner of St. Clair County, Illinois. It is situated on the banks of the Kaskaskia River, approximately 25 miles east of St. Louis, Missouri. The city has a total area of 4.2 square miles, all of which is land.
The city is located in the Central Till Plains region of the Midwest. The climate is characterized by hot, humid summers and cold, dry winters. The average annual temperature is 54°F and the average annual precipitation is 40 inches.
Economy
Lebanon’s economy is largely based on agriculture and manufacturing. The city is home to several factories, including a flour mill, a sawmill, a furniture factory, and a canning factory. The city is also home to several retail stores, restaurants, and other businesses.
The city is also home to several educational institutions, including McKendree University, a private liberal arts college, and Southwestern Illinois College, a public two-year college.
Demographics
As of the 2010 census, the population of Lebanon was 8,000. The racial makeup of the city was 87.3% White, 8.2% African American, 0.7% Native American, 0.7% Asian, 0.1% Pacific Islander, and 2.1% from other races. Hispanic or Latino of any race were 2.7% of the population.
The median income for a household in the city was $41,250 and the median income for a family was $50,000. The per capita income for the city was $20,845. About 11.2% of families and 14.2% of the population were below the poverty line, including 19.2% of those under age 18 and 8.2% of those age 65 or over.
Lebanon is a small city with a rich history and a diverse economy. The city is home to several factories, educational institutions, and other businesses. The city has a population of approximately 8,000 people and is the county seat of St. Clair County.
Common Questions
What is Per Capita Income in Lebanon?
Per Capita income in Lebanon is $34,375.
What is the Median Family Income in Lebanon?
Median Family Income in Lebanon is $92,002.
What is the Median Household income in Lebanon?
Median Household Income in Lebanon is $86,548.
What is Income or Wage Gap in Lebanon?
Income or Wage Gap in Lebanon is 14.3%.
Women in Lebanon earn 85.7 cents for every dollar earned by a man.
What is Inequality or Gini Index in Lebanon?
Inequality or Gini Index in Lebanon is 0.36.
What is the Total Population of Lebanon?
Total Population of Lebanon is 4,683.
What is the Total Male Population of Lebanon?
Total Male Population of Lebanon is 2,136.
What is the Total Female Population of Lebanon?
Total Female Population of Lebanon is 2,547.
What is the Ratio of Males per 100 Females in Lebanon?
There are 83.86 Males per 100 Females in Lebanon.
What is the Ratio of Females per 100 Males in Lebanon?
There are 119.24 Females per 100 Males in Lebanon.
What is the Median Population Age in Lebanon?
Median Population Age in Lebanon is 32.7 Years.
What is the Average Family Size in Lebanon
Average Family Size in Lebanon is 2.8 People.
What is the Average Household Size in Lebanon
Average Household Size in Lebanon is 2.4 People.
How Large is the Labor Force in Lebanon?
There are 2,596 People in the Labor Forcein in Lebanon.
What is the Percentage of People in the Labor Force in Lebanon?
61.5% of People are in the Labor Force in Lebanon.
What is the Unemployment Rate in Lebanon?
Unemployment Rate in Lebanon is 1.2%.