Riverwoods, IL Map & Demographics
Riverwoods Map
Riverwoods Overview
$109,852
PER CAPITA INCOME
$250,001
AVG FAMILY INCOME
$233,036
AVG HOUSEHOLD INCOME
58.5%
WAGE / INCOME GAP [ % ]
41.5¢/ $1
WAGE / INCOME GAP [ $ ]
0.43
INEQUALITY / GINI INDEX
4,007
TOTAL POPULATION
2,082
MALE POPULATION
1,925
FEMALE POPULATION
108.16
MALES / 100 FEMALES
92.46
FEMALES / 100 MALES
51.2
MEDIAN AGE
3.1
AVG FAMILY SIZE
2.9
AVG HOUSEHOLD SIZE
1,798
LABOR FORCE [ PEOPLE ]
56.1%
PERCENT IN LABOR FORCE
1.2%
UNEMPLOYMENT RATE
Income in Riverwoods
Income Overview in Riverwoods
Per Capita Income in Riverwoods is $109,852, while median incomes of families and households are $250,001 and $233,036 respectively.
| Characteristic | Number | Measure |
| Per Capita Income | 4,007 | $109,852 |
| Median Family Income | 1,097 | $250,001 |
| Mean Family Income | 1,097 | $334,653 |
| Median Household Income | 1,339 | $233,036 |
| Mean Household Income | 1,339 | $315,881 |
| Income Deficit | 1,097 | $0 |
| Wage / Income Gap (%) | 4,007 | 58.45% |
| Wage / Income Gap ($) | 4,007 | 41.55¢ per $1 |
| Gini / Inequality Index | 4,007 | 0.43 |
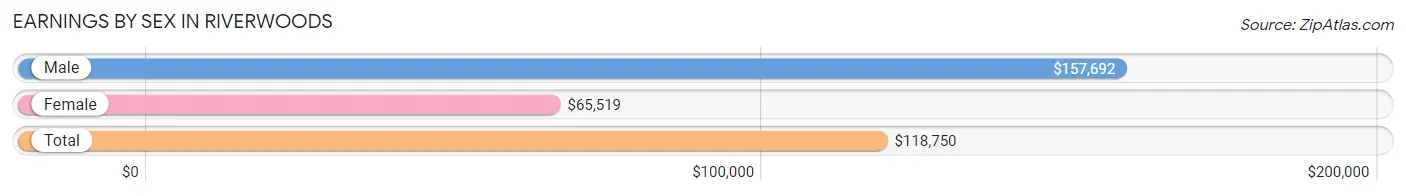
Earnings by Sex in Riverwoods
Average Earnings in Riverwoods are $118,750, $157,692 for men and $65,519 for women, a difference of 58.5%.
| Sex | Number | Average Earnings |
| Male | 1,186 (60.0%) | $157,692 |
| Female | 790 (40.0%) | $65,519 |
| Total | 1,976 (100.0%) | $118,750 |
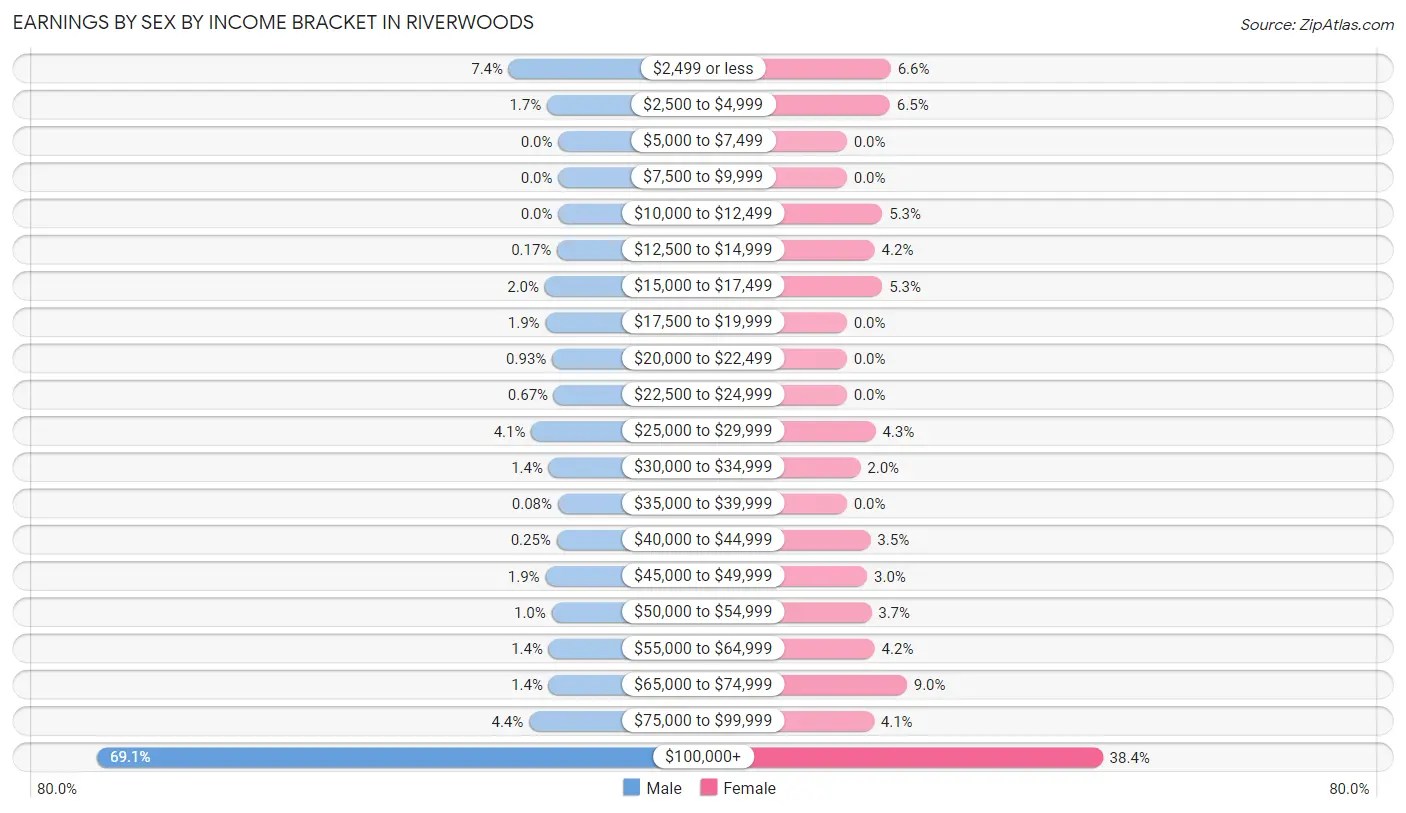
Earnings by Sex by Income Bracket in Riverwoods
The most common earnings brackets in Riverwoods are $100,000+ for men (820 | 69.1%) and $100,000+ for women (303 | 38.4%).
| Income | Male | Female |
| $2,499 or less | 88 (7.4%) | 52 (6.6%) |
| $2,500 to $4,999 | 20 (1.7%) | 51 (6.5%) |
| $5,000 to $7,499 | 0 (0.0%) | 0 (0.0%) |
| $7,500 to $9,999 | 0 (0.0%) | 0 (0.0%) |
| $10,000 to $12,499 | 0 (0.0%) | 42 (5.3%) |
| $12,500 to $14,999 | 2 (0.2%) | 33 (4.2%) |
| $15,000 to $17,499 | 24 (2.0%) | 42 (5.3%) |
| $17,500 to $19,999 | 23 (1.9%) | 0 (0.0%) |
| $20,000 to $22,499 | 11 (0.9%) | 0 (0.0%) |
| $22,500 to $24,999 | 8 (0.7%) | 0 (0.0%) |
| $25,000 to $29,999 | 48 (4.1%) | 34 (4.3%) |
| $30,000 to $34,999 | 17 (1.4%) | 16 (2.0%) |
| $35,000 to $39,999 | 1 (0.1%) | 0 (0.0%) |
| $40,000 to $44,999 | 3 (0.3%) | 28 (3.5%) |
| $45,000 to $49,999 | 23 (1.9%) | 24 (3.0%) |
| $50,000 to $54,999 | 12 (1.0%) | 29 (3.7%) |
| $55,000 to $64,999 | 17 (1.4%) | 33 (4.2%) |
| $65,000 to $74,999 | 17 (1.4%) | 71 (9.0%) |
| $75,000 to $99,999 | 52 (4.4%) | 32 (4.1%) |
| $100,000+ | 820 (69.1%) | 303 (38.4%) |
| Total | 1,186 (100.0%) | 790 (100.0%) |
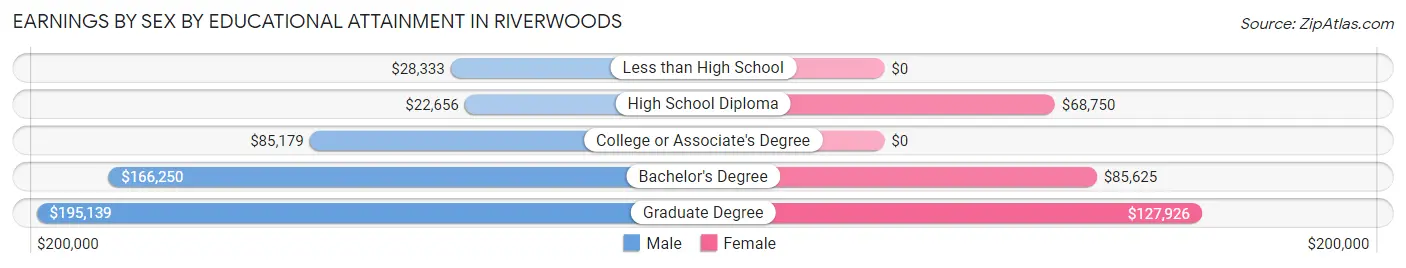
Earnings by Sex by Educational Attainment in Riverwoods
| Educational Attainment | Male Income | Female Income |
| Less than High School | $28,333 | $0 |
| High School Diploma | $22,656 | $68,750 |
| College or Associate's Degree | $85,179 | $0 |
| Bachelor's Degree | $166,250 | $85,625 |
| Graduate Degree | $195,139 | $127,926 |
| Total | $159,279 | $0 |
Family Income in Riverwoods
Family Income Brackets in Riverwoods
According to the Riverwoods family income data, there are 675 families falling into the $200,000+ income range, which is the most common income bracket and makes up 61.5% of all families.
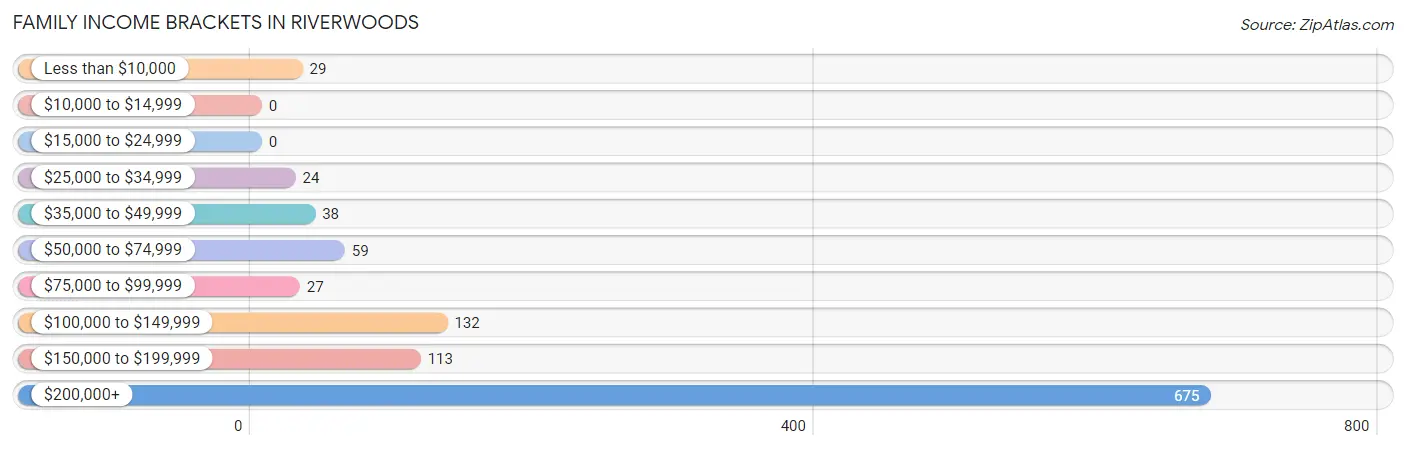
| Income Bracket | # Families | % Families |
| Less than $10,000 | 29 | 2.6% |
| $10,000 to $14,999 | 0 | 0.0% |
| $15,000 to $24,999 | 0 | 0.0% |
| $25,000 to $34,999 | 24 | 2.2% |
| $35,000 to $49,999 | 38 | 3.5% |
| $50,000 to $74,999 | 59 | 5.4% |
| $75,000 to $99,999 | 27 | 2.5% |
| $100,000 to $149,999 | 132 | 12.0% |
| $150,000 to $199,999 | 113 | 10.3% |
| $200,000+ | 675 | 61.5% |
Family Income by Famaliy Size in Riverwoods
3-person families (231 | 21.1%) account for the highest median family income in Riverwoods with $250,001 per family, while 2-person families (515 | 46.9%) have the highest median income of $110,478 per family member.
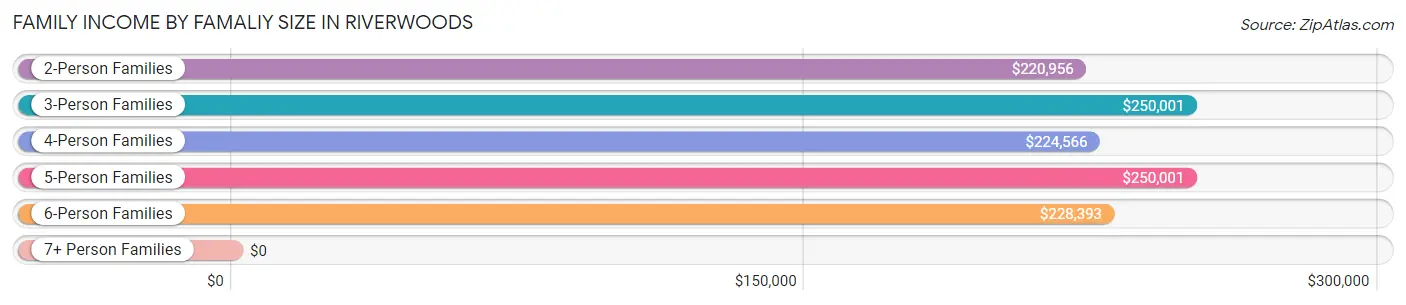
| Income Bracket | # Families | Median Income |
| 2-Person Families | 515 (46.9%) | $220,956 |
| 3-Person Families | 231 (21.1%) | $250,001 |
| 4-Person Families | 209 (19.1%) | $224,566 |
| 5-Person Families | 119 (10.8%) | $250,001 |
| 6-Person Families | 23 (2.1%) | $228,393 |
| 7+ Person Families | 0 (0.0%) | $0 |
| Total | 1,097 (100.0%) | $250,001 |
Family Income by Number of Earners in Riverwoods
The median family income in Riverwoods is $250,001, with families comprising 1 earner (463) having the highest median family income of $250,001, while families with no earners (138) have the lowest median family income of $117,917, accounting for 42.2% and 12.6% of families, respectively.
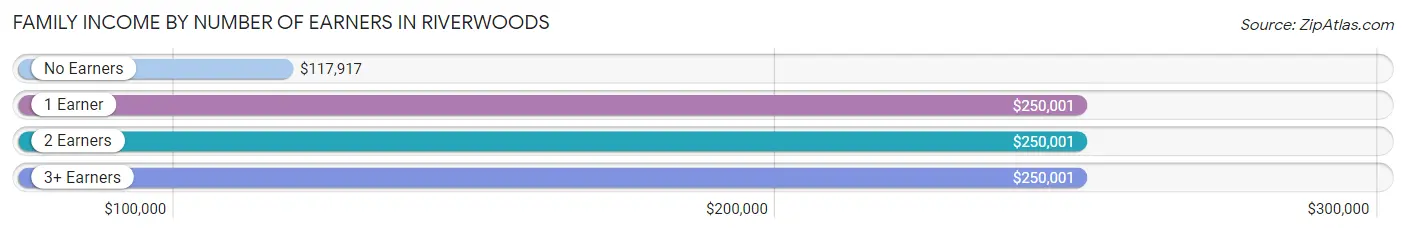
| Number of Earners | # Families | Median Income |
| No Earners | 138 (12.6%) | $117,917 |
| 1 Earner | 463 (42.2%) | $250,001 |
| 2 Earners | 394 (35.9%) | $250,001 |
| 3+ Earners | 102 (9.3%) | $250,001 |
| Total | 1,097 (100.0%) | $250,001 |
Household Income in Riverwoods
Household Income Brackets in Riverwoods
With 795 households falling in the category, the $200,000+ income range is the most frequent in Riverwoods, accounting for 59.4% of all households.
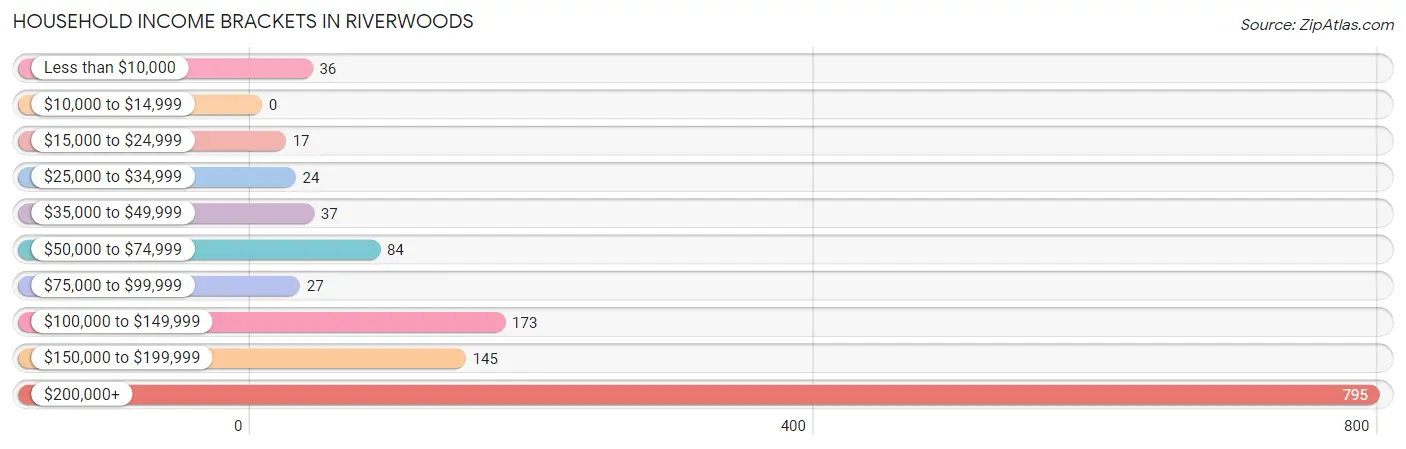
| Income Bracket | # Households | % Households |
| Less than $10,000 | 36 | 2.7% |
| $10,000 to $14,999 | 0 | 0.0% |
| $15,000 to $24,999 | 17 | 1.3% |
| $25,000 to $34,999 | 24 | 1.8% |
| $35,000 to $49,999 | 37 | 2.8% |
| $50,000 to $74,999 | 84 | 6.3% |
| $75,000 to $99,999 | 27 | 2.0% |
| $100,000 to $149,999 | 173 | 12.9% |
| $150,000 to $199,999 | 145 | 10.8% |
| $200,000+ | 795 | 59.4% |
Household Income by Householder Age in Riverwoods
The median household income in Riverwoods is $233,036, with the highest median household income of $250,001 found in the 25 to 44 years age bracket for the primary householder. A total of 256 households (19.1%) fall into this category.
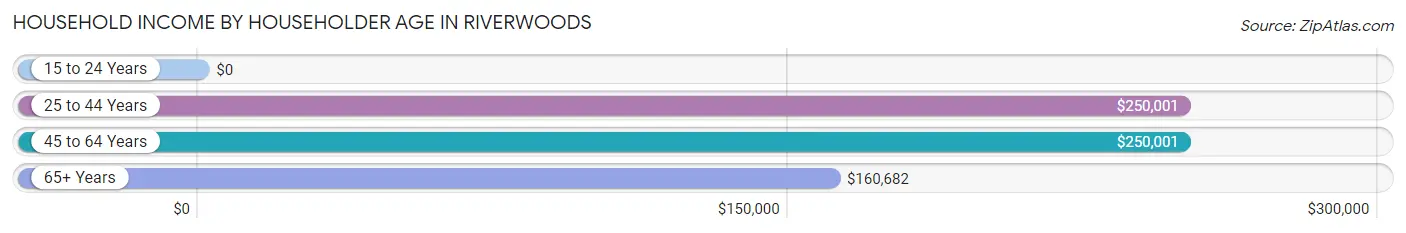
| Income Bracket | # Households | Median Income |
| 15 to 24 Years | 0 (0.0%) | $0 |
| 25 to 44 Years | 256 (19.1%) | $250,001 |
| 45 to 64 Years | 685 (51.2%) | $250,001 |
| 65+ Years | 398 (29.7%) | $160,682 |
| Total | 1,339 (100.0%) | $233,036 |
Poverty in Riverwoods
Income Below Poverty by Sex and Age in Riverwoods
With 2.9% poverty level for males and 2.7% for females among the residents of Riverwoods, 12 to 14 year old males and 75 year old and over females are the most vulnerable to poverty, with 10 males (20.8%) and 19 females (12.2%) in their respective age groups living below the poverty level.
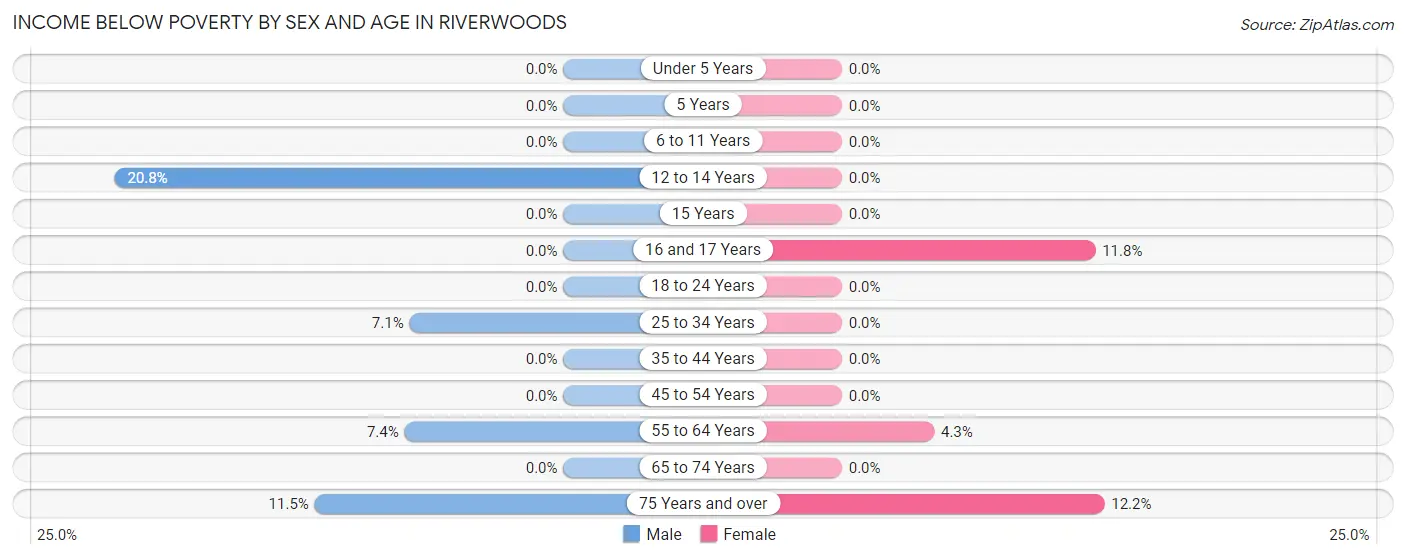
| Age Bracket | Male | Female |
| Under 5 Years | 0 (0.0%) | 0 (0.0%) |
| 5 Years | 0 (0.0%) | 0 (0.0%) |
| 6 to 11 Years | 0 (0.0%) | 0 (0.0%) |
| 12 to 14 Years | 10 (20.8%) | 0 (0.0%) |
| 15 Years | 0 (0.0%) | 0 (0.0%) |
| 16 and 17 Years | 0 (0.0%) | 12 (11.8%) |
| 18 to 24 Years | 0 (0.0%) | 0 (0.0%) |
| 25 to 34 Years | 2 (7.1%) | 0 (0.0%) |
| 35 to 44 Years | 0 (0.0%) | 0 (0.0%) |
| 45 to 54 Years | 0 (0.0%) | 0 (0.0%) |
| 55 to 64 Years | 30 (7.4%) | 18 (4.3%) |
| 65 to 74 Years | 0 (0.0%) | 0 (0.0%) |
| 75 Years and over | 18 (11.5%) | 19 (12.2%) |
| Total | 60 (2.9%) | 49 (2.7%) |
Income Above Poverty by Sex and Age in Riverwoods
According to the poverty statistics in Riverwoods, males aged under 5 years and females aged under 5 years are the age groups that are most secure financially, with 100.0% of males and 100.0% of females in these age groups living above the poverty line.
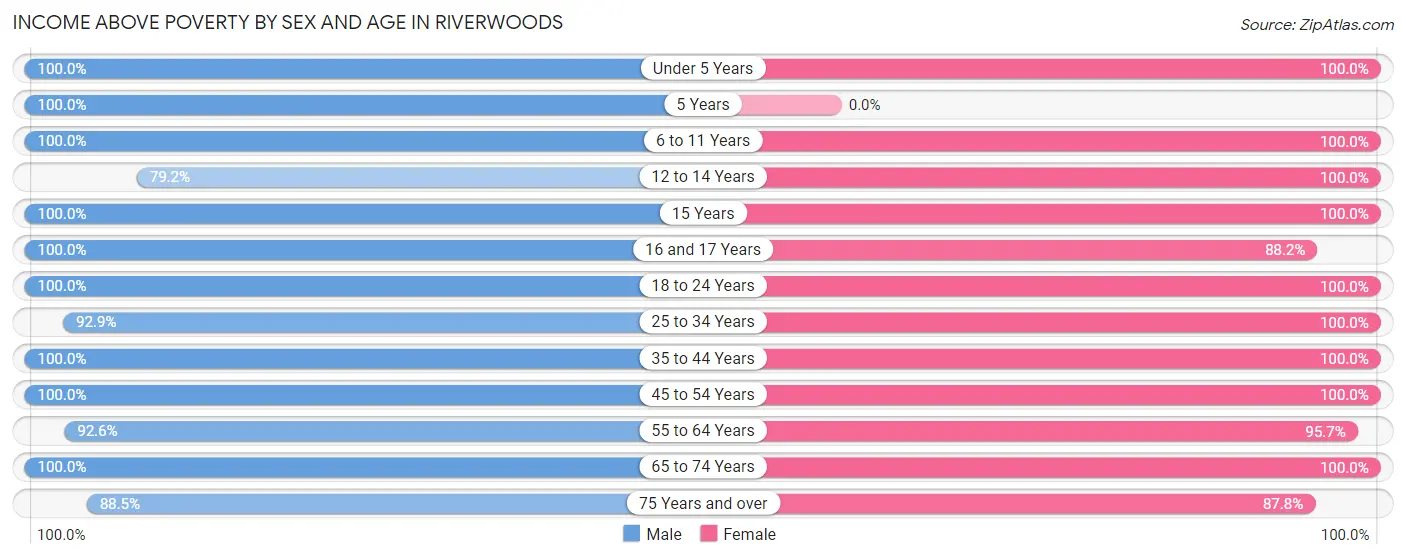
| Age Bracket | Male | Female |
| Under 5 Years | 167 (100.0%) | 22 (100.0%) |
| 5 Years | 12 (100.0%) | 0 (0.0%) |
| 6 to 11 Years | 266 (100.0%) | 138 (100.0%) |
| 12 to 14 Years | 38 (79.2%) | 55 (100.0%) |
| 15 Years | 14 (100.0%) | 54 (100.0%) |
| 16 and 17 Years | 45 (100.0%) | 90 (88.2%) |
| 18 to 24 Years | 138 (100.0%) | 98 (100.0%) |
| 25 to 34 Years | 26 (92.9%) | 54 (100.0%) |
| 35 to 44 Years | 252 (100.0%) | 244 (100.0%) |
| 45 to 54 Years | 226 (100.0%) | 226 (100.0%) |
| 55 to 64 Years | 377 (92.6%) | 403 (95.7%) |
| 65 to 74 Years | 281 (100.0%) | 233 (100.0%) |
| 75 Years and over | 138 (88.5%) | 137 (87.8%) |
| Total | 1,980 (97.1%) | 1,754 (97.3%) |
Income Below Poverty Among Married-Couple Families in Riverwoods
The poverty statistics for married-couple families in Riverwoods show that 2.7% or 29 of the total 1,074 families live below the poverty line. Families with 1 or 2 children have the highest poverty rate of 3.3%, comprising of 11 families. On the other hand, families with 3 or 4 children have the lowest poverty rate of 0.0%, which includes 0 families.
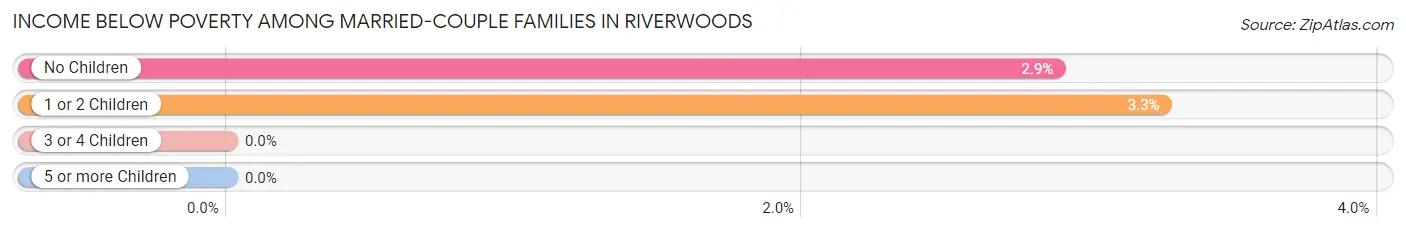
| Children | Above Poverty | Below Poverty |
| No Children | 608 (97.1%) | 18 (2.9%) |
| 1 or 2 Children | 327 (96.8%) | 11 (3.3%) |
| 3 or 4 Children | 110 (100.0%) | 0 (0.0%) |
| 5 or more Children | 0 (0.0%) | 0 (0.0%) |
| Total | 1,045 (97.3%) | 29 (2.7%) |
Income Below Poverty Among Single-Parent Households in Riverwoods
| Children | Single Father | Single Mother |
| No Children | 0 (0.0%) | 0 (0.0%) |
| 1 or 2 Children | 0 (0.0%) | 0 (0.0%) |
| 3 or 4 Children | 0 (0.0%) | 0 (0.0%) |
| 5 or more Children | 0 (0.0%) | 0 (0.0%) |
| Total | 0 (0.0%) | 0 (0.0%) |
Income Below Poverty Among Married-Couple vs Single-Parent Households in Riverwoods
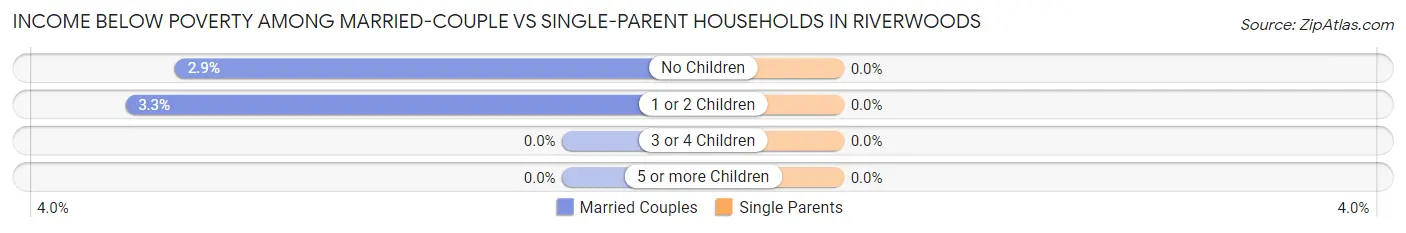
| Children | Married-Couple Families | Single-Parent Households |
| No Children | 18 (2.9%) | 0 (0.0%) |
| 1 or 2 Children | 11 (3.3%) | 0 (0.0%) |
| 3 or 4 Children | 0 (0.0%) | 0 (0.0%) |
| 5 or more Children | 0 (0.0%) | 0 (0.0%) |
| Total | 29 (2.7%) | 0 (0.0%) |
Race in Riverwoods
The most populous races in Riverwoods are White / Caucasian (3,615 | 90.2%), Asian (240 | 6.0%), and Hispanic or Latino (202 | 5.0%).
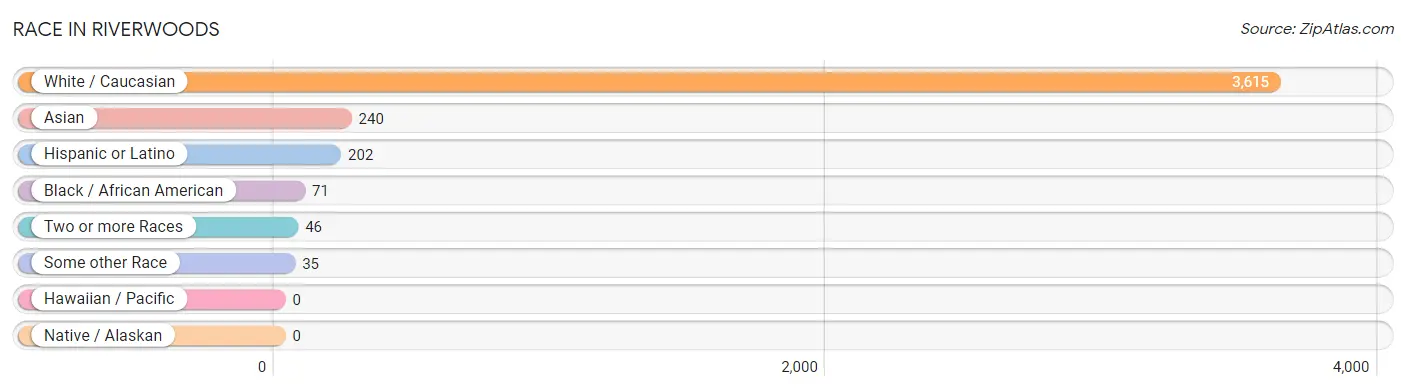
| Race | # Population | % Population |
| Asian | 240 | 6.0% |
| Black / African American | 71 | 1.8% |
| Hawaiian / Pacific | 0 | 0.0% |
| Hispanic or Latino | 202 | 5.0% |
| Native / Alaskan | 0 | 0.0% |
| White / Caucasian | 3,615 | 90.2% |
| Two or more Races | 46 | 1.1% |
| Some other Race | 35 | 0.9% |
| Total | 4,007 | 100.0% |
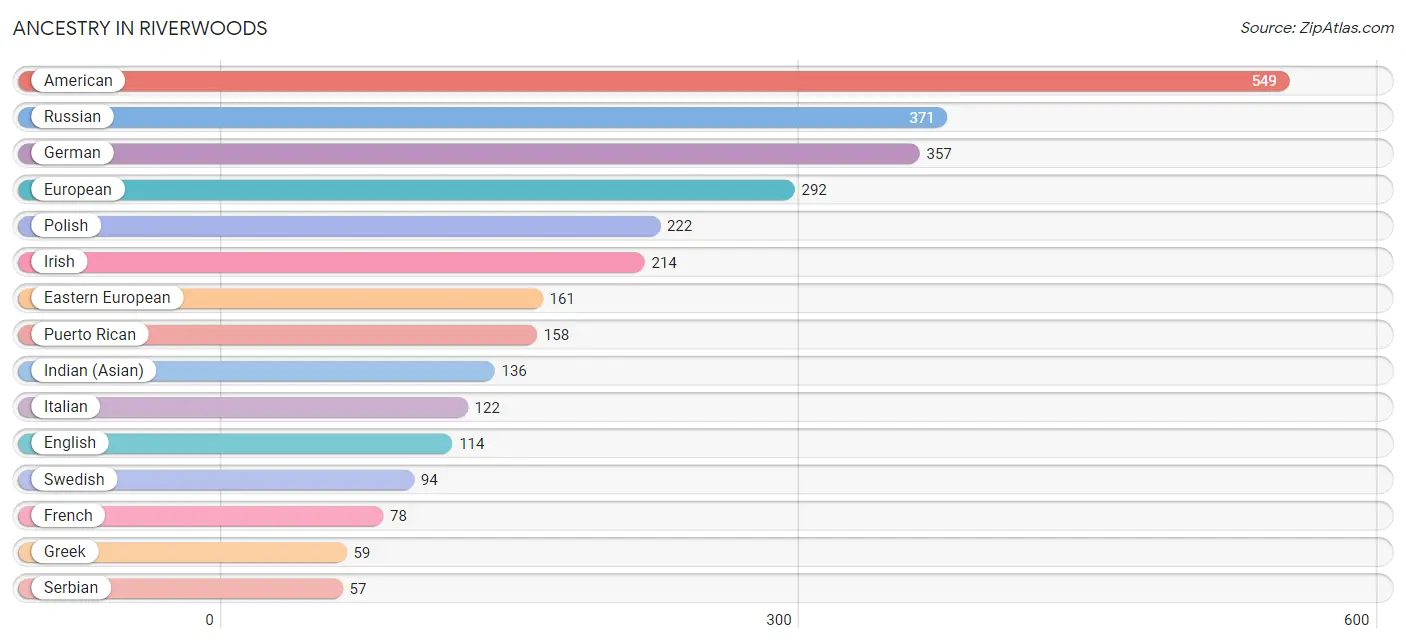
Ancestry in Riverwoods
The most populous ancestries reported in Riverwoods are American (549 | 13.7%), Russian (371 | 9.3%), German (357 | 8.9%), European (292 | 7.3%), and Polish (222 | 5.5%), together accounting for 44.7% of all Riverwoods residents.
| Ancestry | # Population | % Population |
| American | 549 | 13.7% |
| Armenian | 10 | 0.3% |
| Assyrian / Chaldean / Syriac | 4 | 0.1% |
| Austrian | 10 | 0.3% |
| Bhutanese | 23 | 0.6% |
| British | 35 | 0.9% |
| Bulgarian | 14 | 0.4% |
| Burmese | 32 | 0.8% |
| Central American | 2 | 0.1% |
| Cherokee | 3 | 0.1% |
| Czech | 24 | 0.6% |
| Eastern European | 161 | 4.0% |
| English | 114 | 2.9% |
| European | 292 | 7.3% |
| Finnish | 27 | 0.7% |
| French | 78 | 1.9% |
| German | 357 | 8.9% |
| Greek | 59 | 1.5% |
| Hungarian | 56 | 1.4% |
| Indian (Asian) | 136 | 3.4% |
| Irish | 214 | 5.3% |
| Israeli | 24 | 0.6% |
| Italian | 122 | 3.0% |
| Korean | 51 | 1.3% |
| Lithuanian | 10 | 0.3% |
| Mexican | 30 | 0.7% |
| Norwegian | 8 | 0.2% |
| Polish | 222 | 5.5% |
| Portuguese | 13 | 0.3% |
| Puerto Rican | 158 | 3.9% |
| Romanian | 18 | 0.4% |
| Russian | 371 | 9.3% |
| Salvadoran | 2 | 0.1% |
| Scandinavian | 5 | 0.1% |
| Scottish | 12 | 0.3% |
| Serbian | 57 | 1.4% |
| Spaniard | 6 | 0.2% |
| Swedish | 94 | 2.4% |
| Thai | 15 | 0.4% |
| Ukrainian | 25 | 0.6% | View All 40 Rows |
Immigrants in Riverwoods
The most numerous immigrant groups reported in Riverwoods came from Europe (196 | 4.9%), Asia (169 | 4.2%), Eastern Europe (152 | 3.8%), Eastern Asia (65 | 1.6%), and China (57 | 1.4%), together accounting for 15.9% of all Riverwoods residents.
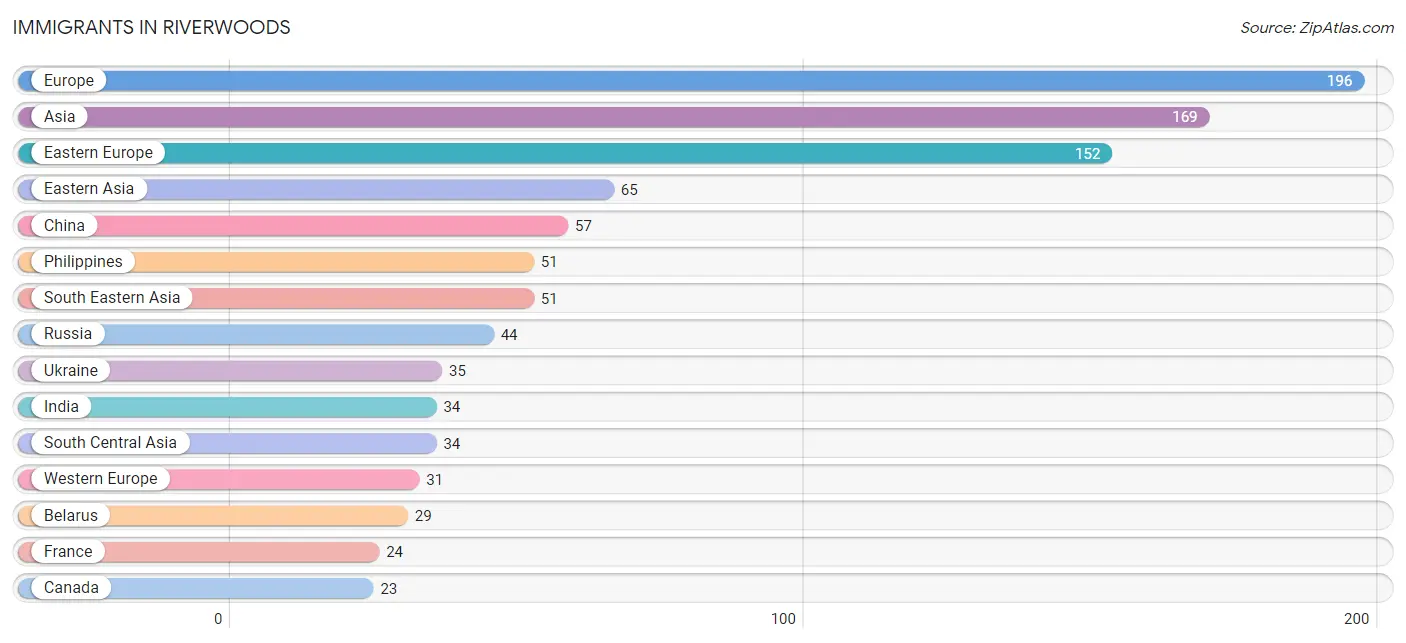
| Immigration Origin | # Population | % Population |
| Africa | 9 | 0.2% |
| Asia | 169 | 4.2% |
| Austria | 7 | 0.2% |
| Belarus | 29 | 0.7% |
| Canada | 23 | 0.6% |
| Central America | 8 | 0.2% |
| China | 57 | 1.4% |
| Eastern Asia | 65 | 1.6% |
| Eastern Europe | 152 | 3.8% |
| El Salvador | 2 | 0.1% |
| Europe | 196 | 4.9% |
| France | 24 | 0.6% |
| Greece | 13 | 0.3% |
| Hungary | 21 | 0.5% |
| India | 34 | 0.9% |
| Israel | 15 | 0.4% |
| Korea | 8 | 0.2% |
| Latin America | 8 | 0.2% |
| Mexico | 6 | 0.2% |
| Northern Africa | 9 | 0.2% |
| Philippines | 51 | 1.3% |
| Poland | 10 | 0.3% |
| Romania | 7 | 0.2% |
| Russia | 44 | 1.1% |
| Serbia | 3 | 0.1% |
| South Central Asia | 34 | 0.9% |
| South Eastern Asia | 51 | 1.3% |
| Southern Europe | 13 | 0.3% |
| Syria | 4 | 0.1% |
| Ukraine | 35 | 0.9% |
| Western Asia | 19 | 0.5% |
| Western Europe | 31 | 0.8% | View All 32 Rows |
Sex and Age in Riverwoods
Sex and Age in Riverwoods
The most populous age groups in Riverwoods are 55 to 59 Years (257 | 12.3%) for men and 60 to 64 Years (227 | 11.8%) for women.
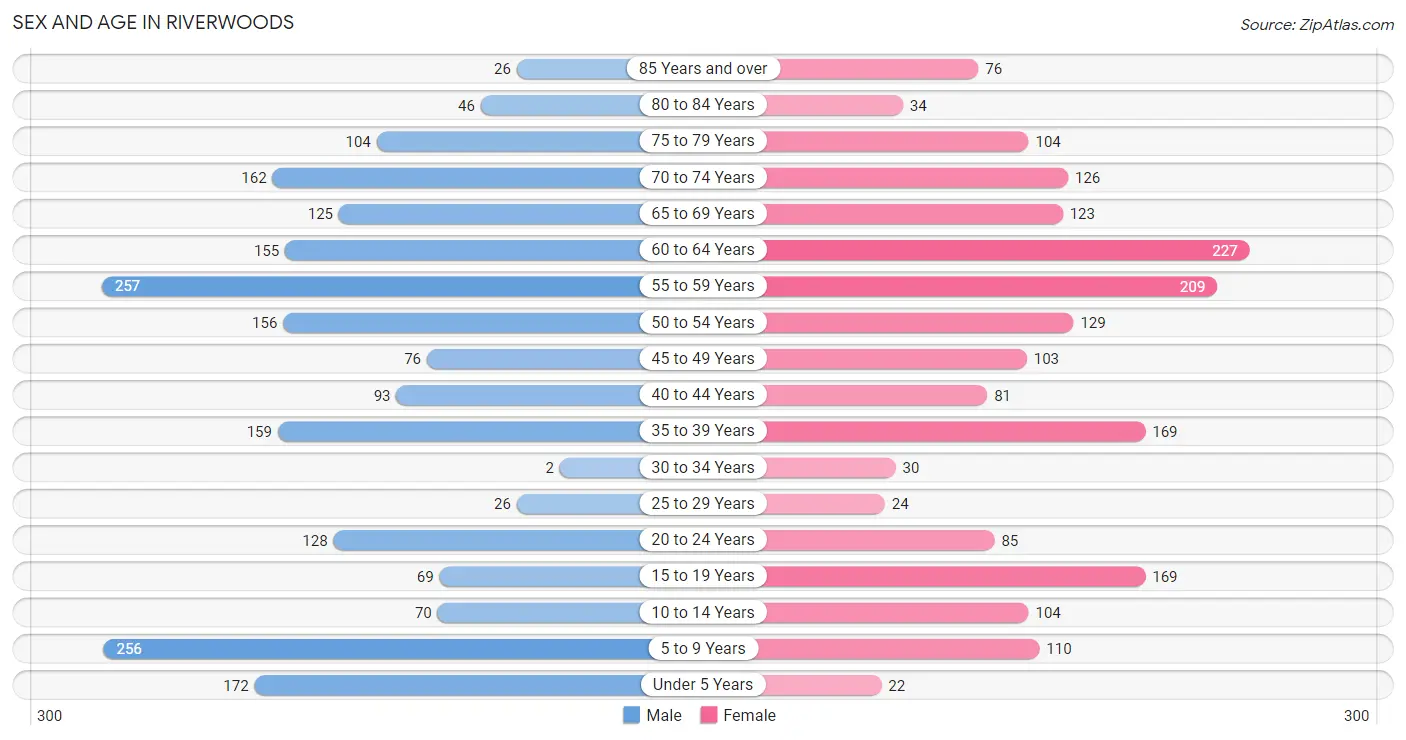
| Age Bracket | Male | Female |
| Under 5 Years | 172 (8.3%) | 22 (1.1%) |
| 5 to 9 Years | 256 (12.3%) | 110 (5.7%) |
| 10 to 14 Years | 70 (3.4%) | 104 (5.4%) |
| 15 to 19 Years | 69 (3.3%) | 169 (8.8%) |
| 20 to 24 Years | 128 (6.1%) | 85 (4.4%) |
| 25 to 29 Years | 26 (1.3%) | 24 (1.3%) |
| 30 to 34 Years | 2 (0.1%) | 30 (1.6%) |
| 35 to 39 Years | 159 (7.6%) | 169 (8.8%) |
| 40 to 44 Years | 93 (4.5%) | 81 (4.2%) |
| 45 to 49 Years | 76 (3.6%) | 103 (5.3%) |
| 50 to 54 Years | 156 (7.5%) | 129 (6.7%) |
| 55 to 59 Years | 257 (12.3%) | 209 (10.9%) |
| 60 to 64 Years | 155 (7.4%) | 227 (11.8%) |
| 65 to 69 Years | 125 (6.0%) | 123 (6.4%) |
| 70 to 74 Years | 162 (7.8%) | 126 (6.6%) |
| 75 to 79 Years | 104 (5.0%) | 104 (5.4%) |
| 80 to 84 Years | 46 (2.2%) | 34 (1.8%) |
| 85 Years and over | 26 (1.3%) | 76 (4.0%) |
| Total | 2,082 (100.0%) | 1,925 (100.0%) |
Families and Households in Riverwoods
Median Family Size in Riverwoods
The median family size in Riverwoods is 3.15 persons per family, with single female/mother families (16 | 1.5%) accounting for the largest median family size of 3.5 persons per family. On the other hand, single male/father families (7 | 0.6%) represent the smallest median family size with 2.71 persons per family.
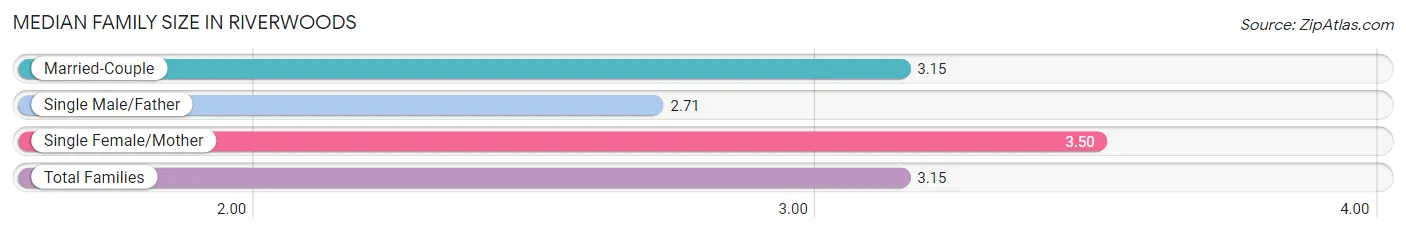
| Family Type | # Families | Family Size |
| Married-Couple | 1,074 (97.9%) | 3.15 |
| Single Male/Father | 7 (0.6%) | 2.71 |
| Single Female/Mother | 16 (1.5%) | 3.50 |
| Total Families | 1,097 (100.0%) | 3.15 |
Median Household Size in Riverwoods
The median household size in Riverwoods is 2.88 persons per household, with single female/mother households (16 | 1.2%) accounting for the largest median household size of 3.5 persons per household. non-family households (242 | 18.1%) represent the smallest median household size with 1.65 persons per household.
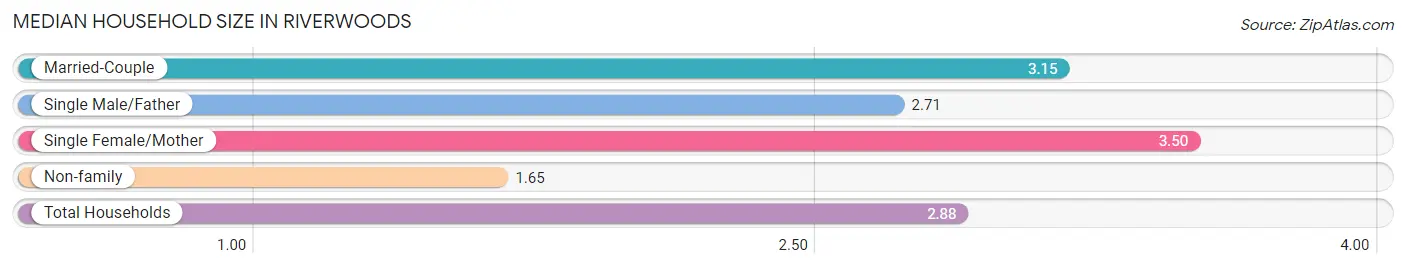
| Household Type | # Households | Household Size |
| Married-Couple | 1,074 (80.2%) | 3.15 |
| Single Male/Father | 7 (0.5%) | 2.71 |
| Single Female/Mother | 16 (1.2%) | 3.50 |
| Non-family | 242 (18.1%) | 1.65 |
| Total Households | 1,339 (100.0%) | 2.88 |
Household Size by Marriage Status in Riverwoods
Out of a total of 1,339 households in Riverwoods, 1,097 (81.9%) are family households, while 242 (18.1%) are nonfamily households. The most numerous type of family households are 2-person households, comprising 515, and the most common type of nonfamily households are 2-person households, comprising 116.
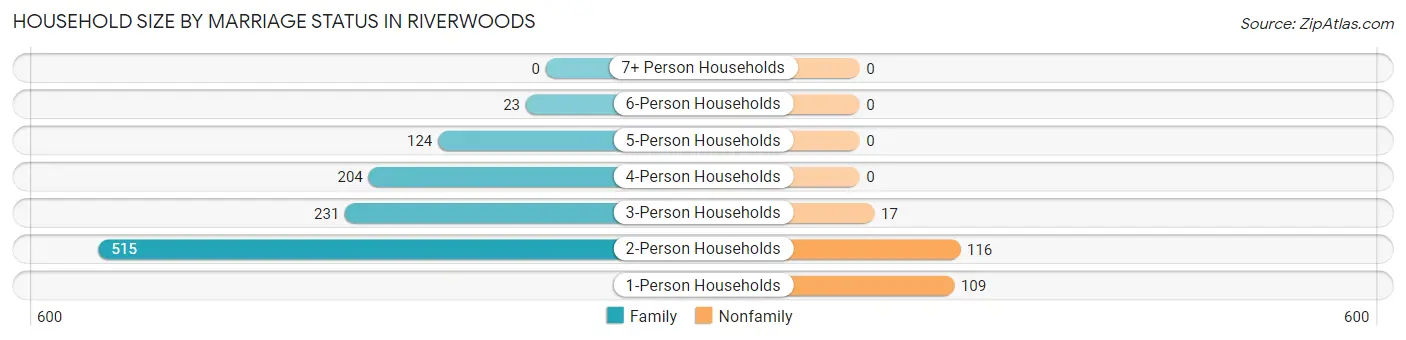
| Household Size | Family Households | Nonfamily Households |
| 1-Person Households | - | 109 (8.1%) |
| 2-Person Households | 515 (38.5%) | 116 (8.7%) |
| 3-Person Households | 231 (17.2%) | 17 (1.3%) |
| 4-Person Households | 204 (15.2%) | 0 (0.0%) |
| 5-Person Households | 124 (9.3%) | 0 (0.0%) |
| 6-Person Households | 23 (1.7%) | 0 (0.0%) |
| 7+ Person Households | 0 (0.0%) | 0 (0.0%) |
| Total | 1,097 (81.9%) | 242 (18.1%) |
Female Fertility in Riverwoods
Fertility by Age in Riverwoods
Average fertility rate in Riverwoods is 10.0 births per 1,000 women. Women in the age bracket of 35 to 50 years have the highest fertility rate with 19.0 births per 1,000 women. Women in the age bracket of 35 to 50 years acount for 100.0% of all women with births.
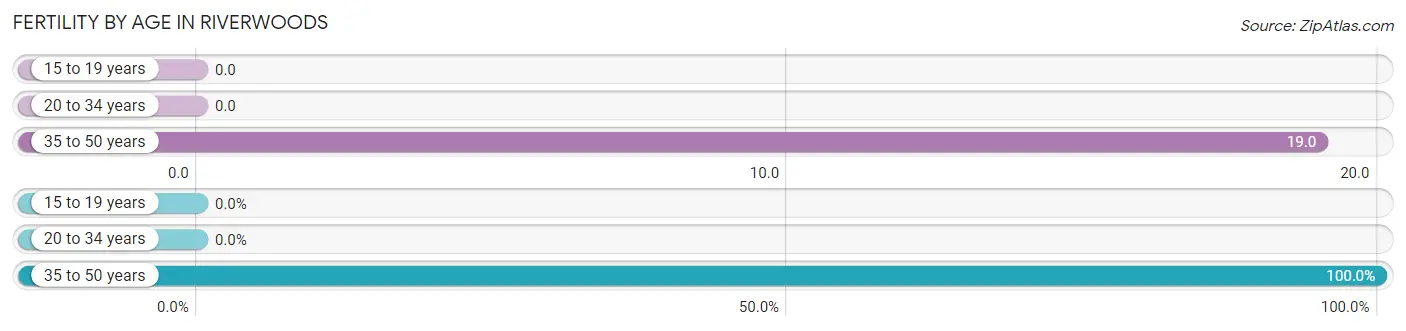
| Age Bracket | Women with Births | Births / 1,000 Women |
| 15 to 19 years | 0 (0.0%) | 0.0 |
| 20 to 34 years | 0 (0.0%) | 0.0 |
| 35 to 50 years | 7 (100.0%) | 19.0 |
| Total | 7 (100.0%) | 10.0 |
Fertility by Age by Marriage Status in Riverwoods
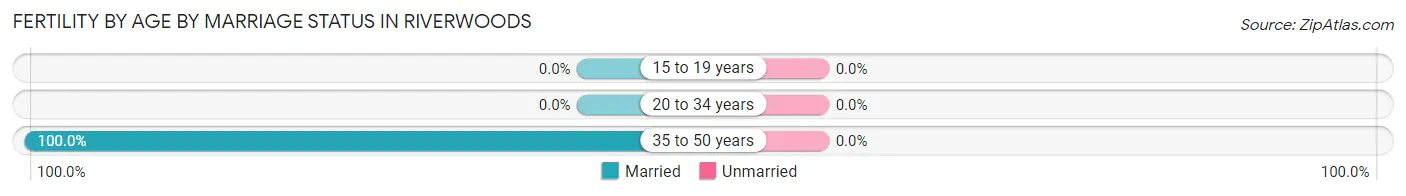
| Age Bracket | Married | Unmarried |
| 15 to 19 years | 0 (0.0%) | 0 (0.0%) |
| 20 to 34 years | 0 (0.0%) | 0 (0.0%) |
| 35 to 50 years | 7 (100.0%) | 0 (0.0%) |
| Total | 7 (100.0%) | 0 (0.0%) |
Fertility by Education in Riverwoods
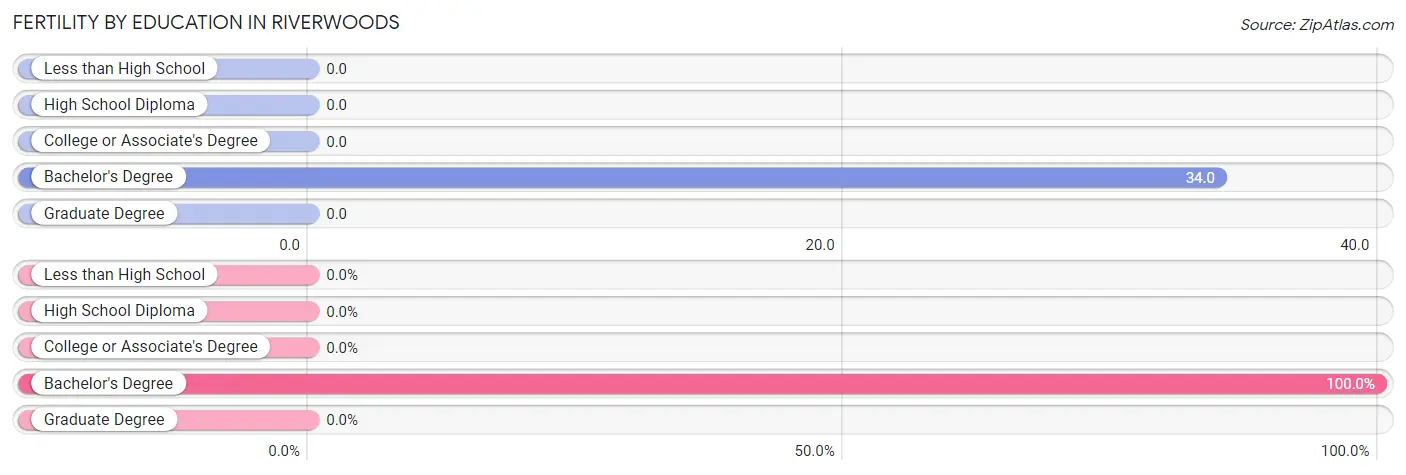
| Educational Attainment | Women with Births | Births / 1,000 Women |
| Less than High School | 0 (0.0%) | 0.0 |
| High School Diploma | 0 (0.0%) | 0.0 |
| College or Associate's Degree | 0 (0.0%) | 0.0 |
| Bachelor's Degree | 7 (100.0%) | 34.0 |
| Graduate Degree | 0 (0.0%) | 0.0 |
| Total | 7 (100.0%) | 10.0 |
Fertility by Education by Marriage Status in Riverwoods
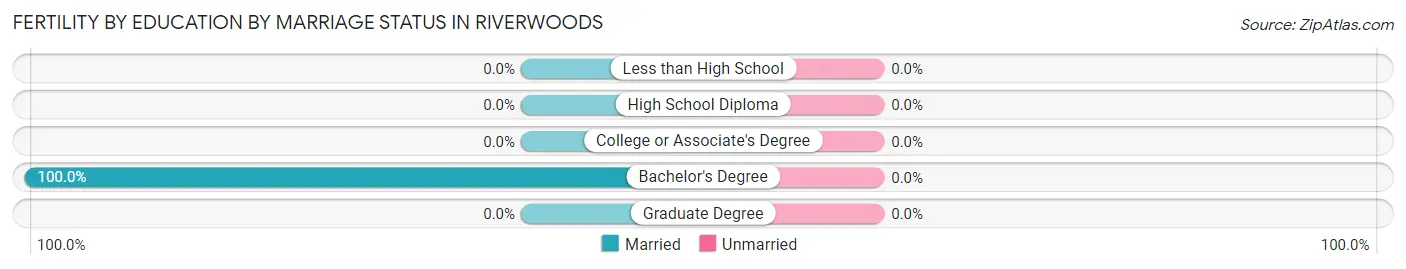
| Educational Attainment | Married | Unmarried |
| Less than High School | 0 (0.0%) | 0 (0.0%) |
| High School Diploma | 0 (0.0%) | 0 (0.0%) |
| College or Associate's Degree | 0 (0.0%) | 0 (0.0%) |
| Bachelor's Degree | 7 (100.0%) | 0 (0.0%) |
| Graduate Degree | 0 (0.0%) | 0 (0.0%) |
| Total | 7 (100.0%) | 0 (0.0%) |
Employment Characteristics in Riverwoods
Employment by Class of Employer in Riverwoods
Among the 1,760 employed individuals in Riverwoods, private company employees (1,176 | 66.8%), self-employed (incorporated) (312 | 17.7%), and not-for-profit organizations (131 | 7.4%) make up the most common classes of employment.
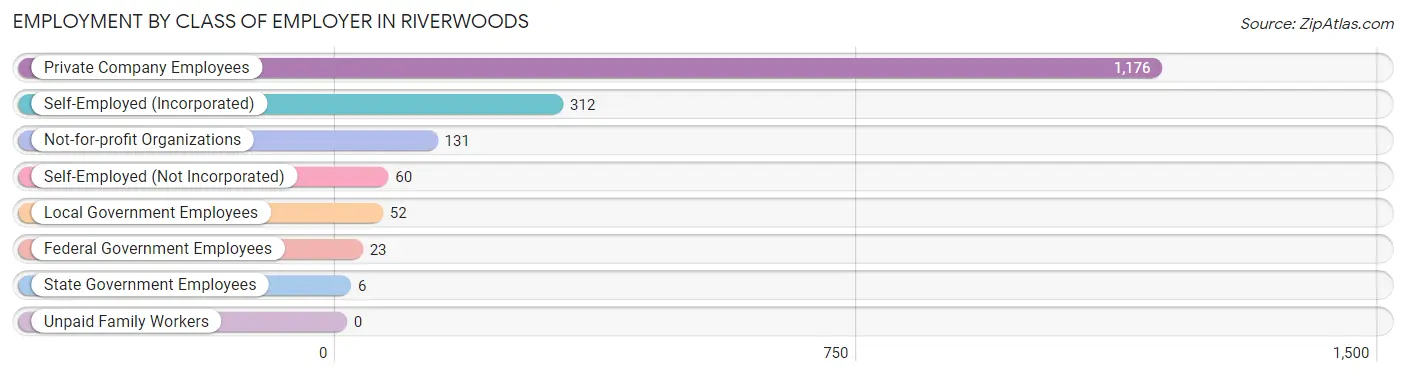
| Employer Class | # Employees | % Employees |
| Private Company Employees | 1,176 | 66.8% |
| Self-Employed (Incorporated) | 312 | 17.7% |
| Self-Employed (Not Incorporated) | 60 | 3.4% |
| Not-for-profit Organizations | 131 | 7.4% |
| Local Government Employees | 52 | 2.9% |
| State Government Employees | 6 | 0.3% |
| Federal Government Employees | 23 | 1.3% |
| Unpaid Family Workers | 0 | 0.0% |
| Total | 1,760 | 100.0% |
Employment Status by Age in Riverwoods
According to the labor force statistics for Riverwoods, out of the total population over 16 years of age (3,205), 56.1% or 1,798 individuals are in the labor force, with 1.2% or 22 of them unemployed. The age group with the highest labor force participation rate is 25 to 29 years, with 100.0% or 50 individuals in the labor force. Within the labor force, the 75 years and over age range has the highest percentage of unemployed individuals, with 78.6% or 11 of them being unemployed.
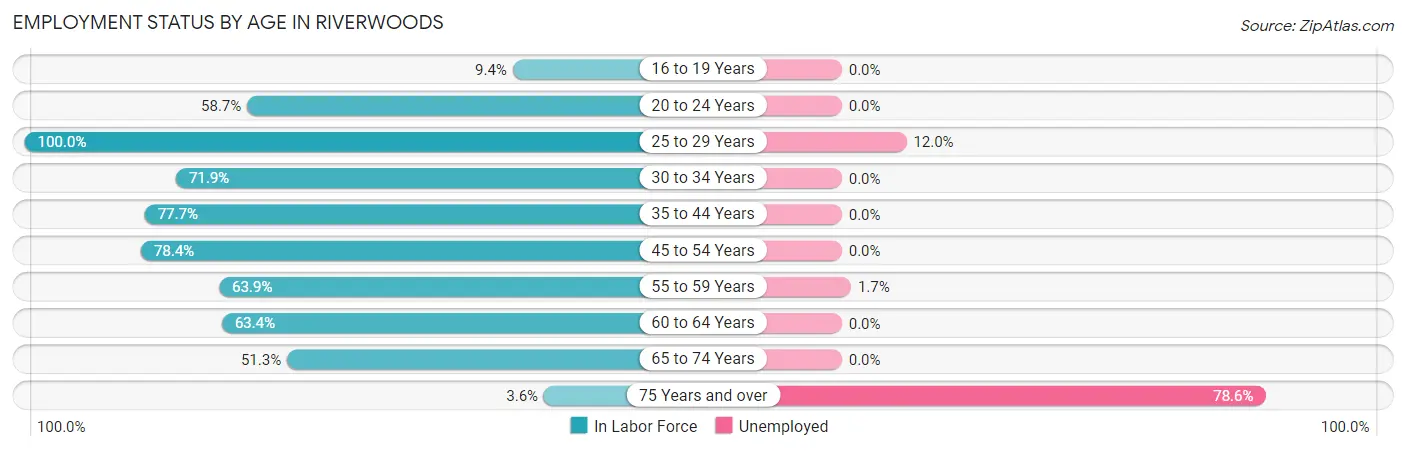
| Age Bracket | In Labor Force | Unemployed |
| 16 to 19 Years | 16 (9.4%) | 0 (0.0%) |
| 20 to 24 Years | 125 (58.7%) | 0 (0.0%) |
| 25 to 29 Years | 50 (100.0%) | 6 (12.0%) |
| 30 to 34 Years | 23 (71.9%) | 0 (0.0%) |
| 35 to 44 Years | 390 (77.7%) | 0 (0.0%) |
| 45 to 54 Years | 364 (78.4%) | 0 (0.0%) |
| 55 to 59 Years | 298 (63.9%) | 5 (1.7%) |
| 60 to 64 Years | 242 (63.4%) | 0 (0.0%) |
| 65 to 74 Years | 275 (51.3%) | 0 (0.0%) |
| 75 Years and over | 14 (3.6%) | 11 (78.6%) |
| Total | 1,798 (56.1%) | 22 (1.2%) |
Employment Status by Educational Attainment in Riverwoods
According to labor force statistics for Riverwoods, 72.1% of individuals (1,367) out of the total population between 25 and 64 years of age (1,896) are in the labor force, with 0.8% or 11 of them being unemployed. The group with the highest labor force participation rate are those with the educational attainment of college / associate degree, with 83.0% or 73 individuals in the labor force. Within the labor force, individuals with less than high school education have the highest percentage of unemployment, with 16.7% or 3 of them being unemployed.
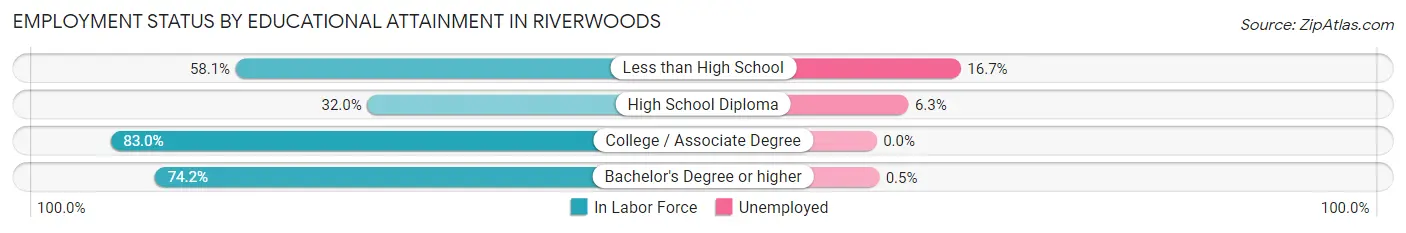
| Educational Attainment | In Labor Force | Unemployed |
| Less than High School | 18 (58.1%) | 5 (16.7%) |
| High School Diploma | 32 (32.0%) | 6 (6.3%) |
| College / Associate Degree | 73 (83.0%) | 0 (0.0%) |
| Bachelor's Degree or higher | 1,244 (74.2%) | 8 (0.5%) |
| Total | 1,367 (72.1%) | 15 (0.8%) |
Employment Occupations by Sex in Riverwoods
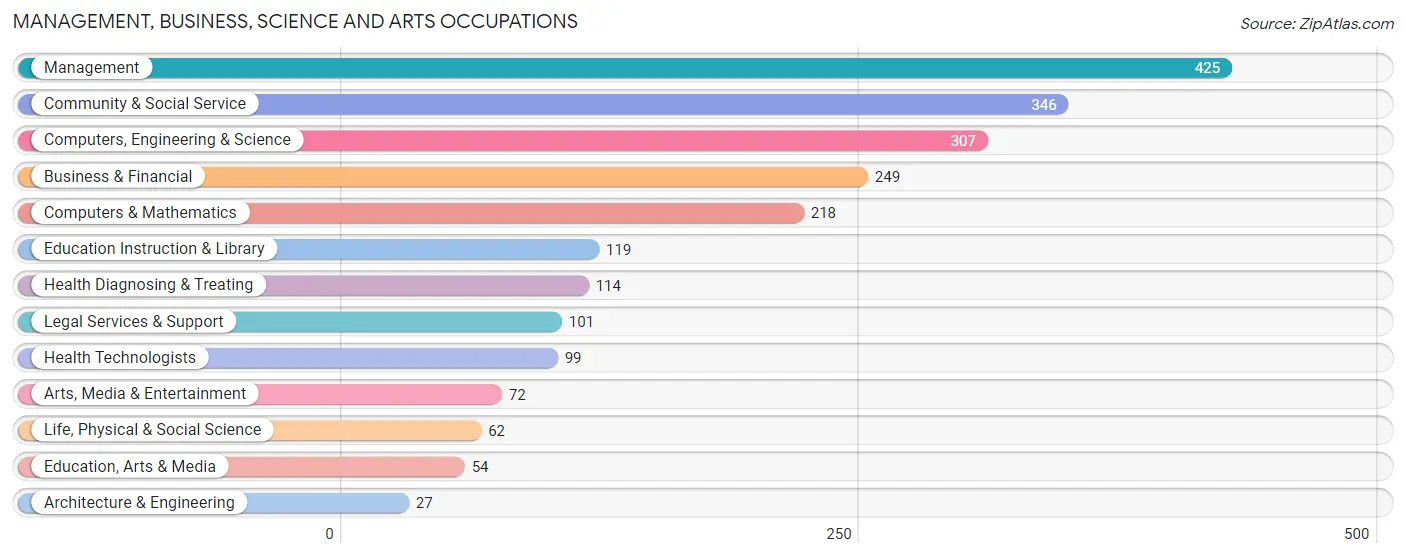
Management, Business, Science and Arts Occupations
The most common Management, Business, Science and Arts occupations in Riverwoods are Management (425 | 24.1%), Community & Social Service (346 | 19.6%), Computers, Engineering & Science (307 | 17.4%), Business & Financial (249 | 14.1%), and Computers & Mathematics (218 | 12.3%).
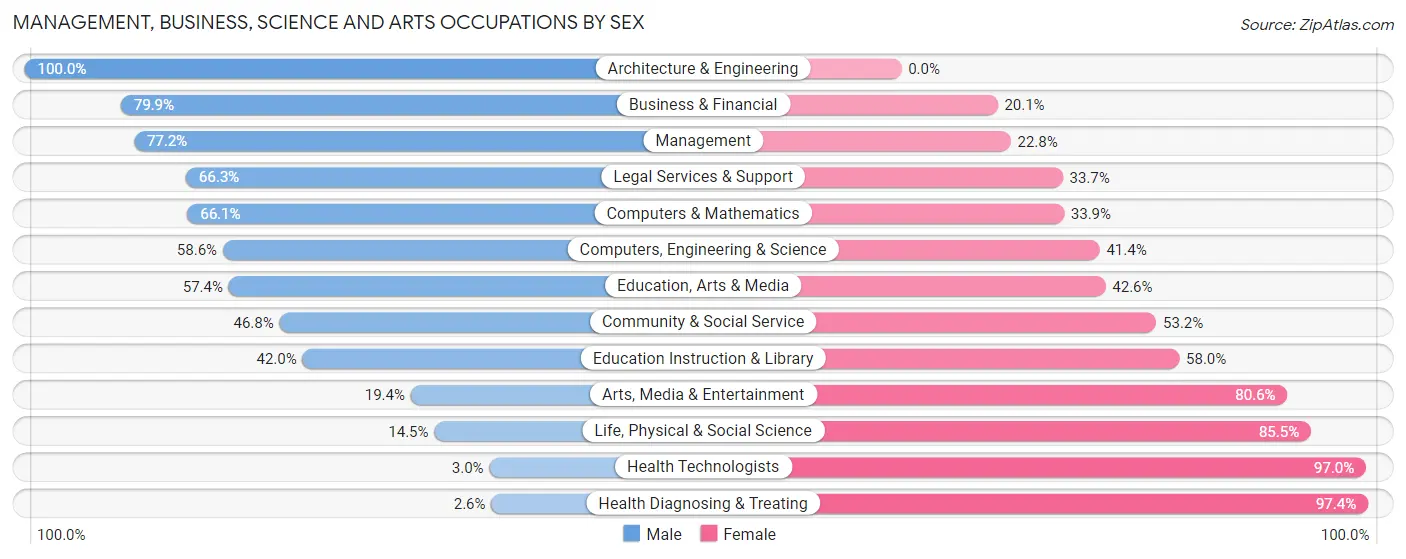
Management, Business, Science and Arts Occupations by Sex
Within the Management, Business, Science and Arts occupations in Riverwoods, the most male-oriented occupations are Architecture & Engineering (100.0%), Business & Financial (79.9%), and Management (77.2%), while the most female-oriented occupations are Health Diagnosing & Treating (97.4%), Health Technologists (97.0%), and Life, Physical & Social Science (85.5%).
| Occupation | Male | Female |
| Management | 328 (77.2%) | 97 (22.8%) |
| Business & Financial | 199 (79.9%) | 50 (20.1%) |
| Computers, Engineering & Science | 180 (58.6%) | 127 (41.4%) |
| Computers & Mathematics | 144 (66.1%) | 74 (33.9%) |
| Architecture & Engineering | 27 (100.0%) | 0 (0.0%) |
| Life, Physical & Social Science | 9 (14.5%) | 53 (85.5%) |
| Community & Social Service | 162 (46.8%) | 184 (53.2%) |
| Education, Arts & Media | 31 (57.4%) | 23 (42.6%) |
| Legal Services & Support | 67 (66.3%) | 34 (33.7%) |
| Education Instruction & Library | 50 (42.0%) | 69 (58.0%) |
| Arts, Media & Entertainment | 14 (19.4%) | 58 (80.6%) |
| Health Diagnosing & Treating | 3 (2.6%) | 111 (97.4%) |
| Health Technologists | 3 (3.0%) | 96 (97.0%) |
| Total (Category) | 872 (60.5%) | 569 (39.5%) |
| Total (Overall) | 1,084 (61.4%) | 682 (38.6%) |
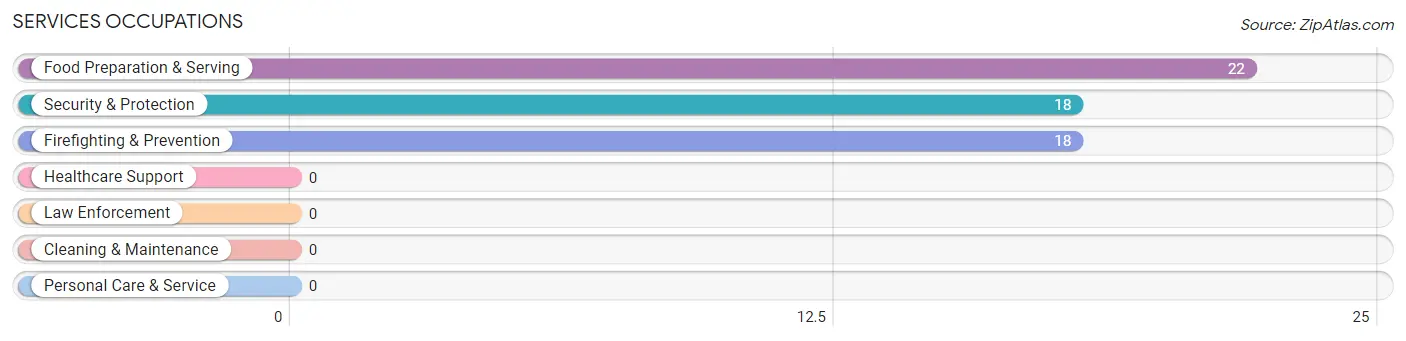
Services Occupations
The most common Services occupations in Riverwoods are Food Preparation & Serving (22 | 1.3%), Security & Protection (18 | 1.0%), and Firefighting & Prevention (18 | 1.0%).
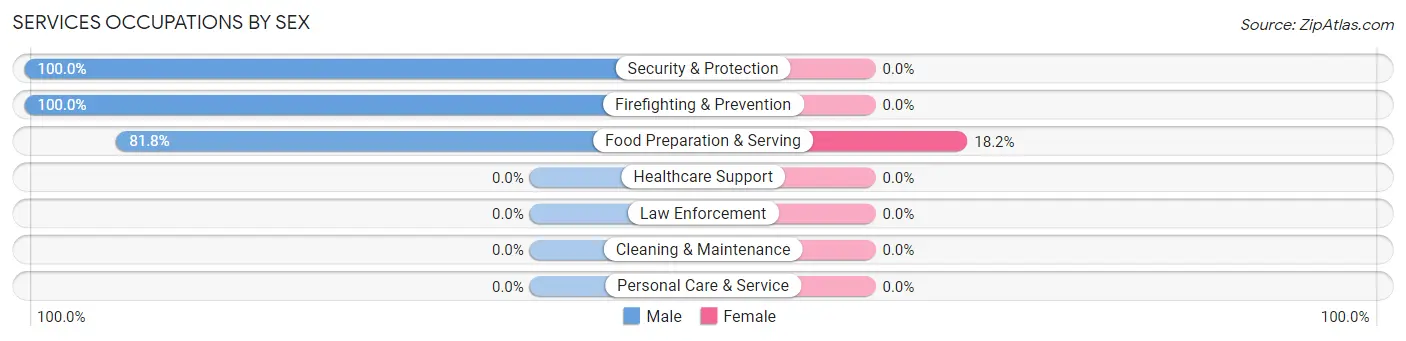
Services Occupations by Sex
| Occupation | Male | Female |
| Healthcare Support | 0 (0.0%) | 0 (0.0%) |
| Security & Protection | 18 (100.0%) | 0 (0.0%) |
| Firefighting & Prevention | 18 (100.0%) | 0 (0.0%) |
| Law Enforcement | 0 (0.0%) | 0 (0.0%) |
| Food Preparation & Serving | 18 (81.8%) | 4 (18.2%) |
| Cleaning & Maintenance | 0 (0.0%) | 0 (0.0%) |
| Personal Care & Service | 0 (0.0%) | 0 (0.0%) |
| Total (Category) | 36 (90.0%) | 4 (10.0%) |
| Total (Overall) | 1,084 (61.4%) | 682 (38.6%) |
Sales and Office Occupations
The most common Sales and Office occupations in Riverwoods are Sales & Related (151 | 8.6%), and Office & Administration (133 | 7.5%).
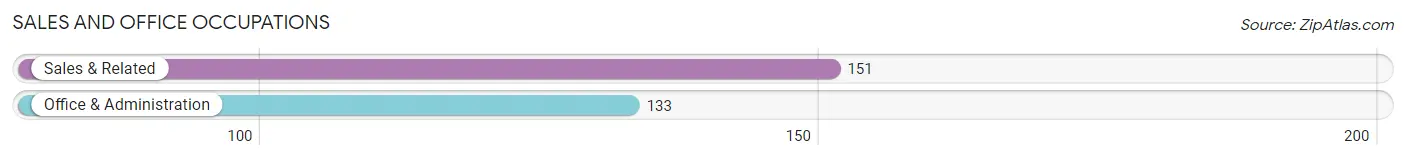
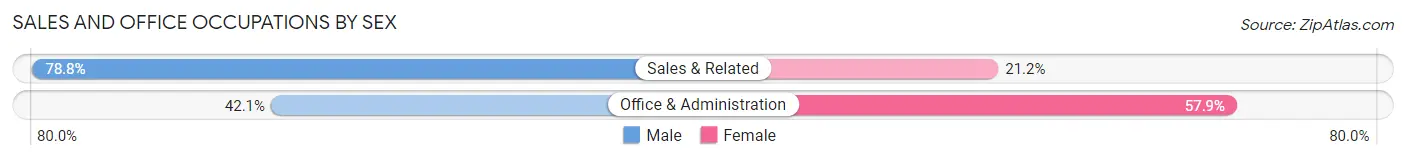
Sales and Office Occupations by Sex
| Occupation | Male | Female |
| Sales & Related | 119 (78.8%) | 32 (21.2%) |
| Office & Administration | 56 (42.1%) | 77 (57.9%) |
| Total (Category) | 175 (61.6%) | 109 (38.4%) |
| Total (Overall) | 1,084 (61.4%) | 682 (38.6%) |
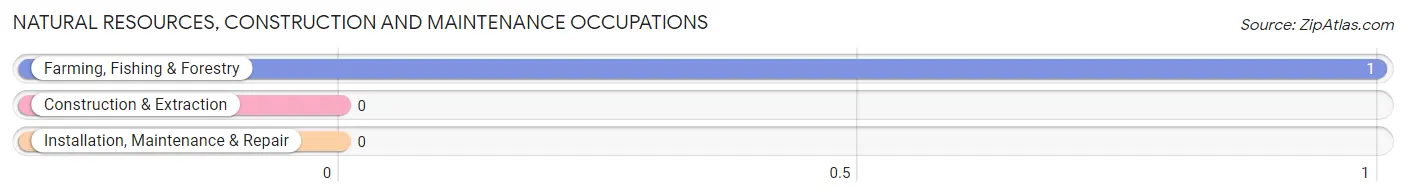
Natural Resources, Construction and Maintenance Occupations
The most common Natural Resources, Construction and Maintenance occupations in Riverwoods are , and Farming, Fishing & Forestry (1 | 0.1%).
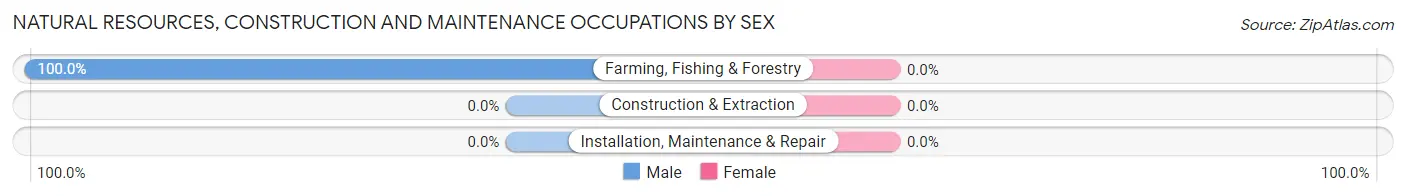
Natural Resources, Construction and Maintenance Occupations by Sex
| Occupation | Male | Female |
| Farming, Fishing & Forestry | 1 (100.0%) | 0 (0.0%) |
| Construction & Extraction | 0 (0.0%) | 0 (0.0%) |
| Installation, Maintenance & Repair | 0 (0.0%) | 0 (0.0%) |
| Total (Category) | 1 (100.0%) | 0 (0.0%) |
| Total (Overall) | 1,084 (61.4%) | 682 (38.6%) |
Production, Transportation and Moving Occupations
Production, Transportation and Moving Occupations by Sex
| Occupation | Male | Female |
| Production | 0 (0.0%) | 0 (0.0%) |
| Transportation | 0 (0.0%) | 0 (0.0%) |
| Material Moving | 0 (0.0%) | 0 (0.0%) |
| Total (Category) | 0 (0.0%) | 0 (0.0%) |
| Total (Overall) | 1,084 (61.4%) | 682 (38.6%) |
Employment Industries by Sex in Riverwoods
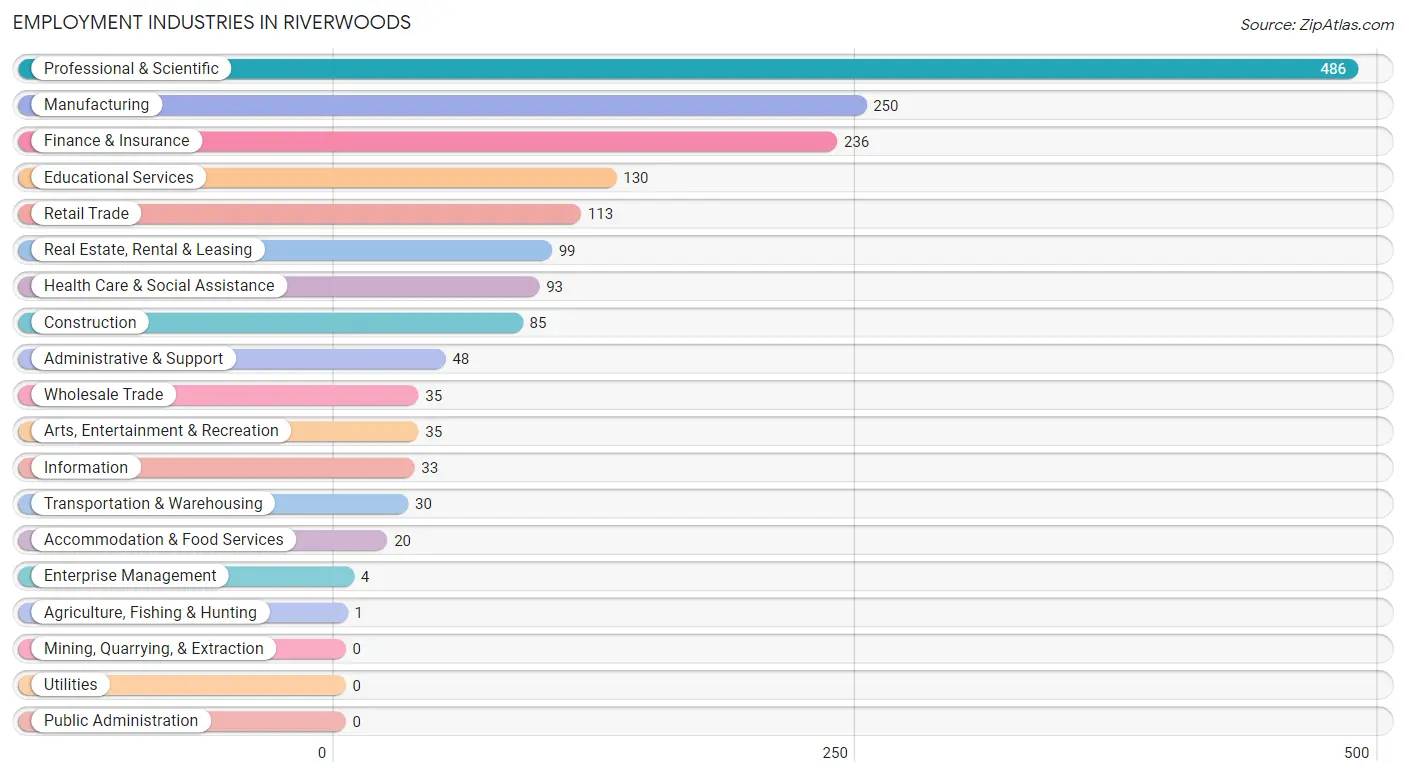
Employment Industries in Riverwoods
The major employment industries in Riverwoods include Professional & Scientific (486 | 27.5%), Manufacturing (250 | 14.2%), Finance & Insurance (236 | 13.4%), Educational Services (130 | 7.4%), and Retail Trade (113 | 6.4%).
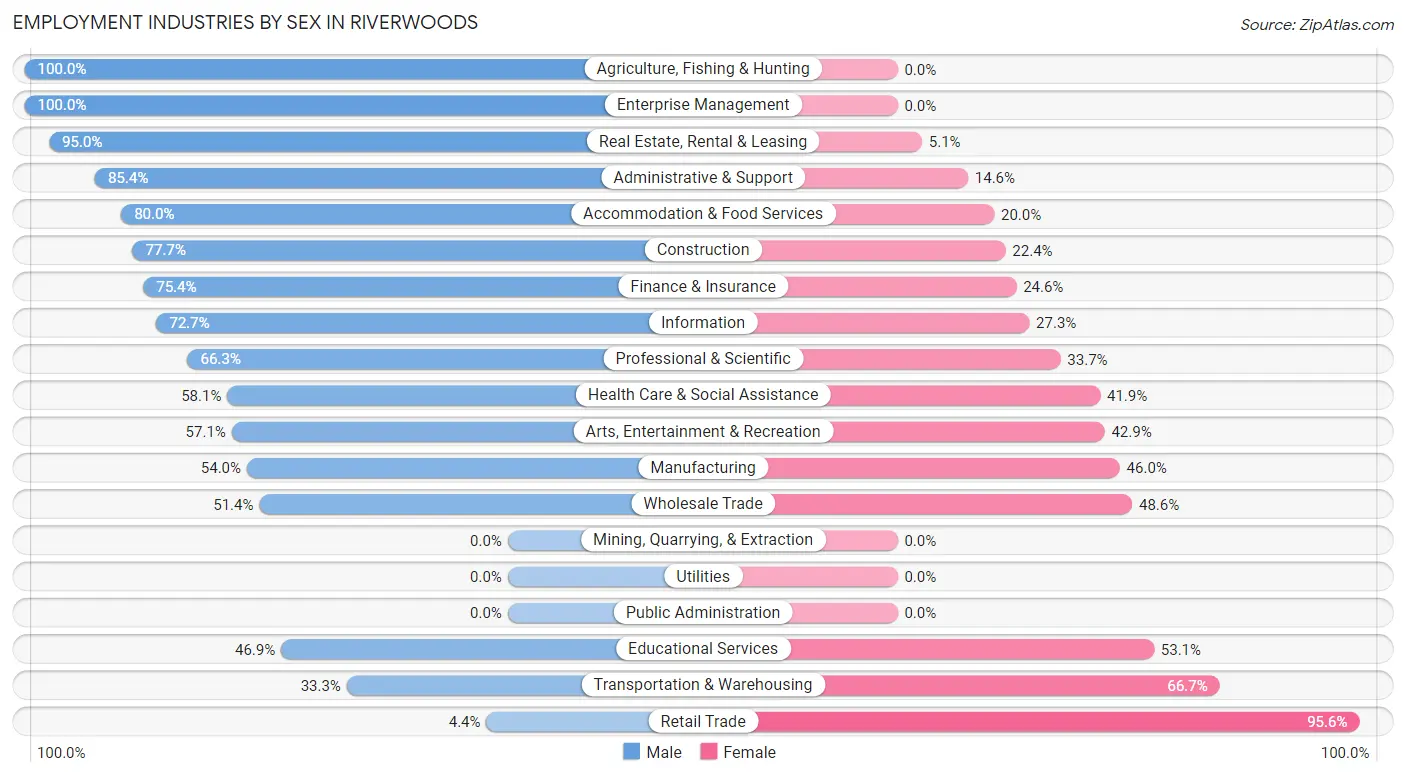
Employment Industries by Sex in Riverwoods
The Riverwoods industries that see more men than women are Agriculture, Fishing & Hunting (100.0%), Enterprise Management (100.0%), and Real Estate, Rental & Leasing (95.0%), whereas the industries that tend to have a higher number of women are Retail Trade (95.6%), Transportation & Warehousing (66.7%), and Educational Services (53.1%).
| Industry | Male | Female |
| Agriculture, Fishing & Hunting | 1 (100.0%) | 0 (0.0%) |
| Mining, Quarrying, & Extraction | 0 (0.0%) | 0 (0.0%) |
| Construction | 66 (77.6%) | 19 (22.4%) |
| Manufacturing | 135 (54.0%) | 115 (46.0%) |
| Wholesale Trade | 18 (51.4%) | 17 (48.6%) |
| Retail Trade | 5 (4.4%) | 108 (95.6%) |
| Transportation & Warehousing | 10 (33.3%) | 20 (66.7%) |
| Utilities | 0 (0.0%) | 0 (0.0%) |
| Information | 24 (72.7%) | 9 (27.3%) |
| Finance & Insurance | 178 (75.4%) | 58 (24.6%) |
| Real Estate, Rental & Leasing | 94 (95.0%) | 5 (5.1%) |
| Professional & Scientific | 322 (66.3%) | 164 (33.7%) |
| Enterprise Management | 4 (100.0%) | 0 (0.0%) |
| Administrative & Support | 41 (85.4%) | 7 (14.6%) |
| Educational Services | 61 (46.9%) | 69 (53.1%) |
| Health Care & Social Assistance | 54 (58.1%) | 39 (41.9%) |
| Arts, Entertainment & Recreation | 20 (57.1%) | 15 (42.9%) |
| Accommodation & Food Services | 16 (80.0%) | 4 (20.0%) |
| Public Administration | 0 (0.0%) | 0 (0.0%) |
| Total | 1,084 (61.4%) | 682 (38.6%) |
Education in Riverwoods
School Enrollment in Riverwoods
The most common levels of schooling among the 1,012 students in Riverwoods are elementary school (317 | 31.3%), high school (222 | 21.9%), and nursery / preschool (169 | 16.7%).
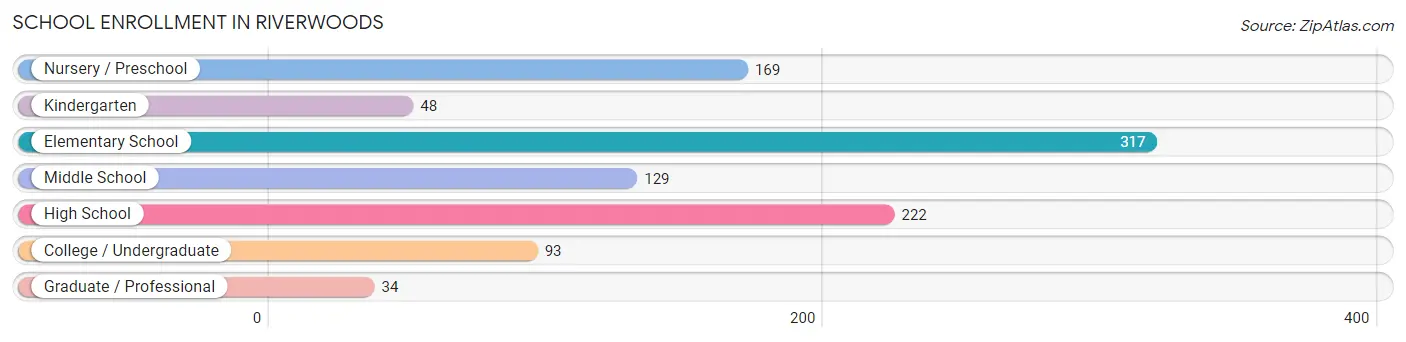
| School Level | # Students | % Students |
| Nursery / Preschool | 169 | 16.7% |
| Kindergarten | 48 | 4.7% |
| Elementary School | 317 | 31.3% |
| Middle School | 129 | 12.8% |
| High School | 222 | 21.9% |
| College / Undergraduate | 93 | 9.2% |
| Graduate / Professional | 34 | 3.4% |
| Total | 1,012 | 100.0% |
School Enrollment by Age by Funding Source in Riverwoods
Out of a total of 1,012 students who are enrolled in schools in Riverwoods, 113 (11.2%) attend a private institution, while the remaining 899 (88.8%) are enrolled in public schools. The age group of 35 years and over has the highest likelihood of being enrolled in private schools, with 10 (100.0% in the age bracket) enrolled. Conversely, the age group of 18 to 19 year olds has the lowest likelihood of being enrolled in a private school, with 23 (100.0% in the age bracket) attending a public institution.
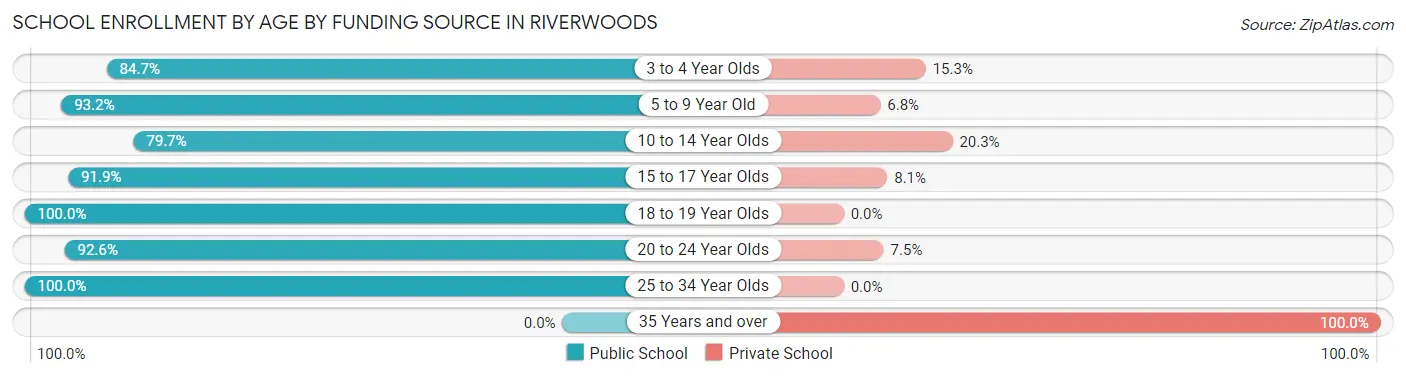
| Age Bracket | Public School | Private School |
| 3 to 4 Year Olds | 133 (84.7%) | 24 (15.3%) |
| 5 to 9 Year Old | 341 (93.2%) | 25 (6.8%) |
| 10 to 14 Year Olds | 122 (79.7%) | 31 (20.3%) |
| 15 to 17 Year Olds | 181 (91.9%) | 16 (8.1%) |
| 18 to 19 Year Olds | 23 (100.0%) | 0 (0.0%) |
| 20 to 24 Year Olds | 87 (92.5%) | 7 (7.4%) |
| 25 to 34 Year Olds | 12 (100.0%) | 0 (0.0%) |
| 35 Years and over | 0 (0.0%) | 10 (100.0%) |
| Total | 899 (88.8%) | 113 (11.2%) |
Educational Attainment by Field of Study in Riverwoods
Business (732 | 29.3%), social sciences (294 | 11.8%), education (245 | 9.8%), engineering (217 | 8.7%), and literature & languages (181 | 7.2%) are the most common fields of study among 2,495 individuals in Riverwoods who have obtained a bachelor's degree or higher.
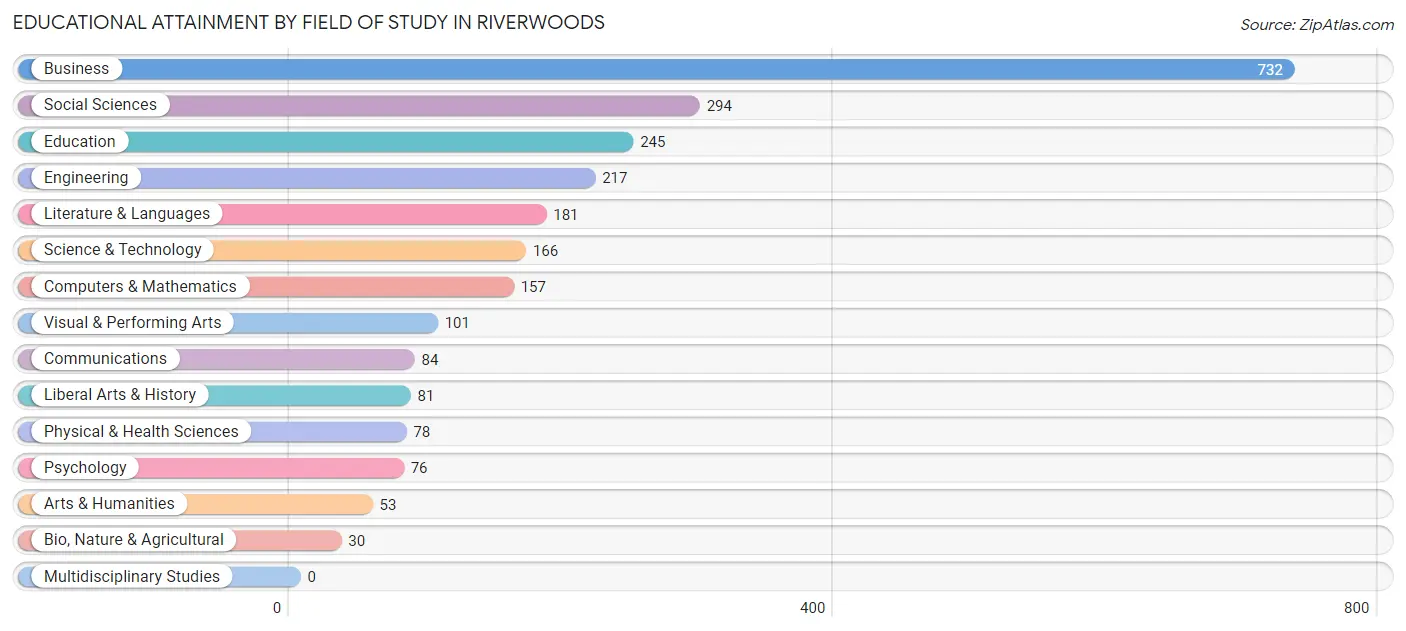
| Field of Study | # Graduates | % Graduates |
| Computers & Mathematics | 157 | 6.3% |
| Bio, Nature & Agricultural | 30 | 1.2% |
| Physical & Health Sciences | 78 | 3.1% |
| Psychology | 76 | 3.0% |
| Social Sciences | 294 | 11.8% |
| Engineering | 217 | 8.7% |
| Multidisciplinary Studies | 0 | 0.0% |
| Science & Technology | 166 | 6.7% |
| Business | 732 | 29.3% |
| Education | 245 | 9.8% |
| Literature & Languages | 181 | 7.2% |
| Liberal Arts & History | 81 | 3.3% |
| Visual & Performing Arts | 101 | 4.1% |
| Communications | 84 | 3.4% |
| Arts & Humanities | 53 | 2.1% |
| Total | 2,495 | 100.0% |
Transportation & Commute in Riverwoods
Vehicle Availability by Sex in Riverwoods
The most prevalent vehicle ownership categories in Riverwoods are males with 2 vehicles (542, accounting for 50.4%) and females with 2 vehicles (396, making up 79.5%).
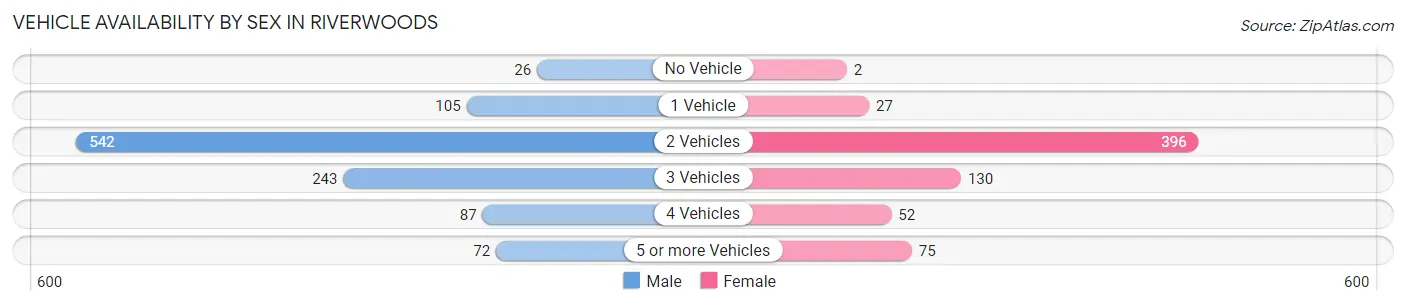
| Vehicles Available | Male | Female |
| No Vehicle | 26 (2.4%) | 2 (0.3%) |
| 1 Vehicle | 105 (9.8%) | 27 (4.0%) |
| 2 Vehicles | 542 (50.4%) | 396 (58.1%) |
| 3 Vehicles | 243 (22.6%) | 130 (19.1%) |
| 4 Vehicles | 87 (8.1%) | 52 (7.6%) |
| 5 or more Vehicles | 72 (6.7%) | 75 (11.0%) |
| Total | 1,075 (100.0%) | 682 (100.0%) |
Commute Time in Riverwoods
The most frequently occuring commute durations in Riverwoods are 60 to 89 minutes (230 commuters, 18.1%), 15 to 19 minutes (185 commuters, 14.6%), and 30 to 34 minutes (160 commuters, 12.6%).
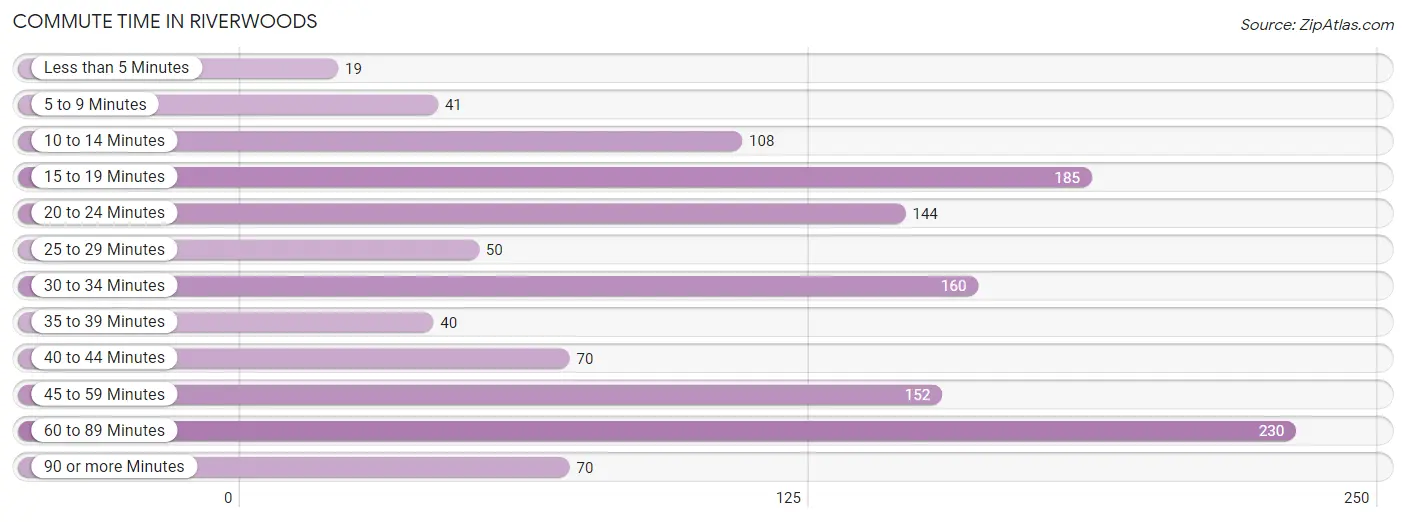
| Commute Time | # Commuters | % Commuters |
| Less than 5 Minutes | 19 | 1.5% |
| 5 to 9 Minutes | 41 | 3.2% |
| 10 to 14 Minutes | 108 | 8.5% |
| 15 to 19 Minutes | 185 | 14.6% |
| 20 to 24 Minutes | 144 | 11.4% |
| 25 to 29 Minutes | 50 | 3.9% |
| 30 to 34 Minutes | 160 | 12.6% |
| 35 to 39 Minutes | 40 | 3.2% |
| 40 to 44 Minutes | 70 | 5.5% |
| 45 to 59 Minutes | 152 | 12.0% |
| 60 to 89 Minutes | 230 | 18.1% |
| 90 or more Minutes | 70 | 5.5% |
Commute Time by Sex in Riverwoods
The most common commute times in Riverwoods are 60 to 89 minutes (168 commuters, 22.1%) for males and 45 to 59 minutes (99 commuters, 19.5%) for females.
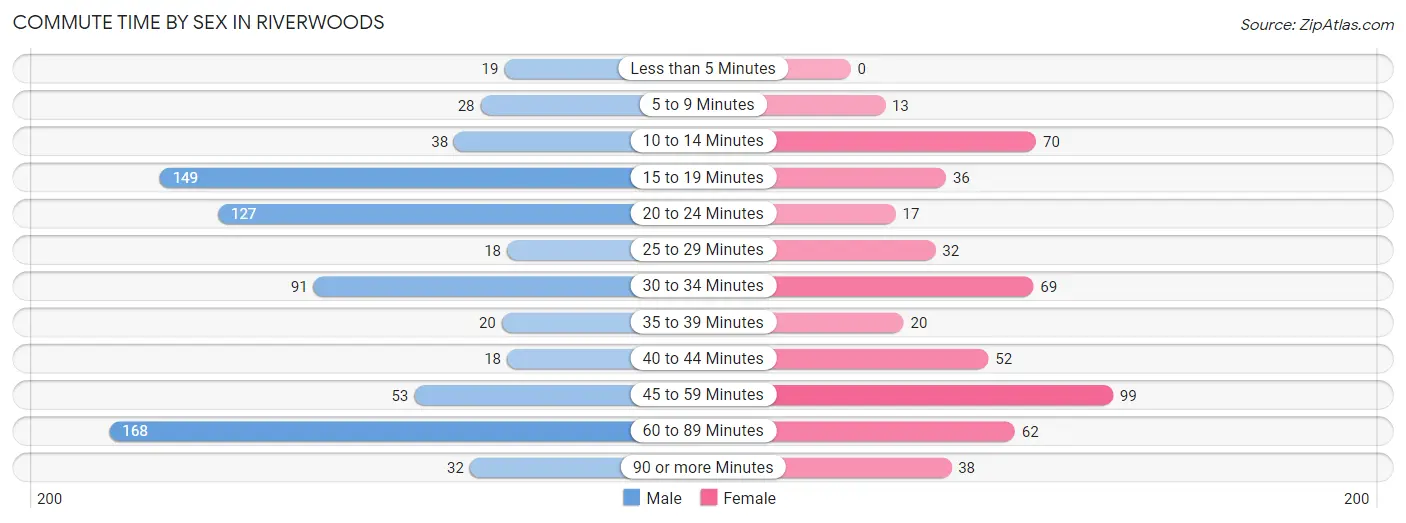
| Commute Time | Male | Female |
| Less than 5 Minutes | 19 (2.5%) | 0 (0.0%) |
| 5 to 9 Minutes | 28 (3.7%) | 13 (2.6%) |
| 10 to 14 Minutes | 38 (5.0%) | 70 (13.8%) |
| 15 to 19 Minutes | 149 (19.6%) | 36 (7.1%) |
| 20 to 24 Minutes | 127 (16.7%) | 17 (3.4%) |
| 25 to 29 Minutes | 18 (2.4%) | 32 (6.3%) |
| 30 to 34 Minutes | 91 (12.0%) | 69 (13.6%) |
| 35 to 39 Minutes | 20 (2.6%) | 20 (3.9%) |
| 40 to 44 Minutes | 18 (2.4%) | 52 (10.2%) |
| 45 to 59 Minutes | 53 (7.0%) | 99 (19.5%) |
| 60 to 89 Minutes | 168 (22.1%) | 62 (12.2%) |
| 90 or more Minutes | 32 (4.2%) | 38 (7.5%) |
Time of Departure to Work by Sex in Riverwoods
The most frequent times of departure to work in Riverwoods are 9:00 AM to 9:59 AM (156, 20.5%) for males and 8:00 AM to 8:29 AM (156, 30.7%) for females.
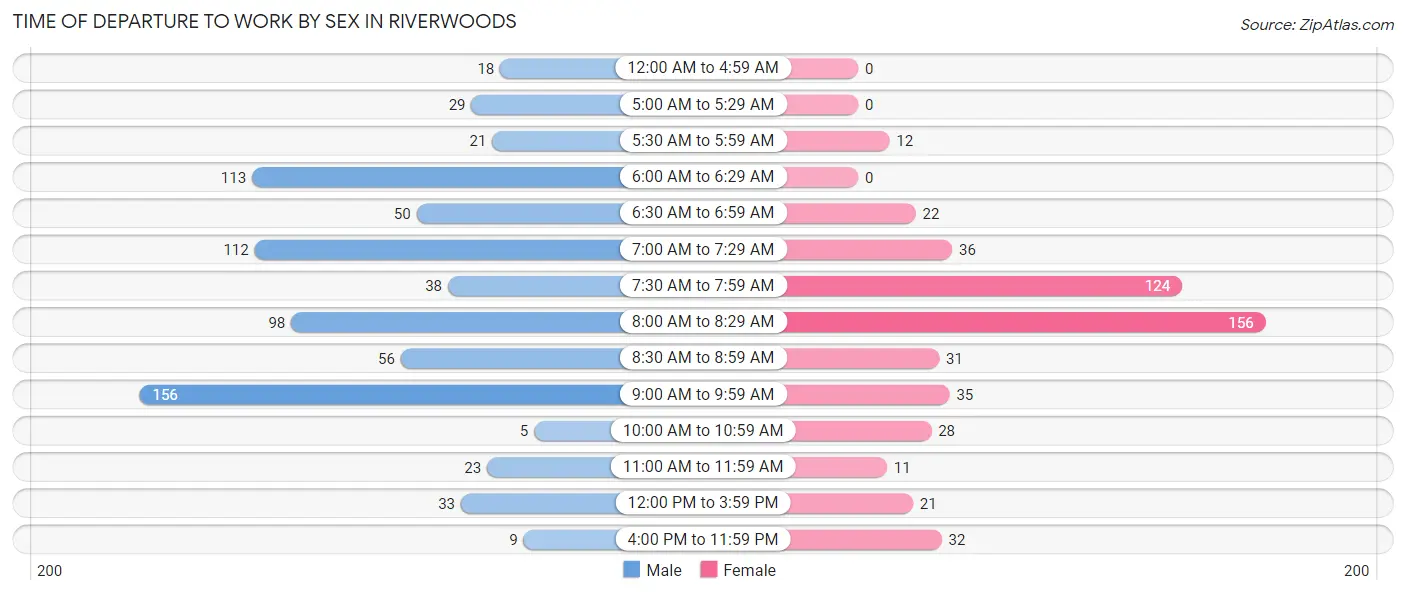
| Time of Departure | Male | Female |
| 12:00 AM to 4:59 AM | 18 (2.4%) | 0 (0.0%) |
| 5:00 AM to 5:29 AM | 29 (3.8%) | 0 (0.0%) |
| 5:30 AM to 5:59 AM | 21 (2.8%) | 12 (2.4%) |
| 6:00 AM to 6:29 AM | 113 (14.8%) | 0 (0.0%) |
| 6:30 AM to 6:59 AM | 50 (6.6%) | 22 (4.3%) |
| 7:00 AM to 7:29 AM | 112 (14.7%) | 36 (7.1%) |
| 7:30 AM to 7:59 AM | 38 (5.0%) | 124 (24.4%) |
| 8:00 AM to 8:29 AM | 98 (12.9%) | 156 (30.7%) |
| 8:30 AM to 8:59 AM | 56 (7.4%) | 31 (6.1%) |
| 9:00 AM to 9:59 AM | 156 (20.5%) | 35 (6.9%) |
| 10:00 AM to 10:59 AM | 5 (0.7%) | 28 (5.5%) |
| 11:00 AM to 11:59 AM | 23 (3.0%) | 11 (2.2%) |
| 12:00 PM to 3:59 PM | 33 (4.3%) | 21 (4.1%) |
| 4:00 PM to 11:59 PM | 9 (1.2%) | 32 (6.3%) |
| Total | 761 (100.0%) | 508 (100.0%) |
Housing Occupancy in Riverwoods
Occupancy by Ownership in Riverwoods
Of the total 1,339 dwellings in Riverwoods, owner-occupied units account for 1,302 (97.2%), while renter-occupied units make up 37 (2.8%).
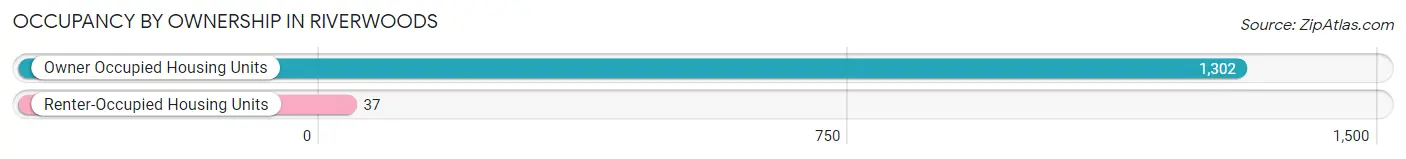
| Occupancy | # Housing Units | % Housing Units |
| Owner Occupied Housing Units | 1,302 | 97.2% |
| Renter-Occupied Housing Units | 37 | 2.8% |
| Total Occupied Housing Units | 1,339 | 100.0% |
Occupancy by Household Size in Riverwoods
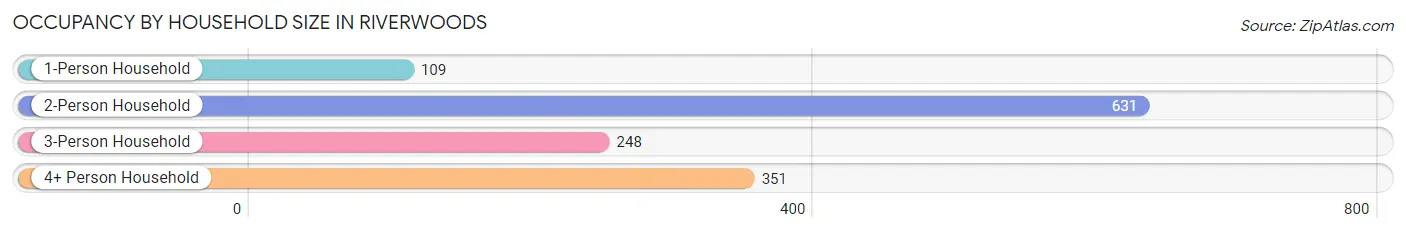
| Household Size | # Housing Units | % Housing Units |
| 1-Person Household | 109 | 8.1% |
| 2-Person Household | 631 | 47.1% |
| 3-Person Household | 248 | 18.5% |
| 4+ Person Household | 351 | 26.2% |
| Total Housing Units | 1,339 | 100.0% |
Occupancy by Ownership by Household Size in Riverwoods
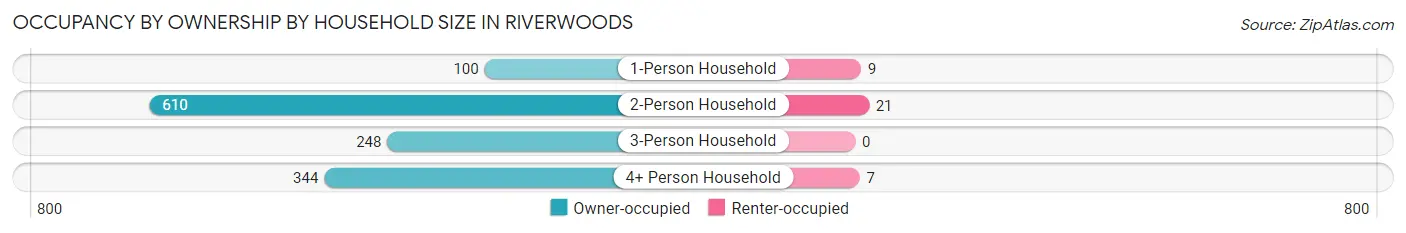
| Household Size | Owner-occupied | Renter-occupied |
| 1-Person Household | 100 (91.7%) | 9 (8.3%) |
| 2-Person Household | 610 (96.7%) | 21 (3.3%) |
| 3-Person Household | 248 (100.0%) | 0 (0.0%) |
| 4+ Person Household | 344 (98.0%) | 7 (2.0%) |
| Total Housing Units | 1,302 (97.2%) | 37 (2.8%) |
Occupancy by Educational Attainment in Riverwoods
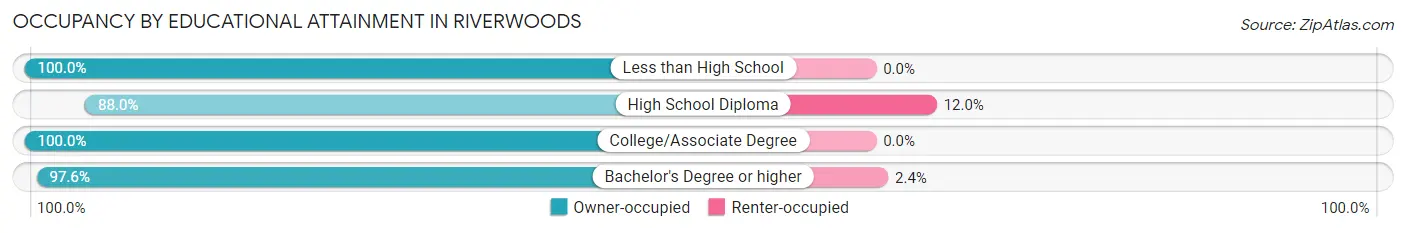
| Household Size | Owner-occupied | Renter-occupied |
| Less than High School | 11 (100.0%) | 0 (0.0%) |
| High School Diploma | 66 (88.0%) | 9 (12.0%) |
| College/Associate Degree | 71 (100.0%) | 0 (0.0%) |
| Bachelor's Degree or higher | 1,154 (97.6%) | 28 (2.4%) |
Occupancy by Age of Householder in Riverwoods
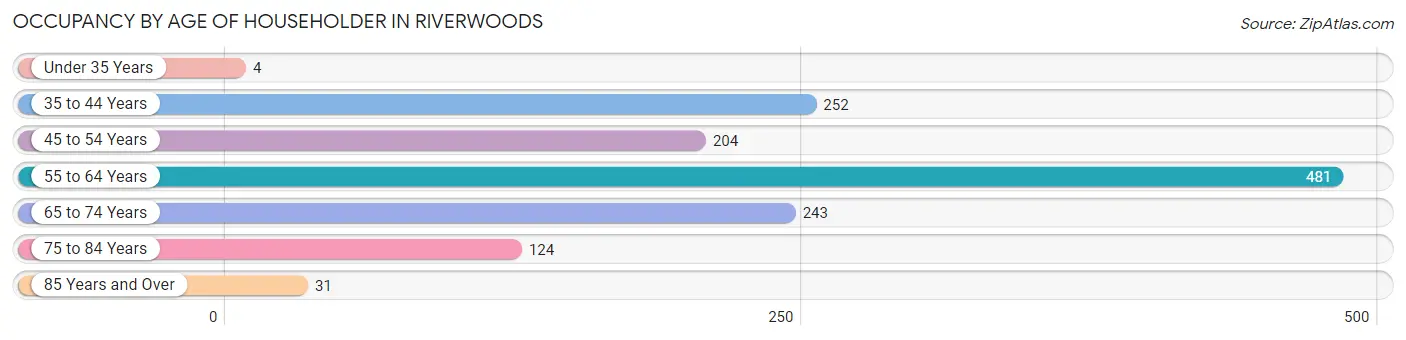
| Age Bracket | # Households | % Households |
| Under 35 Years | 4 | 0.3% |
| 35 to 44 Years | 252 | 18.8% |
| 45 to 54 Years | 204 | 15.2% |
| 55 to 64 Years | 481 | 35.9% |
| 65 to 74 Years | 243 | 18.1% |
| 75 to 84 Years | 124 | 9.3% |
| 85 Years and Over | 31 | 2.3% |
| Total | 1,339 | 100.0% |
Housing Finances in Riverwoods
Median Income by Occupancy in Riverwoods
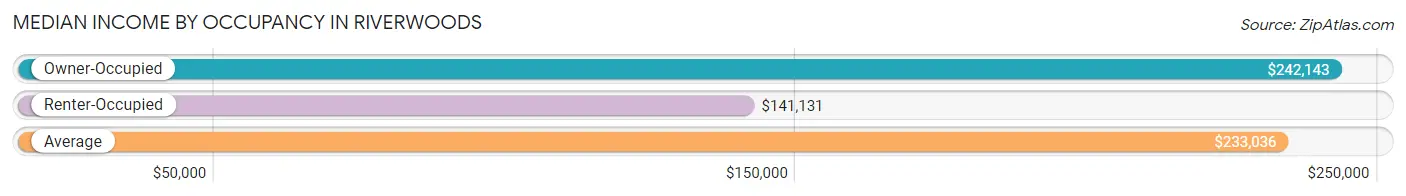
| Occupancy Type | # Households | Median Income |
| Owner-Occupied | 1,302 (97.2%) | $242,143 |
| Renter-Occupied | 37 (2.8%) | $141,131 |
| Average | 1,339 (100.0%) | $233,036 |
Occupancy by Householder Income Bracket in Riverwoods
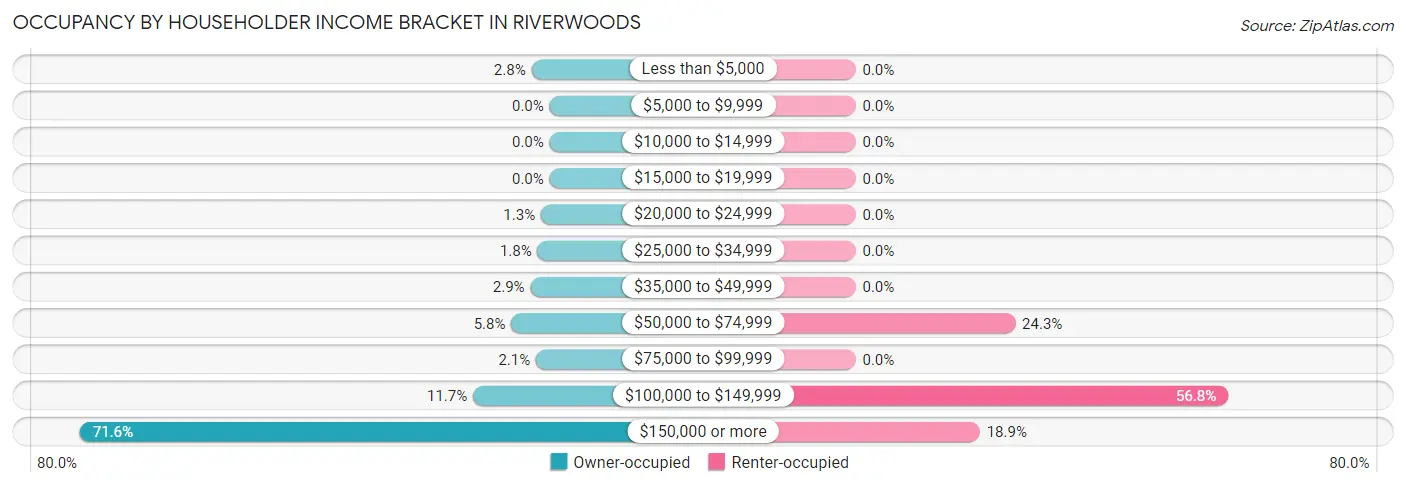
| Income Bracket | Owner-occupied | Renter-occupied |
| Less than $5,000 | 36 (2.8%) | 0 (0.0%) |
| $5,000 to $9,999 | 0 (0.0%) | 0 (0.0%) |
| $10,000 to $14,999 | 0 (0.0%) | 0 (0.0%) |
| $15,000 to $19,999 | 0 (0.0%) | 0 (0.0%) |
| $20,000 to $24,999 | 17 (1.3%) | 0 (0.0%) |
| $25,000 to $34,999 | 24 (1.8%) | 0 (0.0%) |
| $35,000 to $49,999 | 38 (2.9%) | 0 (0.0%) |
| $50,000 to $74,999 | 76 (5.8%) | 9 (24.3%) |
| $75,000 to $99,999 | 27 (2.1%) | 0 (0.0%) |
| $100,000 to $149,999 | 152 (11.7%) | 21 (56.8%) |
| $150,000 or more | 932 (71.6%) | 7 (18.9%) |
| Total | 1,302 (100.0%) | 37 (100.0%) |
Monthly Housing Cost Tiers in Riverwoods
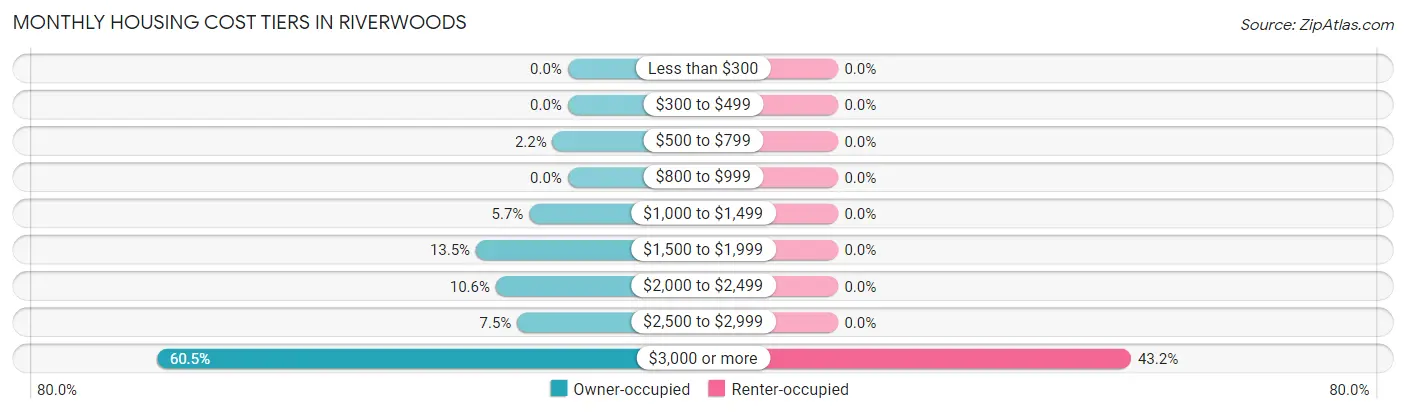
| Monthly Cost | Owner-occupied | Renter-occupied |
| Less than $300 | 0 (0.0%) | 0 (0.0%) |
| $300 to $499 | 0 (0.0%) | 0 (0.0%) |
| $500 to $799 | 29 (2.2%) | 0 (0.0%) |
| $800 to $999 | 0 (0.0%) | 0 (0.0%) |
| $1,000 to $1,499 | 74 (5.7%) | 0 (0.0%) |
| $1,500 to $1,999 | 176 (13.5%) | 0 (0.0%) |
| $2,000 to $2,499 | 138 (10.6%) | 0 (0.0%) |
| $2,500 to $2,999 | 97 (7.4%) | 0 (0.0%) |
| $3,000 or more | 788 (60.5%) | 16 (43.2%) |
| Total | 1,302 (100.0%) | 37 (100.0%) |
Physical Housing Characteristics in Riverwoods
Housing Structures in Riverwoods
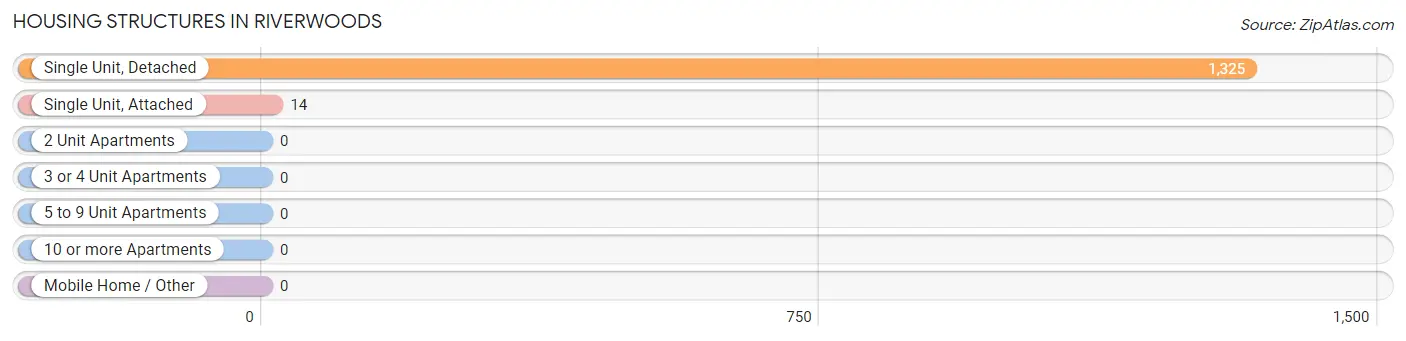
| Structure Type | # Housing Units | % Housing Units |
| Single Unit, Detached | 1,325 | 99.0% |
| Single Unit, Attached | 14 | 1.1% |
| 2 Unit Apartments | 0 | 0.0% |
| 3 or 4 Unit Apartments | 0 | 0.0% |
| 5 to 9 Unit Apartments | 0 | 0.0% |
| 10 or more Apartments | 0 | 0.0% |
| Mobile Home / Other | 0 | 0.0% |
| Total | 1,339 | 100.0% |
Housing Structures by Occupancy in Riverwoods
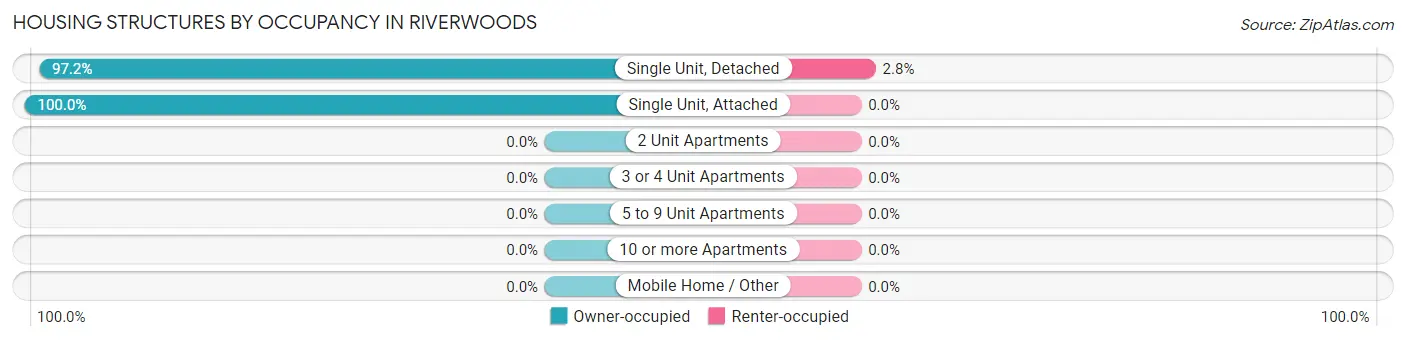
| Structure Type | Owner-occupied | Renter-occupied |
| Single Unit, Detached | 1,288 (97.2%) | 37 (2.8%) |
| Single Unit, Attached | 14 (100.0%) | 0 (0.0%) |
| 2 Unit Apartments | 0 (0.0%) | 0 (0.0%) |
| 3 or 4 Unit Apartments | 0 (0.0%) | 0 (0.0%) |
| 5 to 9 Unit Apartments | 0 (0.0%) | 0 (0.0%) |
| 10 or more Apartments | 0 (0.0%) | 0 (0.0%) |
| Mobile Home / Other | 0 (0.0%) | 0 (0.0%) |
| Total | 1,302 (97.2%) | 37 (2.8%) |
Housing Structures by Number of Rooms in Riverwoods
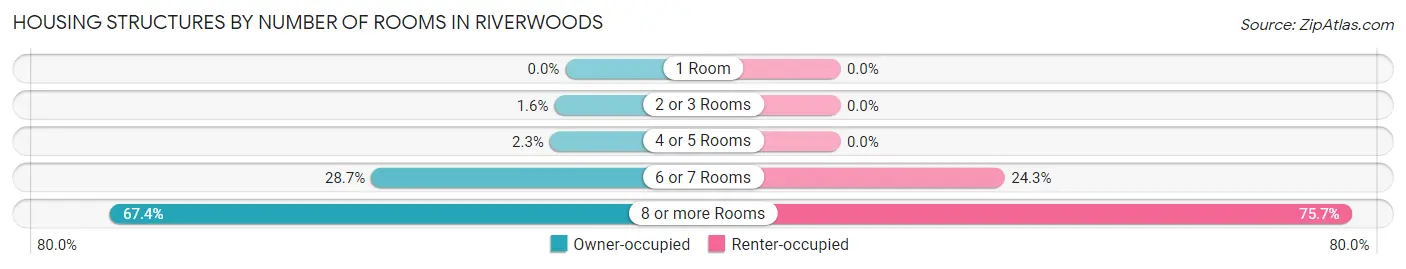
| Number of Rooms | Owner-occupied | Renter-occupied |
| 1 Room | 0 (0.0%) | 0 (0.0%) |
| 2 or 3 Rooms | 21 (1.6%) | 0 (0.0%) |
| 4 or 5 Rooms | 30 (2.3%) | 0 (0.0%) |
| 6 or 7 Rooms | 374 (28.7%) | 9 (24.3%) |
| 8 or more Rooms | 877 (67.4%) | 28 (75.7%) |
| Total | 1,302 (100.0%) | 37 (100.0%) |
Housing Structure by Heating Type in Riverwoods
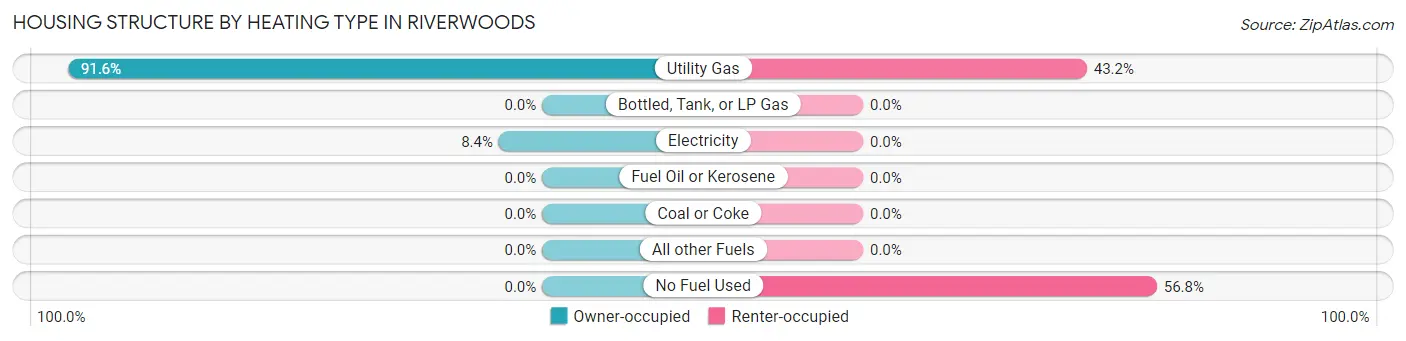
| Heating Type | Owner-occupied | Renter-occupied |
| Utility Gas | 1,193 (91.6%) | 16 (43.2%) |
| Bottled, Tank, or LP Gas | 0 (0.0%) | 0 (0.0%) |
| Electricity | 109 (8.4%) | 0 (0.0%) |
| Fuel Oil or Kerosene | 0 (0.0%) | 0 (0.0%) |
| Coal or Coke | 0 (0.0%) | 0 (0.0%) |
| All other Fuels | 0 (0.0%) | 0 (0.0%) |
| No Fuel Used | 0 (0.0%) | 21 (56.8%) |
| Total | 1,302 (100.0%) | 37 (100.0%) |
Household Vehicle Usage in Riverwoods
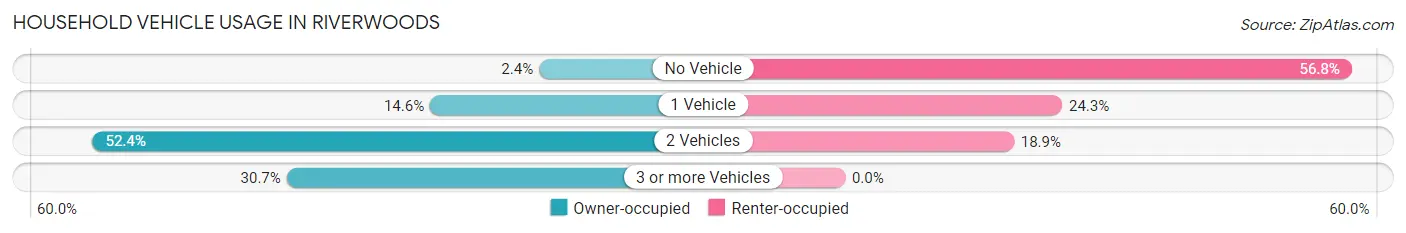
| Vehicles per Household | Owner-occupied | Renter-occupied |
| No Vehicle | 31 (2.4%) | 21 (56.8%) |
| 1 Vehicle | 190 (14.6%) | 9 (24.3%) |
| 2 Vehicles | 682 (52.4%) | 7 (18.9%) |
| 3 or more Vehicles | 399 (30.6%) | 0 (0.0%) |
| Total | 1,302 (100.0%) | 37 (100.0%) |
Real Estate & Mortgages in Riverwoods
Real Estate and Mortgage Overview in Riverwoods
| Characteristic | Without Mortgage | With Mortgage |
| Housing Units | 484 | 818 |
| Median Property Value | $778,100 | $776,100 |
| Median Household Income | $162,273 | $666 |
| Monthly Housing Costs | $1,501 | $736 |
| Real Estate Taxes | $10,001 | $26 |
Property Value by Mortgage Status in Riverwoods
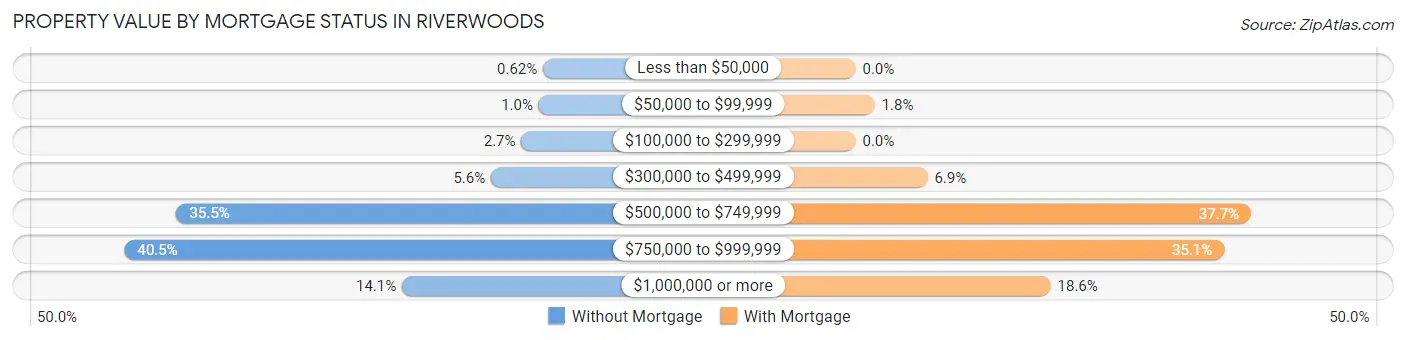
| Property Value | Without Mortgage | With Mortgage |
| Less than $50,000 | 3 (0.6%) | 0 (0.0%) |
| $50,000 to $99,999 | 5 (1.0%) | 15 (1.8%) |
| $100,000 to $299,999 | 13 (2.7%) | 0 (0.0%) |
| $300,000 to $499,999 | 27 (5.6%) | 56 (6.9%) |
| $500,000 to $749,999 | 172 (35.5%) | 308 (37.7%) |
| $750,000 to $999,999 | 196 (40.5%) | 287 (35.1%) |
| $1,000,000 or more | 68 (14.1%) | 152 (18.6%) |
| Total | 484 (100.0%) | 818 (100.0%) |
Household Income by Mortgage Status in Riverwoods
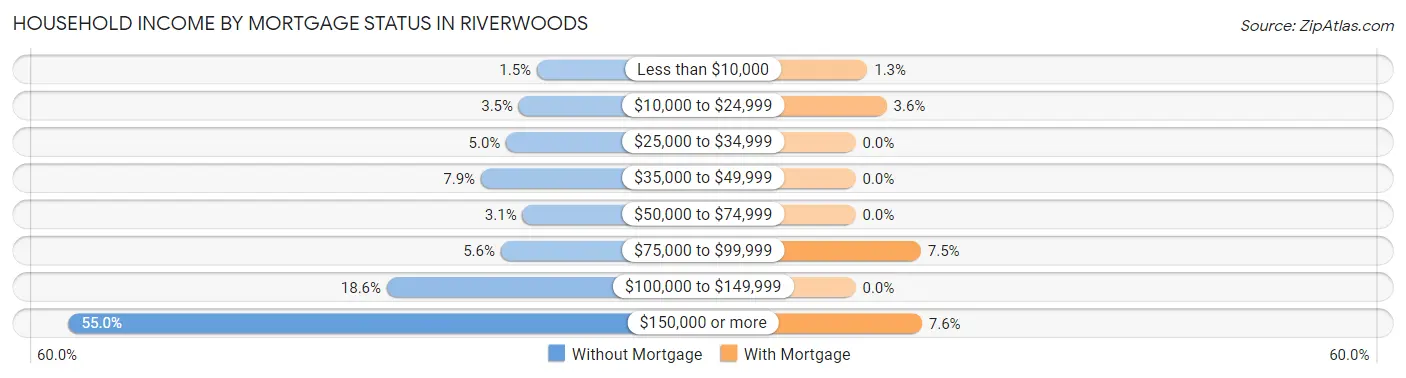
| Household Income | Without Mortgage | With Mortgage |
| Less than $10,000 | 7 (1.5%) | 11 (1.3%) |
| $10,000 to $24,999 | 17 (3.5%) | 29 (3.5%) |
| $25,000 to $34,999 | 24 (5.0%) | 0 (0.0%) |
| $35,000 to $49,999 | 38 (7.9%) | 0 (0.0%) |
| $50,000 to $74,999 | 15 (3.1%) | 0 (0.0%) |
| $75,000 to $99,999 | 27 (5.6%) | 61 (7.5%) |
| $100,000 to $149,999 | 90 (18.6%) | 0 (0.0%) |
| $150,000 or more | 266 (55.0%) | 62 (7.6%) |
| Total | 484 (100.0%) | 818 (100.0%) |
Property Value to Household Income Ratio in Riverwoods
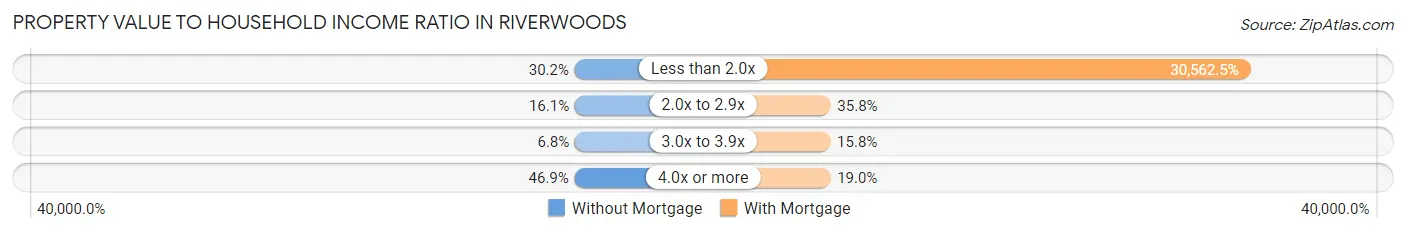
| Value-to-Income Ratio | Without Mortgage | With Mortgage |
| Less than 2.0x | 146 (30.2%) | 250,001 (30,562.5%) |
| 2.0x to 2.9x | 78 (16.1%) | 293 (35.8%) |
| 3.0x to 3.9x | 33 (6.8%) | 129 (15.8%) |
| 4.0x or more | 227 (46.9%) | 155 (19.0%) |
| Total | 484 (100.0%) | 818 (100.0%) |
Real Estate Taxes by Mortgage Status in Riverwoods
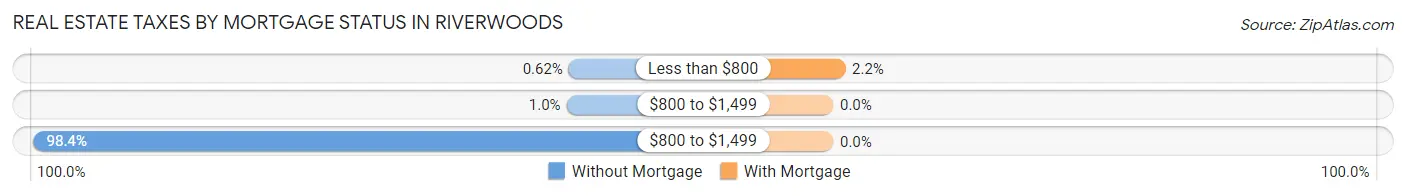
| Property Taxes | Without Mortgage | With Mortgage |
| Less than $800 | 3 (0.6%) | 18 (2.2%) |
| $800 to $1,499 | 5 (1.0%) | 0 (0.0%) |
| $800 to $1,499 | 476 (98.4%) | 0 (0.0%) |
| Total | 484 (100.0%) | 818 (100.0%) |
Health & Disability in Riverwoods
Health Insurance Coverage by Age in Riverwoods
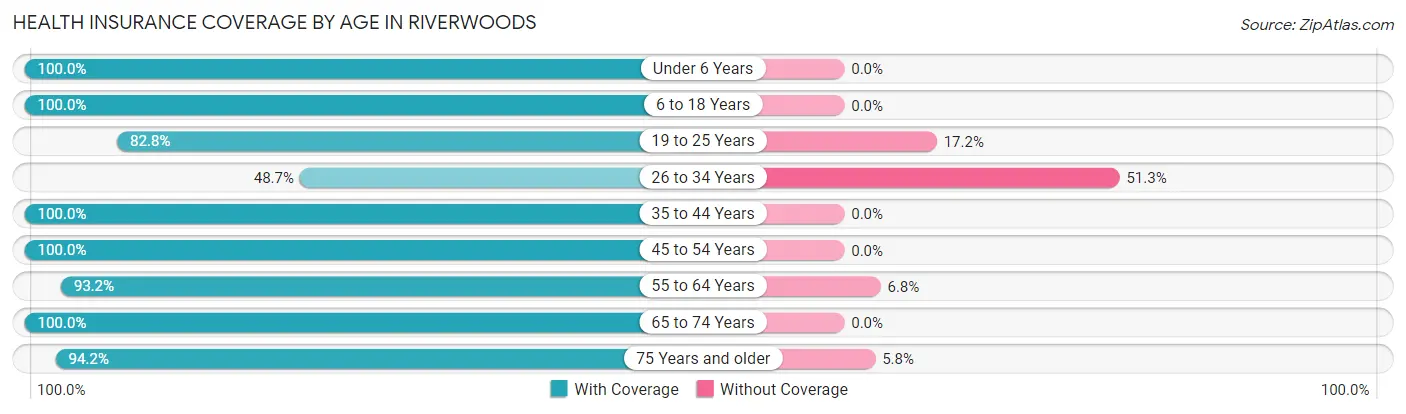
| Age Bracket | With Coverage | Without Coverage |
| Under 6 Years | 206 (100.0%) | 0 (0.0%) |
| 6 to 18 Years | 753 (100.0%) | 0 (0.0%) |
| 19 to 25 Years | 192 (82.8%) | 40 (17.2%) |
| 26 to 34 Years | 37 (48.7%) | 39 (51.3%) |
| 35 to 44 Years | 496 (100.0%) | 0 (0.0%) |
| 45 to 54 Years | 443 (100.0%) | 0 (0.0%) |
| 55 to 64 Years | 772 (93.2%) | 56 (6.8%) |
| 65 to 74 Years | 514 (100.0%) | 0 (0.0%) |
| 75 Years and older | 294 (94.2%) | 18 (5.8%) |
| Total | 3,707 (96.0%) | 153 (4.0%) |
Health Insurance Coverage by Citizenship Status in Riverwoods
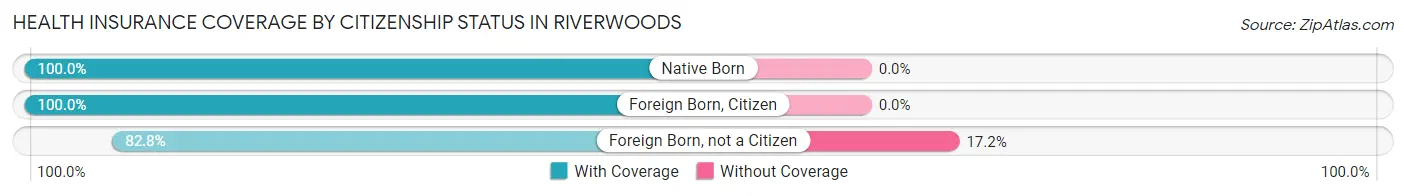
| Citizenship Status | With Coverage | Without Coverage |
| Native Born | 206 (100.0%) | 0 (0.0%) |
| Foreign Born, Citizen | 753 (100.0%) | 0 (0.0%) |
| Foreign Born, not a Citizen | 192 (82.8%) | 40 (17.2%) |
Health Insurance Coverage by Household Income in Riverwoods
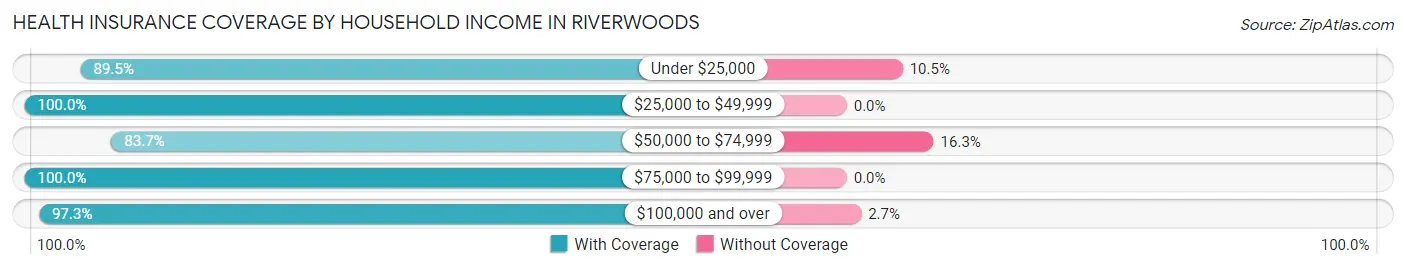
| Household Income | With Coverage | Without Coverage |
| Under $25,000 | 94 (89.5%) | 11 (10.5%) |
| $25,000 to $49,999 | 164 (100.0%) | 0 (0.0%) |
| $50,000 to $74,999 | 247 (83.7%) | 48 (16.3%) |
| $75,000 to $99,999 | 61 (100.0%) | 0 (0.0%) |
| $100,000 and over | 3,138 (97.3%) | 87 (2.7%) |
Public vs Private Health Insurance Coverage by Age in Riverwoods
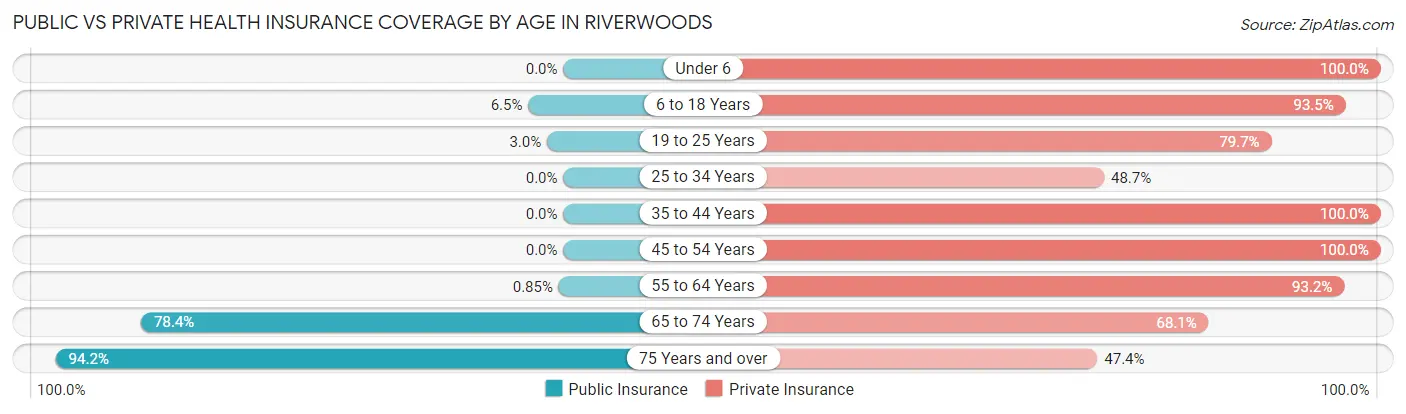
| Age Bracket | Public Insurance | Private Insurance |
| Under 6 | 0 (0.0%) | 206 (100.0%) |
| 6 to 18 Years | 49 (6.5%) | 704 (93.5%) |
| 19 to 25 Years | 7 (3.0%) | 185 (79.7%) |
| 25 to 34 Years | 0 (0.0%) | 37 (48.7%) |
| 35 to 44 Years | 0 (0.0%) | 496 (100.0%) |
| 45 to 54 Years | 0 (0.0%) | 443 (100.0%) |
| 55 to 64 Years | 7 (0.9%) | 772 (93.2%) |
| 65 to 74 Years | 403 (78.4%) | 350 (68.1%) |
| 75 Years and over | 294 (94.2%) | 148 (47.4%) |
| Total | 760 (19.7%) | 3,341 (86.6%) |
Disability Status by Sex by Age in Riverwoods
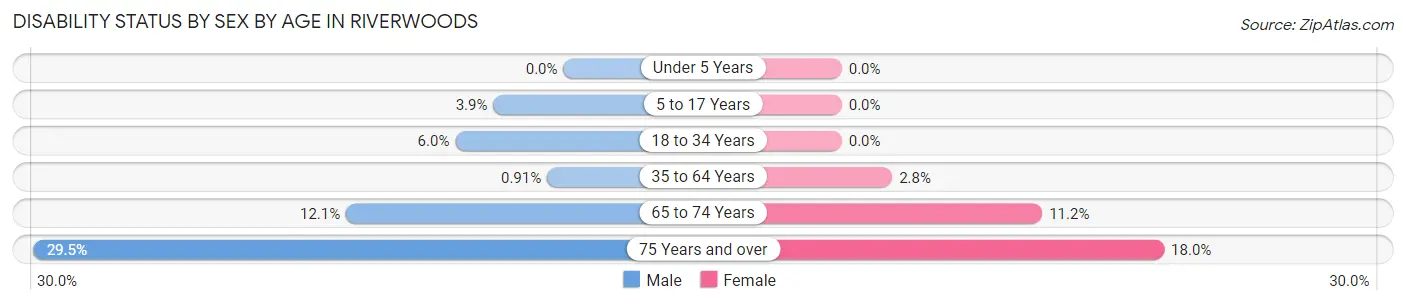
| Age Bracket | Male | Female |
| Under 5 Years | 0 (0.0%) | 0 (0.0%) |
| 5 to 17 Years | 15 (3.9%) | 0 (0.0%) |
| 18 to 34 Years | 10 (6.0%) | 0 (0.0%) |
| 35 to 64 Years | 8 (0.9%) | 25 (2.8%) |
| 65 to 74 Years | 34 (12.1%) | 26 (11.2%) |
| 75 Years and over | 46 (29.5%) | 28 (17.9%) |
Disability Class by Sex by Age in Riverwoods
Disability Class: Hearing Difficulty
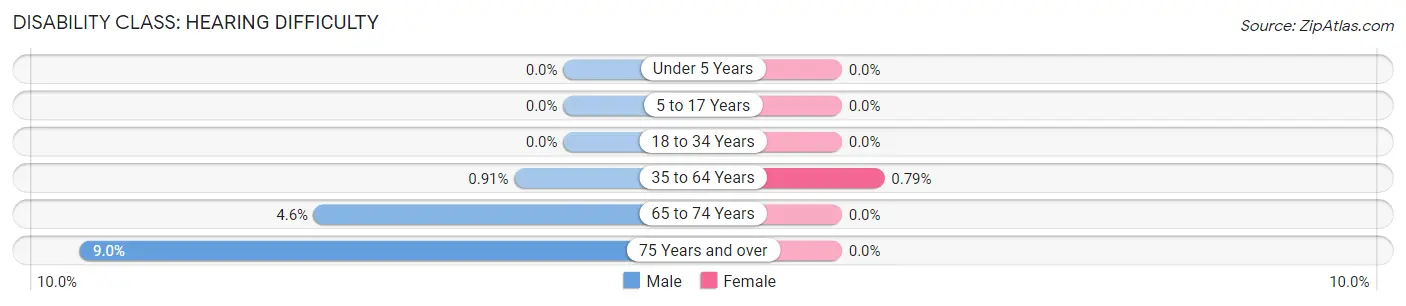
| Age Bracket | Male | Female |
| Under 5 Years | 0 (0.0%) | 0 (0.0%) |
| 5 to 17 Years | 0 (0.0%) | 0 (0.0%) |
| 18 to 34 Years | 0 (0.0%) | 0 (0.0%) |
| 35 to 64 Years | 8 (0.9%) | 7 (0.8%) |
| 65 to 74 Years | 13 (4.6%) | 0 (0.0%) |
| 75 Years and over | 14 (9.0%) | 0 (0.0%) |
Disability Class: Vision Difficulty
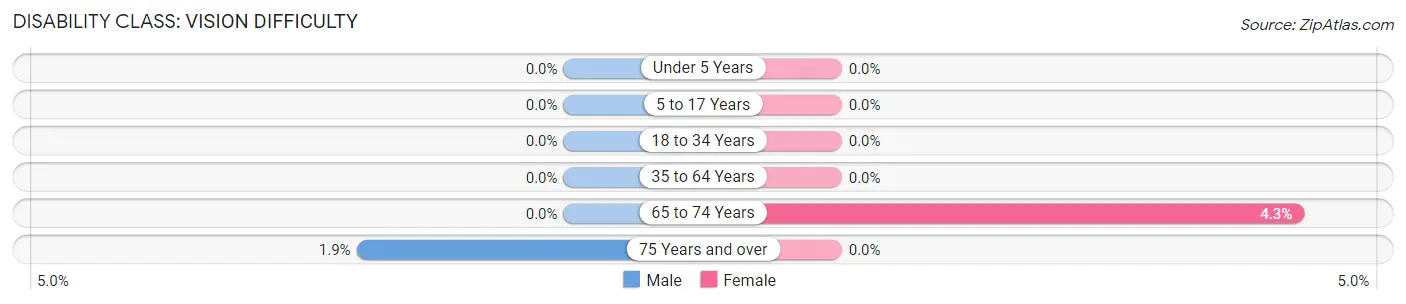
| Age Bracket | Male | Female |
| Under 5 Years | 0 (0.0%) | 0 (0.0%) |
| 5 to 17 Years | 0 (0.0%) | 0 (0.0%) |
| 18 to 34 Years | 0 (0.0%) | 0 (0.0%) |
| 35 to 64 Years | 0 (0.0%) | 0 (0.0%) |
| 65 to 74 Years | 0 (0.0%) | 10 (4.3%) |
| 75 Years and over | 3 (1.9%) | 0 (0.0%) |
Disability Class: Cognitive Difficulty
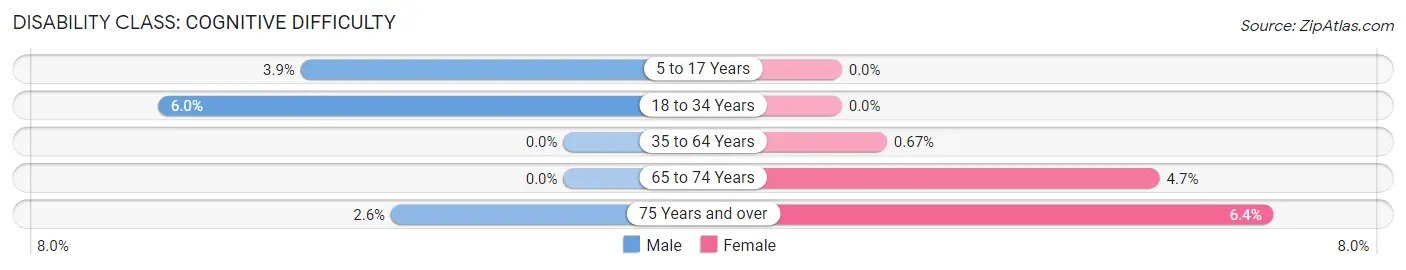
| Age Bracket | Male | Female |
| 5 to 17 Years | 15 (3.9%) | 0 (0.0%) |
| 18 to 34 Years | 10 (6.0%) | 0 (0.0%) |
| 35 to 64 Years | 0 (0.0%) | 6 (0.7%) |
| 65 to 74 Years | 0 (0.0%) | 11 (4.7%) |
| 75 Years and over | 4 (2.6%) | 10 (6.4%) |
Disability Class: Ambulatory Difficulty
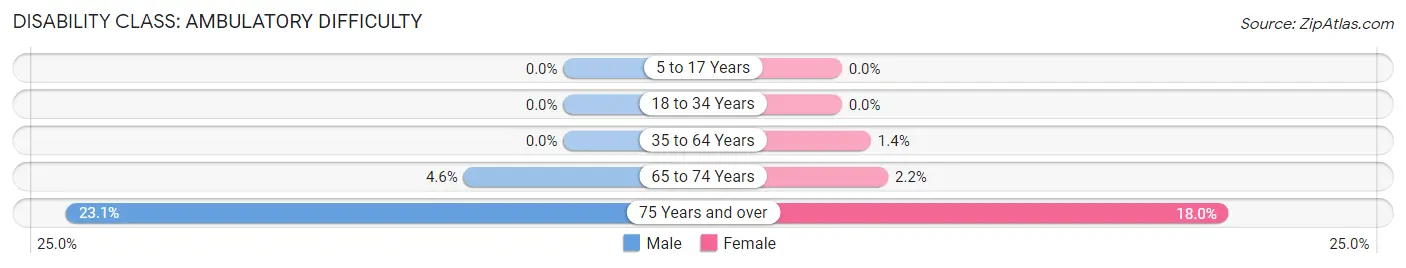
| Age Bracket | Male | Female |
| 5 to 17 Years | 0 (0.0%) | 0 (0.0%) |
| 18 to 34 Years | 0 (0.0%) | 0 (0.0%) |
| 35 to 64 Years | 0 (0.0%) | 12 (1.3%) |
| 65 to 74 Years | 13 (4.6%) | 5 (2.1%) |
| 75 Years and over | 36 (23.1%) | 28 (17.9%) |
Disability Class: Self-Care Difficulty
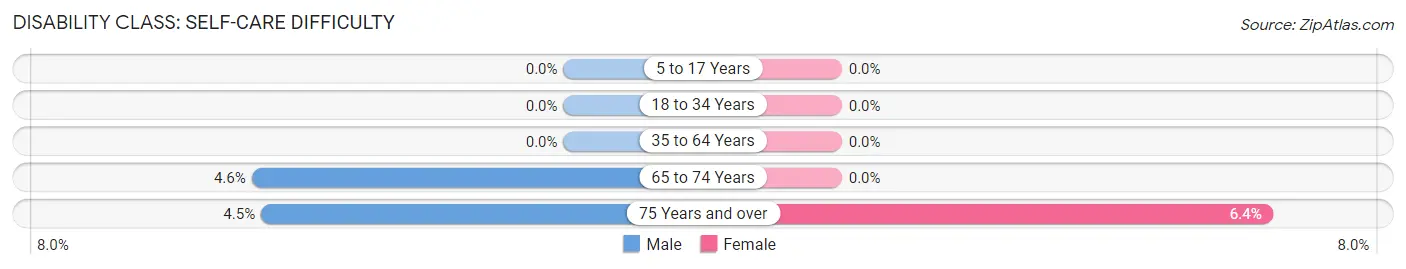
| Age Bracket | Male | Female |
| 5 to 17 Years | 0 (0.0%) | 0 (0.0%) |
| 18 to 34 Years | 0 (0.0%) | 0 (0.0%) |
| 35 to 64 Years | 0 (0.0%) | 0 (0.0%) |
| 65 to 74 Years | 13 (4.6%) | 0 (0.0%) |
| 75 Years and over | 7 (4.5%) | 10 (6.4%) |
Technology Access in Riverwoods
Computing Device Access in Riverwoods
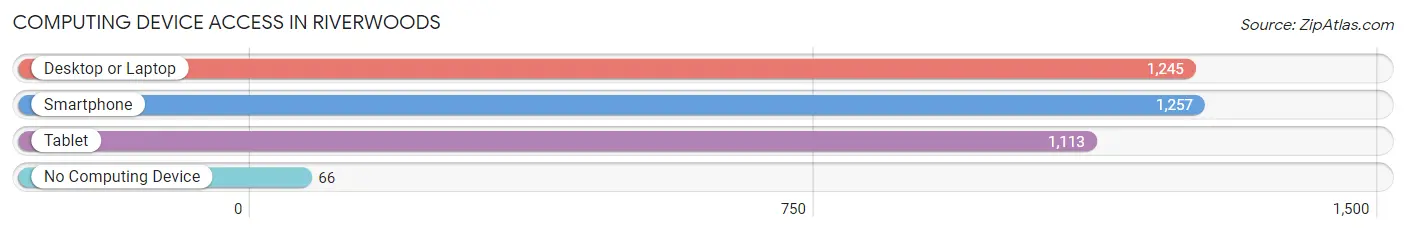
| Device Type | # Households | % Households |
| Desktop or Laptop | 1,245 | 93.0% |
| Smartphone | 1,257 | 93.9% |
| Tablet | 1,113 | 83.1% |
| No Computing Device | 66 | 4.9% |
| Total | 1,339 | 100.0% |
Internet Access in Riverwoods
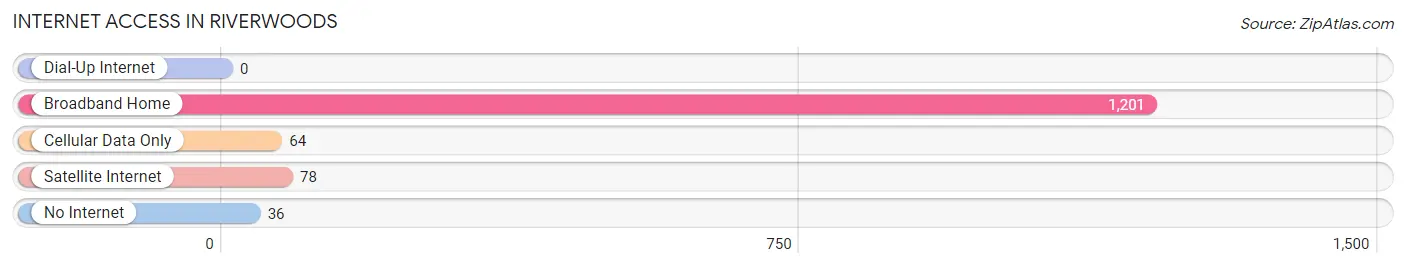
| Internet Type | # Households | % Households |
| Dial-Up Internet | 0 | 0.0% |
| Broadband Home | 1,201 | 89.7% |
| Cellular Data Only | 64 | 4.8% |
| Satellite Internet | 78 | 5.8% |
| No Internet | 36 | 2.7% |
| Total | 1,339 | 100.0% |
Riverwoods Summary
History
Riverwoods, Illinois is a small village located in Lake County, Illinois. It is situated on the Des Plaines River, and is part of the Chicago metropolitan area. The village was first settled in the early 1800s by a group of settlers from New England. The settlers were attracted to the area due to its abundant natural resources, including timber, fish, and game. The village was officially incorporated in 1957, and has since grown to a population of approximately 4,000 people.
Geography
Riverwoods is located in Lake County, Illinois, approximately 25 miles north of Chicago. The village is situated on the Des Plaines River, and is surrounded by the communities of Deerfield, Lincolnshire, and Bannockburn. The village covers an area of approximately 4.5 square miles, and is home to several parks and nature preserves. The village is also home to the Riverwoods Nature Preserve, which is a protected area of wetlands and woodlands.
Economy
Riverwoods is home to a variety of businesses, including retail stores, restaurants, and professional services. The village is also home to several corporate headquarters, including Discover Financial Services, Baxter International, and W.W. Grainger. The village is also home to a number of technology companies, including Motorola Solutions, CDW Corporation, and Allscripts.
Demographics
As of the 2010 census, the population of Riverwoods was 4,099. The racial makeup of the village was 94.3% White, 0.7% African American, 0.2% Native American, 3.2% Asian, and 1.6% from other races. The median household income was $150,000, and the median family income was $170,000. The per capita income was $80,000. The village is home to a variety of religious denominations, including Catholic, Protestant, Jewish, and Muslim.
Riverwoods is a small village with a rich history and a vibrant economy. The village is home to a variety of businesses, and is a popular destination for those looking to escape the hustle and bustle of the city. The village is also home to a number of parks and nature preserves, making it a great place to enjoy the outdoors. With its diverse population and strong economy, Riverwoods is a great place to live and work.
Common Questions
What is Per Capita Income in Riverwoods?
Per Capita income in Riverwoods is $109,852.
What is the Median Family Income in Riverwoods?
Median Family Income in Riverwoods is $250,001.
What is the Median Household income in Riverwoods?
Median Household Income in Riverwoods is $233,036.
What is Income or Wage Gap in Riverwoods?
Income or Wage Gap in Riverwoods is 58.5%.
Women in Riverwoods earn 41.5 cents for every dollar earned by a man.
What is Inequality or Gini Index in Riverwoods?
Inequality or Gini Index in Riverwoods is 0.43.
What is the Total Population of Riverwoods?
Total Population of Riverwoods is 4,007.
What is the Total Male Population of Riverwoods?
Total Male Population of Riverwoods is 2,082.
What is the Total Female Population of Riverwoods?
Total Female Population of Riverwoods is 1,925.
What is the Ratio of Males per 100 Females in Riverwoods?
There are 108.16 Males per 100 Females in Riverwoods.
What is the Ratio of Females per 100 Males in Riverwoods?
There are 92.46 Females per 100 Males in Riverwoods.
What is the Median Population Age in Riverwoods?
Median Population Age in Riverwoods is 51.2 Years.
What is the Average Family Size in Riverwoods
Average Family Size in Riverwoods is 3.1 People.
What is the Average Household Size in Riverwoods
Average Household Size in Riverwoods is 2.9 People.
How Large is the Labor Force in Riverwoods?
There are 1,798 People in the Labor Forcein in Riverwoods.
What is the Percentage of People in the Labor Force in Riverwoods?
56.1% of People are in the Labor Force in Riverwoods.
What is the Unemployment Rate in Riverwoods?
Unemployment Rate in Riverwoods is 1.2%.