Glen Carbon, IL Map & Demographics
Glen Carbon Map
Glen Carbon Overview
$50,432
PER CAPITA INCOME
$121,322
AVG FAMILY INCOME
$92,002
AVG HOUSEHOLD INCOME
25.7%
WAGE / INCOME GAP [ % ]
74.3¢/ $1
WAGE / INCOME GAP [ $ ]
0.43
INEQUALITY / GINI INDEX
13,654
TOTAL POPULATION
6,892
MALE POPULATION
6,762
FEMALE POPULATION
101.92
MALES / 100 FEMALES
98.11
FEMALES / 100 MALES
38.8
MEDIAN AGE
2.9
AVG FAMILY SIZE
2.4
AVG HOUSEHOLD SIZE
7,261
LABOR FORCE [ PEOPLE ]
68.0%
PERCENT IN LABOR FORCE
4.1%
UNEMPLOYMENT RATE
Glen Carbon Zip Codes
Glen Carbon Area Codes
Income in Glen Carbon
Income Overview in Glen Carbon
Per Capita Income in Glen Carbon is $50,432, while median incomes of families and households are $121,322 and $92,002 respectively.
| Characteristic | Number | Measure |
| Per Capita Income | 13,654 | $50,432 |
| Median Family Income | 3,833 | $121,322 |
| Mean Family Income | 3,833 | $139,722 |
| Median Household Income | 5,559 | $92,002 |
| Mean Household Income | 5,559 | $122,957 |
| Income Deficit | 3,833 | $0 |
| Wage / Income Gap (%) | 13,654 | 25.69% |
| Wage / Income Gap ($) | 13,654 | 74.31¢ per $1 |
| Gini / Inequality Index | 13,654 | 0.43 |
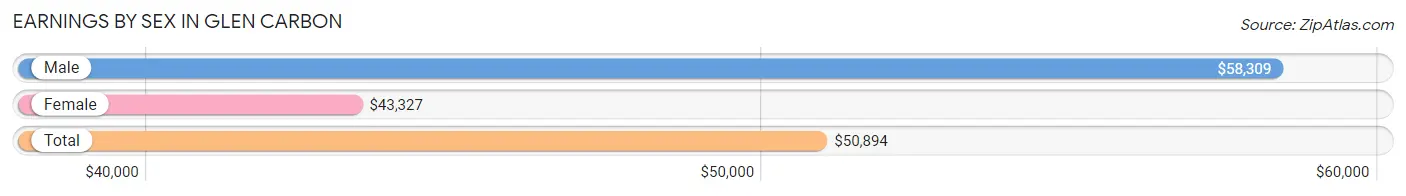
Earnings by Sex in Glen Carbon
Average Earnings in Glen Carbon are $50,894, $58,309 for men and $43,327 for women, a difference of 25.7%.
| Sex | Number | Average Earnings |
| Male | 4,234 (57.0%) | $58,309 |
| Female | 3,199 (43.0%) | $43,327 |
| Total | 7,433 (100.0%) | $50,894 |
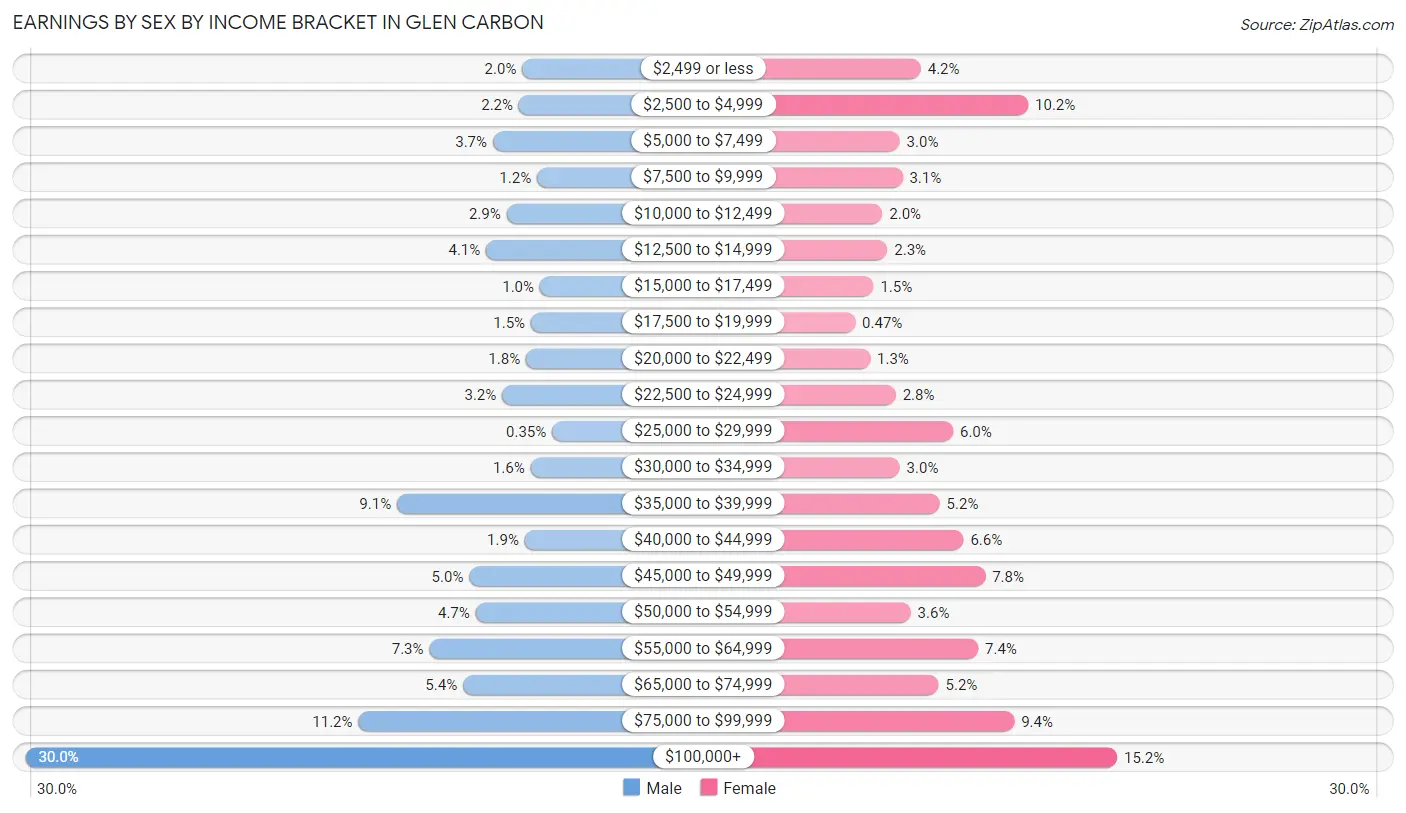
Earnings by Sex by Income Bracket in Glen Carbon
The most common earnings brackets in Glen Carbon are $100,000+ for men (1,268 | 29.9%) and $100,000+ for women (486 | 15.2%).
| Income | Male | Female |
| $2,499 or less | 86 (2.0%) | 133 (4.2%) |
| $2,500 to $4,999 | 94 (2.2%) | 326 (10.2%) |
| $5,000 to $7,499 | 156 (3.7%) | 95 (3.0%) |
| $7,500 to $9,999 | 51 (1.2%) | 100 (3.1%) |
| $10,000 to $12,499 | 123 (2.9%) | 64 (2.0%) |
| $12,500 to $14,999 | 172 (4.1%) | 73 (2.3%) |
| $15,000 to $17,499 | 44 (1.0%) | 48 (1.5%) |
| $17,500 to $19,999 | 65 (1.5%) | 15 (0.5%) |
| $20,000 to $22,499 | 77 (1.8%) | 42 (1.3%) |
| $22,500 to $24,999 | 134 (3.2%) | 88 (2.8%) |
| $25,000 to $29,999 | 15 (0.4%) | 191 (6.0%) |
| $30,000 to $34,999 | 66 (1.6%) | 95 (3.0%) |
| $35,000 to $39,999 | 384 (9.1%) | 167 (5.2%) |
| $40,000 to $44,999 | 80 (1.9%) | 210 (6.6%) |
| $45,000 to $49,999 | 212 (5.0%) | 249 (7.8%) |
| $50,000 to $54,999 | 197 (4.6%) | 115 (3.6%) |
| $55,000 to $64,999 | 307 (7.2%) | 236 (7.4%) |
| $65,000 to $74,999 | 227 (5.4%) | 165 (5.2%) |
| $75,000 to $99,999 | 476 (11.2%) | 301 (9.4%) |
| $100,000+ | 1,268 (29.9%) | 486 (15.2%) |
| Total | 4,234 (100.0%) | 3,199 (100.0%) |
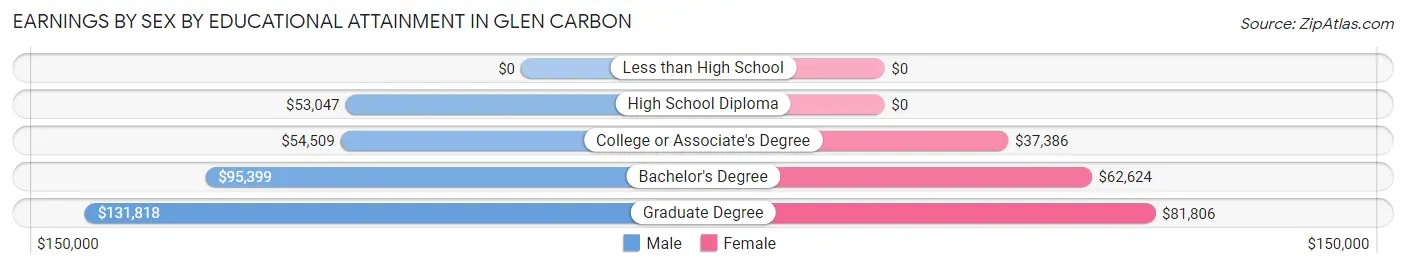
Earnings by Sex by Educational Attainment in Glen Carbon
Average earnings in Glen Carbon are $74,895 for men and $48,750 for women, a difference of 34.9%. Men with an educational attainment of graduate degree enjoy the highest average annual earnings of $131,818, while those with high school diploma education earn the least with $53,047. Women with an educational attainment of graduate degree earn the most with the average annual earnings of $81,806, while those with college or associate's degree education have the smallest earnings of $37,386.
| Educational Attainment | Male Income | Female Income |
| Less than High School | - | - |
| High School Diploma | $53,047 | $0 |
| College or Associate's Degree | $54,509 | $37,386 |
| Bachelor's Degree | $95,399 | $62,624 |
| Graduate Degree | $131,818 | $81,806 |
| Total | $74,895 | $48,750 |
Family Income in Glen Carbon
Family Income Brackets in Glen Carbon
According to the Glen Carbon family income data, there are 878 families falling into the $200,000+ income range, which is the most common income bracket and makes up 22.9% of all families.
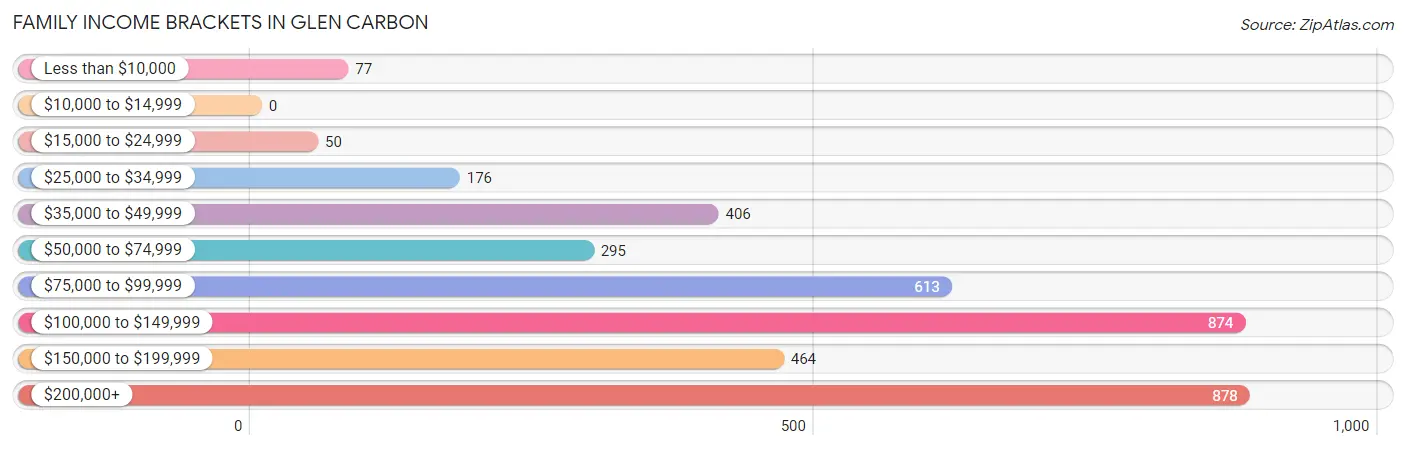
| Income Bracket | # Families | % Families |
| Less than $10,000 | 77 | 2.0% |
| $10,000 to $14,999 | 0 | 0.0% |
| $15,000 to $24,999 | 50 | 1.3% |
| $25,000 to $34,999 | 176 | 4.6% |
| $35,000 to $49,999 | 406 | 10.6% |
| $50,000 to $74,999 | 295 | 7.7% |
| $75,000 to $99,999 | 613 | 16.0% |
| $100,000 to $149,999 | 874 | 22.8% |
| $150,000 to $199,999 | 464 | 12.1% |
| $200,000+ | 878 | 22.9% |
Family Income by Famaliy Size in Glen Carbon
5-person families (252 | 6.6%) account for the highest median family income in Glen Carbon with $173,194 per family, while 2-person families (1,733 | 45.2%) have the highest median income of $46,016 per family member.
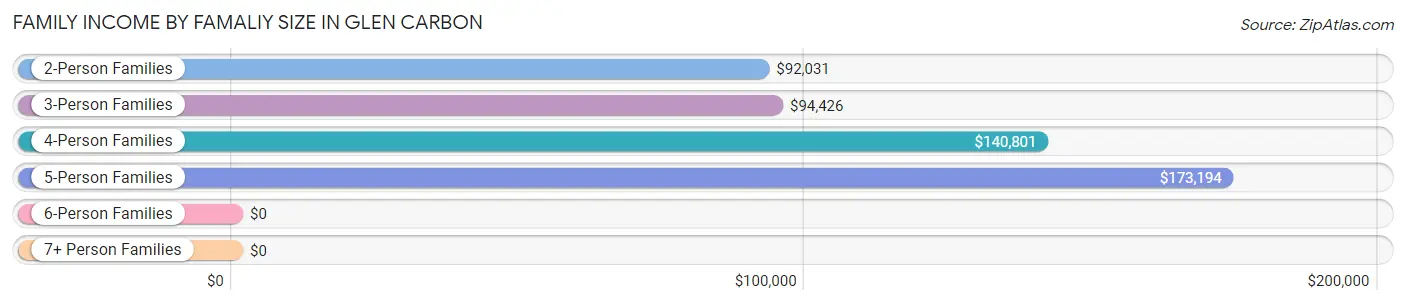
| Income Bracket | # Families | Median Income |
| 2-Person Families | 1,733 (45.2%) | $92,031 |
| 3-Person Families | 1,003 (26.2%) | $94,426 |
| 4-Person Families | 815 (21.3%) | $140,801 |
| 5-Person Families | 252 (6.6%) | $173,194 |
| 6-Person Families | 8 (0.2%) | $0 |
| 7+ Person Families | 22 (0.6%) | $0 |
| Total | 3,833 (100.0%) | $121,322 |
Family Income by Number of Earners in Glen Carbon
The median family income in Glen Carbon is $121,322, with families comprising 3+ earners (473) having the highest median family income of $162,697, while families with 1 earner (1,511) have the lowest median family income of $83,587, accounting for 12.3% and 39.4% of families, respectively.
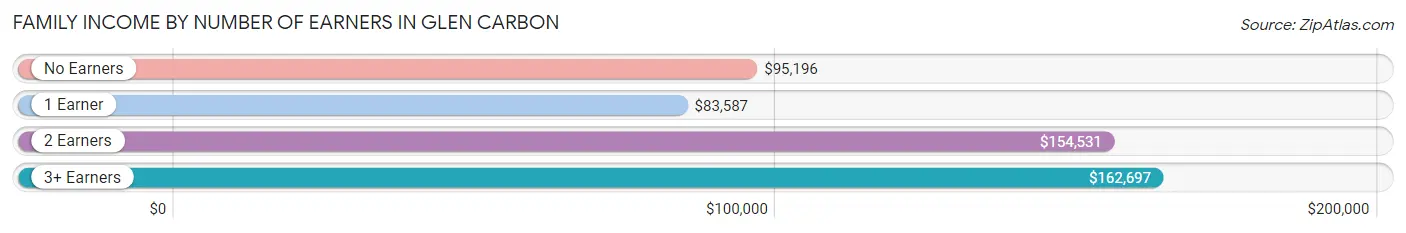
| Number of Earners | # Families | Median Income |
| No Earners | 429 (11.2%) | $95,196 |
| 1 Earner | 1,511 (39.4%) | $83,587 |
| 2 Earners | 1,420 (37.0%) | $154,531 |
| 3+ Earners | 473 (12.3%) | $162,697 |
| Total | 3,833 (100.0%) | $121,322 |
Household Income in Glen Carbon
Household Income Brackets in Glen Carbon
With 1,028 households falling in the category, the $100,000 to $149,999 income range is the most frequent in Glen Carbon, accounting for 18.5% of all households. In contrast, only 28 households (0.5%) fall into the $10,000 to $14,999 income bracket, making it the least populous group.
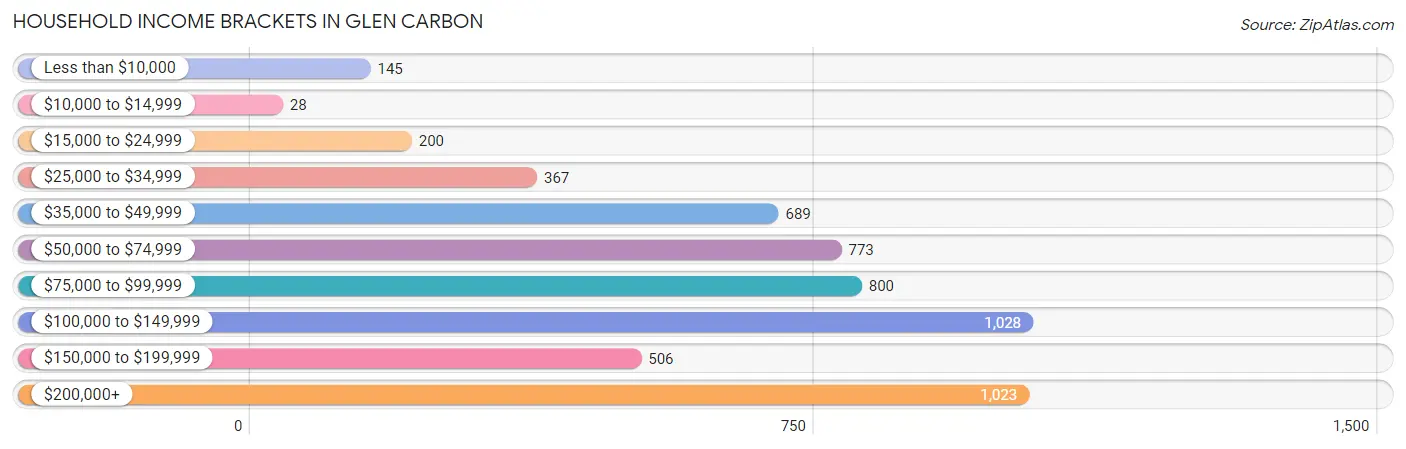
| Income Bracket | # Households | % Households |
| Less than $10,000 | 145 | 2.6% |
| $10,000 to $14,999 | 28 | 0.5% |
| $15,000 to $24,999 | 200 | 3.6% |
| $25,000 to $34,999 | 367 | 6.6% |
| $35,000 to $49,999 | 689 | 12.4% |
| $50,000 to $74,999 | 773 | 13.9% |
| $75,000 to $99,999 | 800 | 14.4% |
| $100,000 to $149,999 | 1,028 | 18.5% |
| $150,000 to $199,999 | 506 | 9.1% |
| $200,000+ | 1,023 | 18.4% |
Household Income by Householder Age in Glen Carbon
The median household income in Glen Carbon is $92,002, with the highest median household income of $127,782 found in the 45 to 64 years age bracket for the primary householder. A total of 1,763 households (31.7%) fall into this category. Meanwhile, the 15 to 24 years age bracket for the primary householder has the lowest median household income of $50,615, with 339 households (6.1%) in this group.
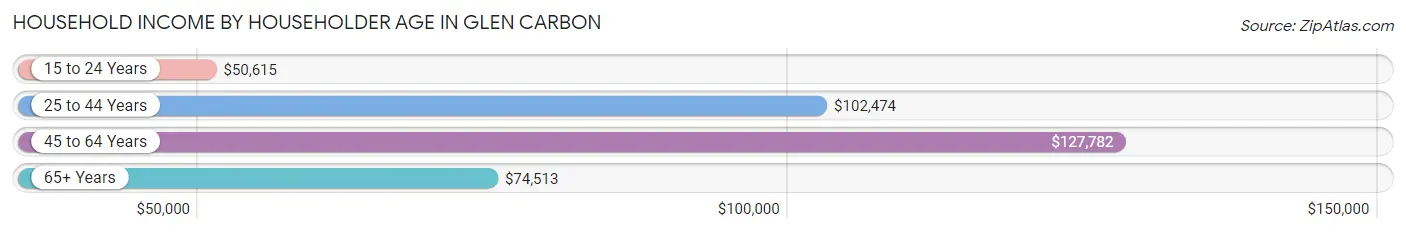
| Income Bracket | # Households | Median Income |
| 15 to 24 Years | 339 (6.1%) | $50,615 |
| 25 to 44 Years | 1,914 (34.4%) | $102,474 |
| 45 to 64 Years | 1,763 (31.7%) | $127,782 |
| 65+ Years | 1,543 (27.8%) | $74,513 |
| Total | 5,559 (100.0%) | $92,002 |
Poverty in Glen Carbon
Income Below Poverty by Sex and Age in Glen Carbon
With 8.6% poverty level for males and 6.2% for females among the residents of Glen Carbon, 5 year old males and 25 to 34 year old females are the most vulnerable to poverty, with 52 males (28.4%) and 136 females (21.6%) in their respective age groups living below the poverty level.
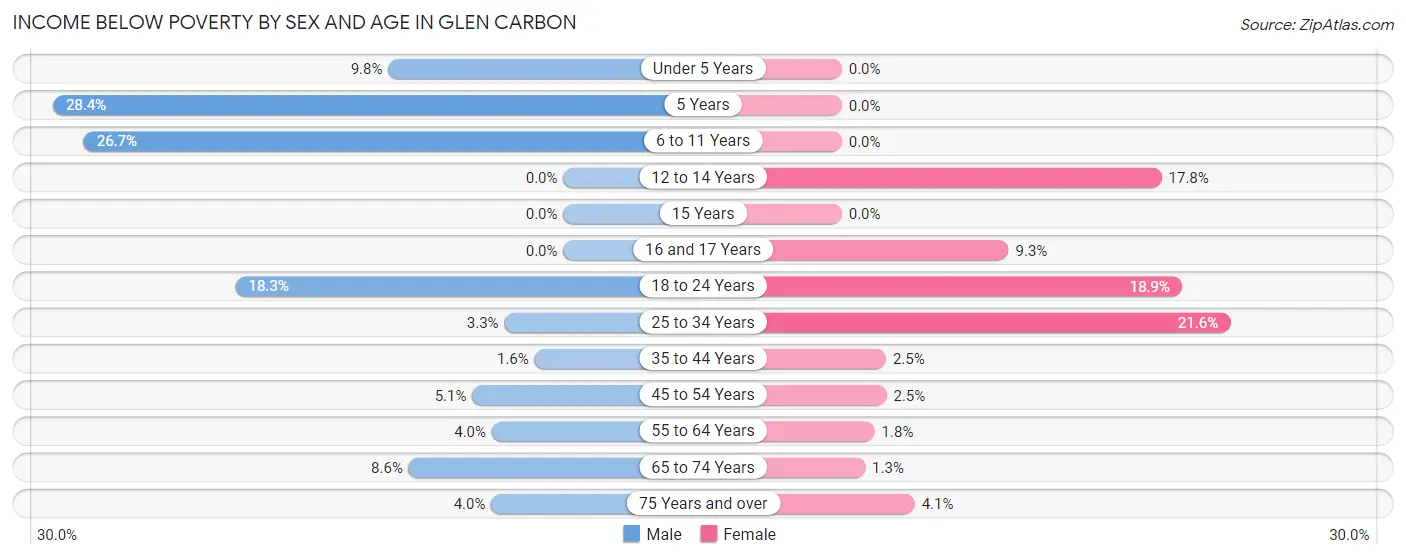
| Age Bracket | Male | Female |
| Under 5 Years | 47 (9.8%) | 0 (0.0%) |
| 5 Years | 52 (28.4%) | 0 (0.0%) |
| 6 to 11 Years | 165 (26.7%) | 0 (0.0%) |
| 12 to 14 Years | 0 (0.0%) | 52 (17.8%) |
| 15 Years | 0 (0.0%) | 0 (0.0%) |
| 16 and 17 Years | 0 (0.0%) | 21 (9.3%) |
| 18 to 24 Years | 142 (18.2%) | 106 (18.9%) |
| 25 to 34 Years | 30 (3.3%) | 136 (21.6%) |
| 35 to 44 Years | 15 (1.6%) | 22 (2.5%) |
| 45 to 54 Years | 40 (5.1%) | 22 (2.5%) |
| 55 to 64 Years | 29 (4.0%) | 14 (1.8%) |
| 65 to 74 Years | 54 (8.6%) | 8 (1.3%) |
| 75 Years and over | 15 (4.0%) | 29 (4.1%) |
| Total | 589 (8.6%) | 410 (6.2%) |
Income Above Poverty by Sex and Age in Glen Carbon
According to the poverty statistics in Glen Carbon, males aged 12 to 14 years and females aged under 5 years are the age groups that are most secure financially, with 100.0% of males and 100.0% of females in these age groups living above the poverty line.
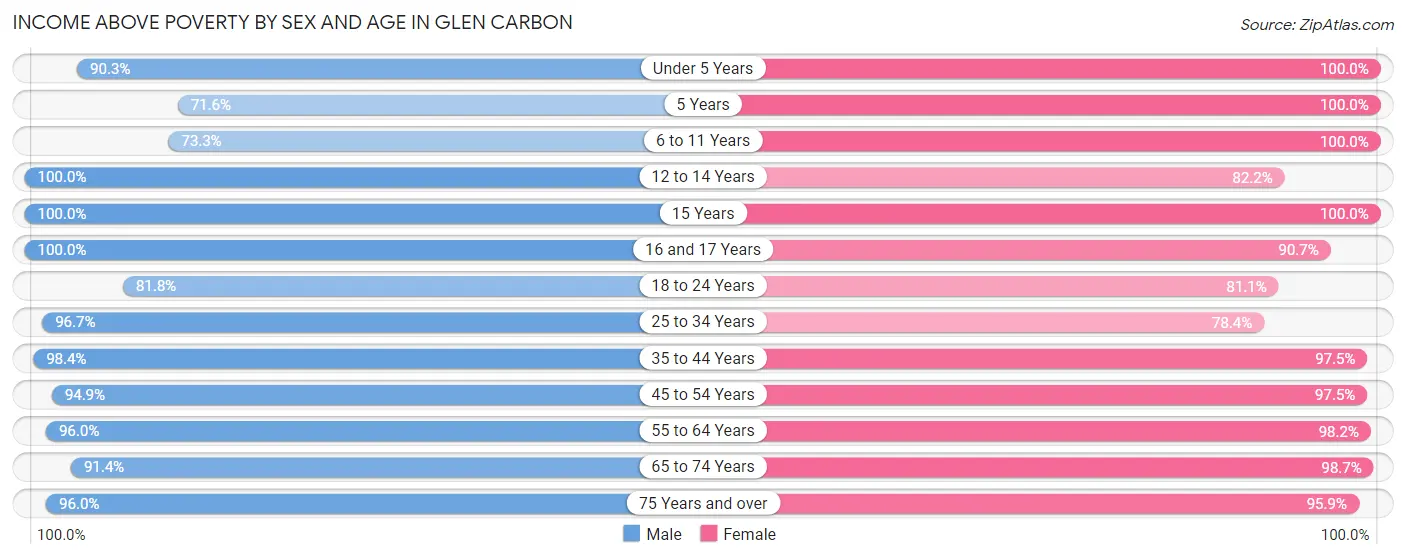
| Age Bracket | Male | Female |
| Under 5 Years | 435 (90.2%) | 315 (100.0%) |
| 5 Years | 131 (71.6%) | 108 (100.0%) |
| 6 to 11 Years | 453 (73.3%) | 591 (100.0%) |
| 12 to 14 Years | 254 (100.0%) | 240 (82.2%) |
| 15 Years | 63 (100.0%) | 38 (100.0%) |
| 16 and 17 Years | 91 (100.0%) | 205 (90.7%) |
| 18 to 24 Years | 636 (81.8%) | 454 (81.1%) |
| 25 to 34 Years | 886 (96.7%) | 493 (78.4%) |
| 35 to 44 Years | 921 (98.4%) | 871 (97.5%) |
| 45 to 54 Years | 749 (94.9%) | 860 (97.5%) |
| 55 to 64 Years | 699 (96.0%) | 749 (98.2%) |
| 65 to 74 Years | 573 (91.4%) | 607 (98.7%) |
| 75 Years and over | 359 (96.0%) | 685 (95.9%) |
| Total | 6,250 (91.4%) | 6,216 (93.8%) |
Income Below Poverty Among Married-Couple Families in Glen Carbon
The poverty statistics for married-couple families in Glen Carbon show that 1.3% or 35 of the total 2,613 families live below the poverty line. Families with 1 or 2 children have the highest poverty rate of 2.2%, comprising of 22 families. On the other hand, families with 3 or 4 children have the lowest poverty rate of 0.0%, which includes 0 families.
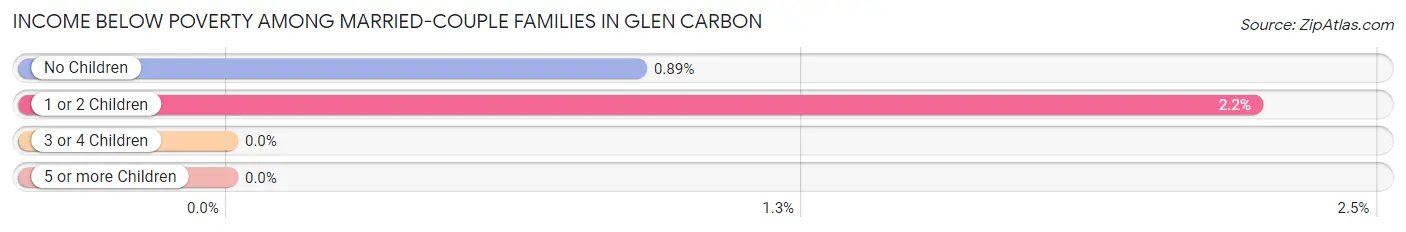
| Children | Above Poverty | Below Poverty |
| No Children | 1,440 (99.1%) | 13 (0.9%) |
| 1 or 2 Children | 965 (97.8%) | 22 (2.2%) |
| 3 or 4 Children | 173 (100.0%) | 0 (0.0%) |
| 5 or more Children | 0 (0.0%) | 0 (0.0%) |
| Total | 2,578 (98.7%) | 35 (1.3%) |
Income Below Poverty Among Single-Parent Households in Glen Carbon
According to the poverty data in Glen Carbon, 4.6% or 22 single-father households and 15.3% or 113 single-mother households are living below the poverty line. Among single-father households, those with 1 or 2 children have the highest poverty rate, with 22 households (7.6%) experiencing poverty. Likewise, among single-mother households, those with 3 or 4 children have the highest poverty rate, with 59 households (100.0%) falling below the poverty line.
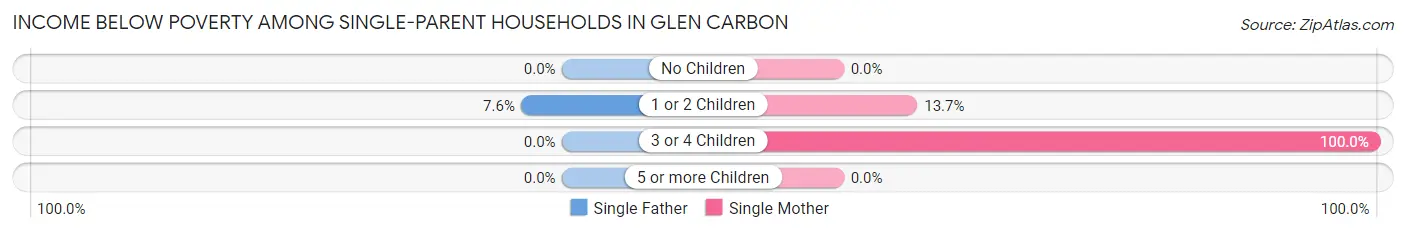
| Children | Single Father | Single Mother |
| No Children | 0 (0.0%) | 0 (0.0%) |
| 1 or 2 Children | 22 (7.6%) | 54 (13.7%) |
| 3 or 4 Children | 0 (0.0%) | 59 (100.0%) |
| 5 or more Children | 0 (0.0%) | 0 (0.0%) |
| Total | 22 (4.6%) | 113 (15.3%) |
Income Below Poverty Among Married-Couple vs Single-Parent Households in Glen Carbon
The poverty data for Glen Carbon shows that 35 of the married-couple family households (1.3%) and 135 of the single-parent households (11.1%) are living below the poverty level. Within the married-couple family households, those with 1 or 2 children have the highest poverty rate, with 22 households (2.2%) falling below the poverty line. Among the single-parent households, those with 3 or 4 children have the highest poverty rate, with 59 household (100.0%) living below poverty.
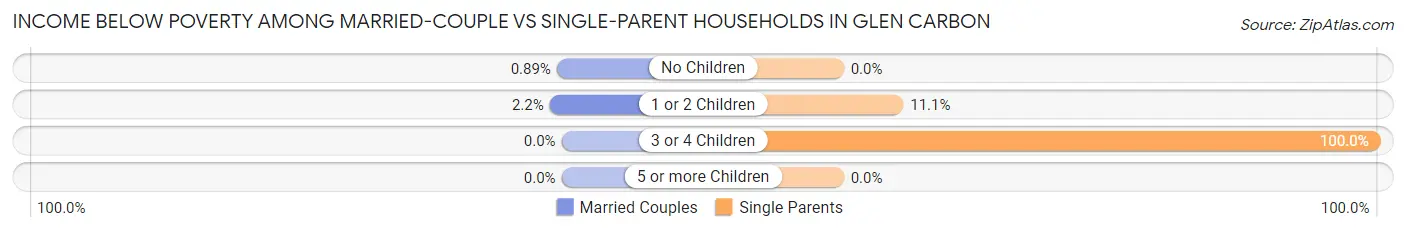
| Children | Married-Couple Families | Single-Parent Households |
| No Children | 13 (0.9%) | 0 (0.0%) |
| 1 or 2 Children | 22 (2.2%) | 76 (11.1%) |
| 3 or 4 Children | 0 (0.0%) | 59 (100.0%) |
| 5 or more Children | 0 (0.0%) | 0 (0.0%) |
| Total | 35 (1.3%) | 135 (11.1%) |
Race in Glen Carbon
The most populous races in Glen Carbon are White / Caucasian (11,671 | 85.5%), Black / African American (1,044 | 7.6%), and Two or more Races (634 | 4.6%).
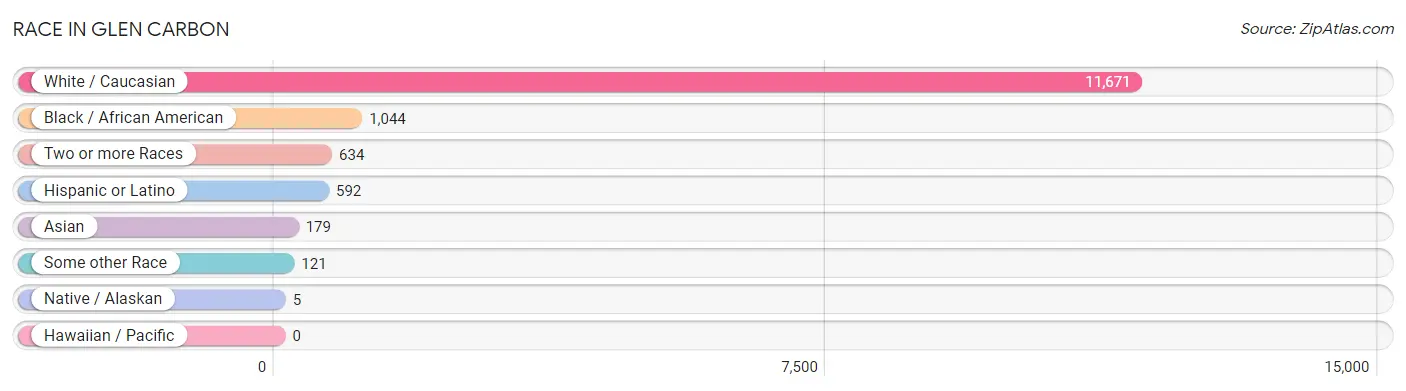
| Race | # Population | % Population |
| Asian | 179 | 1.3% |
| Black / African American | 1,044 | 7.6% |
| Hawaiian / Pacific | 0 | 0.0% |
| Hispanic or Latino | 592 | 4.3% |
| Native / Alaskan | 5 | 0.0% |
| White / Caucasian | 11,671 | 85.5% |
| Two or more Races | 634 | 4.6% |
| Some other Race | 121 | 0.9% |
| Total | 13,654 | 100.0% |
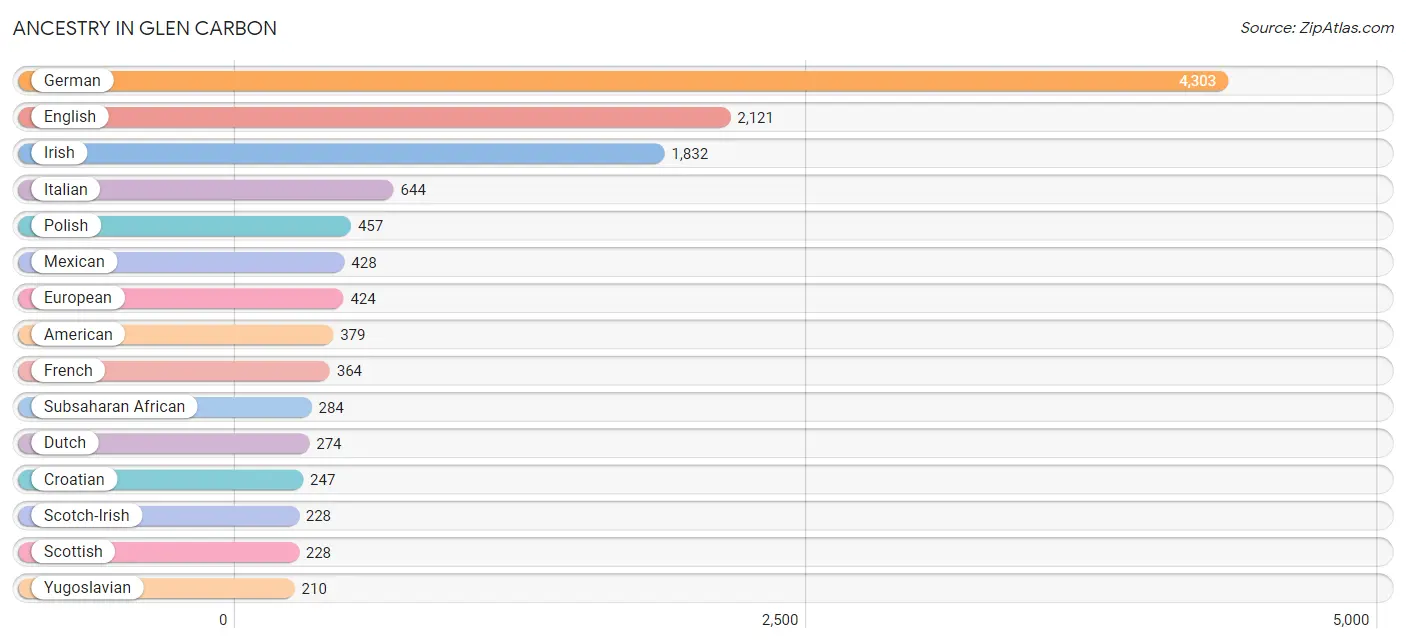
Ancestry in Glen Carbon
The most populous ancestries reported in Glen Carbon are German (4,303 | 31.5%), English (2,121 | 15.5%), Irish (1,832 | 13.4%), Italian (644 | 4.7%), and Polish (457 | 3.4%), together accounting for 68.5% of all Glen Carbon residents.
| Ancestry | # Population | % Population |
| African | 200 | 1.5% |
| American | 379 | 2.8% |
| Arab | 40 | 0.3% |
| Armenian | 20 | 0.2% |
| Austrian | 34 | 0.3% |
| Bahamian | 23 | 0.2% |
| Belgian | 15 | 0.1% |
| British | 66 | 0.5% |
| Bulgarian | 164 | 1.2% |
| Burmese | 58 | 0.4% |
| Cherokee | 18 | 0.1% |
| Colombian | 37 | 0.3% |
| Croatian | 247 | 1.8% |
| Cuban | 99 | 0.7% |
| Czech | 14 | 0.1% |
| Czechoslovakian | 100 | 0.7% |
| Danish | 36 | 0.3% |
| Dutch | 274 | 2.0% |
| Eastern European | 68 | 0.5% |
| Egyptian | 40 | 0.3% |
| English | 2,121 | 15.5% |
| European | 424 | 3.1% |
| French | 364 | 2.7% |
| German | 4,303 | 31.5% |
| Ghanaian | 29 | 0.2% |
| Hungarian | 65 | 0.5% |
| Indian (Asian) | 81 | 0.6% |
| Irish | 1,832 | 13.4% |
| Italian | 644 | 4.7% |
| Korean | 21 | 0.2% |
| Lithuanian | 103 | 0.7% |
| Mexican | 428 | 3.1% |
| Mexican American Indian | 33 | 0.2% |
| Northern European | 129 | 0.9% |
| Norwegian | 96 | 0.7% |
| Polish | 457 | 3.4% |
| Portuguese | 33 | 0.2% |
| Puerto Rican | 28 | 0.2% |
| Russian | 50 | 0.4% |
| Scotch-Irish | 228 | 1.7% |
| Scottish | 228 | 1.7% |
| Slovak | 164 | 1.2% |
| South African | 33 | 0.2% |
| South American | 37 | 0.3% |
| Sri Lankan | 19 | 0.1% |
| Subsaharan African | 284 | 2.1% |
| Swedish | 110 | 0.8% |
| Swiss | 28 | 0.2% |
| Welsh | 79 | 0.6% |
| Yugoslavian | 210 | 1.5% | View All 50 Rows |
Immigrants in Glen Carbon
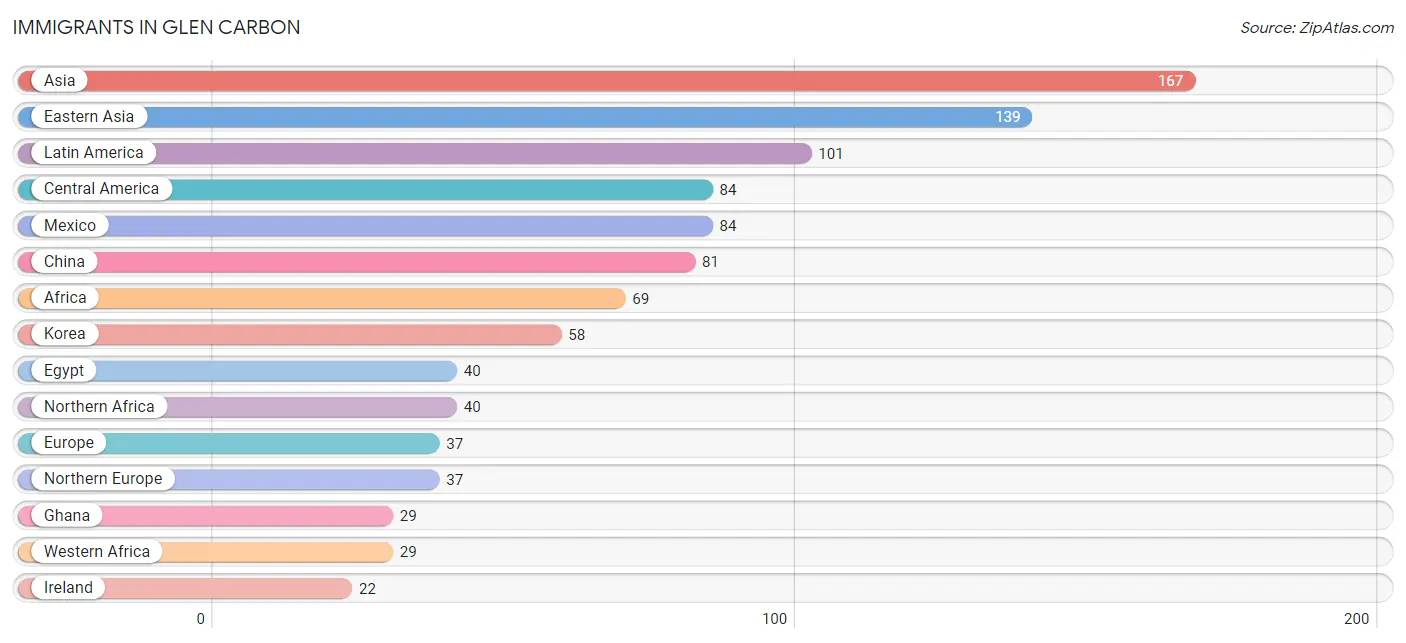
The most numerous immigrant groups reported in Glen Carbon came from Asia (167 | 1.2%), Eastern Asia (139 | 1.0%), Latin America (101 | 0.7%), Central America (84 | 0.6%), and Mexico (84 | 0.6%), together accounting for 4.2% of all Glen Carbon residents.
| Immigration Origin | # Population | % Population |
| Africa | 69 | 0.5% |
| Asia | 167 | 1.2% |
| Brazil | 17 | 0.1% |
| Canada | 21 | 0.2% |
| Central America | 84 | 0.6% |
| China | 81 | 0.6% |
| Eastern Asia | 139 | 1.0% |
| Egypt | 40 | 0.3% |
| Europe | 37 | 0.3% |
| Ghana | 29 | 0.2% |
| Ireland | 22 | 0.2% |
| Korea | 58 | 0.4% |
| Latin America | 101 | 0.7% |
| Lebanon | 7 | 0.1% |
| Mexico | 84 | 0.6% |
| Northern Africa | 40 | 0.3% |
| Northern Europe | 37 | 0.3% |
| Philippines | 21 | 0.2% |
| South America | 17 | 0.1% |
| South Eastern Asia | 21 | 0.2% |
| Taiwan | 21 | 0.2% |
| Western Africa | 29 | 0.2% |
| Western Asia | 7 | 0.1% | View All 23 Rows |
Sex and Age in Glen Carbon
Sex and Age in Glen Carbon
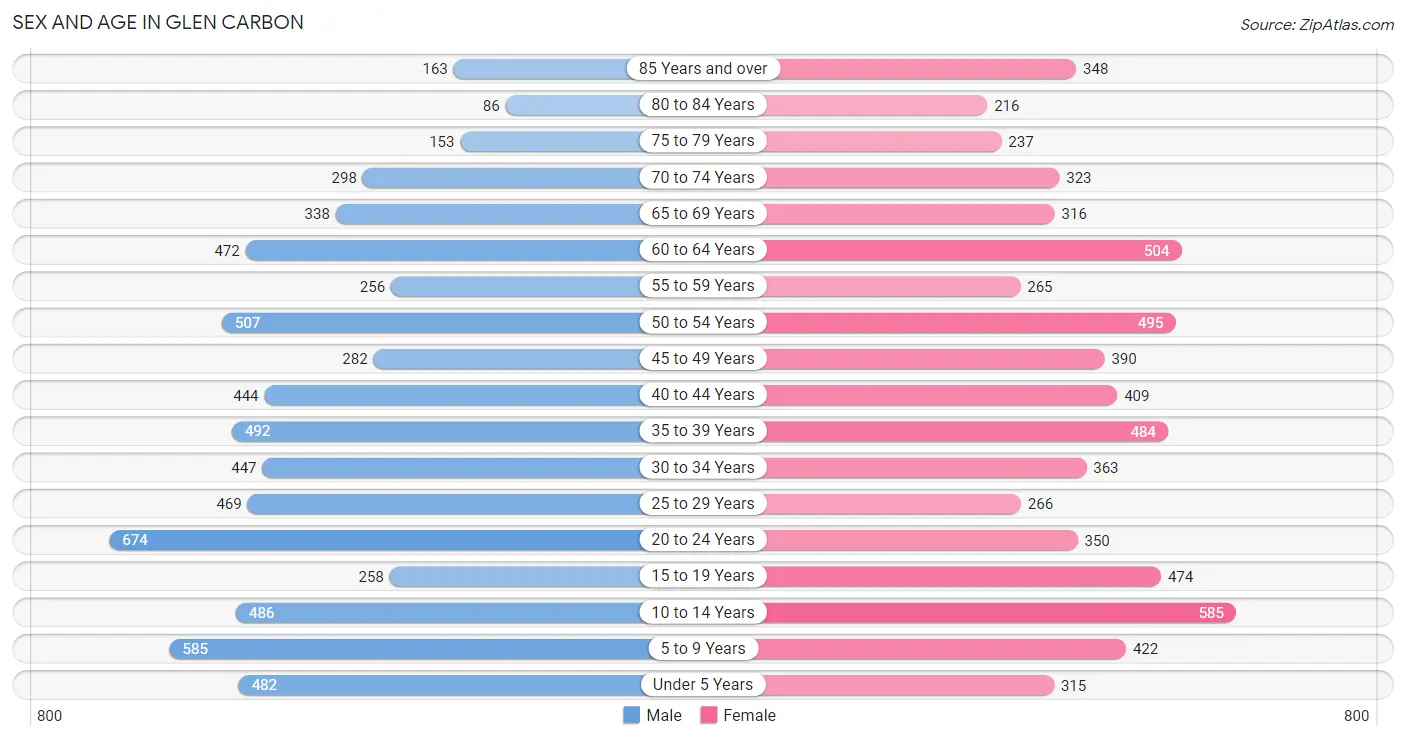
The most populous age groups in Glen Carbon are 20 to 24 Years (674 | 9.8%) for men and 10 to 14 Years (585 | 8.6%) for women.
| Age Bracket | Male | Female |
| Under 5 Years | 482 (7.0%) | 315 (4.7%) |
| 5 to 9 Years | 585 (8.5%) | 422 (6.2%) |
| 10 to 14 Years | 486 (7.0%) | 585 (8.6%) |
| 15 to 19 Years | 258 (3.7%) | 474 (7.0%) |
| 20 to 24 Years | 674 (9.8%) | 350 (5.2%) |
| 25 to 29 Years | 469 (6.8%) | 266 (3.9%) |
| 30 to 34 Years | 447 (6.5%) | 363 (5.4%) |
| 35 to 39 Years | 492 (7.1%) | 484 (7.2%) |
| 40 to 44 Years | 444 (6.4%) | 409 (6.0%) |
| 45 to 49 Years | 282 (4.1%) | 390 (5.8%) |
| 50 to 54 Years | 507 (7.4%) | 495 (7.3%) |
| 55 to 59 Years | 256 (3.7%) | 265 (3.9%) |
| 60 to 64 Years | 472 (6.9%) | 504 (7.4%) |
| 65 to 69 Years | 338 (4.9%) | 316 (4.7%) |
| 70 to 74 Years | 298 (4.3%) | 323 (4.8%) |
| 75 to 79 Years | 153 (2.2%) | 237 (3.5%) |
| 80 to 84 Years | 86 (1.3%) | 216 (3.2%) |
| 85 Years and over | 163 (2.4%) | 348 (5.1%) |
| Total | 6,892 (100.0%) | 6,762 (100.0%) |
Families and Households in Glen Carbon
Median Family Size in Glen Carbon
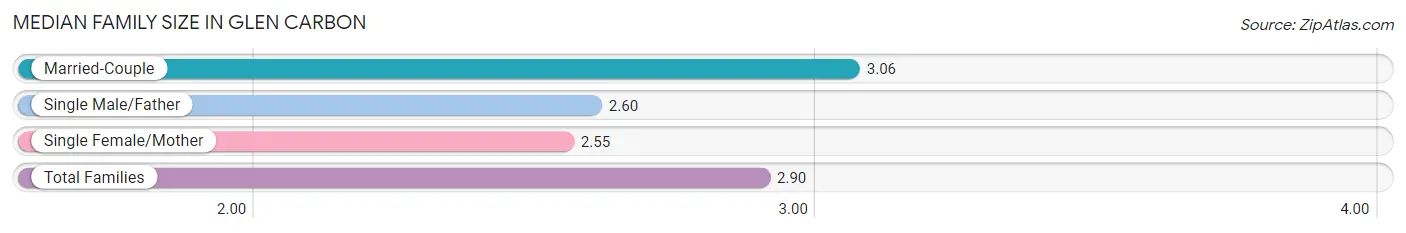
The median family size in Glen Carbon is 2.90 persons per family, with married-couple families (2,613 | 68.2%) accounting for the largest median family size of 3.06 persons per family. On the other hand, single female/mother families (739 | 19.3%) represent the smallest median family size with 2.55 persons per family.
| Family Type | # Families | Family Size |
| Married-Couple | 2,613 (68.2%) | 3.06 |
| Single Male/Father | 481 (12.6%) | 2.60 |
| Single Female/Mother | 739 (19.3%) | 2.55 |
| Total Families | 3,833 (100.0%) | 2.90 |
Median Household Size in Glen Carbon
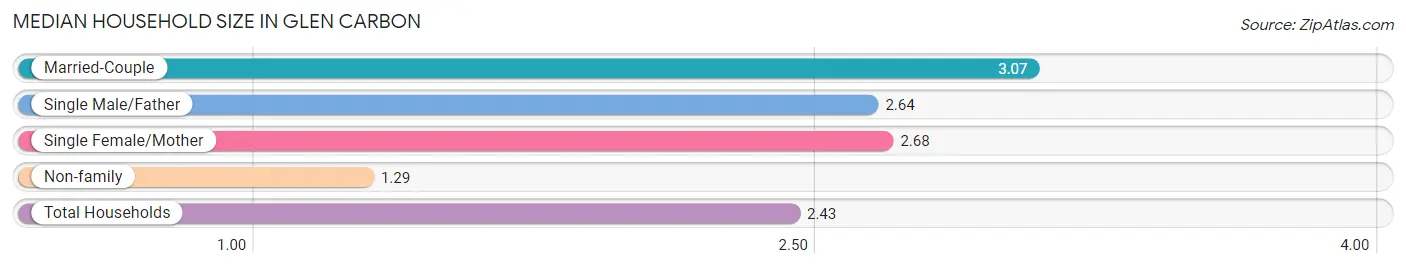
The median household size in Glen Carbon is 2.43 persons per household, with married-couple households (2,613 | 47.0%) accounting for the largest median household size of 3.07 persons per household. non-family households (1,726 | 31.0%) represent the smallest median household size with 1.29 persons per household.
| Household Type | # Households | Household Size |
| Married-Couple | 2,613 (47.0%) | 3.07 |
| Single Male/Father | 481 (8.6%) | 2.64 |
| Single Female/Mother | 739 (13.3%) | 2.68 |
| Non-family | 1,726 (31.0%) | 1.29 |
| Total Households | 5,559 (100.0%) | 2.43 |
Household Size by Marriage Status in Glen Carbon
Out of a total of 5,559 households in Glen Carbon, 3,833 (69.0%) are family households, while 1,726 (31.0%) are nonfamily households. The most numerous type of family households are 2-person households, comprising 1,660, and the most common type of nonfamily households are 1-person households, comprising 1,362.
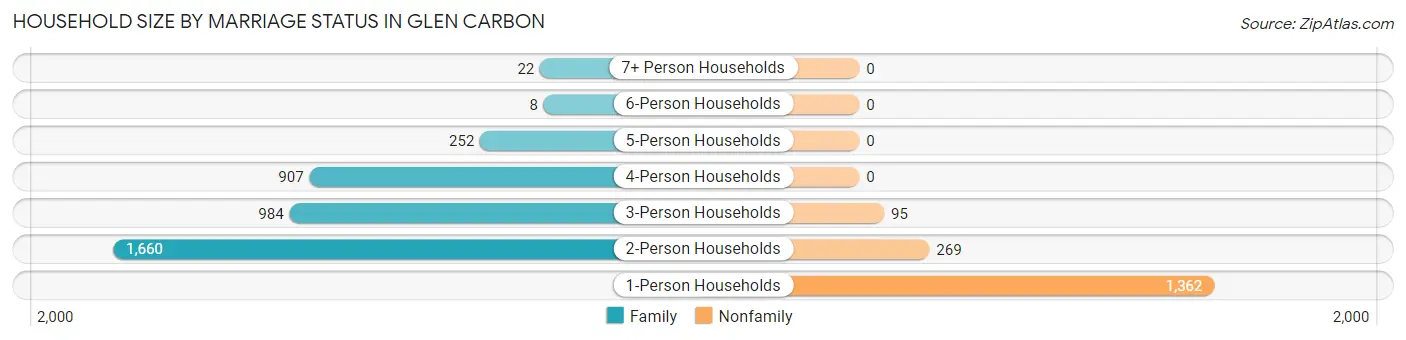
| Household Size | Family Households | Nonfamily Households |
| 1-Person Households | - | 1,362 (24.5%) |
| 2-Person Households | 1,660 (29.9%) | 269 (4.8%) |
| 3-Person Households | 984 (17.7%) | 95 (1.7%) |
| 4-Person Households | 907 (16.3%) | 0 (0.0%) |
| 5-Person Households | 252 (4.5%) | 0 (0.0%) |
| 6-Person Households | 8 (0.1%) | 0 (0.0%) |
| 7+ Person Households | 22 (0.4%) | 0 (0.0%) |
| Total | 3,833 (69.0%) | 1,726 (31.0%) |
Female Fertility in Glen Carbon
Fertility by Age in Glen Carbon
Average fertility rate in Glen Carbon is 32.0 births per 1,000 women. Women in the age bracket of 20 to 34 years have the highest fertility rate with 62.0 births per 1,000 women. Women in the age bracket of 20 to 34 years acount for 69.3% of all women with births.
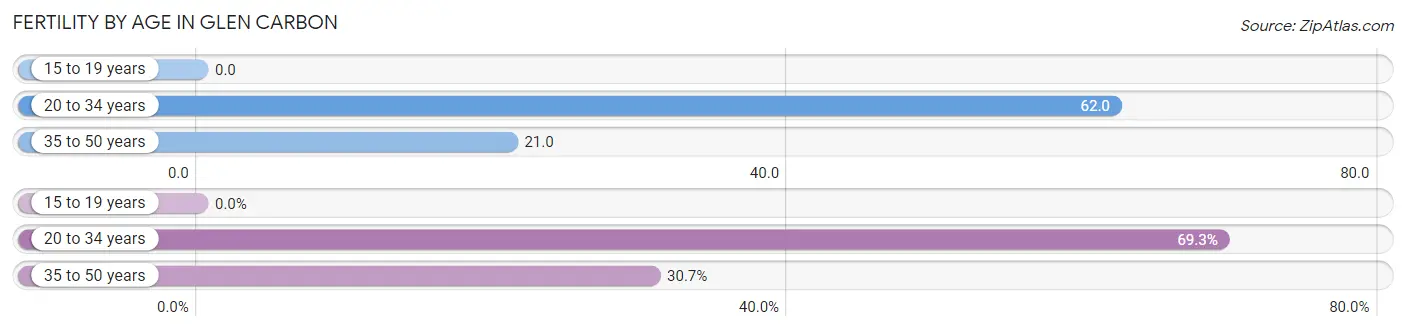
| Age Bracket | Women with Births | Births / 1,000 Women |
| 15 to 19 years | 0 (0.0%) | 0.0 |
| 20 to 34 years | 61 (69.3%) | 62.0 |
| 35 to 50 years | 27 (30.7%) | 21.0 |
| Total | 88 (100.0%) | 32.0 |
Fertility by Age by Marriage Status in Glen Carbon
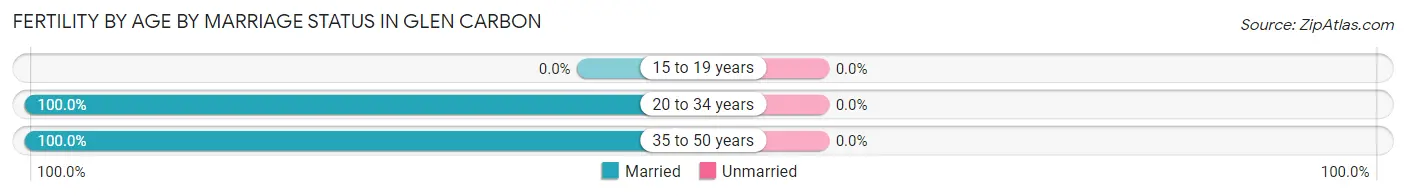
| Age Bracket | Married | Unmarried |
| 15 to 19 years | 0 (0.0%) | 0 (0.0%) |
| 20 to 34 years | 61 (100.0%) | 0 (0.0%) |
| 35 to 50 years | 27 (100.0%) | 0 (0.0%) |
| Total | 88 (100.0%) | 0 (0.0%) |
Fertility by Education in Glen Carbon
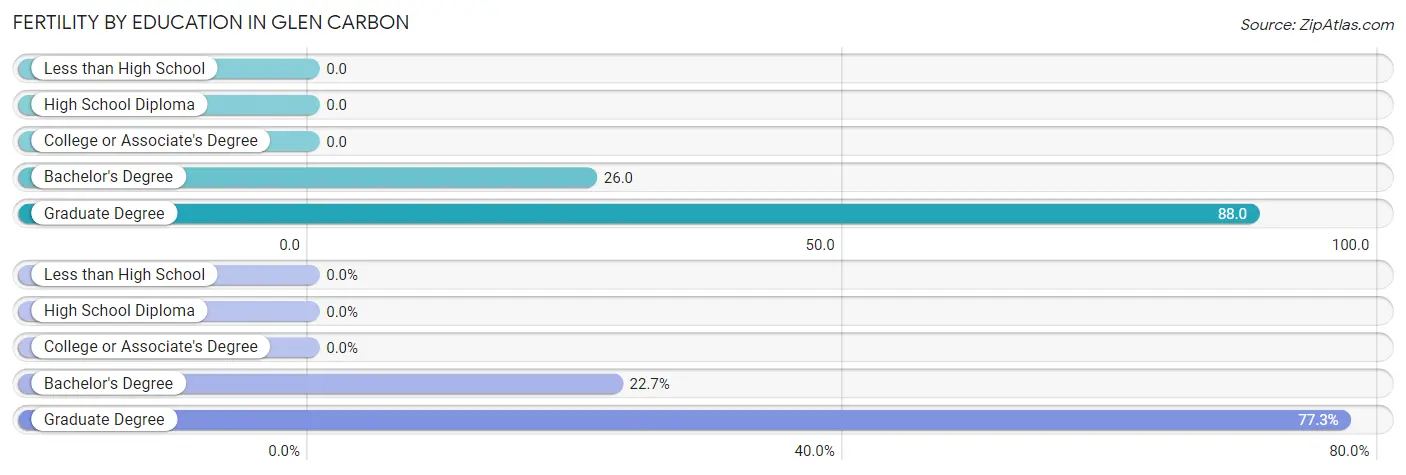
| Educational Attainment | Women with Births | Births / 1,000 Women |
| Less than High School | 0 (0.0%) | 0.0 |
| High School Diploma | 0 (0.0%) | 0.0 |
| College or Associate's Degree | 0 (0.0%) | 0.0 |
| Bachelor's Degree | 20 (22.7%) | 26.0 |
| Graduate Degree | 68 (77.3%) | 88.0 |
| Total | 88 (100.0%) | 32.0 |
Fertility by Education by Marriage Status in Glen Carbon
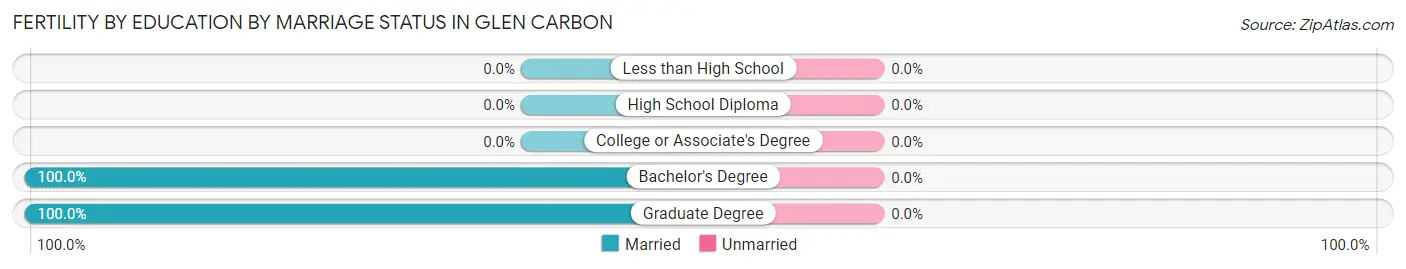
| Educational Attainment | Married | Unmarried |
| Less than High School | 0 (0.0%) | 0 (0.0%) |
| High School Diploma | 0 (0.0%) | 0 (0.0%) |
| College or Associate's Degree | 0 (0.0%) | 0 (0.0%) |
| Bachelor's Degree | 20 (100.0%) | 0 (0.0%) |
| Graduate Degree | 68 (100.0%) | 0 (0.0%) |
| Total | 88 (100.0%) | 0 (0.0%) |
Employment Characteristics in Glen Carbon
Employment by Class of Employer in Glen Carbon
Among the 6,895 employed individuals in Glen Carbon, private company employees (4,665 | 67.7%), not-for-profit organizations (843 | 12.2%), and self-employed (not incorporated) (407 | 5.9%) make up the most common classes of employment.
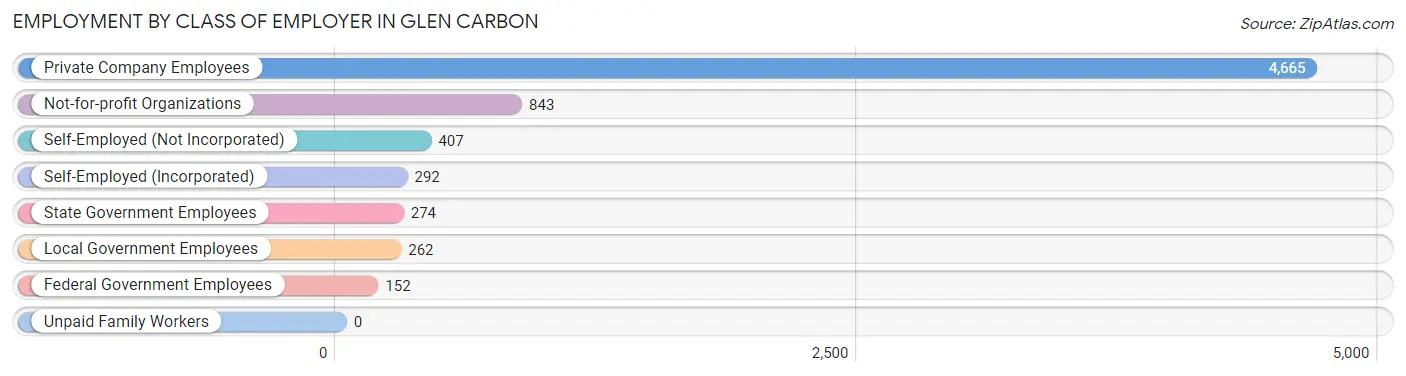
| Employer Class | # Employees | % Employees |
| Private Company Employees | 4,665 | 67.7% |
| Self-Employed (Incorporated) | 292 | 4.2% |
| Self-Employed (Not Incorporated) | 407 | 5.9% |
| Not-for-profit Organizations | 843 | 12.2% |
| Local Government Employees | 262 | 3.8% |
| State Government Employees | 274 | 4.0% |
| Federal Government Employees | 152 | 2.2% |
| Unpaid Family Workers | 0 | 0.0% |
| Total | 6,895 | 100.0% |
Employment Status by Age in Glen Carbon
According to the labor force statistics for Glen Carbon, out of the total population over 16 years of age (10,678), 68.0% or 7,261 individuals are in the labor force, with 4.1% or 298 of them unemployed. The age group with the highest labor force participation rate is 35 to 44 years, with 93.7% or 1,714 individuals in the labor force. Within the labor force, the 16 to 19 years age range has the highest percentage of unemployed individuals, with 43.0% or 183 of them being unemployed.
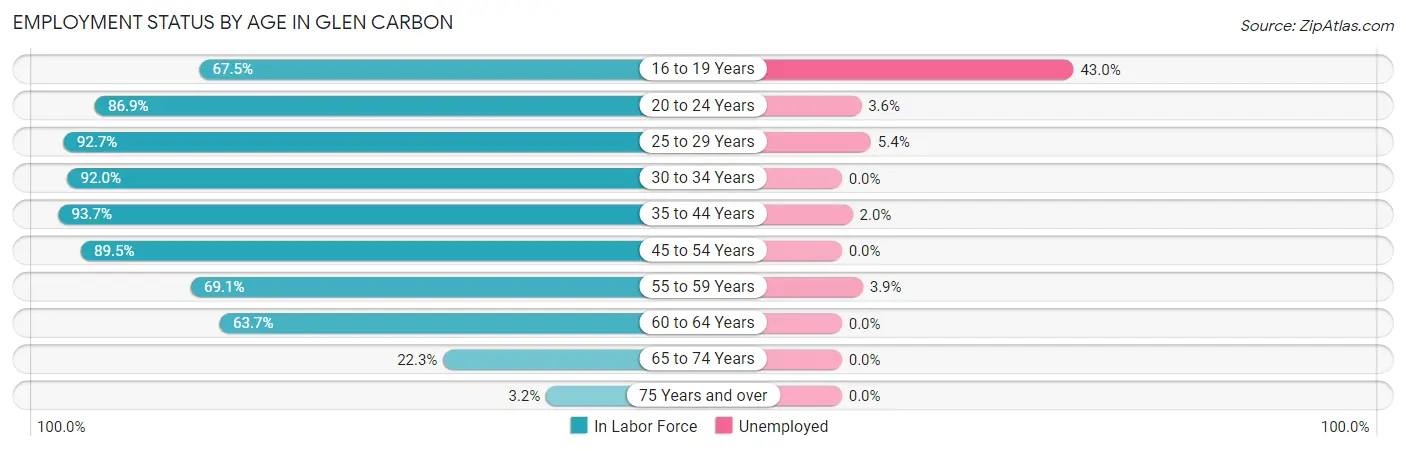
| Age Bracket | In Labor Force | Unemployed |
| 16 to 19 Years | 426 (67.5%) | 183 (43.0%) |
| 20 to 24 Years | 890 (86.9%) | 32 (3.6%) |
| 25 to 29 Years | 681 (92.7%) | 37 (5.4%) |
| 30 to 34 Years | 745 (92.0%) | 0 (0.0%) |
| 35 to 44 Years | 1,714 (93.7%) | 34 (2.0%) |
| 45 to 54 Years | 1,498 (89.5%) | 0 (0.0%) |
| 55 to 59 Years | 360 (69.1%) | 14 (3.9%) |
| 60 to 64 Years | 622 (63.7%) | 0 (0.0%) |
| 65 to 74 Years | 284 (22.3%) | 0 (0.0%) |
| 75 Years and over | 38 (3.2%) | 0 (0.0%) |
| Total | 7,261 (68.0%) | 298 (4.1%) |
Employment Status by Educational Attainment in Glen Carbon
According to labor force statistics for Glen Carbon, 85.9% of individuals (5,622) out of the total population between 25 and 64 years of age (6,545) are in the labor force, with 1.5% or 84 of them being unemployed. The group with the highest labor force participation rate are those with the educational attainment of bachelor's degree or higher, with 91.6% or 3,504 individuals in the labor force. Within the labor force, individuals with college / associate degree education have the highest percentage of unemployment, with 2.7% or 35 of them being unemployed.
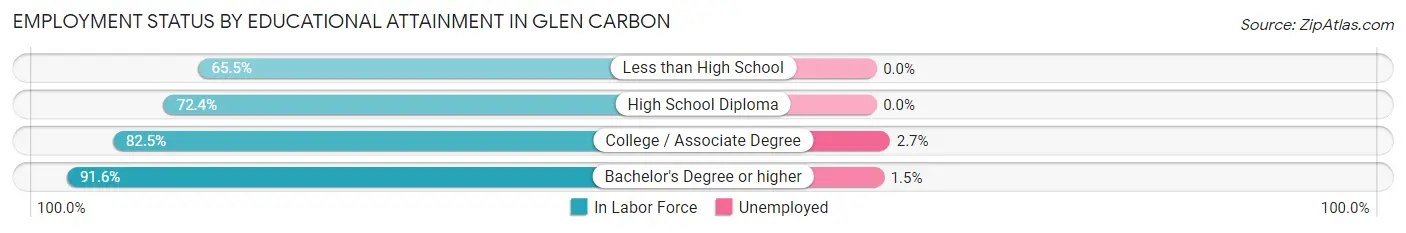
| Educational Attainment | In Labor Force | Unemployed |
| Less than High School | 112 (65.5%) | 0 (0.0%) |
| High School Diploma | 694 (72.4%) | 0 (0.0%) |
| College / Associate Degree | 1,312 (82.5%) | 43 (2.7%) |
| Bachelor's Degree or higher | 3,504 (91.6%) | 57 (1.5%) |
| Total | 5,622 (85.9%) | 98 (1.5%) |
Employment Occupations by Sex in Glen Carbon
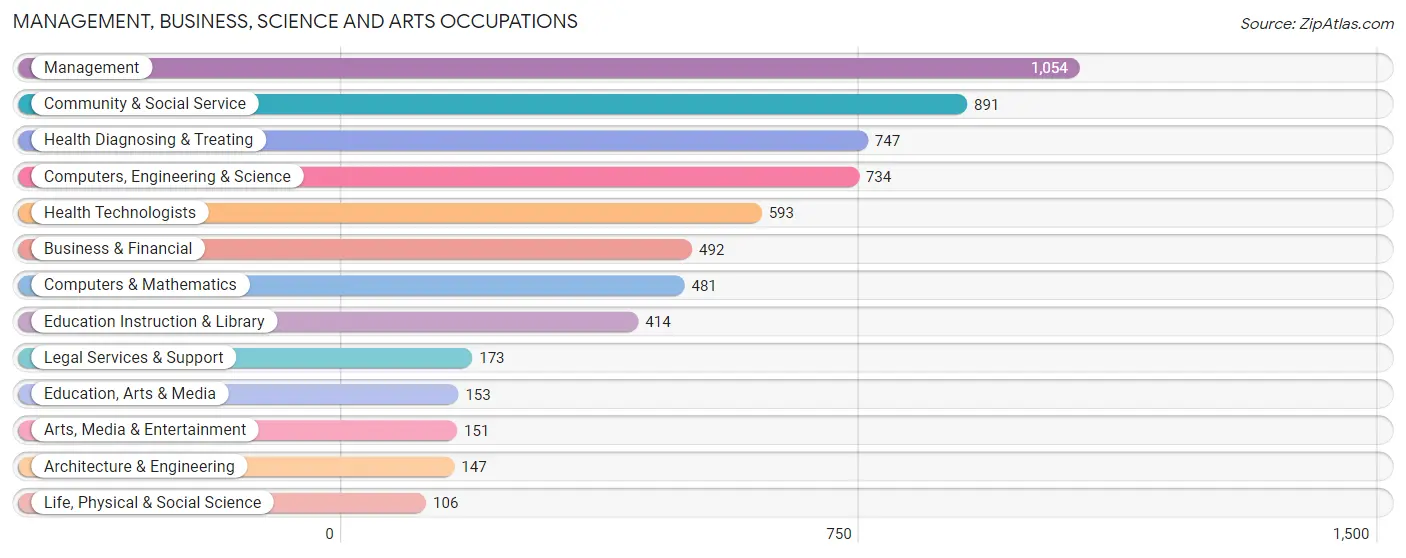
Management, Business, Science and Arts Occupations
The most common Management, Business, Science and Arts occupations in Glen Carbon are Management (1,054 | 15.1%), Community & Social Service (891 | 12.8%), Health Diagnosing & Treating (747 | 10.7%), Computers, Engineering & Science (734 | 10.5%), and Health Technologists (593 | 8.5%).
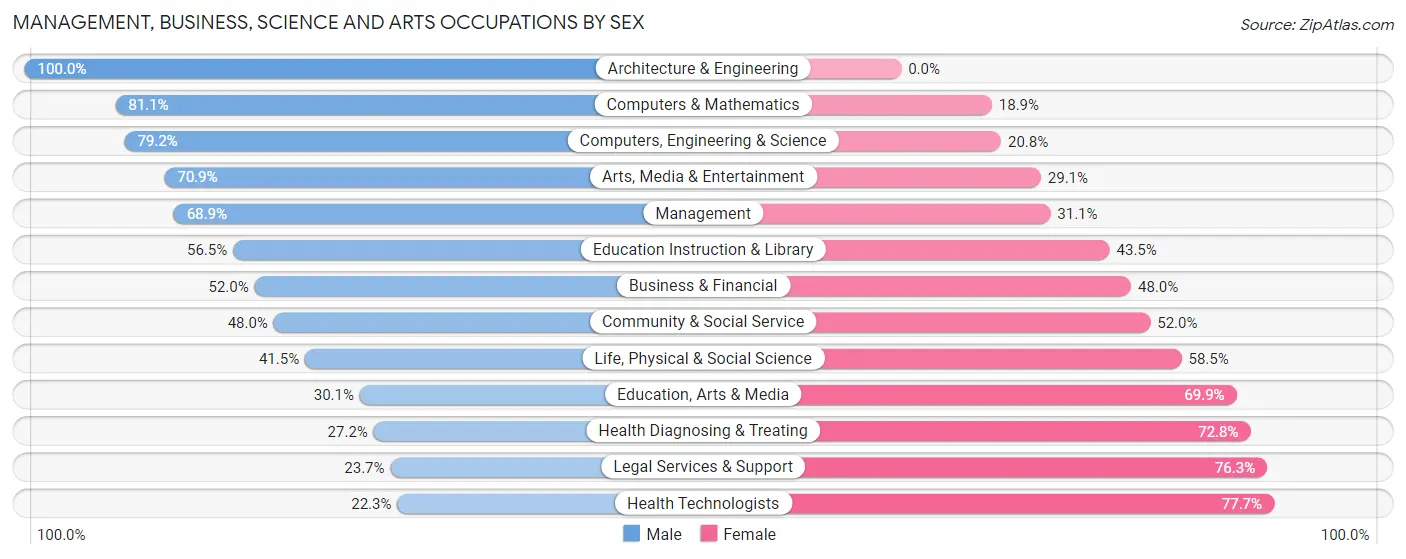
Management, Business, Science and Arts Occupations by Sex
Within the Management, Business, Science and Arts occupations in Glen Carbon, the most male-oriented occupations are Architecture & Engineering (100.0%), Computers & Mathematics (81.1%), and Computers, Engineering & Science (79.2%), while the most female-oriented occupations are Health Technologists (77.7%), Legal Services & Support (76.3%), and Health Diagnosing & Treating (72.8%).
| Occupation | Male | Female |
| Management | 726 (68.9%) | 328 (31.1%) |
| Business & Financial | 256 (52.0%) | 236 (48.0%) |
| Computers, Engineering & Science | 581 (79.2%) | 153 (20.8%) |
| Computers & Mathematics | 390 (81.1%) | 91 (18.9%) |
| Architecture & Engineering | 147 (100.0%) | 0 (0.0%) |
| Life, Physical & Social Science | 44 (41.5%) | 62 (58.5%) |
| Community & Social Service | 428 (48.0%) | 463 (52.0%) |
| Education, Arts & Media | 46 (30.1%) | 107 (69.9%) |
| Legal Services & Support | 41 (23.7%) | 132 (76.3%) |
| Education Instruction & Library | 234 (56.5%) | 180 (43.5%) |
| Arts, Media & Entertainment | 107 (70.9%) | 44 (29.1%) |
| Health Diagnosing & Treating | 203 (27.2%) | 544 (72.8%) |
| Health Technologists | 132 (22.3%) | 461 (77.7%) |
| Total (Category) | 2,194 (56.0%) | 1,724 (44.0%) |
| Total (Overall) | 4,078 (58.6%) | 2,879 (41.4%) |
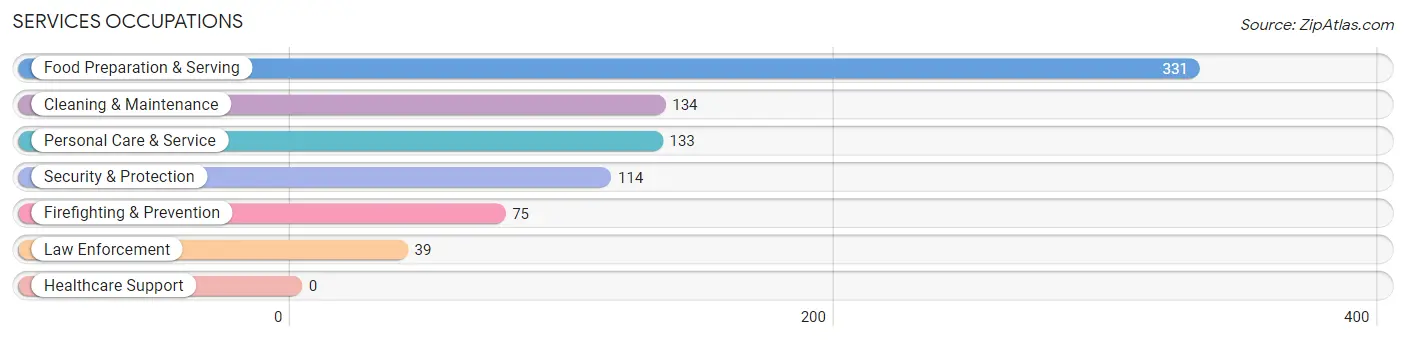
Services Occupations
The most common Services occupations in Glen Carbon are Food Preparation & Serving (331 | 4.8%), Cleaning & Maintenance (134 | 1.9%), Personal Care & Service (133 | 1.9%), Security & Protection (114 | 1.6%), and Firefighting & Prevention (75 | 1.1%).
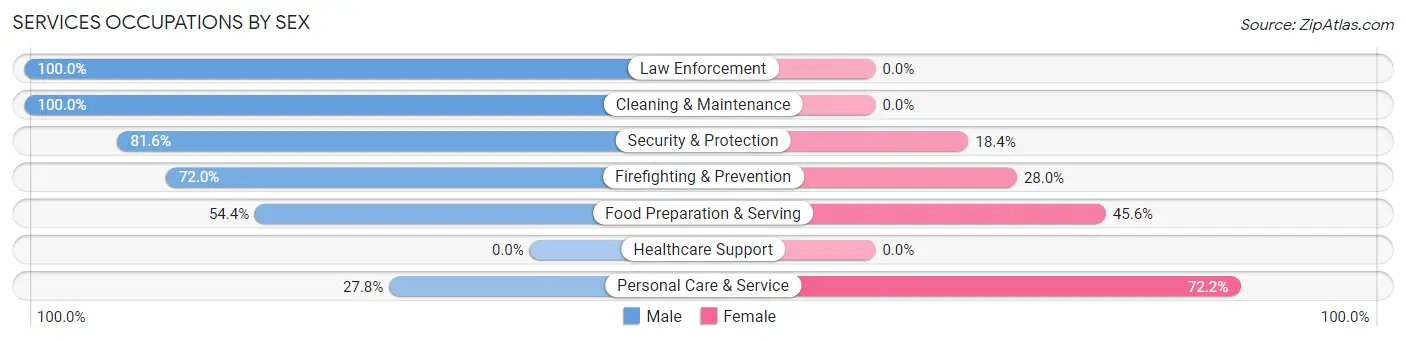
Services Occupations by Sex
Within the Services occupations in Glen Carbon, the most male-oriented occupations are Law Enforcement (100.0%), Cleaning & Maintenance (100.0%), and Security & Protection (81.6%), while the most female-oriented occupations are Personal Care & Service (72.2%), Food Preparation & Serving (45.6%), and Firefighting & Prevention (28.0%).
| Occupation | Male | Female |
| Healthcare Support | 0 (0.0%) | 0 (0.0%) |
| Security & Protection | 93 (81.6%) | 21 (18.4%) |
| Firefighting & Prevention | 54 (72.0%) | 21 (28.0%) |
| Law Enforcement | 39 (100.0%) | 0 (0.0%) |
| Food Preparation & Serving | 180 (54.4%) | 151 (45.6%) |
| Cleaning & Maintenance | 134 (100.0%) | 0 (0.0%) |
| Personal Care & Service | 37 (27.8%) | 96 (72.2%) |
| Total (Category) | 444 (62.4%) | 268 (37.6%) |
| Total (Overall) | 4,078 (58.6%) | 2,879 (41.4%) |
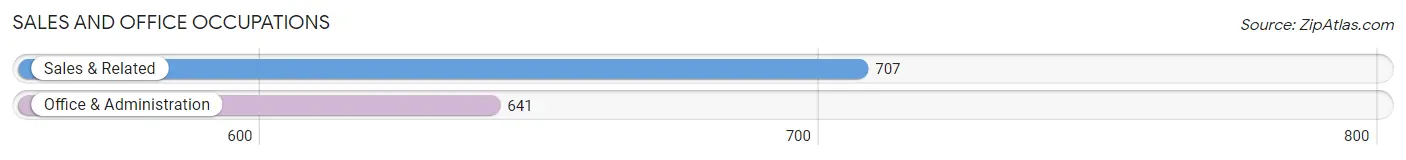
Sales and Office Occupations
The most common Sales and Office occupations in Glen Carbon are Sales & Related (707 | 10.2%), and Office & Administration (641 | 9.2%).
Sales and Office Occupations by Sex
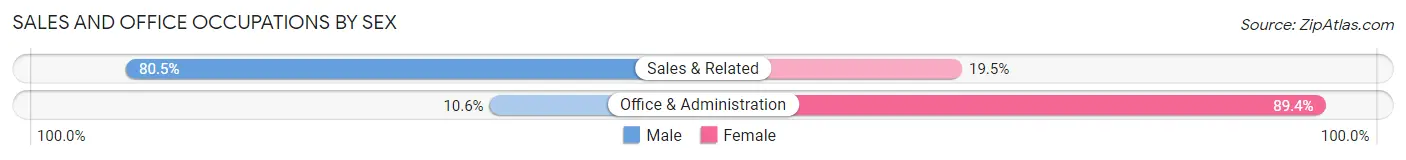
| Occupation | Male | Female |
| Sales & Related | 569 (80.5%) | 138 (19.5%) |
| Office & Administration | 68 (10.6%) | 573 (89.4%) |
| Total (Category) | 637 (47.3%) | 711 (52.7%) |
| Total (Overall) | 4,078 (58.6%) | 2,879 (41.4%) |
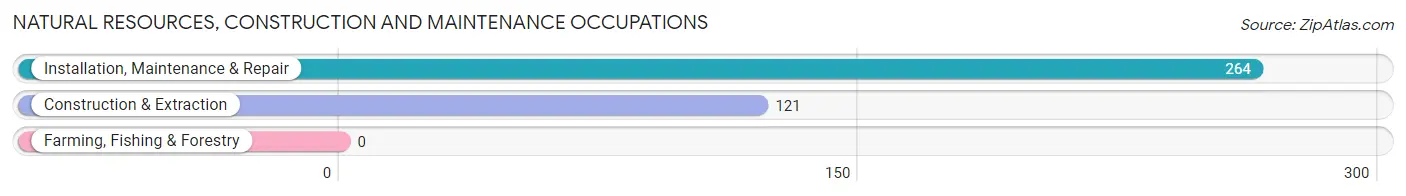
Natural Resources, Construction and Maintenance Occupations
The most common Natural Resources, Construction and Maintenance occupations in Glen Carbon are Installation, Maintenance & Repair (264 | 3.8%), and Construction & Extraction (121 | 1.7%).
Natural Resources, Construction and Maintenance Occupations by Sex
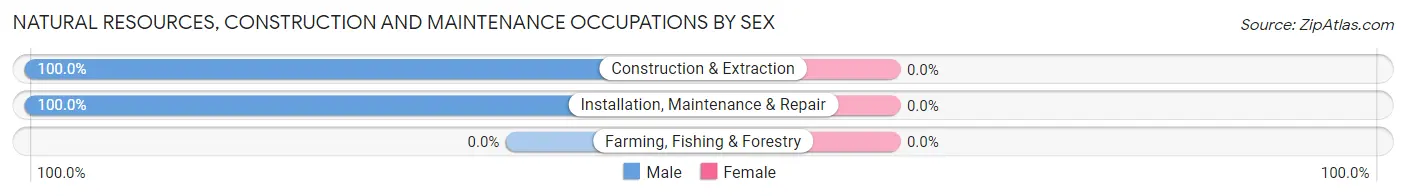
| Occupation | Male | Female |
| Farming, Fishing & Forestry | 0 (0.0%) | 0 (0.0%) |
| Construction & Extraction | 121 (100.0%) | 0 (0.0%) |
| Installation, Maintenance & Repair | 264 (100.0%) | 0 (0.0%) |
| Total (Category) | 385 (100.0%) | 0 (0.0%) |
| Total (Overall) | 4,078 (58.6%) | 2,879 (41.4%) |
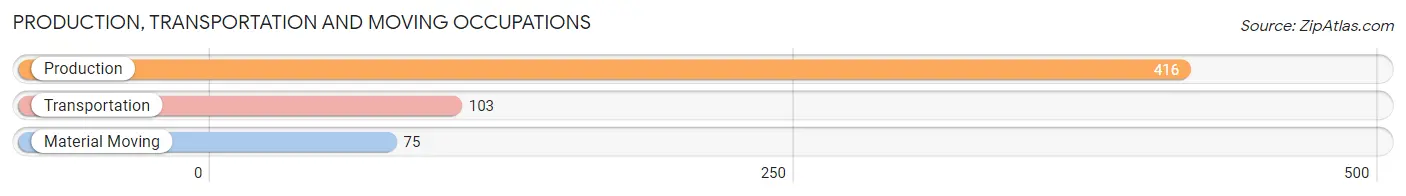
Production, Transportation and Moving Occupations
The most common Production, Transportation and Moving occupations in Glen Carbon are Production (416 | 6.0%), Transportation (103 | 1.5%), and Material Moving (75 | 1.1%).
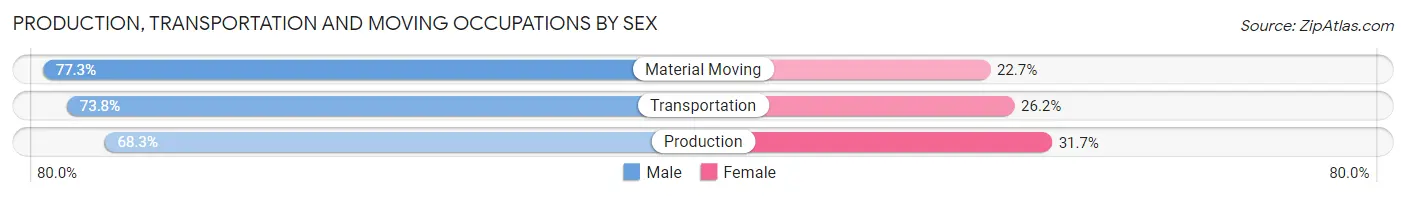
Production, Transportation and Moving Occupations by Sex
| Occupation | Male | Female |
| Production | 284 (68.3%) | 132 (31.7%) |
| Transportation | 76 (73.8%) | 27 (26.2%) |
| Material Moving | 58 (77.3%) | 17 (22.7%) |
| Total (Category) | 418 (70.4%) | 176 (29.6%) |
| Total (Overall) | 4,078 (58.6%) | 2,879 (41.4%) |
Employment Industries by Sex in Glen Carbon
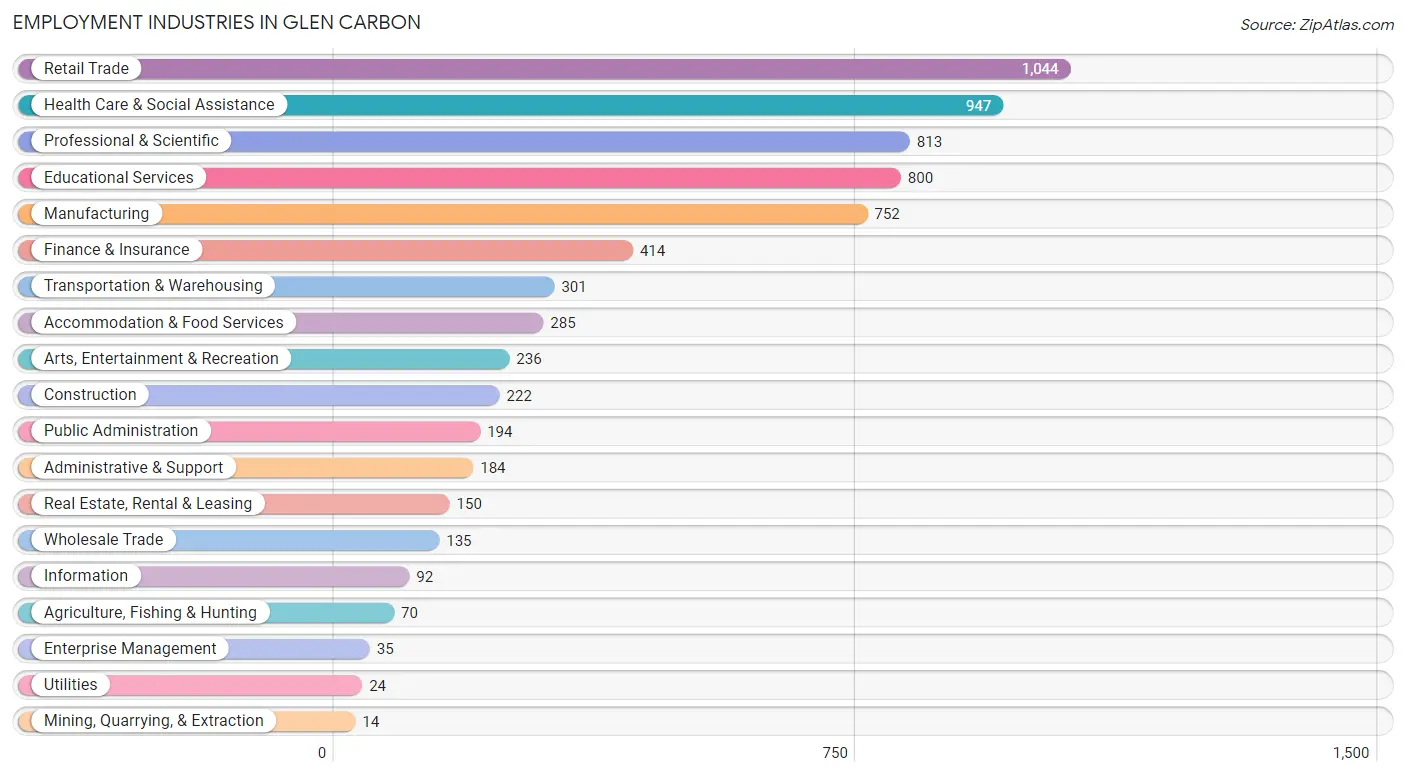
Employment Industries in Glen Carbon
The major employment industries in Glen Carbon include Retail Trade (1,044 | 15.0%), Health Care & Social Assistance (947 | 13.6%), Professional & Scientific (813 | 11.7%), Educational Services (800 | 11.5%), and Manufacturing (752 | 10.8%).
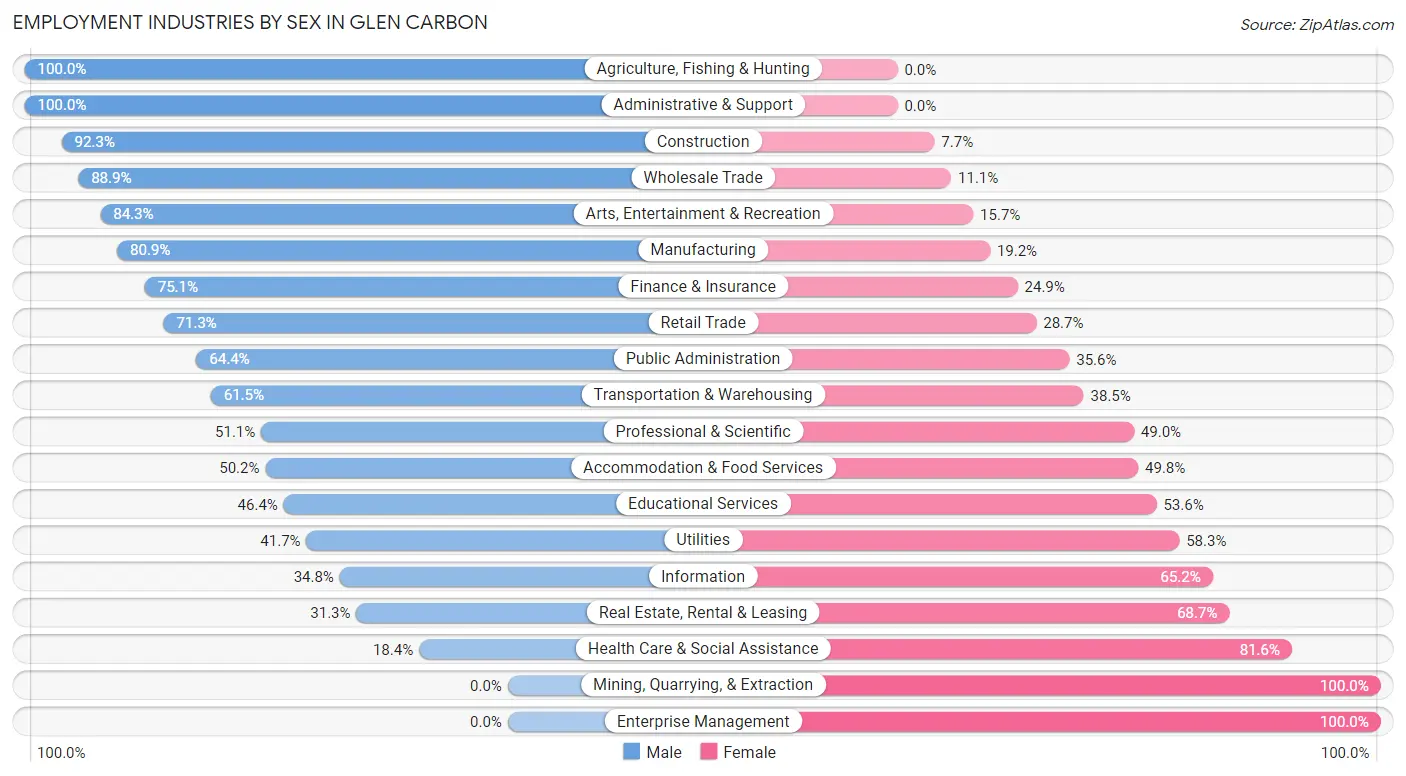
Employment Industries by Sex in Glen Carbon
The Glen Carbon industries that see more men than women are Agriculture, Fishing & Hunting (100.0%), Administrative & Support (100.0%), and Construction (92.3%), whereas the industries that tend to have a higher number of women are Mining, Quarrying, & Extraction (100.0%), Enterprise Management (100.0%), and Health Care & Social Assistance (81.6%).
| Industry | Male | Female |
| Agriculture, Fishing & Hunting | 70 (100.0%) | 0 (0.0%) |
| Mining, Quarrying, & Extraction | 0 (0.0%) | 14 (100.0%) |
| Construction | 205 (92.3%) | 17 (7.7%) |
| Manufacturing | 608 (80.8%) | 144 (19.2%) |
| Wholesale Trade | 120 (88.9%) | 15 (11.1%) |
| Retail Trade | 744 (71.3%) | 300 (28.7%) |
| Transportation & Warehousing | 185 (61.5%) | 116 (38.5%) |
| Utilities | 10 (41.7%) | 14 (58.3%) |
| Information | 32 (34.8%) | 60 (65.2%) |
| Finance & Insurance | 311 (75.1%) | 103 (24.9%) |
| Real Estate, Rental & Leasing | 47 (31.3%) | 103 (68.7%) |
| Professional & Scientific | 415 (51.0%) | 398 (48.9%) |
| Enterprise Management | 0 (0.0%) | 35 (100.0%) |
| Administrative & Support | 184 (100.0%) | 0 (0.0%) |
| Educational Services | 371 (46.4%) | 429 (53.6%) |
| Health Care & Social Assistance | 174 (18.4%) | 773 (81.6%) |
| Arts, Entertainment & Recreation | 199 (84.3%) | 37 (15.7%) |
| Accommodation & Food Services | 143 (50.2%) | 142 (49.8%) |
| Public Administration | 125 (64.4%) | 69 (35.6%) |
| Total | 4,078 (58.6%) | 2,879 (41.4%) |
Education in Glen Carbon
School Enrollment in Glen Carbon
The most common levels of schooling among the 3,670 students in Glen Carbon are middle school (959 | 26.1%), college / undergraduate (802 | 21.8%), and elementary school (687 | 18.7%).
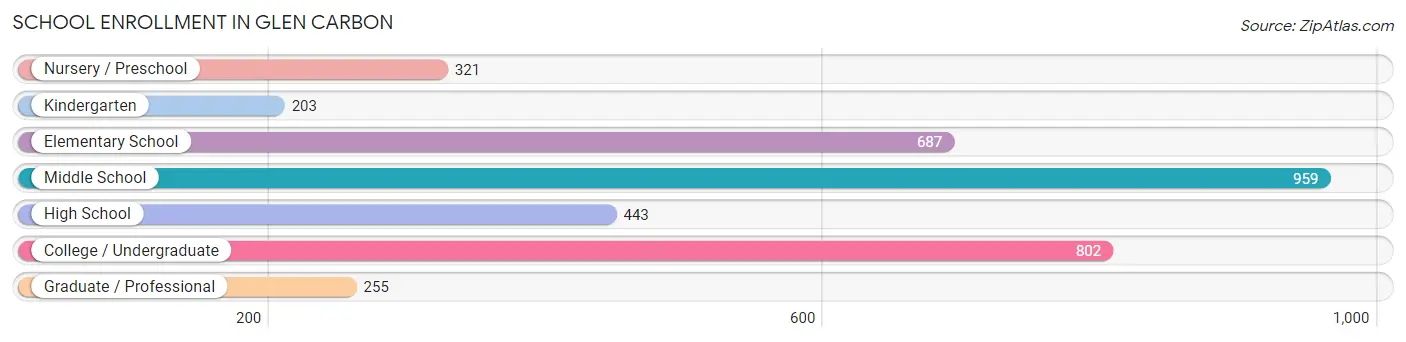
| School Level | # Students | % Students |
| Nursery / Preschool | 321 | 8.7% |
| Kindergarten | 203 | 5.5% |
| Elementary School | 687 | 18.7% |
| Middle School | 959 | 26.1% |
| High School | 443 | 12.1% |
| College / Undergraduate | 802 | 21.8% |
| Graduate / Professional | 255 | 7.0% |
| Total | 3,670 | 100.0% |
School Enrollment by Age by Funding Source in Glen Carbon
Out of a total of 3,670 students who are enrolled in schools in Glen Carbon, 785 (21.4%) attend a private institution, while the remaining 2,885 (78.6%) are enrolled in public schools. The age group of 3 to 4 year olds has the highest likelihood of being enrolled in private schools, with 141 (67.1% in the age bracket) enrolled. Conversely, the age group of 20 to 24 year olds has the lowest likelihood of being enrolled in a private school, with 522 (96.9% in the age bracket) attending a public institution.
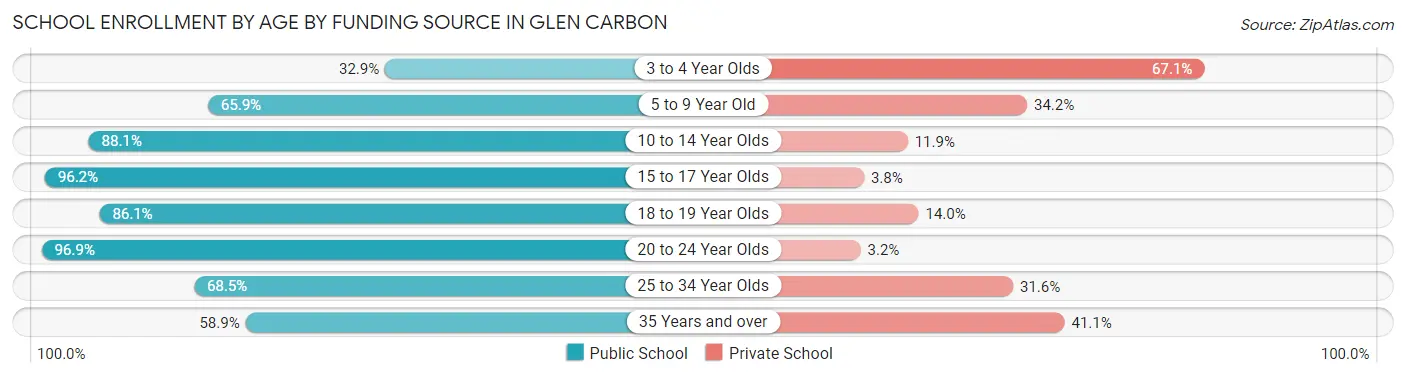
| Age Bracket | Public School | Private School |
| 3 to 4 Year Olds | 69 (32.9%) | 141 (67.1%) |
| 5 to 9 Year Old | 648 (65.8%) | 336 (34.2%) |
| 10 to 14 Year Olds | 908 (88.1%) | 123 (11.9%) |
| 15 to 17 Year Olds | 356 (96.2%) | 14 (3.8%) |
| 18 to 19 Year Olds | 148 (86.1%) | 24 (14.0%) |
| 20 to 24 Year Olds | 522 (96.9%) | 17 (3.2%) |
| 25 to 34 Year Olds | 141 (68.4%) | 65 (31.6%) |
| 35 Years and over | 93 (58.9%) | 65 (41.1%) |
| Total | 2,885 (78.6%) | 785 (21.4%) |
Educational Attainment by Field of Study in Glen Carbon
Business (998 | 19.5%), education (759 | 14.9%), science & technology (665 | 13.0%), social sciences (401 | 7.9%), and computers & mathematics (368 | 7.2%) are the most common fields of study among 5,109 individuals in Glen Carbon who have obtained a bachelor's degree or higher.
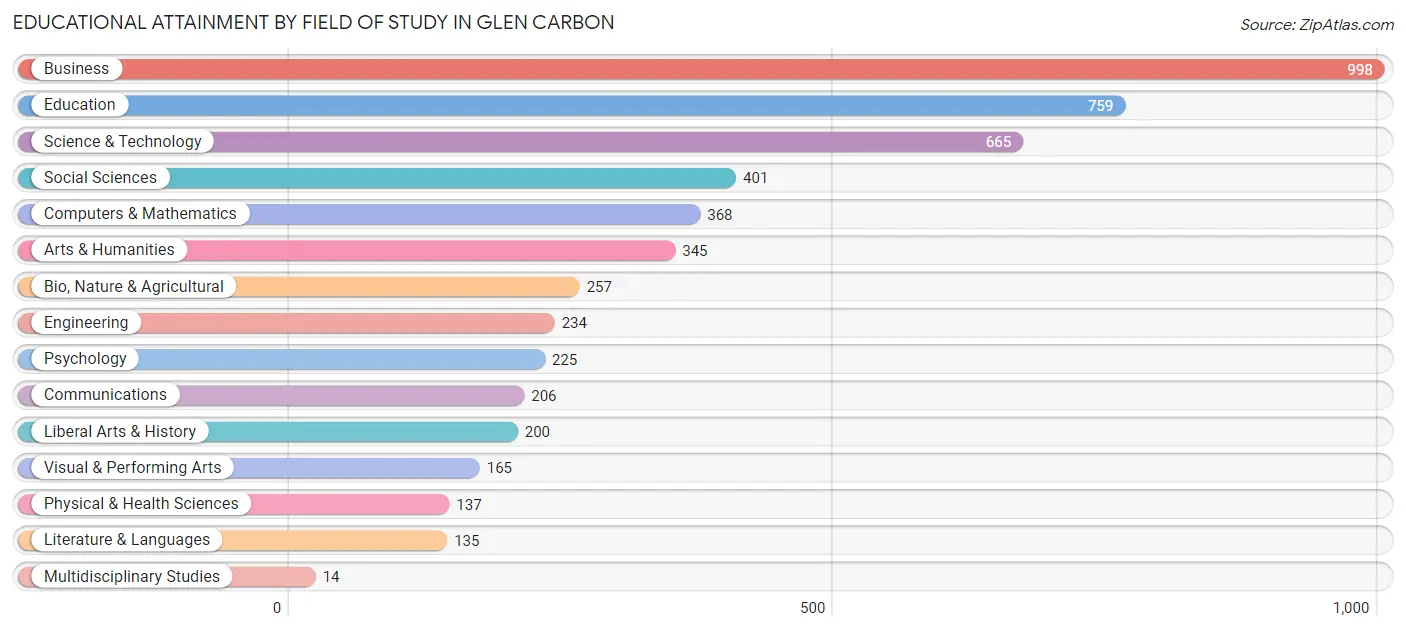
| Field of Study | # Graduates | % Graduates |
| Computers & Mathematics | 368 | 7.2% |
| Bio, Nature & Agricultural | 257 | 5.0% |
| Physical & Health Sciences | 137 | 2.7% |
| Psychology | 225 | 4.4% |
| Social Sciences | 401 | 7.9% |
| Engineering | 234 | 4.6% |
| Multidisciplinary Studies | 14 | 0.3% |
| Science & Technology | 665 | 13.0% |
| Business | 998 | 19.5% |
| Education | 759 | 14.9% |
| Literature & Languages | 135 | 2.6% |
| Liberal Arts & History | 200 | 3.9% |
| Visual & Performing Arts | 165 | 3.2% |
| Communications | 206 | 4.0% |
| Arts & Humanities | 345 | 6.8% |
| Total | 5,109 | 100.0% |
Transportation & Commute in Glen Carbon
Vehicle Availability by Sex in Glen Carbon
The most prevalent vehicle ownership categories in Glen Carbon are males with 2 vehicles (2,048, accounting for 50.3%) and females with 2 vehicles (1,315, making up 72.6%).
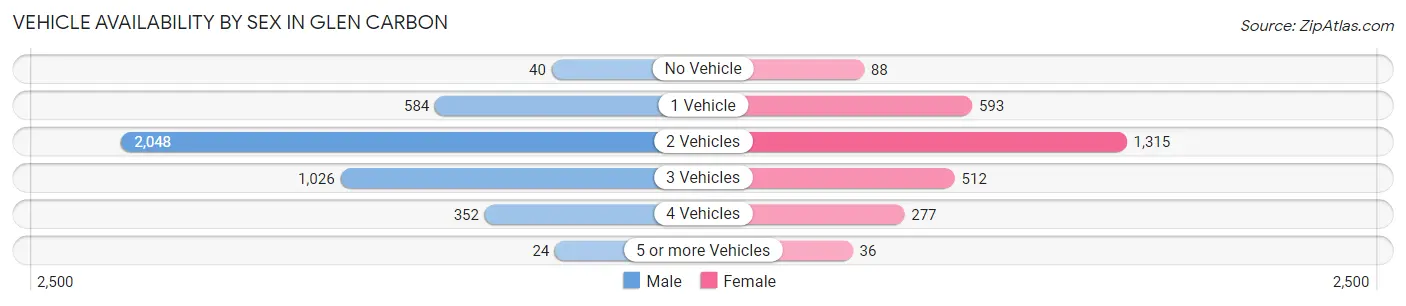
| Vehicles Available | Male | Female |
| No Vehicle | 40 (1.0%) | 88 (3.1%) |
| 1 Vehicle | 584 (14.3%) | 593 (21.0%) |
| 2 Vehicles | 2,048 (50.3%) | 1,315 (46.6%) |
| 3 Vehicles | 1,026 (25.2%) | 512 (18.1%) |
| 4 Vehicles | 352 (8.6%) | 277 (9.8%) |
| 5 or more Vehicles | 24 (0.6%) | 36 (1.3%) |
| Total | 4,074 (100.0%) | 2,821 (100.0%) |
Commute Time in Glen Carbon
The most frequently occuring commute durations in Glen Carbon are 30 to 34 minutes (900 commuters, 16.5%), 10 to 14 minutes (870 commuters, 16.0%), and 20 to 24 minutes (707 commuters, 13.0%).
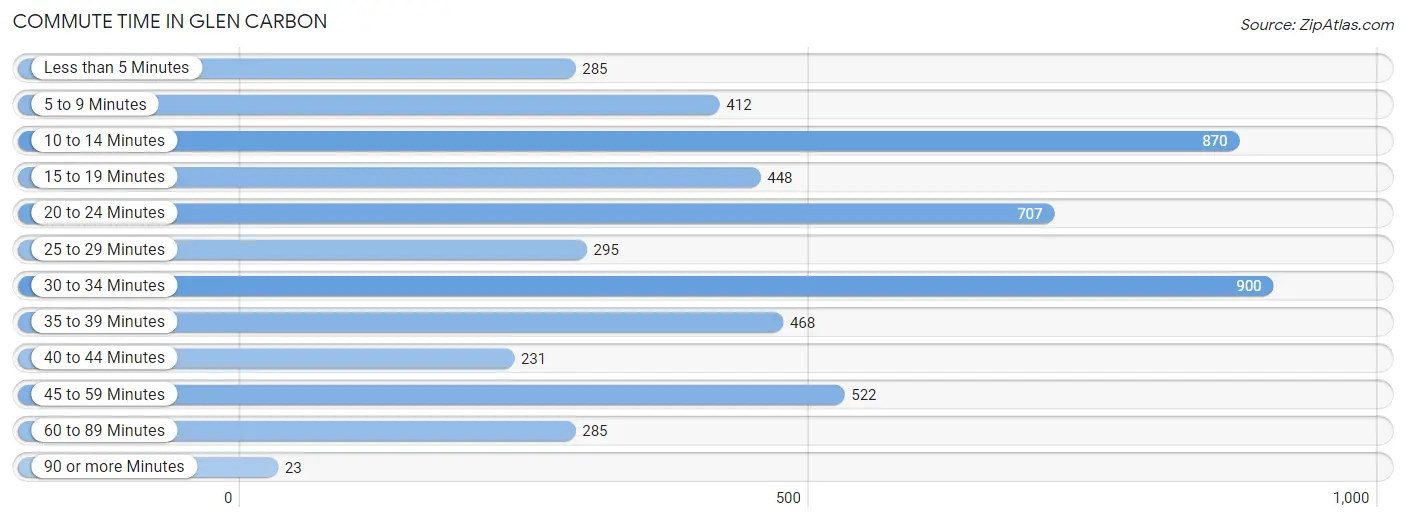
| Commute Time | # Commuters | % Commuters |
| Less than 5 Minutes | 285 | 5.2% |
| 5 to 9 Minutes | 412 | 7.6% |
| 10 to 14 Minutes | 870 | 16.0% |
| 15 to 19 Minutes | 448 | 8.2% |
| 20 to 24 Minutes | 707 | 13.0% |
| 25 to 29 Minutes | 295 | 5.4% |
| 30 to 34 Minutes | 900 | 16.5% |
| 35 to 39 Minutes | 468 | 8.6% |
| 40 to 44 Minutes | 231 | 4.2% |
| 45 to 59 Minutes | 522 | 9.6% |
| 60 to 89 Minutes | 285 | 5.2% |
| 90 or more Minutes | 23 | 0.4% |
Commute Time by Sex in Glen Carbon
The most common commute times in Glen Carbon are 10 to 14 minutes (537 commuters, 16.1%) for males and 30 to 34 minutes (368 commuters, 17.4%) for females.
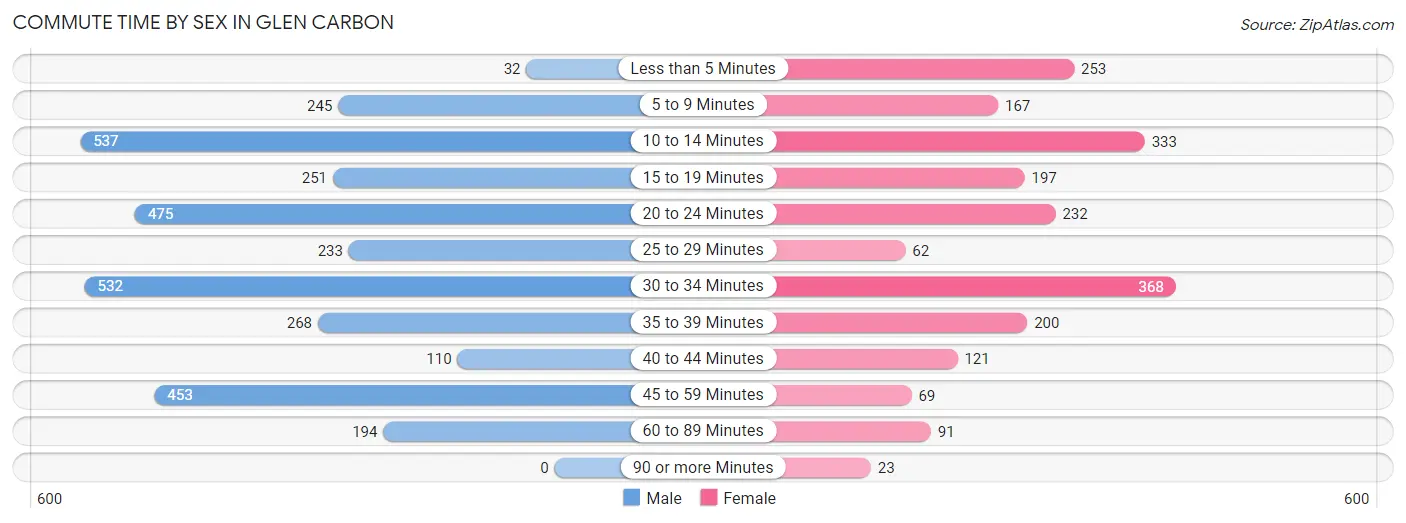
| Commute Time | Male | Female |
| Less than 5 Minutes | 32 (1.0%) | 253 (12.0%) |
| 5 to 9 Minutes | 245 (7.4%) | 167 (7.9%) |
| 10 to 14 Minutes | 537 (16.1%) | 333 (15.7%) |
| 15 to 19 Minutes | 251 (7.5%) | 197 (9.3%) |
| 20 to 24 Minutes | 475 (14.3%) | 232 (11.0%) |
| 25 to 29 Minutes | 233 (7.0%) | 62 (2.9%) |
| 30 to 34 Minutes | 532 (16.0%) | 368 (17.4%) |
| 35 to 39 Minutes | 268 (8.1%) | 200 (9.5%) |
| 40 to 44 Minutes | 110 (3.3%) | 121 (5.7%) |
| 45 to 59 Minutes | 453 (13.6%) | 69 (3.3%) |
| 60 to 89 Minutes | 194 (5.8%) | 91 (4.3%) |
| 90 or more Minutes | 0 (0.0%) | 23 (1.1%) |
Time of Departure to Work by Sex in Glen Carbon
The most frequent times of departure to work in Glen Carbon are 7:00 AM to 7:29 AM (612, 18.4%) for males and 7:30 AM to 7:59 AM (441, 20.8%) for females.
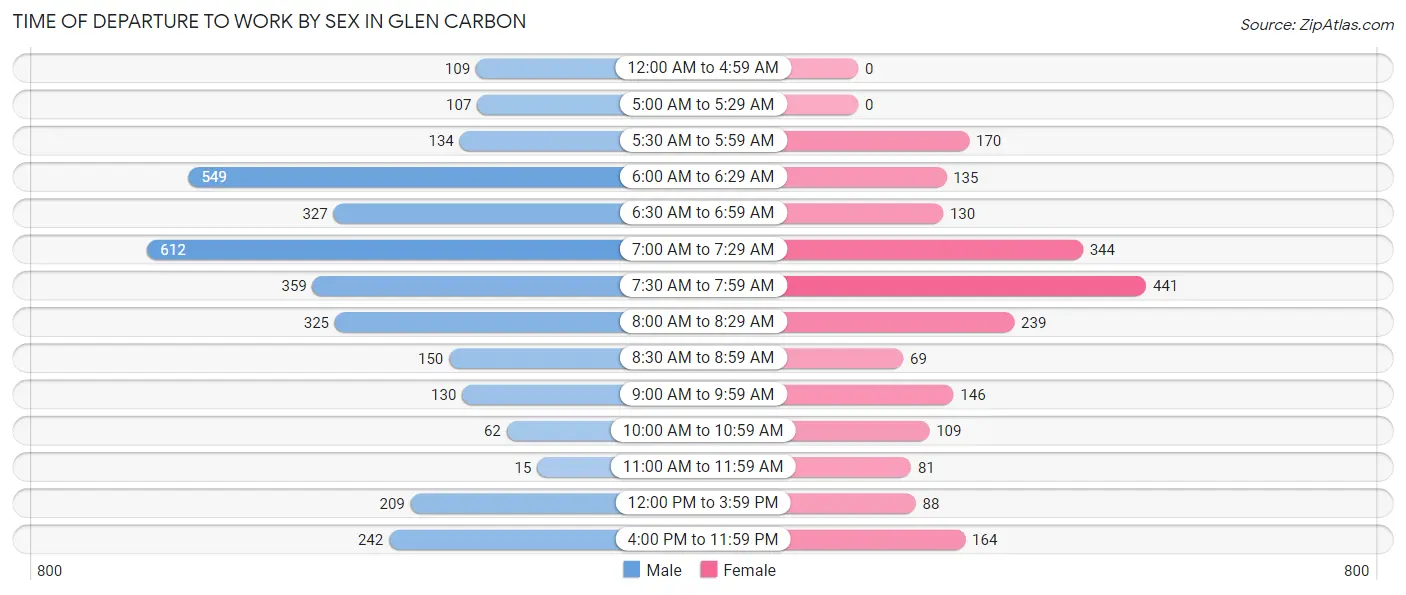
| Time of Departure | Male | Female |
| 12:00 AM to 4:59 AM | 109 (3.3%) | 0 (0.0%) |
| 5:00 AM to 5:29 AM | 107 (3.2%) | 0 (0.0%) |
| 5:30 AM to 5:59 AM | 134 (4.0%) | 170 (8.0%) |
| 6:00 AM to 6:29 AM | 549 (16.5%) | 135 (6.4%) |
| 6:30 AM to 6:59 AM | 327 (9.8%) | 130 (6.1%) |
| 7:00 AM to 7:29 AM | 612 (18.4%) | 344 (16.3%) |
| 7:30 AM to 7:59 AM | 359 (10.8%) | 441 (20.8%) |
| 8:00 AM to 8:29 AM | 325 (9.8%) | 239 (11.3%) |
| 8:30 AM to 8:59 AM | 150 (4.5%) | 69 (3.3%) |
| 9:00 AM to 9:59 AM | 130 (3.9%) | 146 (6.9%) |
| 10:00 AM to 10:59 AM | 62 (1.9%) | 109 (5.1%) |
| 11:00 AM to 11:59 AM | 15 (0.4%) | 81 (3.8%) |
| 12:00 PM to 3:59 PM | 209 (6.3%) | 88 (4.2%) |
| 4:00 PM to 11:59 PM | 242 (7.3%) | 164 (7.7%) |
| Total | 3,330 (100.0%) | 2,116 (100.0%) |
Housing Occupancy in Glen Carbon
Occupancy by Ownership in Glen Carbon
Of the total 5,559 dwellings in Glen Carbon, owner-occupied units account for 3,695 (66.5%), while renter-occupied units make up 1,864 (33.5%).
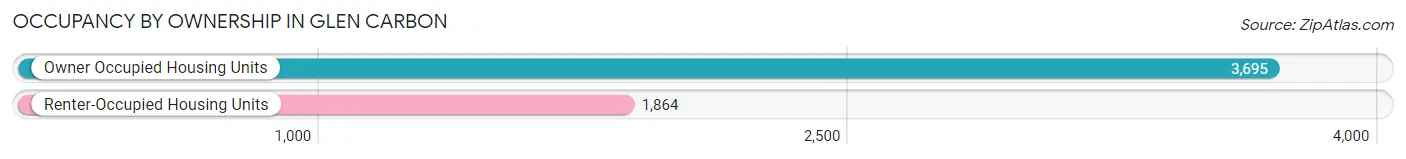
| Occupancy | # Housing Units | % Housing Units |
| Owner Occupied Housing Units | 3,695 | 66.5% |
| Renter-Occupied Housing Units | 1,864 | 33.5% |
| Total Occupied Housing Units | 5,559 | 100.0% |
Occupancy by Household Size in Glen Carbon
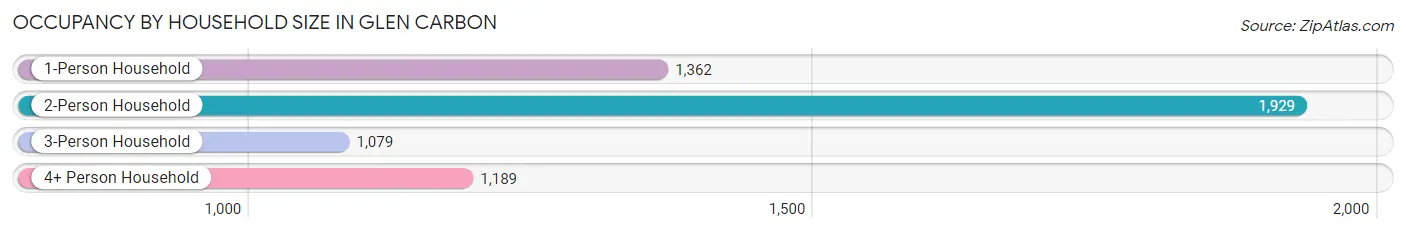
| Household Size | # Housing Units | % Housing Units |
| 1-Person Household | 1,362 | 24.5% |
| 2-Person Household | 1,929 | 34.7% |
| 3-Person Household | 1,079 | 19.4% |
| 4+ Person Household | 1,189 | 21.4% |
| Total Housing Units | 5,559 | 100.0% |
Occupancy by Ownership by Household Size in Glen Carbon
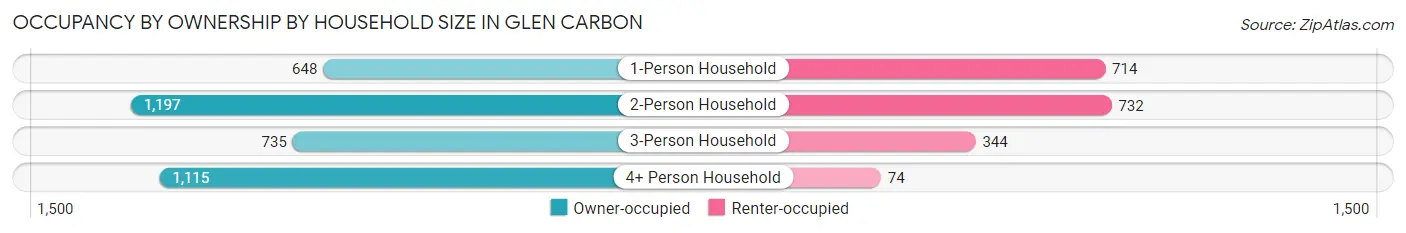
| Household Size | Owner-occupied | Renter-occupied |
| 1-Person Household | 648 (47.6%) | 714 (52.4%) |
| 2-Person Household | 1,197 (62.1%) | 732 (38.0%) |
| 3-Person Household | 735 (68.1%) | 344 (31.9%) |
| 4+ Person Household | 1,115 (93.8%) | 74 (6.2%) |
| Total Housing Units | 3,695 (66.5%) | 1,864 (33.5%) |
Occupancy by Educational Attainment in Glen Carbon
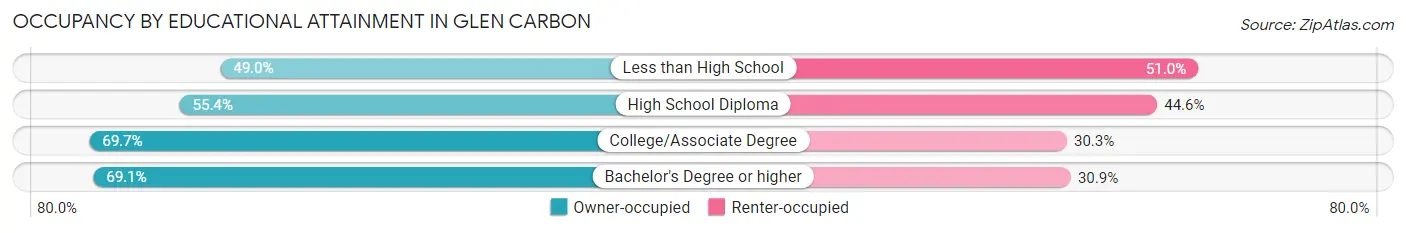
| Household Size | Owner-occupied | Renter-occupied |
| Less than High School | 94 (49.0%) | 98 (51.0%) |
| High School Diploma | 471 (55.4%) | 379 (44.6%) |
| College/Associate Degree | 947 (69.7%) | 411 (30.3%) |
| Bachelor's Degree or higher | 2,183 (69.1%) | 976 (30.9%) |
Occupancy by Age of Householder in Glen Carbon
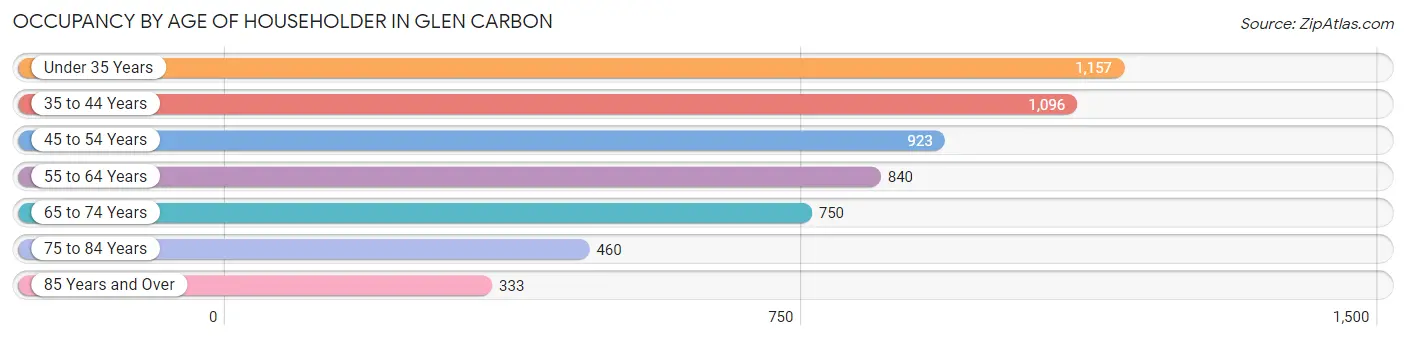
| Age Bracket | # Households | % Households |
| Under 35 Years | 1,157 | 20.8% |
| 35 to 44 Years | 1,096 | 19.7% |
| 45 to 54 Years | 923 | 16.6% |
| 55 to 64 Years | 840 | 15.1% |
| 65 to 74 Years | 750 | 13.5% |
| 75 to 84 Years | 460 | 8.3% |
| 85 Years and Over | 333 | 6.0% |
| Total | 5,559 | 100.0% |
Housing Finances in Glen Carbon
Median Income by Occupancy in Glen Carbon
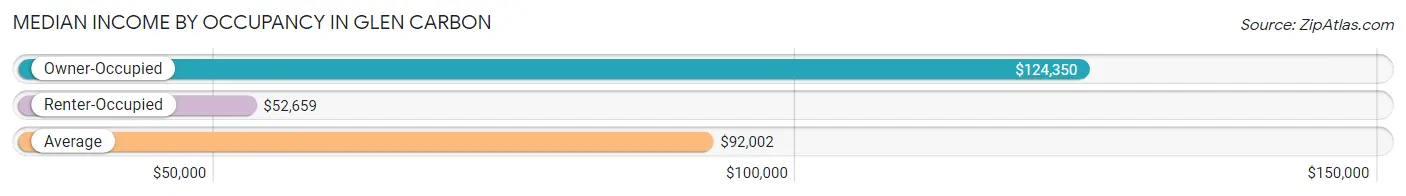
| Occupancy Type | # Households | Median Income |
| Owner-Occupied | 3,695 (66.5%) | $124,350 |
| Renter-Occupied | 1,864 (33.5%) | $52,659 |
| Average | 5,559 (100.0%) | $92,002 |
Occupancy by Householder Income Bracket in Glen Carbon
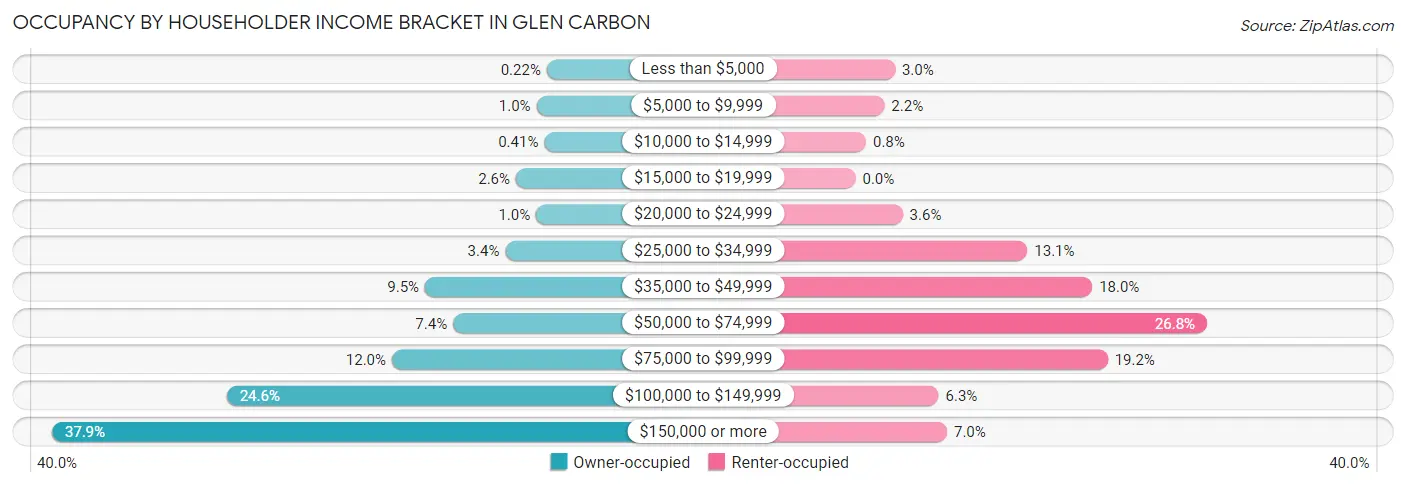
| Income Bracket | Owner-occupied | Renter-occupied |
| Less than $5,000 | 8 (0.2%) | 56 (3.0%) |
| $5,000 to $9,999 | 37 (1.0%) | 41 (2.2%) |
| $10,000 to $14,999 | 15 (0.4%) | 15 (0.8%) |
| $15,000 to $19,999 | 95 (2.6%) | 0 (0.0%) |
| $20,000 to $24,999 | 38 (1.0%) | 67 (3.6%) |
| $25,000 to $34,999 | 125 (3.4%) | 244 (13.1%) |
| $35,000 to $49,999 | 351 (9.5%) | 336 (18.0%) |
| $50,000 to $74,999 | 272 (7.4%) | 499 (26.8%) |
| $75,000 to $99,999 | 444 (12.0%) | 358 (19.2%) |
| $100,000 to $149,999 | 909 (24.6%) | 118 (6.3%) |
| $150,000 or more | 1,401 (37.9%) | 130 (7.0%) |
| Total | 3,695 (100.0%) | 1,864 (100.0%) |
Monthly Housing Cost Tiers in Glen Carbon
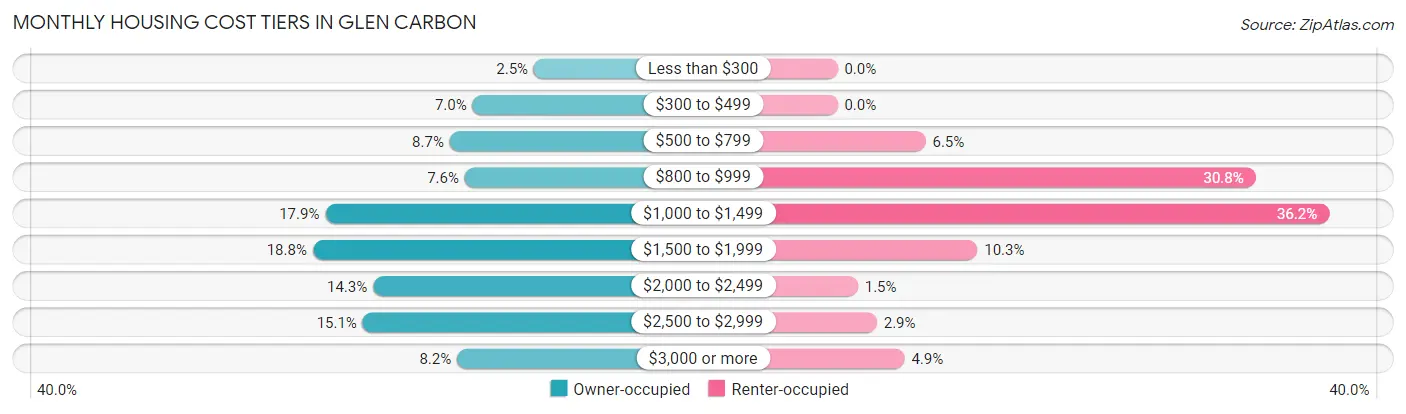
| Monthly Cost | Owner-occupied | Renter-occupied |
| Less than $300 | 92 (2.5%) | 0 (0.0%) |
| $300 to $499 | 259 (7.0%) | 0 (0.0%) |
| $500 to $799 | 321 (8.7%) | 121 (6.5%) |
| $800 to $999 | 280 (7.6%) | 574 (30.8%) |
| $1,000 to $1,499 | 660 (17.9%) | 675 (36.2%) |
| $1,500 to $1,999 | 694 (18.8%) | 192 (10.3%) |
| $2,000 to $2,499 | 530 (14.3%) | 28 (1.5%) |
| $2,500 to $2,999 | 558 (15.1%) | 54 (2.9%) |
| $3,000 or more | 301 (8.2%) | 92 (4.9%) |
| Total | 3,695 (100.0%) | 1,864 (100.0%) |
Physical Housing Characteristics in Glen Carbon
Housing Structures in Glen Carbon
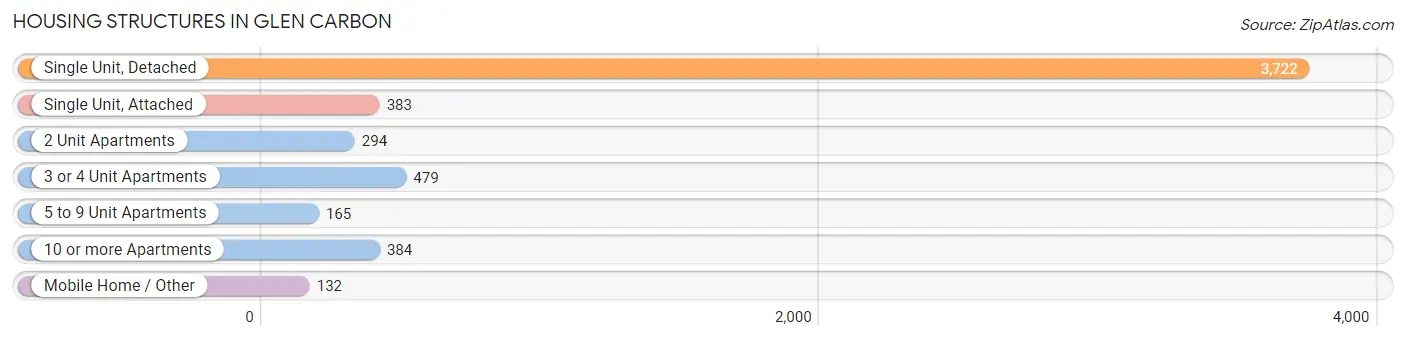
| Structure Type | # Housing Units | % Housing Units |
| Single Unit, Detached | 3,722 | 66.9% |
| Single Unit, Attached | 383 | 6.9% |
| 2 Unit Apartments | 294 | 5.3% |
| 3 or 4 Unit Apartments | 479 | 8.6% |
| 5 to 9 Unit Apartments | 165 | 3.0% |
| 10 or more Apartments | 384 | 6.9% |
| Mobile Home / Other | 132 | 2.4% |
| Total | 5,559 | 100.0% |
Housing Structures by Occupancy in Glen Carbon
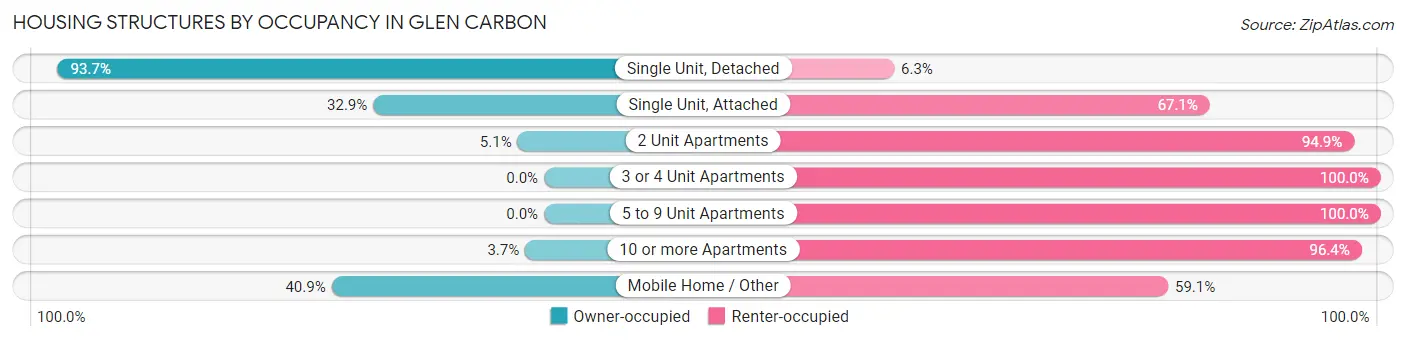
| Structure Type | Owner-occupied | Renter-occupied |
| Single Unit, Detached | 3,486 (93.7%) | 236 (6.3%) |
| Single Unit, Attached | 126 (32.9%) | 257 (67.1%) |
| 2 Unit Apartments | 15 (5.1%) | 279 (94.9%) |
| 3 or 4 Unit Apartments | 0 (0.0%) | 479 (100.0%) |
| 5 to 9 Unit Apartments | 0 (0.0%) | 165 (100.0%) |
| 10 or more Apartments | 14 (3.6%) | 370 (96.4%) |
| Mobile Home / Other | 54 (40.9%) | 78 (59.1%) |
| Total | 3,695 (66.5%) | 1,864 (33.5%) |
Housing Structures by Number of Rooms in Glen Carbon
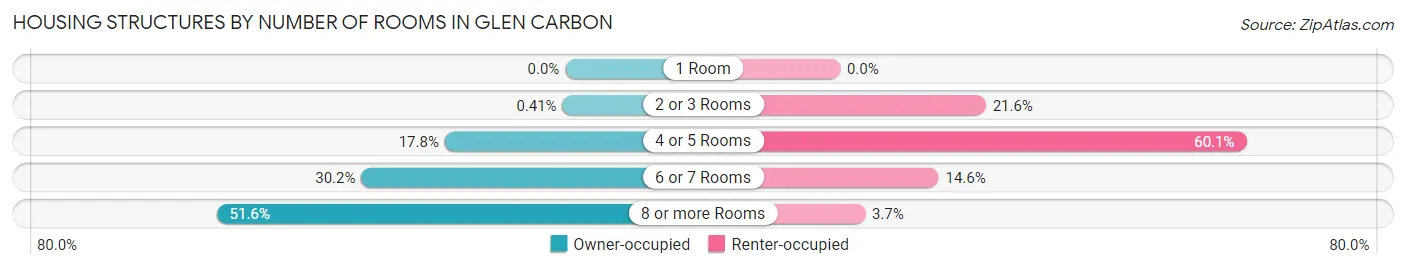
| Number of Rooms | Owner-occupied | Renter-occupied |
| 1 Room | 0 (0.0%) | 0 (0.0%) |
| 2 or 3 Rooms | 15 (0.4%) | 402 (21.6%) |
| 4 or 5 Rooms | 659 (17.8%) | 1,121 (60.1%) |
| 6 or 7 Rooms | 1,115 (30.2%) | 272 (14.6%) |
| 8 or more Rooms | 1,906 (51.6%) | 69 (3.7%) |
| Total | 3,695 (100.0%) | 1,864 (100.0%) |
Housing Structure by Heating Type in Glen Carbon
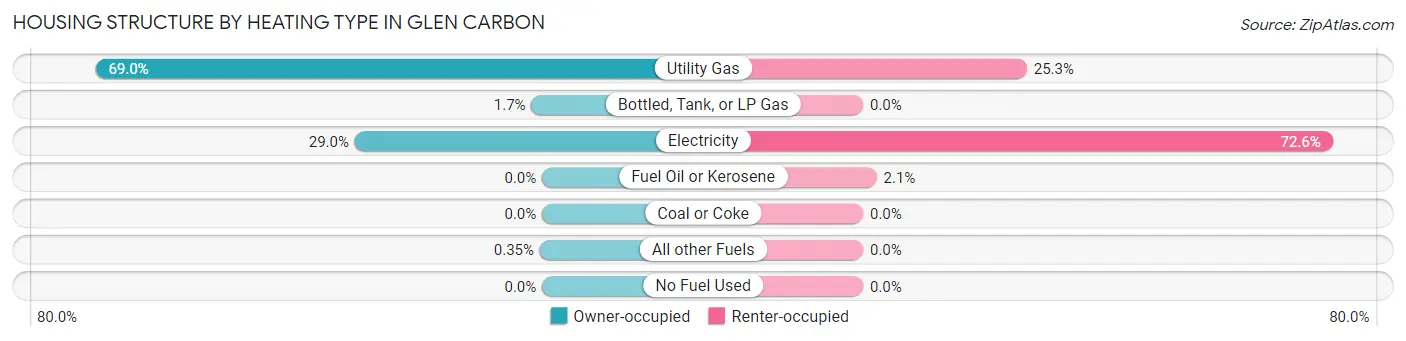
| Heating Type | Owner-occupied | Renter-occupied |
| Utility Gas | 2,551 (69.0%) | 472 (25.3%) |
| Bottled, Tank, or LP Gas | 61 (1.7%) | 0 (0.0%) |
| Electricity | 1,070 (29.0%) | 1,353 (72.6%) |
| Fuel Oil or Kerosene | 0 (0.0%) | 39 (2.1%) |
| Coal or Coke | 0 (0.0%) | 0 (0.0%) |
| All other Fuels | 13 (0.4%) | 0 (0.0%) |
| No Fuel Used | 0 (0.0%) | 0 (0.0%) |
| Total | 3,695 (100.0%) | 1,864 (100.0%) |
Household Vehicle Usage in Glen Carbon
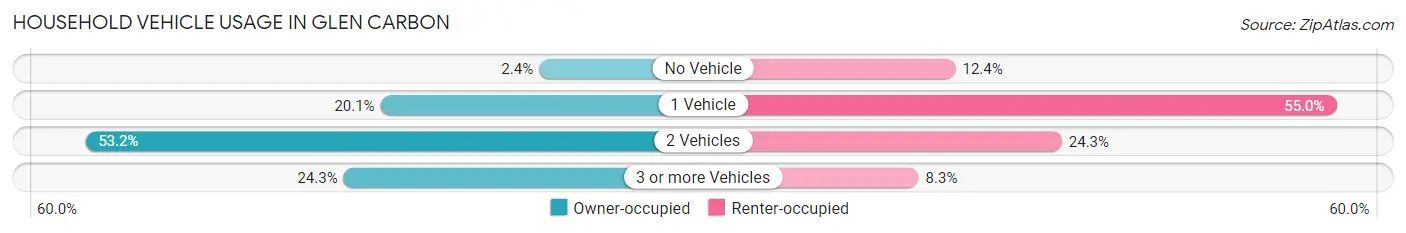
| Vehicles per Household | Owner-occupied | Renter-occupied |
| No Vehicle | 88 (2.4%) | 231 (12.4%) |
| 1 Vehicle | 744 (20.1%) | 1,026 (55.0%) |
| 2 Vehicles | 1,966 (53.2%) | 453 (24.3%) |
| 3 or more Vehicles | 897 (24.3%) | 154 (8.3%) |
| Total | 3,695 (100.0%) | 1,864 (100.0%) |
Real Estate & Mortgages in Glen Carbon
Real Estate and Mortgage Overview in Glen Carbon
| Characteristic | Without Mortgage | With Mortgage |
| Housing Units | 1,297 | 2,398 |
| Median Property Value | $234,100 | $286,000 |
| Median Household Income | $70,625 | $1,209 |
| Monthly Housing Costs | $799 | $301 |
| Real Estate Taxes | $4,725 | $19 |
Property Value by Mortgage Status in Glen Carbon
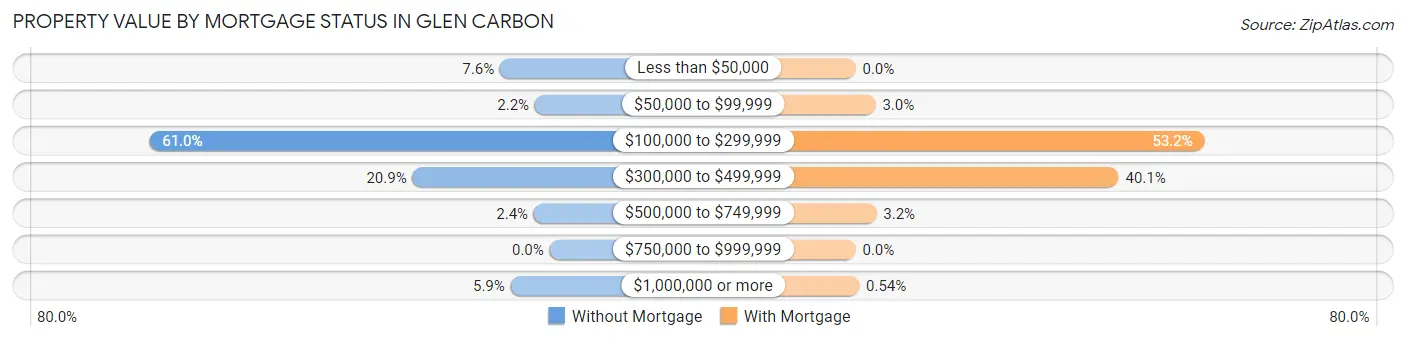
| Property Value | Without Mortgage | With Mortgage |
| Less than $50,000 | 98 (7.6%) | 0 (0.0%) |
| $50,000 to $99,999 | 29 (2.2%) | 73 (3.0%) |
| $100,000 to $299,999 | 791 (61.0%) | 1,275 (53.2%) |
| $300,000 to $499,999 | 271 (20.9%) | 961 (40.1%) |
| $500,000 to $749,999 | 31 (2.4%) | 76 (3.2%) |
| $750,000 to $999,999 | 0 (0.0%) | 0 (0.0%) |
| $1,000,000 or more | 77 (5.9%) | 13 (0.5%) |
| Total | 1,297 (100.0%) | 2,398 (100.0%) |
Household Income by Mortgage Status in Glen Carbon
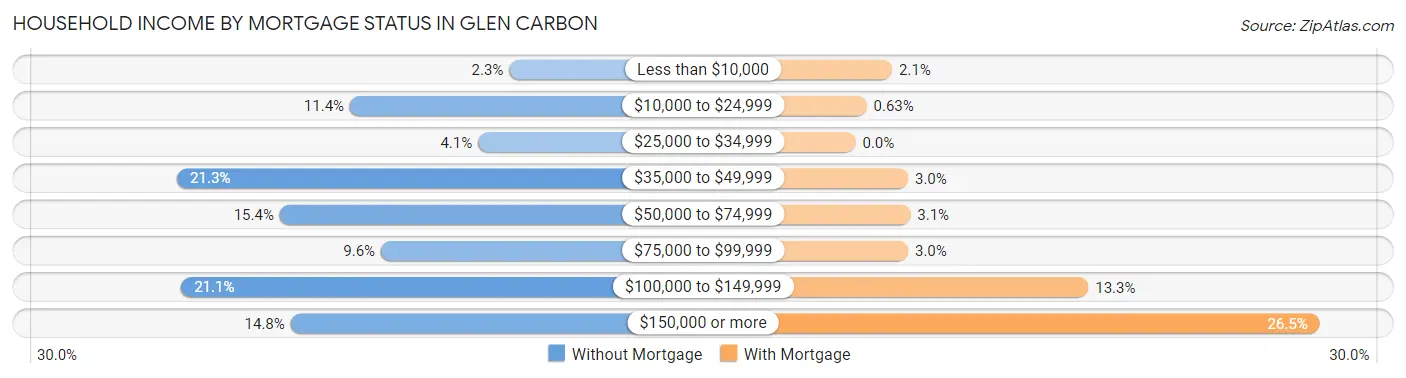
| Household Income | Without Mortgage | With Mortgage |
| Less than $10,000 | 30 (2.3%) | 50 (2.1%) |
| $10,000 to $24,999 | 148 (11.4%) | 15 (0.6%) |
| $25,000 to $34,999 | 53 (4.1%) | 0 (0.0%) |
| $35,000 to $49,999 | 276 (21.3%) | 72 (3.0%) |
| $50,000 to $74,999 | 200 (15.4%) | 75 (3.1%) |
| $75,000 to $99,999 | 125 (9.6%) | 72 (3.0%) |
| $100,000 to $149,999 | 273 (21.0%) | 319 (13.3%) |
| $150,000 or more | 192 (14.8%) | 636 (26.5%) |
| Total | 1,297 (100.0%) | 2,398 (100.0%) |
Property Value to Household Income Ratio in Glen Carbon
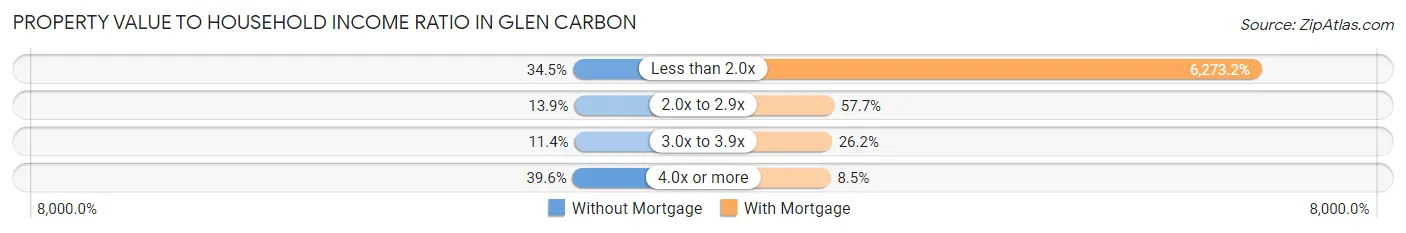
| Value-to-Income Ratio | Without Mortgage | With Mortgage |
| Less than 2.0x | 448 (34.5%) | 150,431 (6,273.2%) |
| 2.0x to 2.9x | 180 (13.9%) | 1,383 (57.7%) |
| 3.0x to 3.9x | 148 (11.4%) | 629 (26.2%) |
| 4.0x or more | 513 (39.6%) | 203 (8.5%) |
| Total | 1,297 (100.0%) | 2,398 (100.0%) |
Real Estate Taxes by Mortgage Status in Glen Carbon
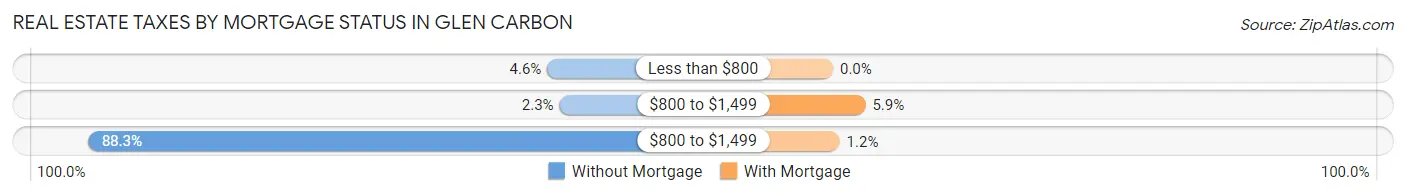
| Property Taxes | Without Mortgage | With Mortgage |
| Less than $800 | 59 (4.5%) | 0 (0.0%) |
| $800 to $1,499 | 30 (2.3%) | 142 (5.9%) |
| $800 to $1,499 | 1,145 (88.3%) | 29 (1.2%) |
| Total | 1,297 (100.0%) | 2,398 (100.0%) |
Health & Disability in Glen Carbon
Health Insurance Coverage by Age in Glen Carbon
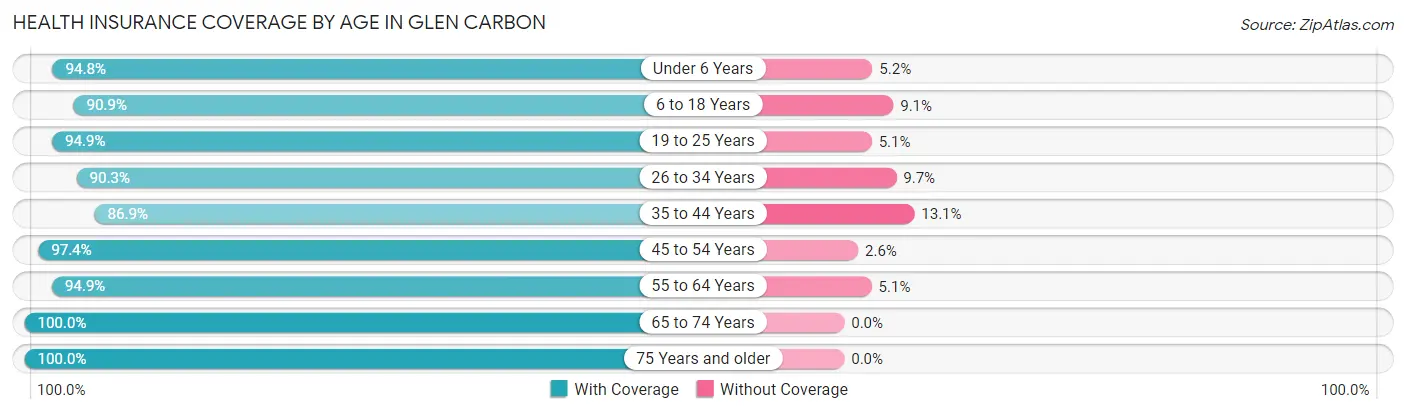
| Age Bracket | With Coverage | Without Coverage |
| Under 6 Years | 1,031 (94.8%) | 57 (5.2%) |
| 6 to 18 Years | 2,147 (90.9%) | 216 (9.1%) |
| 19 to 25 Years | 1,335 (94.9%) | 72 (5.1%) |
| 26 to 34 Years | 1,190 (90.3%) | 128 (9.7%) |
| 35 to 44 Years | 1,590 (86.9%) | 239 (13.1%) |
| 45 to 54 Years | 1,628 (97.4%) | 43 (2.6%) |
| 55 to 64 Years | 1,415 (94.9%) | 76 (5.1%) |
| 65 to 74 Years | 1,242 (100.0%) | 0 (0.0%) |
| 75 Years and older | 1,088 (100.0%) | 0 (0.0%) |
| Total | 12,666 (93.8%) | 831 (6.2%) |
Health Insurance Coverage by Citizenship Status in Glen Carbon
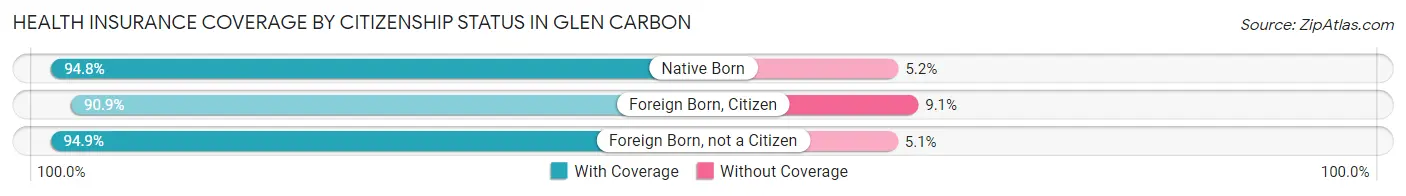
| Citizenship Status | With Coverage | Without Coverage |
| Native Born | 1,031 (94.8%) | 57 (5.2%) |
| Foreign Born, Citizen | 2,147 (90.9%) | 216 (9.1%) |
| Foreign Born, not a Citizen | 1,335 (94.9%) | 72 (5.1%) |
Health Insurance Coverage by Household Income in Glen Carbon
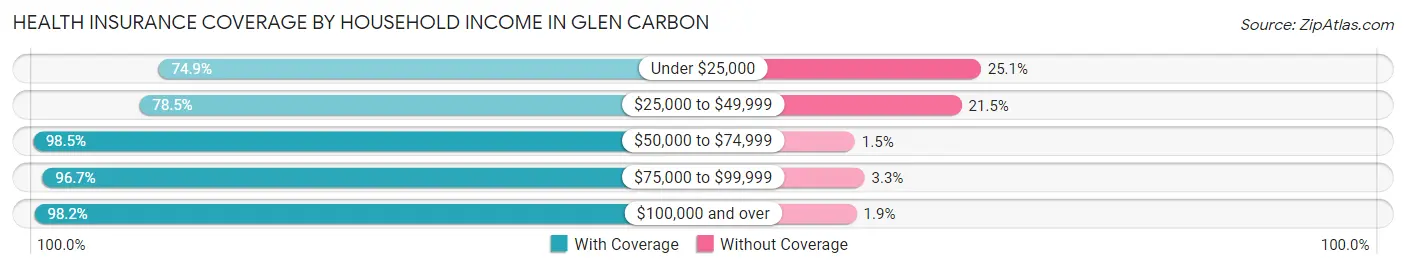
| Household Income | With Coverage | Without Coverage |
| Under $25,000 | 513 (74.9%) | 172 (25.1%) |
| $25,000 to $49,999 | 1,597 (78.5%) | 438 (21.5%) |
| $50,000 to $74,999 | 1,300 (98.5%) | 20 (1.5%) |
| $75,000 to $99,999 | 1,712 (96.7%) | 59 (3.3%) |
| $100,000 and over | 7,544 (98.2%) | 142 (1.8%) |
Public vs Private Health Insurance Coverage by Age in Glen Carbon
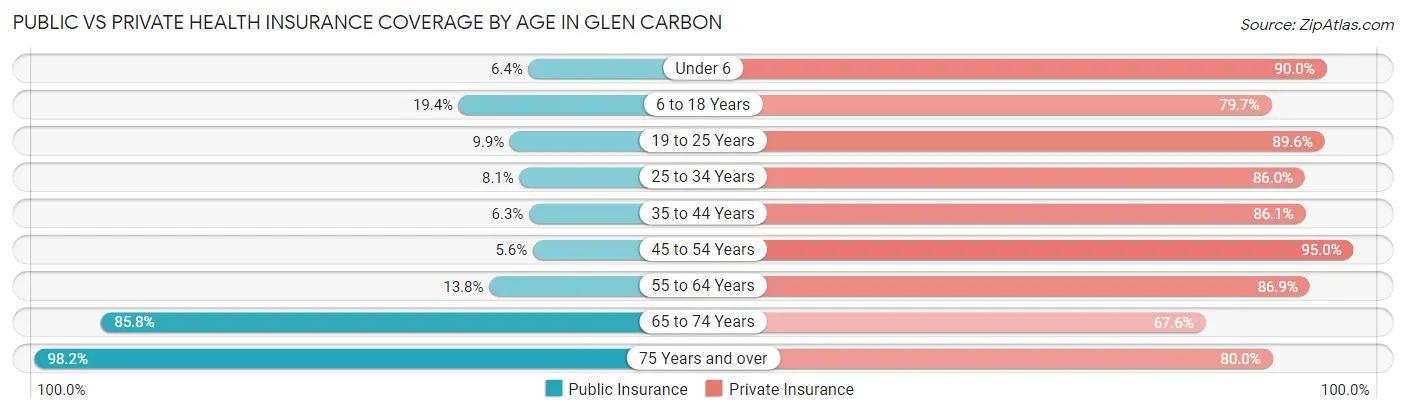
| Age Bracket | Public Insurance | Private Insurance |
| Under 6 | 70 (6.4%) | 979 (90.0%) |
| 6 to 18 Years | 458 (19.4%) | 1,884 (79.7%) |
| 19 to 25 Years | 139 (9.9%) | 1,261 (89.6%) |
| 25 to 34 Years | 107 (8.1%) | 1,133 (86.0%) |
| 35 to 44 Years | 116 (6.3%) | 1,574 (86.1%) |
| 45 to 54 Years | 94 (5.6%) | 1,587 (95.0%) |
| 55 to 64 Years | 205 (13.8%) | 1,295 (86.9%) |
| 65 to 74 Years | 1,065 (85.8%) | 839 (67.5%) |
| 75 Years and over | 1,068 (98.2%) | 870 (80.0%) |
| Total | 3,322 (24.6%) | 11,422 (84.6%) |
Disability Status by Sex by Age in Glen Carbon
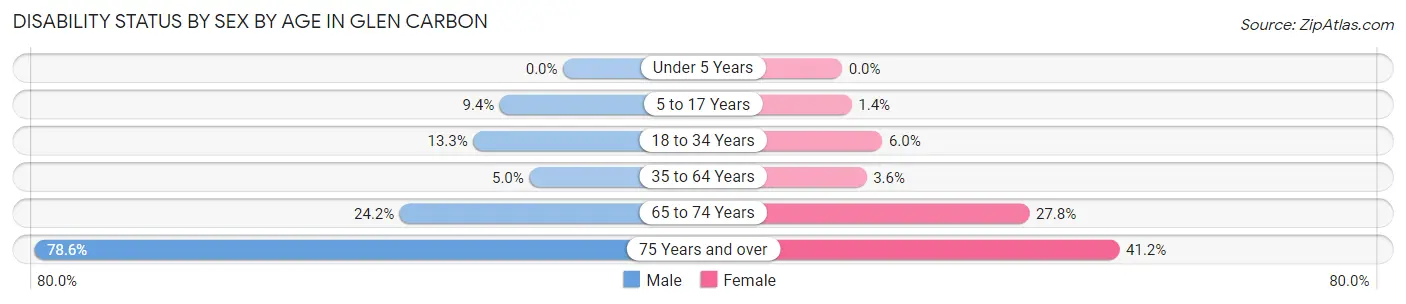
| Age Bracket | Male | Female |
| Under 5 Years | 0 (0.0%) | 0 (0.0%) |
| 5 to 17 Years | 115 (9.4%) | 18 (1.4%) |
| 18 to 34 Years | 226 (13.3%) | 71 (6.0%) |
| 35 to 64 Years | 123 (5.0%) | 92 (3.6%) |
| 65 to 74 Years | 152 (24.2%) | 171 (27.8%) |
| 75 Years and over | 294 (78.6%) | 294 (41.2%) |
Disability Class by Sex by Age in Glen Carbon
Disability Class: Hearing Difficulty
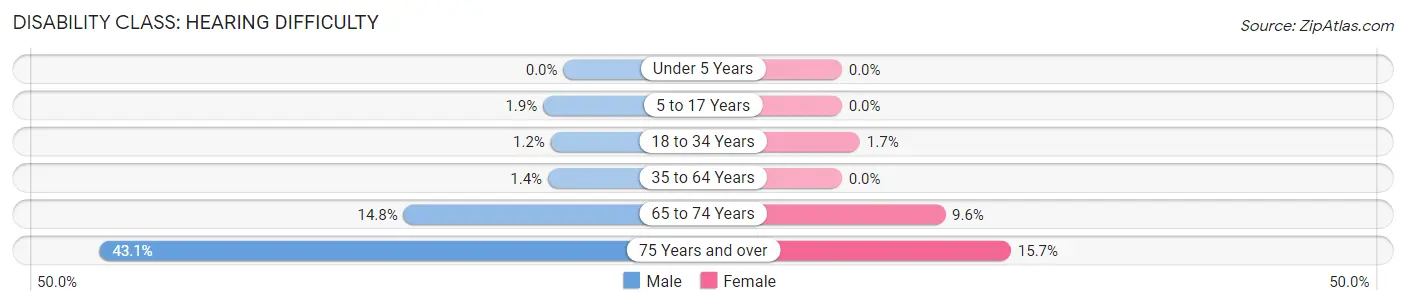
| Age Bracket | Male | Female |
| Under 5 Years | 0 (0.0%) | 0 (0.0%) |
| 5 to 17 Years | 23 (1.9%) | 0 (0.0%) |
| 18 to 34 Years | 20 (1.2%) | 20 (1.7%) |
| 35 to 64 Years | 35 (1.4%) | 0 (0.0%) |
| 65 to 74 Years | 93 (14.8%) | 59 (9.6%) |
| 75 Years and over | 161 (43.0%) | 112 (15.7%) |
Disability Class: Vision Difficulty
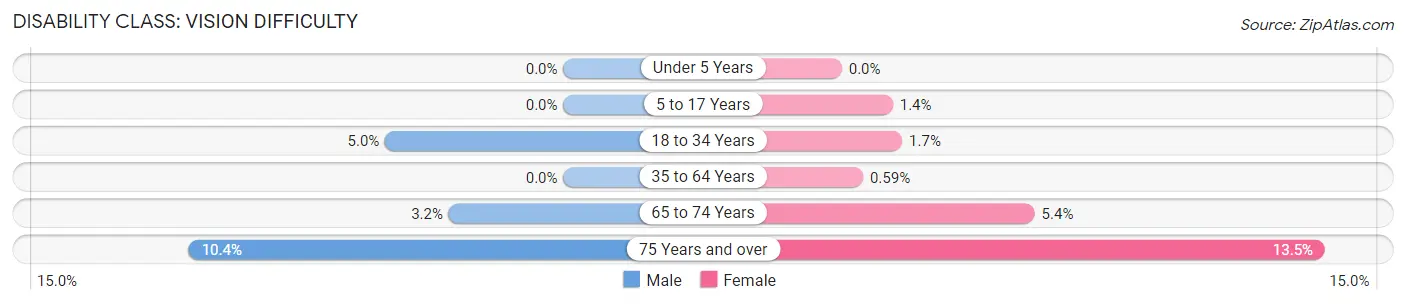
| Age Bracket | Male | Female |
| Under 5 Years | 0 (0.0%) | 0 (0.0%) |
| 5 to 17 Years | 0 (0.0%) | 18 (1.4%) |
| 18 to 34 Years | 84 (5.0%) | 20 (1.7%) |
| 35 to 64 Years | 0 (0.0%) | 15 (0.6%) |
| 65 to 74 Years | 20 (3.2%) | 33 (5.4%) |
| 75 Years and over | 39 (10.4%) | 96 (13.5%) |
Disability Class: Cognitive Difficulty
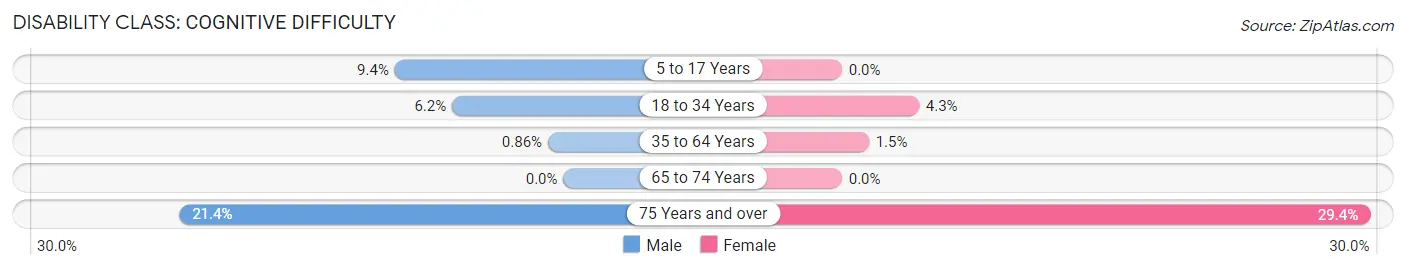
| Age Bracket | Male | Female |
| 5 to 17 Years | 115 (9.4%) | 0 (0.0%) |
| 18 to 34 Years | 105 (6.2%) | 51 (4.3%) |
| 35 to 64 Years | 21 (0.9%) | 38 (1.5%) |
| 65 to 74 Years | 0 (0.0%) | 0 (0.0%) |
| 75 Years and over | 80 (21.4%) | 210 (29.4%) |
Disability Class: Ambulatory Difficulty
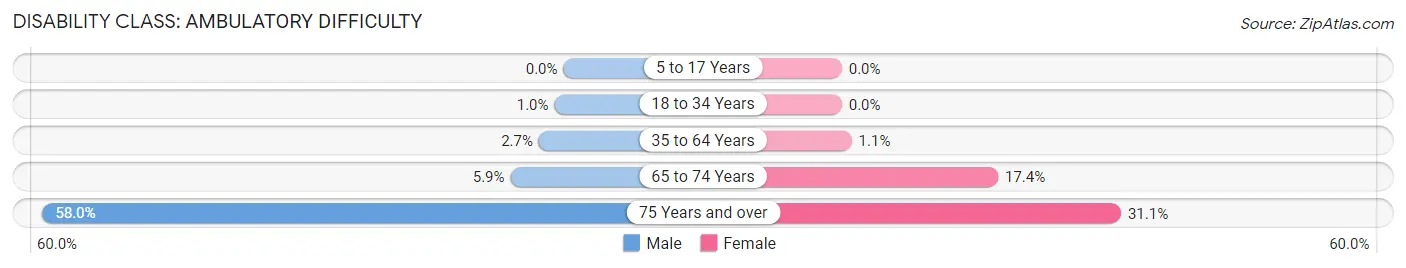
| Age Bracket | Male | Female |
| 5 to 17 Years | 0 (0.0%) | 0 (0.0%) |
| 18 to 34 Years | 17 (1.0%) | 0 (0.0%) |
| 35 to 64 Years | 67 (2.7%) | 28 (1.1%) |
| 65 to 74 Years | 37 (5.9%) | 107 (17.4%) |
| 75 Years and over | 217 (58.0%) | 222 (31.1%) |
Disability Class: Self-Care Difficulty
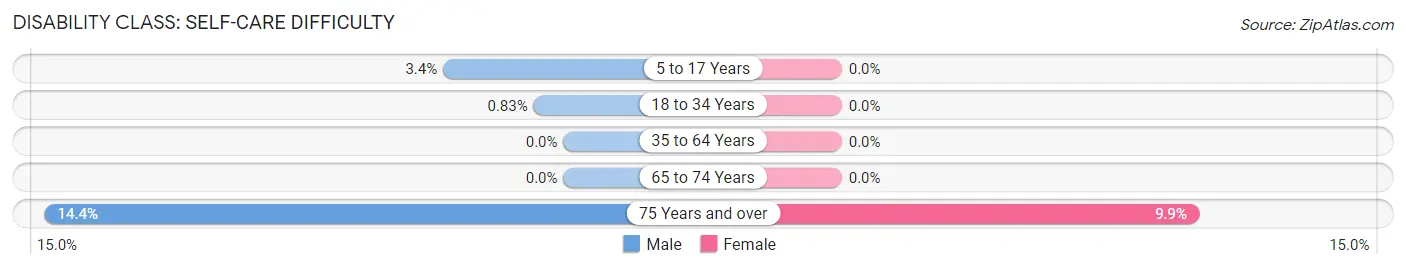
| Age Bracket | Male | Female |
| 5 to 17 Years | 41 (3.4%) | 0 (0.0%) |
| 18 to 34 Years | 14 (0.8%) | 0 (0.0%) |
| 35 to 64 Years | 0 (0.0%) | 0 (0.0%) |
| 65 to 74 Years | 0 (0.0%) | 0 (0.0%) |
| 75 Years and over | 54 (14.4%) | 71 (9.9%) |
Technology Access in Glen Carbon
Computing Device Access in Glen Carbon
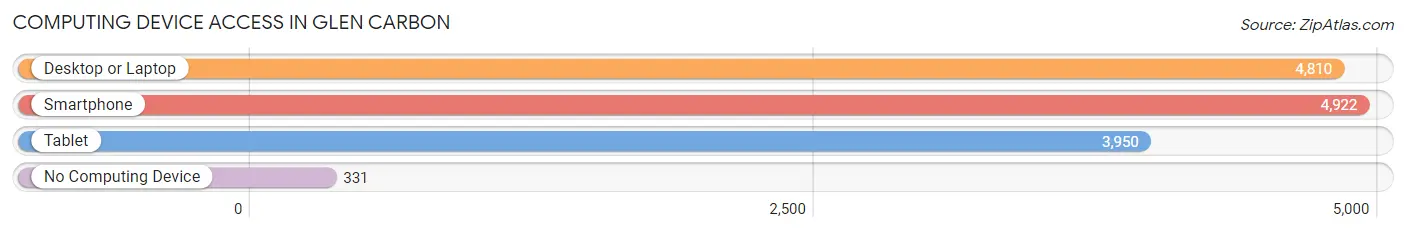
| Device Type | # Households | % Households |
| Desktop or Laptop | 4,810 | 86.5% |
| Smartphone | 4,922 | 88.5% |
| Tablet | 3,950 | 71.1% |
| No Computing Device | 331 | 5.9% |
| Total | 5,559 | 100.0% |
Internet Access in Glen Carbon
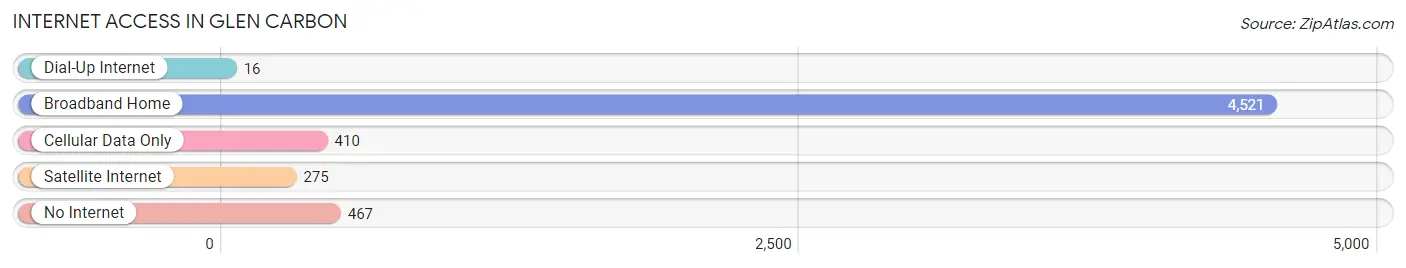
| Internet Type | # Households | % Households |
| Dial-Up Internet | 16 | 0.3% |
| Broadband Home | 4,521 | 81.3% |
| Cellular Data Only | 410 | 7.4% |
| Satellite Internet | 275 | 5.0% |
| No Internet | 467 | 8.4% |
| Total | 5,559 | 100.0% |
Glen Carbon Summary
Glen Carbon is a village located in Madison County, Illinois, United States. It is part of the Greater St. Louis metropolitan area. The population was 12,934 at the 2010 census.
History
Glen Carbon was founded in 1855 by John H. Smith, a coal miner from Pennsylvania. Smith named the village after the coal mine he worked in, which was located in Carbon County, Pennsylvania. The village was incorporated in 1892.
Geography
Glen Carbon is located at 38°45'25" North, 89°59'45" West (38.756944, -89.995833). According to the 2010 census, Glen Carbon has a total area of 8.9 square miles, of which 8.8 square miles is land and 0.1 square miles is water.
Economy
The economy of Glen Carbon is largely based on the service industry. The village is home to several restaurants, retail stores, and other businesses. The village is also home to several large employers, including the Anderson Hospital, the Madison County Transit District, and the Glen Carbon Fire Protection District.
Demographics
As of the 2010 census, there were 12,934 people, 5,093 households, and 3,541 families residing in the village. The population density was 1,467.2 people per square mile. The racial makeup of the village was 94.2% White, 1.3% African American, 0.3% Native American, 1.7% Asian, 0.1% Pacific Islander, 0.9% from other races, and 1.5% from two or more races. Hispanic or Latino of any race were 2.7% of the population.
The median income for a household in the village was $68,945, and the median income for a family was $81,945. The per capita income for the village was $31,945. About 2.7% of families and 3.7% of the population were below the poverty line, including 4.2% of those under age 18 and 4.2% of those age 65 or over.
Common Questions
What is Per Capita Income in Glen Carbon?
Per Capita income in Glen Carbon is $50,432.
What is the Median Family Income in Glen Carbon?
Median Family Income in Glen Carbon is $121,322.
What is the Median Household income in Glen Carbon?
Median Household Income in Glen Carbon is $92,002.
What is Income or Wage Gap in Glen Carbon?
Income or Wage Gap in Glen Carbon is 25.7%.
Women in Glen Carbon earn 74.3 cents for every dollar earned by a man.
What is Inequality or Gini Index in Glen Carbon?
Inequality or Gini Index in Glen Carbon is 0.43.
What is the Total Population of Glen Carbon?
Total Population of Glen Carbon is 13,654.
What is the Total Male Population of Glen Carbon?
Total Male Population of Glen Carbon is 6,892.
What is the Total Female Population of Glen Carbon?
Total Female Population of Glen Carbon is 6,762.
What is the Ratio of Males per 100 Females in Glen Carbon?
There are 101.92 Males per 100 Females in Glen Carbon.
What is the Ratio of Females per 100 Males in Glen Carbon?
There are 98.11 Females per 100 Males in Glen Carbon.
What is the Median Population Age in Glen Carbon?
Median Population Age in Glen Carbon is 38.8 Years.
What is the Average Family Size in Glen Carbon
Average Family Size in Glen Carbon is 2.9 People.
What is the Average Household Size in Glen Carbon
Average Household Size in Glen Carbon is 2.4 People.
How Large is the Labor Force in Glen Carbon?
There are 7,261 People in the Labor Forcein in Glen Carbon.
What is the Percentage of People in the Labor Force in Glen Carbon?
68.0% of People are in the Labor Force in Glen Carbon.
What is the Unemployment Rate in Glen Carbon?
Unemployment Rate in Glen Carbon is 4.1%.