Riverside, IL Map & Demographics
Riverside Map
Riverside Overview
$64,469
PER CAPITA INCOME
$178,200
AVG FAMILY INCOME
$149,464
AVG HOUSEHOLD INCOME
17.3%
WAGE / INCOME GAP [ % ]
82.7¢/ $1
WAGE / INCOME GAP [ $ ]
0.41
INEQUALITY / GINI INDEX
9,225
TOTAL POPULATION
4,717
MALE POPULATION
4,508
FEMALE POPULATION
104.64
MALES / 100 FEMALES
95.57
FEMALES / 100 MALES
41.6
MEDIAN AGE
3.2
AVG FAMILY SIZE
2.7
AVG HOUSEHOLD SIZE
4,647
LABOR FORCE [ PEOPLE ]
65.4%
PERCENT IN LABOR FORCE
3.1%
UNEMPLOYMENT RATE
Riverside Zip Codes
Riverside Area Codes
Income in Riverside
Income Overview in Riverside
Per Capita Income in Riverside is $64,469, while median incomes of families and households are $178,200 and $149,464 respectively.
| Characteristic | Number | Measure |
| Per Capita Income | 9,225 | $64,469 |
| Median Family Income | 2,578 | $178,200 |
| Mean Family Income | 2,578 | $203,160 |
| Median Household Income | 3,386 | $149,464 |
| Mean Household Income | 3,386 | $172,521 |
| Income Deficit | 2,578 | $0 |
| Wage / Income Gap (%) | 9,225 | 17.27% |
| Wage / Income Gap ($) | 9,225 | 82.73¢ per $1 |
| Gini / Inequality Index | 9,225 | 0.41 |
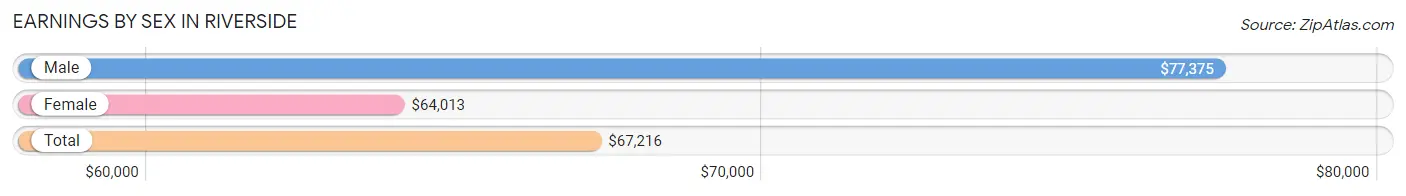
Earnings by Sex in Riverside
Average Earnings in Riverside are $67,216, $77,375 for men and $64,013 for women, a difference of 17.3%.
| Sex | Number | Average Earnings |
| Male | 2,519 (51.7%) | $77,375 |
| Female | 2,352 (48.3%) | $64,013 |
| Total | 4,871 (100.0%) | $67,216 |
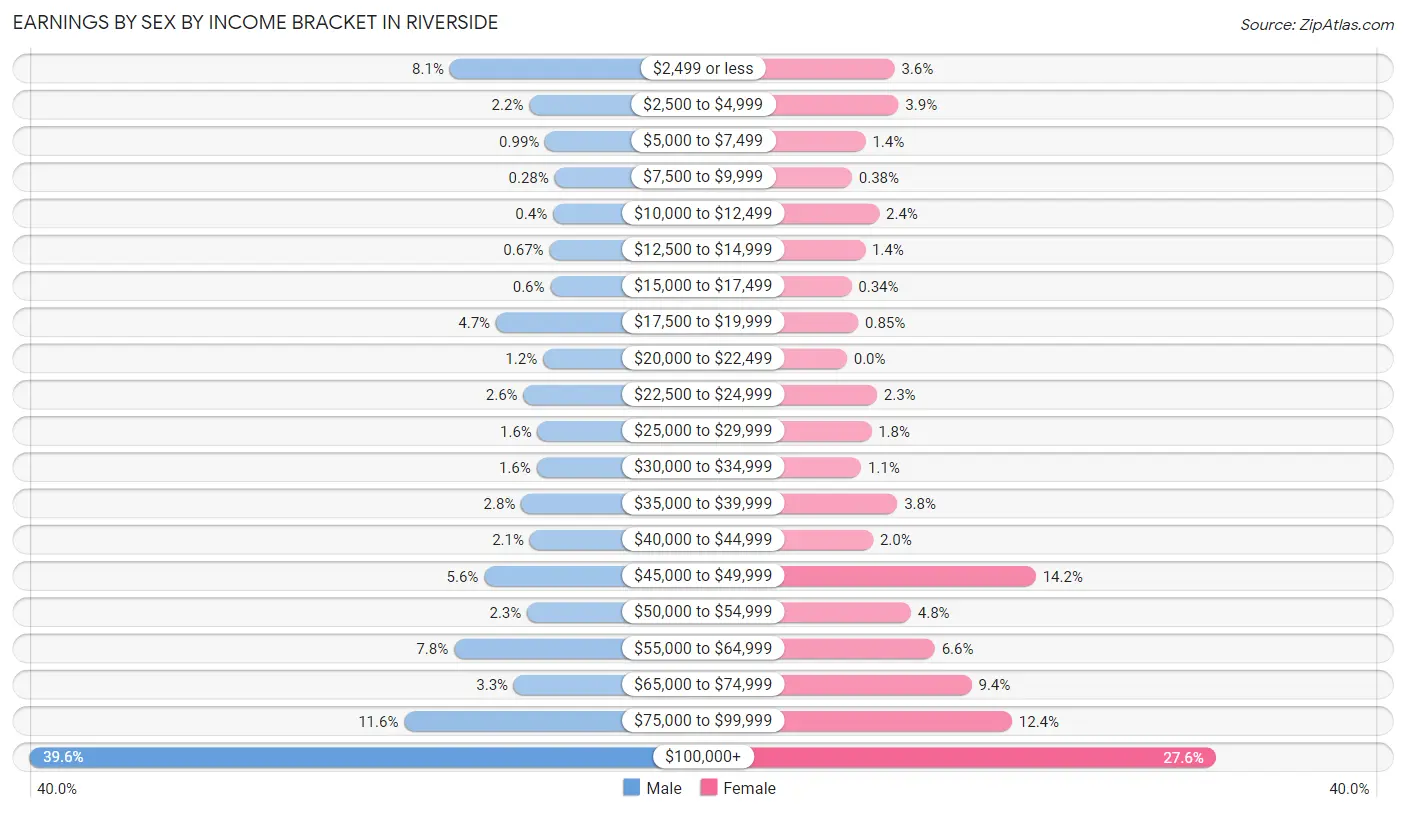
Earnings by Sex by Income Bracket in Riverside
The most common earnings brackets in Riverside are $100,000+ for men (997 | 39.6%) and $100,000+ for women (650 | 27.6%).
| Income | Male | Female |
| $2,499 or less | 205 (8.1%) | 84 (3.6%) |
| $2,500 to $4,999 | 55 (2.2%) | 91 (3.9%) |
| $5,000 to $7,499 | 25 (1.0%) | 33 (1.4%) |
| $7,500 to $9,999 | 7 (0.3%) | 9 (0.4%) |
| $10,000 to $12,499 | 10 (0.4%) | 57 (2.4%) |
| $12,500 to $14,999 | 17 (0.7%) | 32 (1.4%) |
| $15,000 to $17,499 | 15 (0.6%) | 8 (0.3%) |
| $17,500 to $19,999 | 118 (4.7%) | 20 (0.9%) |
| $20,000 to $22,499 | 29 (1.1%) | 0 (0.0%) |
| $22,500 to $24,999 | 66 (2.6%) | 53 (2.2%) |
| $25,000 to $29,999 | 39 (1.5%) | 43 (1.8%) |
| $30,000 to $34,999 | 41 (1.6%) | 25 (1.1%) |
| $35,000 to $39,999 | 70 (2.8%) | 89 (3.8%) |
| $40,000 to $44,999 | 54 (2.1%) | 46 (2.0%) |
| $45,000 to $49,999 | 140 (5.6%) | 333 (14.2%) |
| $50,000 to $54,999 | 59 (2.3%) | 113 (4.8%) |
| $55,000 to $64,999 | 197 (7.8%) | 155 (6.6%) |
| $65,000 to $74,999 | 84 (3.3%) | 220 (9.3%) |
| $75,000 to $99,999 | 291 (11.6%) | 291 (12.4%) |
| $100,000+ | 997 (39.6%) | 650 (27.6%) |
| Total | 2,519 (100.0%) | 2,352 (100.0%) |
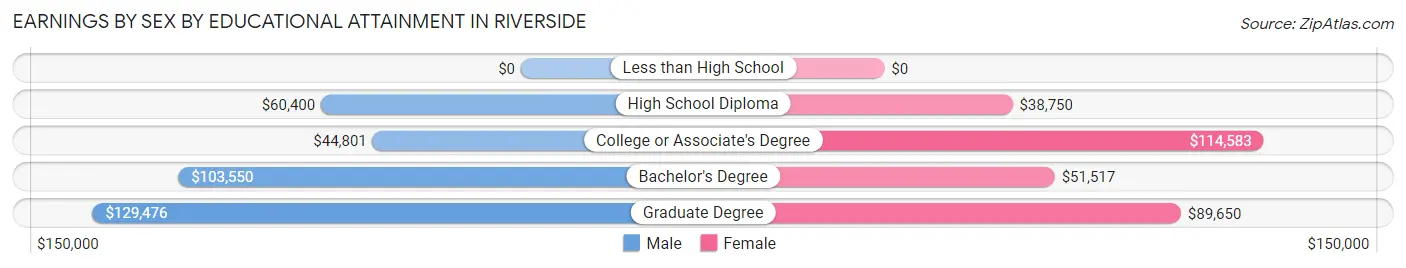
Earnings by Sex by Educational Attainment in Riverside
Average earnings in Riverside are $90,114 for men and $67,471 for women, a difference of 25.1%. Men with an educational attainment of graduate degree enjoy the highest average annual earnings of $129,476, while those with college or associate's degree education earn the least with $44,801. Women with an educational attainment of college or associate's degree earn the most with the average annual earnings of $114,583, while those with high school diploma education have the smallest earnings of $38,750.
| Educational Attainment | Male Income | Female Income |
| Less than High School | - | - |
| High School Diploma | $60,400 | $38,750 |
| College or Associate's Degree | $44,801 | $114,583 |
| Bachelor's Degree | $103,550 | $51,517 |
| Graduate Degree | $129,476 | $89,650 |
| Total | $90,114 | $67,471 |
Family Income in Riverside
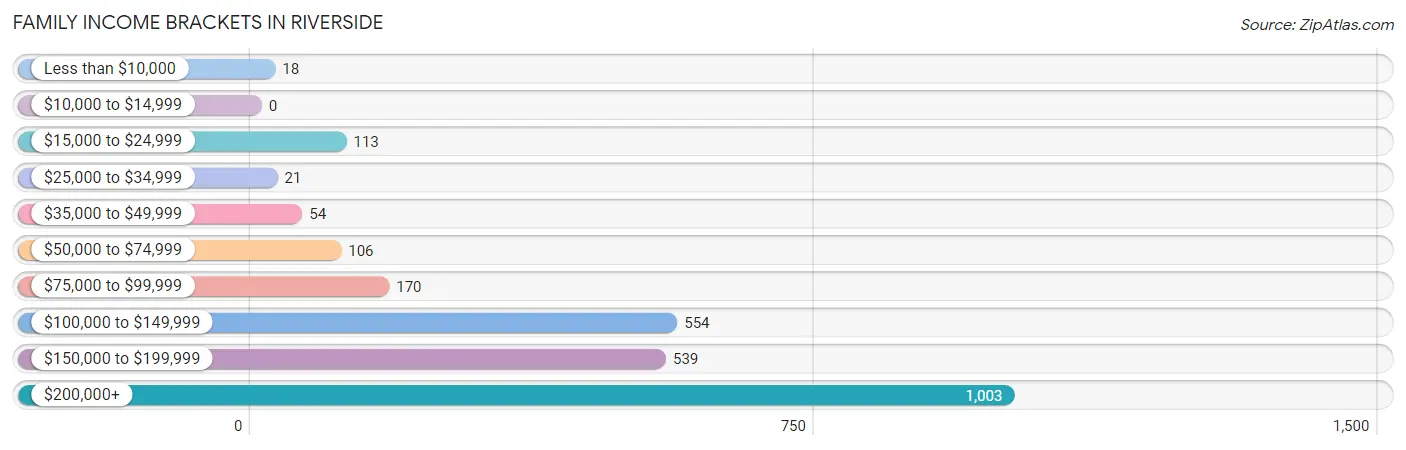
Family Income Brackets in Riverside
According to the Riverside family income data, there are 1,003 families falling into the $200,000+ income range, which is the most common income bracket and makes up 38.9% of all families.
| Income Bracket | # Families | % Families |
| Less than $10,000 | 18 | 0.7% |
| $10,000 to $14,999 | 0 | 0.0% |
| $15,000 to $24,999 | 113 | 4.4% |
| $25,000 to $34,999 | 21 | 0.8% |
| $35,000 to $49,999 | 54 | 2.1% |
| $50,000 to $74,999 | 106 | 4.1% |
| $75,000 to $99,999 | 170 | 6.6% |
| $100,000 to $149,999 | 554 | 21.5% |
| $150,000 to $199,999 | 539 | 20.9% |
| $200,000+ | 1,003 | 38.9% |
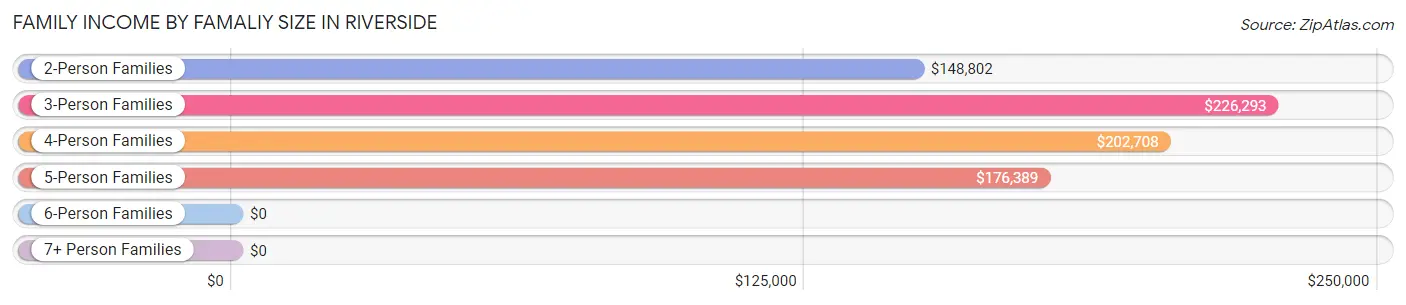
Family Income by Famaliy Size in Riverside
3-person families (579 | 22.5%) account for the highest median family income in Riverside with $226,293 per family, while 3-person families (579 | 22.5%) have the highest median income of $75,431 per family member.
| Income Bracket | # Families | Median Income |
| 2-Person Families | 1,051 (40.8%) | $148,802 |
| 3-Person Families | 579 (22.5%) | $226,293 |
| 4-Person Families | 746 (28.9%) | $202,708 |
| 5-Person Families | 164 (6.4%) | $176,389 |
| 6-Person Families | 38 (1.5%) | $0 |
| 7+ Person Families | 0 (0.0%) | $0 |
| Total | 2,578 (100.0%) | $178,200 |
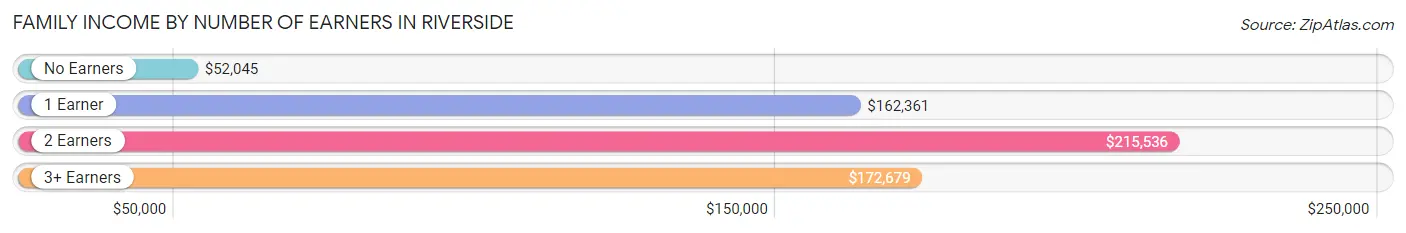
Family Income by Number of Earners in Riverside
The median family income in Riverside is $178,200, with families comprising 2 earners (1,341) having the highest median family income of $215,536, while families with no earners (296) have the lowest median family income of $52,045, accounting for 52.0% and 11.5% of families, respectively.
| Number of Earners | # Families | Median Income |
| No Earners | 296 (11.5%) | $52,045 |
| 1 Earner | 649 (25.2%) | $162,361 |
| 2 Earners | 1,341 (52.0%) | $215,536 |
| 3+ Earners | 292 (11.3%) | $172,679 |
| Total | 2,578 (100.0%) | $178,200 |
Household Income in Riverside
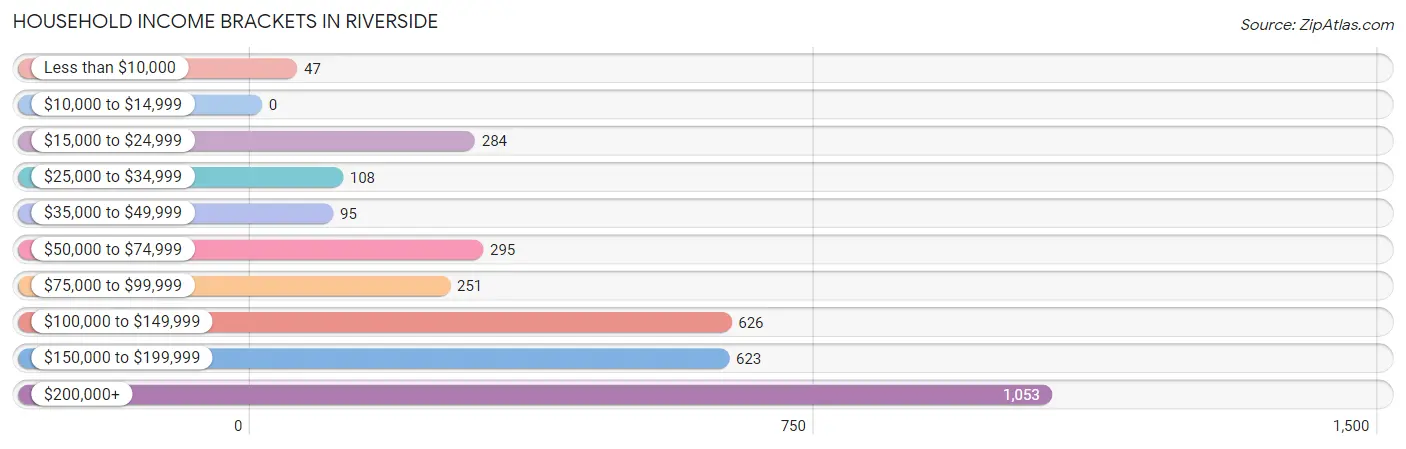
Household Income Brackets in Riverside
With 1,053 households falling in the category, the $200,000+ income range is the most frequent in Riverside, accounting for 31.1% of all households.
| Income Bracket | # Households | % Households |
| Less than $10,000 | 47 | 1.4% |
| $10,000 to $14,999 | 0 | 0.0% |
| $15,000 to $24,999 | 284 | 8.4% |
| $25,000 to $34,999 | 108 | 3.2% |
| $35,000 to $49,999 | 95 | 2.8% |
| $50,000 to $74,999 | 295 | 8.7% |
| $75,000 to $99,999 | 251 | 7.4% |
| $100,000 to $149,999 | 626 | 18.5% |
| $150,000 to $199,999 | 623 | 18.4% |
| $200,000+ | 1,053 | 31.1% |
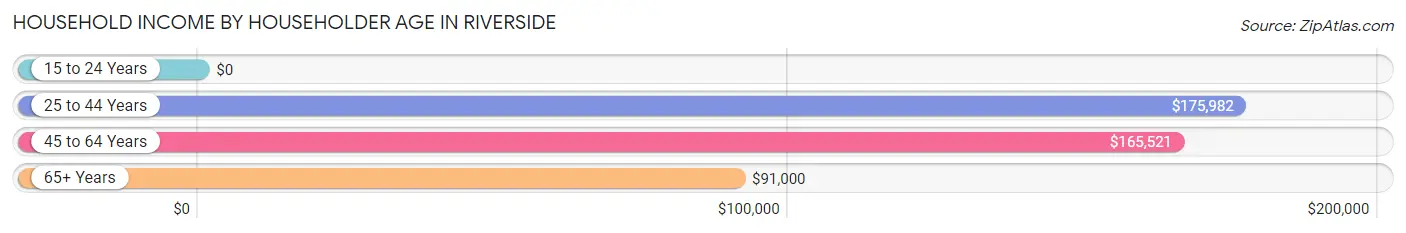
Household Income by Householder Age in Riverside
The median household income in Riverside is $149,464, with the highest median household income of $175,982 found in the 25 to 44 years age bracket for the primary householder. A total of 940 households (27.8%) fall into this category. Meanwhile, the 15 to 24 years age bracket for the primary householder has the lowest median household income of $0, with 11 households (0.3%) in this group.
| Income Bracket | # Households | Median Income |
| 15 to 24 Years | 11 (0.3%) | $0 |
| 25 to 44 Years | 940 (27.8%) | $175,982 |
| 45 to 64 Years | 1,337 (39.5%) | $165,521 |
| 65+ Years | 1,098 (32.4%) | $91,000 |
| Total | 3,386 (100.0%) | $149,464 |
Poverty in Riverside
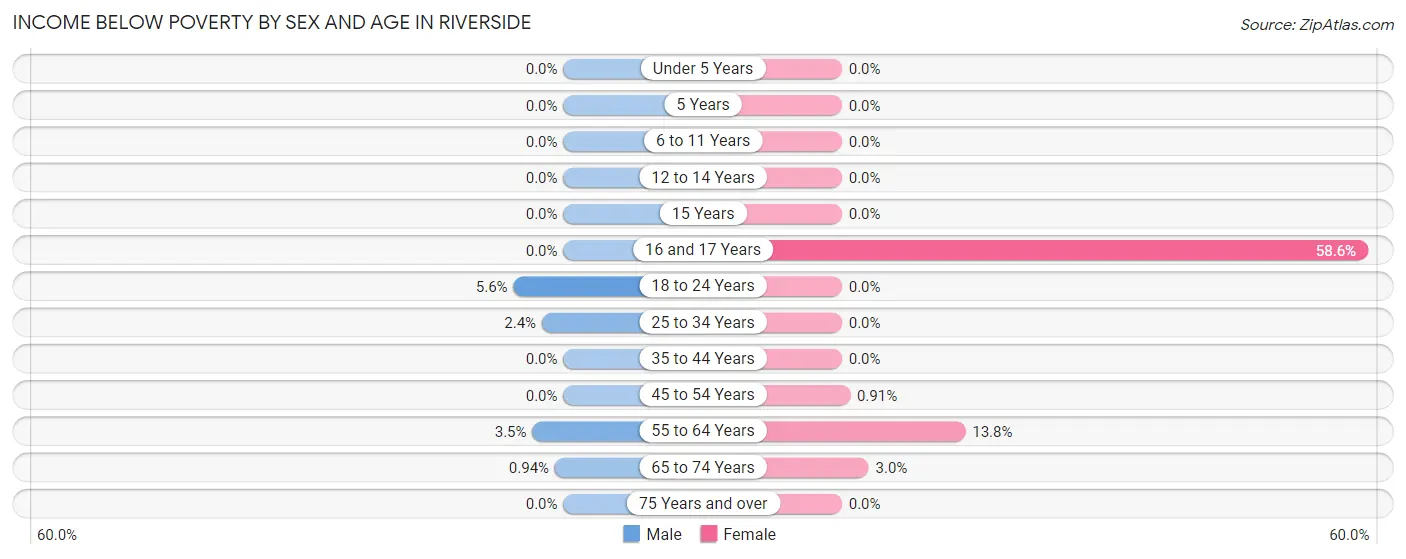
Income Below Poverty by Sex and Age in Riverside
With 0.9% poverty level for males and 5.6% for females among the residents of Riverside, 18 to 24 year old males and 16 and 17 year old females are the most vulnerable to poverty, with 11 males (5.6%) and 116 females (58.6%) in their respective age groups living below the poverty level.
| Age Bracket | Male | Female |
| Under 5 Years | 0 (0.0%) | 0 (0.0%) |
| 5 Years | 0 (0.0%) | 0 (0.0%) |
| 6 to 11 Years | 0 (0.0%) | 0 (0.0%) |
| 12 to 14 Years | 0 (0.0%) | 0 (0.0%) |
| 15 Years | 0 (0.0%) | 0 (0.0%) |
| 16 and 17 Years | 0 (0.0%) | 116 (58.6%) |
| 18 to 24 Years | 11 (5.6%) | 0 (0.0%) |
| 25 to 34 Years | 9 (2.4%) | 0 (0.0%) |
| 35 to 44 Years | 0 (0.0%) | 0 (0.0%) |
| 45 to 54 Years | 0 (0.0%) | 5 (0.9%) |
| 55 to 64 Years | 18 (3.5%) | 111 (13.8%) |
| 65 to 74 Years | 4 (0.9%) | 22 (3.0%) |
| 75 Years and over | 0 (0.0%) | 0 (0.0%) |
| Total | 42 (0.9%) | 254 (5.6%) |
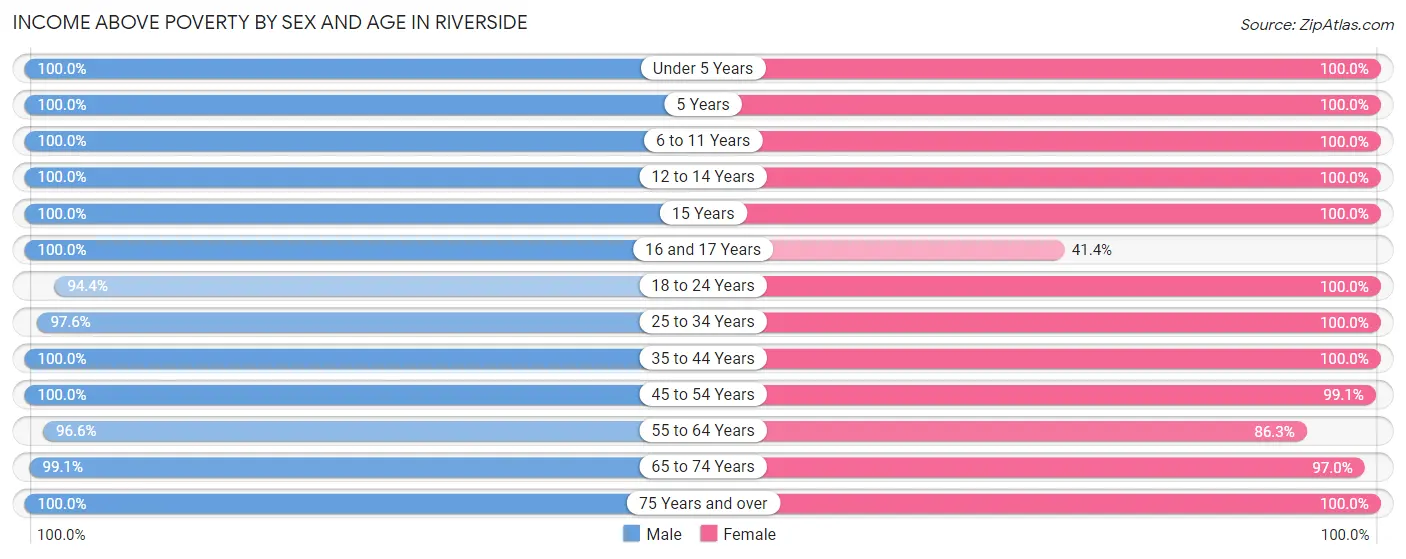
Income Above Poverty by Sex and Age in Riverside
According to the poverty statistics in Riverside, males aged under 5 years and females aged under 5 years are the age groups that are most secure financially, with 100.0% of males and 100.0% of females in these age groups living above the poverty line.
| Age Bracket | Male | Female |
| Under 5 Years | 284 (100.0%) | 220 (100.0%) |
| 5 Years | 149 (100.0%) | 153 (100.0%) |
| 6 to 11 Years | 526 (100.0%) | 258 (100.0%) |
| 12 to 14 Years | 383 (100.0%) | 81 (100.0%) |
| 15 Years | 42 (100.0%) | 23 (100.0%) |
| 16 and 17 Years | 415 (100.0%) | 82 (41.4%) |
| 18 to 24 Years | 187 (94.4%) | 206 (100.0%) |
| 25 to 34 Years | 368 (97.6%) | 225 (100.0%) |
| 35 to 44 Years | 555 (100.0%) | 747 (100.0%) |
| 45 to 54 Years | 635 (100.0%) | 543 (99.1%) |
| 55 to 64 Years | 503 (96.6%) | 696 (86.3%) |
| 65 to 74 Years | 420 (99.1%) | 716 (97.0%) |
| 75 Years and over | 208 (100.0%) | 304 (100.0%) |
| Total | 4,675 (99.1%) | 4,254 (94.4%) |
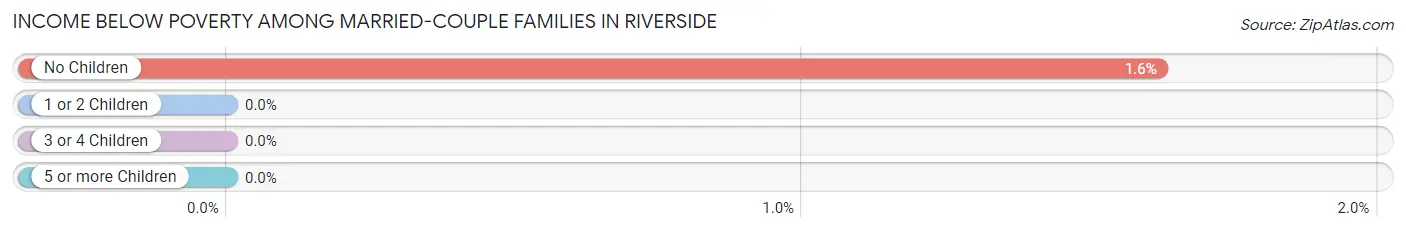
Income Below Poverty Among Married-Couple Families in Riverside
The poverty statistics for married-couple families in Riverside show that 0.8% or 17 of the total 2,015 families live below the poverty line. Families with no children have the highest poverty rate of 1.6%, comprising of 17 families. On the other hand, families with 1 or 2 children have the lowest poverty rate of 0.0%, which includes 0 families.
| Children | Above Poverty | Below Poverty |
| No Children | 1,031 (98.4%) | 17 (1.6%) |
| 1 or 2 Children | 818 (100.0%) | 0 (0.0%) |
| 3 or 4 Children | 149 (100.0%) | 0 (0.0%) |
| 5 or more Children | 0 (0.0%) | 0 (0.0%) |
| Total | 1,998 (99.2%) | 17 (0.8%) |
Income Below Poverty Among Single-Parent Households in Riverside
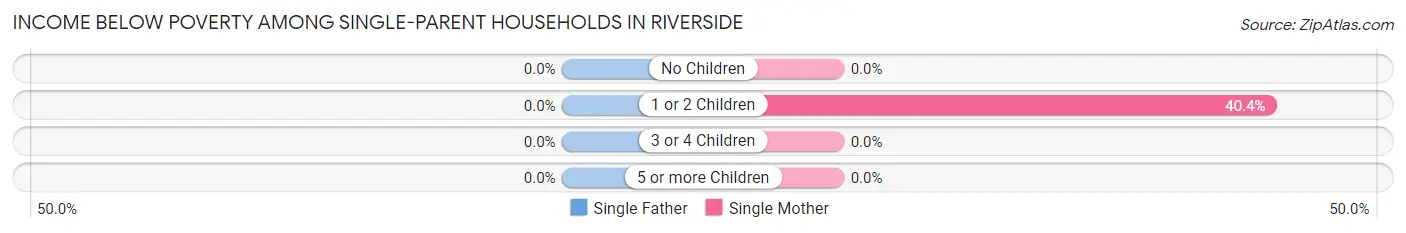
| Children | Single Father | Single Mother |
| No Children | 0 (0.0%) | 0 (0.0%) |
| 1 or 2 Children | 0 (0.0%) | 103 (40.4%) |
| 3 or 4 Children | 0 (0.0%) | 0 (0.0%) |
| 5 or more Children | 0 (0.0%) | 0 (0.0%) |
| Total | 0 (0.0%) | 103 (21.1%) |
Income Below Poverty Among Married-Couple vs Single-Parent Households in Riverside
The poverty data for Riverside shows that 17 of the married-couple family households (0.8%) and 103 of the single-parent households (18.3%) are living below the poverty level. Within the married-couple family households, those with no children have the highest poverty rate, with 17 households (1.6%) falling below the poverty line. Among the single-parent households, those with 1 or 2 children have the highest poverty rate, with 103 household (35.5%) living below poverty.
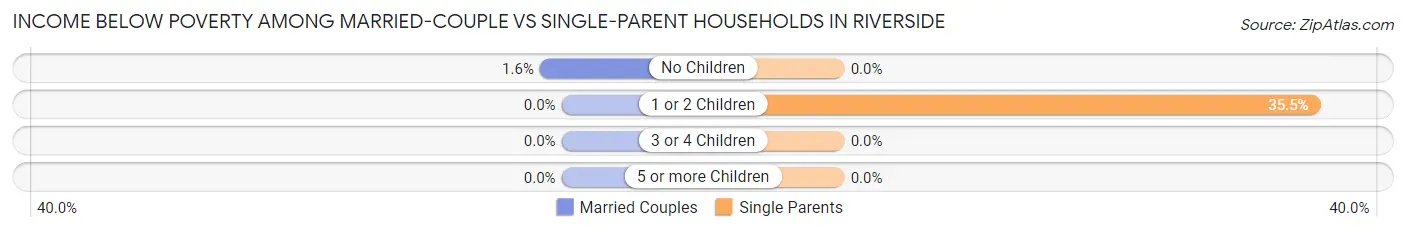
| Children | Married-Couple Families | Single-Parent Households |
| No Children | 17 (1.6%) | 0 (0.0%) |
| 1 or 2 Children | 0 (0.0%) | 103 (35.5%) |
| 3 or 4 Children | 0 (0.0%) | 0 (0.0%) |
| 5 or more Children | 0 (0.0%) | 0 (0.0%) |
| Total | 17 (0.8%) | 103 (18.3%) |
Race in Riverside
The most populous races in Riverside are White / Caucasian (6,073 | 65.8%), Hispanic or Latino (2,952 | 32.0%), and Two or more Races (2,068 | 22.4%).
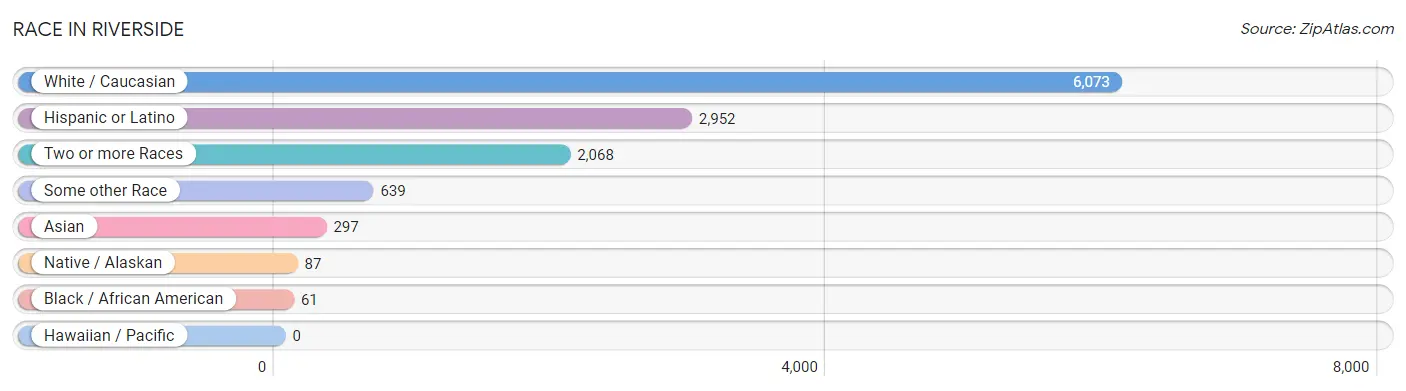
| Race | # Population | % Population |
| Asian | 297 | 3.2% |
| Black / African American | 61 | 0.7% |
| Hawaiian / Pacific | 0 | 0.0% |
| Hispanic or Latino | 2,952 | 32.0% |
| Native / Alaskan | 87 | 0.9% |
| White / Caucasian | 6,073 | 65.8% |
| Two or more Races | 2,068 | 22.4% |
| Some other Race | 639 | 6.9% |
| Total | 9,225 | 100.0% |
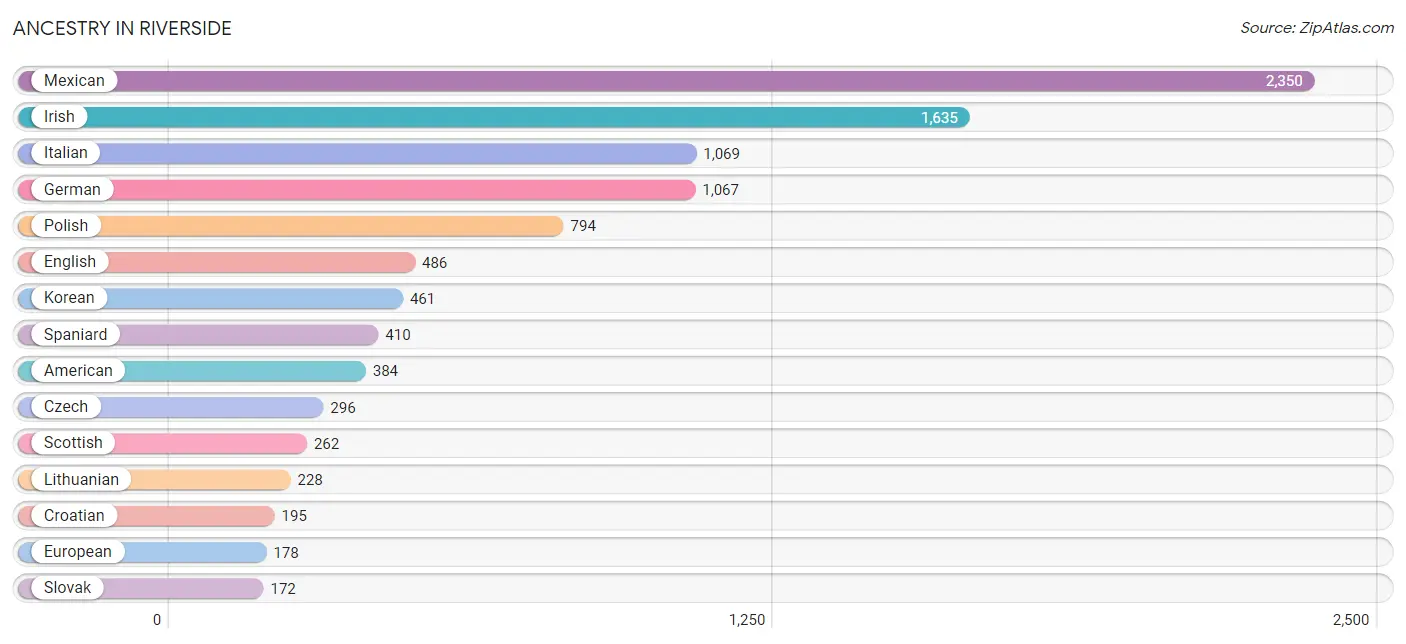
Ancestry in Riverside
The most populous ancestries reported in Riverside are Mexican (2,350 | 25.5%), Irish (1,635 | 17.7%), Italian (1,069 | 11.6%), German (1,067 | 11.6%), and Polish (794 | 8.6%), together accounting for 75.0% of all Riverside residents.
| Ancestry | # Population | % Population |
| American | 384 | 4.2% |
| Arab | 62 | 0.7% |
| Armenian | 33 | 0.4% |
| Austrian | 48 | 0.5% |
| Bhutanese | 56 | 0.6% |
| British | 5 | 0.1% |
| Bulgarian | 5 | 0.1% |
| Central American | 11 | 0.1% |
| Chippewa | 11 | 0.1% |
| Colombian | 66 | 0.7% |
| Croatian | 195 | 2.1% |
| Cuban | 89 | 1.0% |
| Czech | 296 | 3.2% |
| Czechoslovakian | 98 | 1.1% |
| Danish | 22 | 0.2% |
| Dutch | 104 | 1.1% |
| Eastern European | 23 | 0.3% |
| English | 486 | 5.3% |
| European | 178 | 1.9% |
| Finnish | 40 | 0.4% |
| French | 92 | 1.0% |
| French Canadian | 40 | 0.4% |
| German | 1,067 | 11.6% |
| Greek | 169 | 1.8% |
| Guatemalan | 11 | 0.1% |
| Hungarian | 10 | 0.1% |
| Indian (Asian) | 101 | 1.1% |
| Irish | 1,635 | 17.7% |
| Iroquois | 3 | 0.0% |
| Italian | 1,069 | 11.6% |
| Korean | 461 | 5.0% |
| Lebanese | 39 | 0.4% |
| Lithuanian | 228 | 2.5% |
| Mexican | 2,350 | 25.5% |
| Mexican American Indian | 10 | 0.1% |
| Norwegian | 139 | 1.5% |
| Pakistani | 39 | 0.4% |
| Polish | 794 | 8.6% |
| Puerto Rican | 11 | 0.1% |
| Romanian | 13 | 0.1% |
| Russian | 73 | 0.8% |
| Scotch-Irish | 121 | 1.3% |
| Scottish | 262 | 2.8% |
| Serbian | 72 | 0.8% |
| Slavic | 11 | 0.1% |
| Slovak | 172 | 1.9% |
| Slovene | 45 | 0.5% |
| South American | 66 | 0.7% |
| Spaniard | 410 | 4.4% |
| Spanish | 15 | 0.2% |
| Swedish | 135 | 1.5% |
| Swiss | 61 | 0.7% |
| Syrian | 32 | 0.4% |
| Thai | 101 | 1.1% |
| Turkish | 11 | 0.1% |
| Ukrainian | 48 | 0.5% | View All 56 Rows |
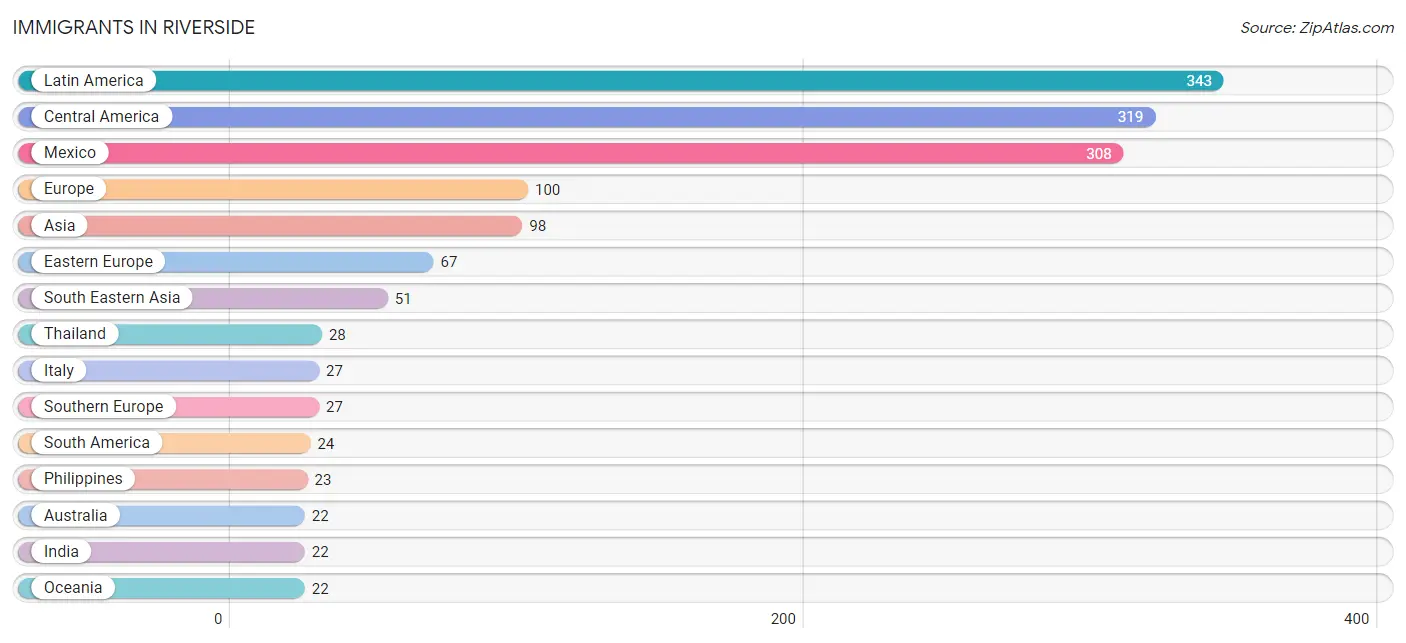
Immigrants in Riverside
The most numerous immigrant groups reported in Riverside came from Latin America (343 | 3.7%), Central America (319 | 3.5%), Mexico (308 | 3.3%), Europe (100 | 1.1%), and Asia (98 | 1.1%), together accounting for 12.7% of all Riverside residents.
| Immigration Origin | # Population | % Population |
| Asia | 98 | 1.1% |
| Australia | 22 | 0.2% |
| Bulgaria | 5 | 0.1% |
| Canada | 11 | 0.1% |
| Central America | 319 | 3.5% |
| China | 15 | 0.2% |
| Colombia | 20 | 0.2% |
| Eastern Asia | 15 | 0.2% |
| Eastern Europe | 67 | 0.7% |
| Europe | 100 | 1.1% |
| France | 6 | 0.1% |
| Guatemala | 11 | 0.1% |
| India | 22 | 0.2% |
| Italy | 27 | 0.3% |
| Latin America | 343 | 3.7% |
| Lithuania | 7 | 0.1% |
| Mexico | 308 | 3.3% |
| Oceania | 22 | 0.2% |
| Philippines | 23 | 0.3% |
| Poland | 10 | 0.1% |
| Romania | 12 | 0.1% |
| Serbia | 7 | 0.1% |
| South America | 24 | 0.3% |
| South Central Asia | 22 | 0.2% |
| South Eastern Asia | 51 | 0.5% |
| Southern Europe | 27 | 0.3% |
| Syria | 10 | 0.1% |
| Thailand | 28 | 0.3% |
| Ukraine | 5 | 0.1% |
| Venezuela | 4 | 0.0% |
| Western Asia | 10 | 0.1% |
| Western Europe | 6 | 0.1% | View All 32 Rows |
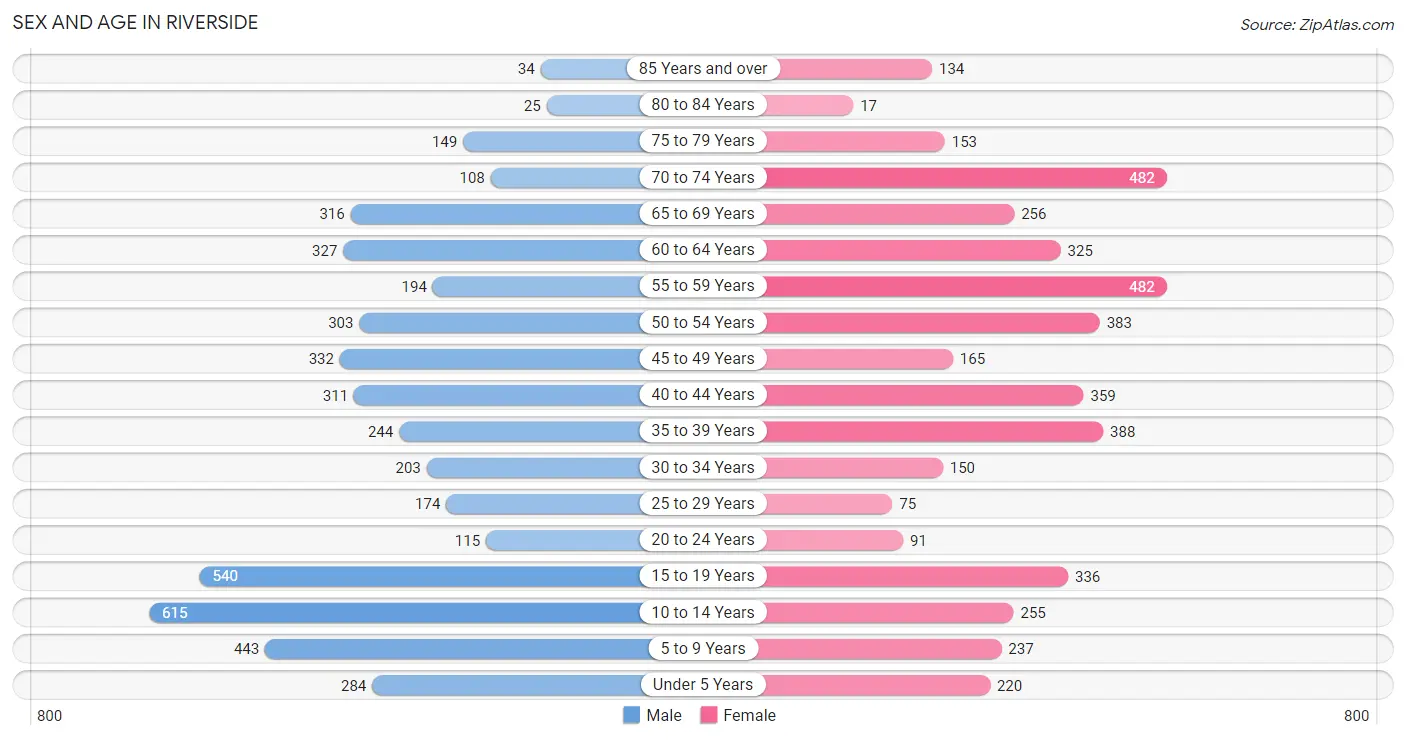
Sex and Age in Riverside
Sex and Age in Riverside
The most populous age groups in Riverside are 10 to 14 Years (615 | 13.0%) for men and 55 to 59 Years (482 | 10.7%) for women.
| Age Bracket | Male | Female |
| Under 5 Years | 284 (6.0%) | 220 (4.9%) |
| 5 to 9 Years | 443 (9.4%) | 237 (5.3%) |
| 10 to 14 Years | 615 (13.0%) | 255 (5.7%) |
| 15 to 19 Years | 540 (11.5%) | 336 (7.4%) |
| 20 to 24 Years | 115 (2.4%) | 91 (2.0%) |
| 25 to 29 Years | 174 (3.7%) | 75 (1.7%) |
| 30 to 34 Years | 203 (4.3%) | 150 (3.3%) |
| 35 to 39 Years | 244 (5.2%) | 388 (8.6%) |
| 40 to 44 Years | 311 (6.6%) | 359 (8.0%) |
| 45 to 49 Years | 332 (7.0%) | 165 (3.7%) |
| 50 to 54 Years | 303 (6.4%) | 383 (8.5%) |
| 55 to 59 Years | 194 (4.1%) | 482 (10.7%) |
| 60 to 64 Years | 327 (6.9%) | 325 (7.2%) |
| 65 to 69 Years | 316 (6.7%) | 256 (5.7%) |
| 70 to 74 Years | 108 (2.3%) | 482 (10.7%) |
| 75 to 79 Years | 149 (3.2%) | 153 (3.4%) |
| 80 to 84 Years | 25 (0.5%) | 17 (0.4%) |
| 85 Years and over | 34 (0.7%) | 134 (3.0%) |
| Total | 4,717 (100.0%) | 4,508 (100.0%) |
Families and Households in Riverside
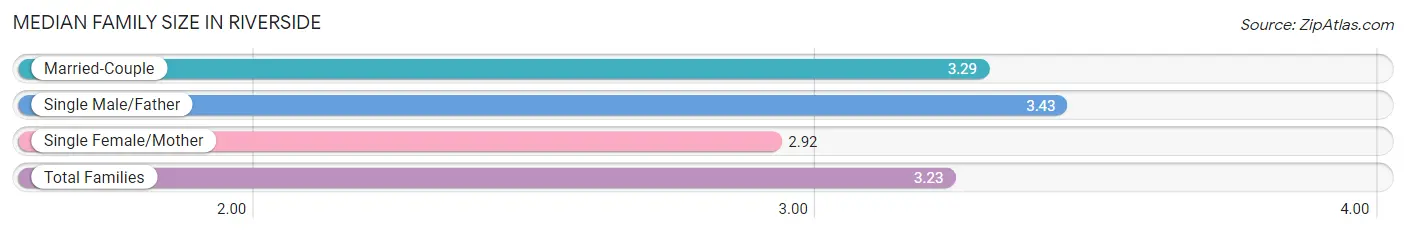
Median Family Size in Riverside
The median family size in Riverside is 3.23 persons per family, with single male/father families (75 | 2.9%) accounting for the largest median family size of 3.43 persons per family. On the other hand, single female/mother families (488 | 18.9%) represent the smallest median family size with 2.92 persons per family.
| Family Type | # Families | Family Size |
| Married-Couple | 2,015 (78.2%) | 3.29 |
| Single Male/Father | 75 (2.9%) | 3.43 |
| Single Female/Mother | 488 (18.9%) | 2.92 |
| Total Families | 2,578 (100.0%) | 3.23 |
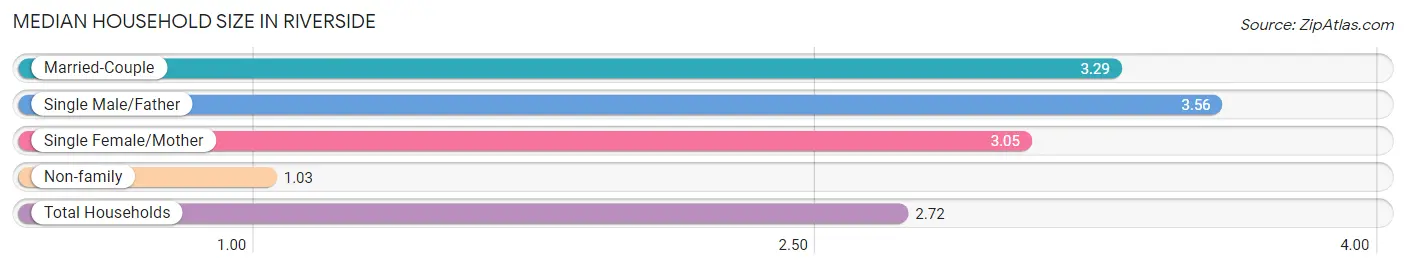
Median Household Size in Riverside
The median household size in Riverside is 2.72 persons per household, with single male/father households (75 | 2.2%) accounting for the largest median household size of 3.56 persons per household. non-family households (808 | 23.9%) represent the smallest median household size with 1.03 persons per household.
| Household Type | # Households | Household Size |
| Married-Couple | 2,015 (59.5%) | 3.29 |
| Single Male/Father | 75 (2.2%) | 3.56 |
| Single Female/Mother | 488 (14.4%) | 3.05 |
| Non-family | 808 (23.9%) | 1.03 |
| Total Households | 3,386 (100.0%) | 2.72 |
Household Size by Marriage Status in Riverside
Out of a total of 3,386 households in Riverside, 2,578 (76.1%) are family households, while 808 (23.9%) are nonfamily households. The most numerous type of family households are 2-person households, comprising 1,051, and the most common type of nonfamily households are 1-person households, comprising 784.
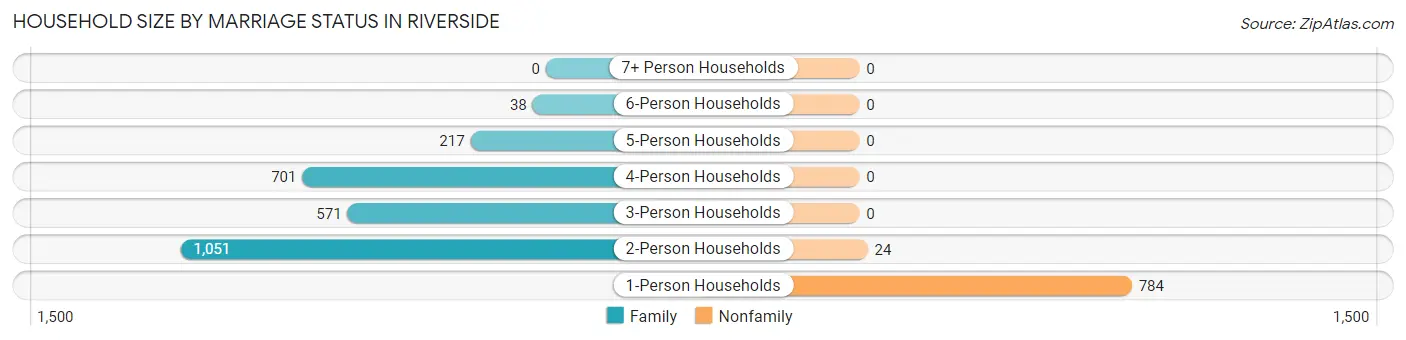
| Household Size | Family Households | Nonfamily Households |
| 1-Person Households | - | 784 (23.2%) |
| 2-Person Households | 1,051 (31.0%) | 24 (0.7%) |
| 3-Person Households | 571 (16.9%) | 0 (0.0%) |
| 4-Person Households | 701 (20.7%) | 0 (0.0%) |
| 5-Person Households | 217 (6.4%) | 0 (0.0%) |
| 6-Person Households | 38 (1.1%) | 0 (0.0%) |
| 7+ Person Households | 0 (0.0%) | 0 (0.0%) |
| Total | 2,578 (76.1%) | 808 (23.9%) |
Female Fertility in Riverside
Fertility by Age in Riverside
Average fertility rate in Riverside is 38.0 births per 1,000 women. Women in the age bracket of 20 to 34 years have the highest fertility rate with 66.0 births per 1,000 women. Women in the age bracket of 35 to 50 years acount for 65.6% of all women with births.
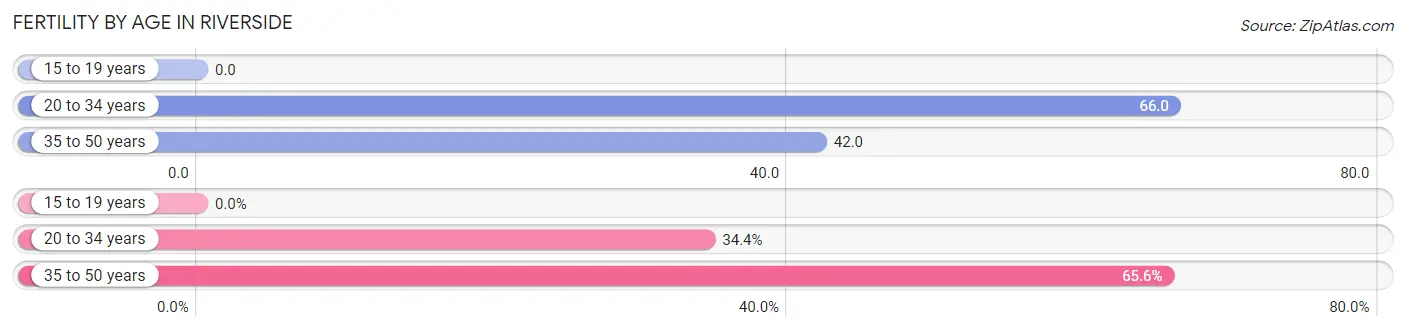
| Age Bracket | Women with Births | Births / 1,000 Women |
| 15 to 19 years | 0 (0.0%) | 0.0 |
| 20 to 34 years | 21 (34.4%) | 66.0 |
| 35 to 50 years | 40 (65.6%) | 42.0 |
| Total | 61 (100.0%) | 38.0 |
Fertility by Age by Marriage Status in Riverside
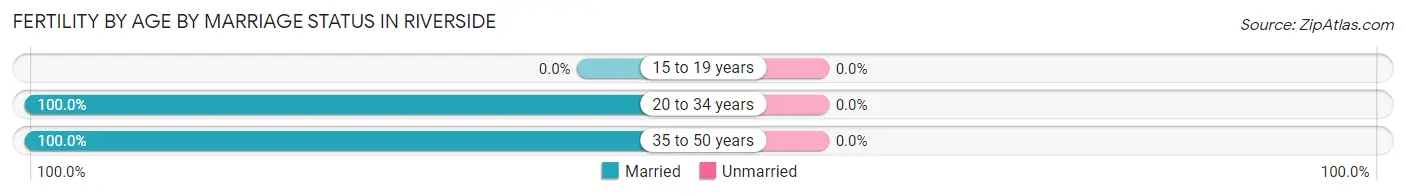
| Age Bracket | Married | Unmarried |
| 15 to 19 years | 0 (0.0%) | 0 (0.0%) |
| 20 to 34 years | 21 (100.0%) | 0 (0.0%) |
| 35 to 50 years | 40 (100.0%) | 0 (0.0%) |
| Total | 61 (100.0%) | 0 (0.0%) |
Fertility by Education in Riverside
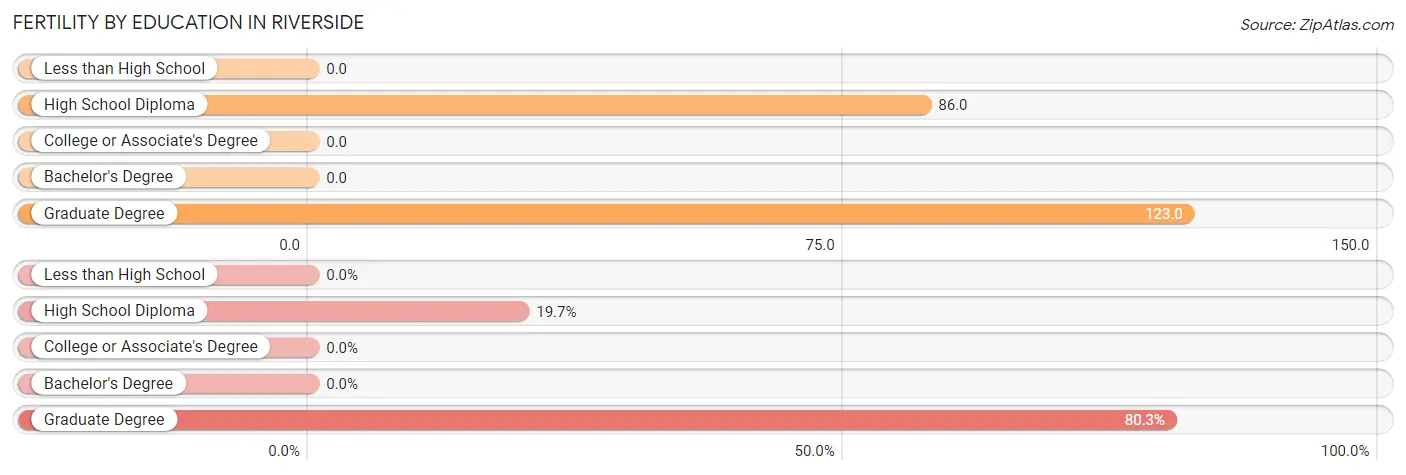
| Educational Attainment | Women with Births | Births / 1,000 Women |
| Less than High School | 0 (0.0%) | 0.0 |
| High School Diploma | 12 (19.7%) | 86.0 |
| College or Associate's Degree | 0 (0.0%) | 0.0 |
| Bachelor's Degree | 0 (0.0%) | 0.0 |
| Graduate Degree | 49 (80.3%) | 123.0 |
| Total | 61 (100.0%) | 38.0 |
Fertility by Education by Marriage Status in Riverside
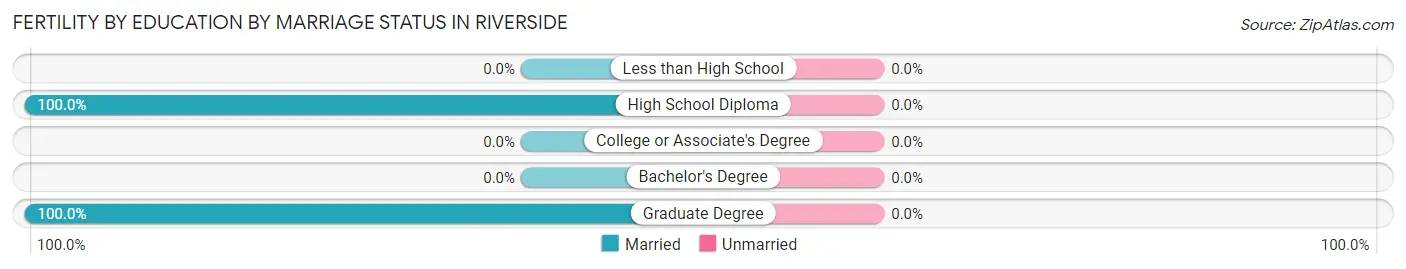
| Educational Attainment | Married | Unmarried |
| Less than High School | 0 (0.0%) | 0 (0.0%) |
| High School Diploma | 12 (100.0%) | 0 (0.0%) |
| College or Associate's Degree | 0 (0.0%) | 0 (0.0%) |
| Bachelor's Degree | 0 (0.0%) | 0 (0.0%) |
| Graduate Degree | 49 (100.0%) | 0 (0.0%) |
| Total | 61 (100.0%) | 0 (0.0%) |
Employment Characteristics in Riverside
Employment by Class of Employer in Riverside
Among the 4,468 employed individuals in Riverside, private company employees (3,017 | 67.5%), local government employees (422 | 9.4%), and not-for-profit organizations (389 | 8.7%) make up the most common classes of employment.
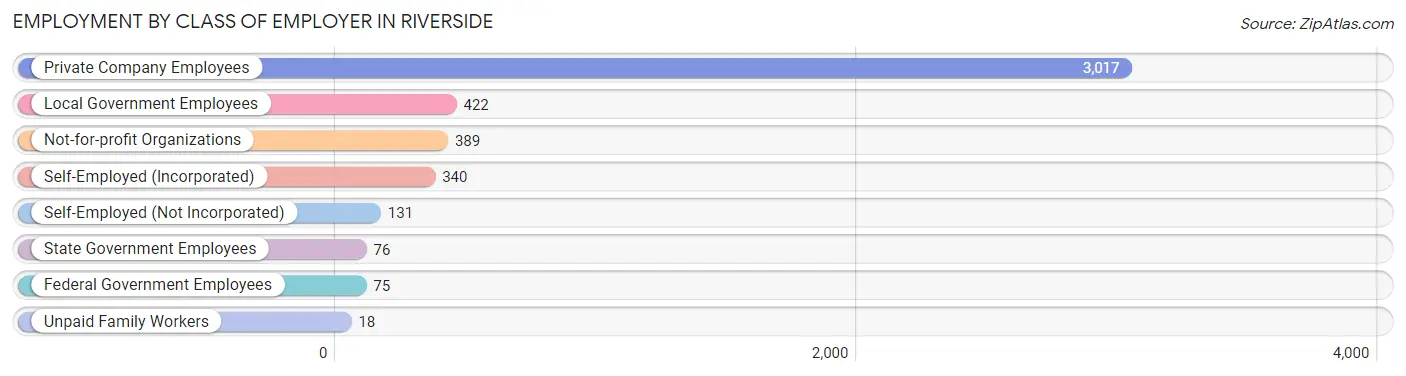
| Employer Class | # Employees | % Employees |
| Private Company Employees | 3,017 | 67.5% |
| Self-Employed (Incorporated) | 340 | 7.6% |
| Self-Employed (Not Incorporated) | 131 | 2.9% |
| Not-for-profit Organizations | 389 | 8.7% |
| Local Government Employees | 422 | 9.4% |
| State Government Employees | 76 | 1.7% |
| Federal Government Employees | 75 | 1.7% |
| Unpaid Family Workers | 18 | 0.4% |
| Total | 4,468 | 100.0% |
Employment Status by Age in Riverside
According to the labor force statistics for Riverside, out of the total population over 16 years of age (7,106), 65.4% or 4,647 individuals are in the labor force, with 3.1% or 144 of them unemployed. The age group with the highest labor force participation rate is 35 to 44 years, with 94.7% or 1,233 individuals in the labor force. Within the labor force, the 16 to 19 years age range has the highest percentage of unemployed individuals, with 16.6% or 39 of them being unemployed.
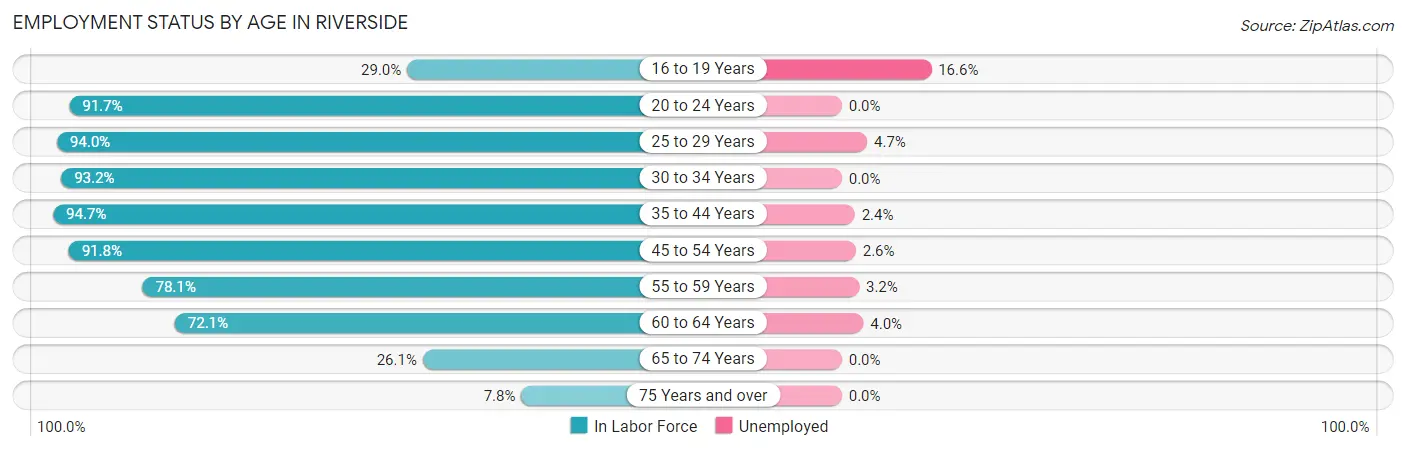
| Age Bracket | In Labor Force | Unemployed |
| 16 to 19 Years | 235 (29.0%) | 39 (16.6%) |
| 20 to 24 Years | 189 (91.7%) | 0 (0.0%) |
| 25 to 29 Years | 234 (94.0%) | 11 (4.7%) |
| 30 to 34 Years | 329 (93.2%) | 0 (0.0%) |
| 35 to 44 Years | 1,233 (94.7%) | 30 (2.4%) |
| 45 to 54 Years | 1,086 (91.8%) | 28 (2.6%) |
| 55 to 59 Years | 528 (78.1%) | 17 (3.2%) |
| 60 to 64 Years | 470 (72.1%) | 19 (4.0%) |
| 65 to 74 Years | 303 (26.1%) | 0 (0.0%) |
| 75 Years and over | 40 (7.8%) | 0 (0.0%) |
| Total | 4,647 (65.4%) | 144 (3.1%) |
Employment Status by Educational Attainment in Riverside
According to labor force statistics for Riverside, 87.9% of individuals (3,881) out of the total population between 25 and 64 years of age (4,415) are in the labor force, with 2.7% or 105 of them being unemployed. The group with the highest labor force participation rate are those with the educational attainment of bachelor's degree or higher, with 90.6% or 2,745 individuals in the labor force. Within the labor force, individuals with less than high school education have the highest percentage of unemployment, with 11.1% or 5 of them being unemployed.
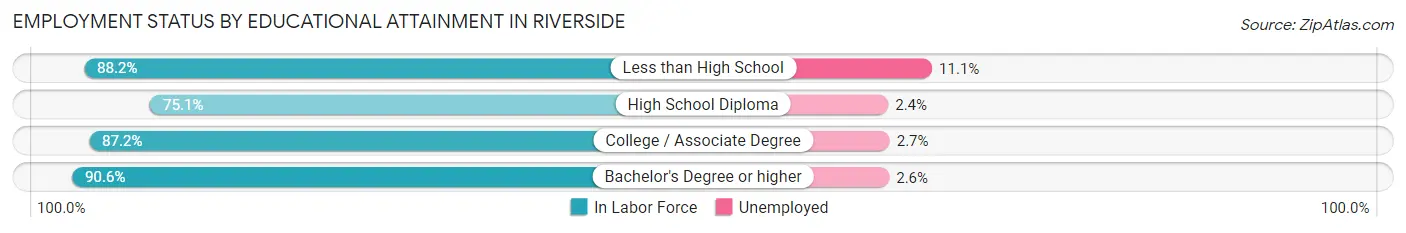
| Educational Attainment | In Labor Force | Unemployed |
| Less than High School | 45 (88.2%) | 6 (11.1%) |
| High School Diploma | 458 (75.1%) | 15 (2.4%) |
| College / Associate Degree | 631 (87.2%) | 20 (2.7%) |
| Bachelor's Degree or higher | 2,745 (90.6%) | 79 (2.6%) |
| Total | 3,881 (87.9%) | 119 (2.7%) |
Employment Occupations by Sex in Riverside
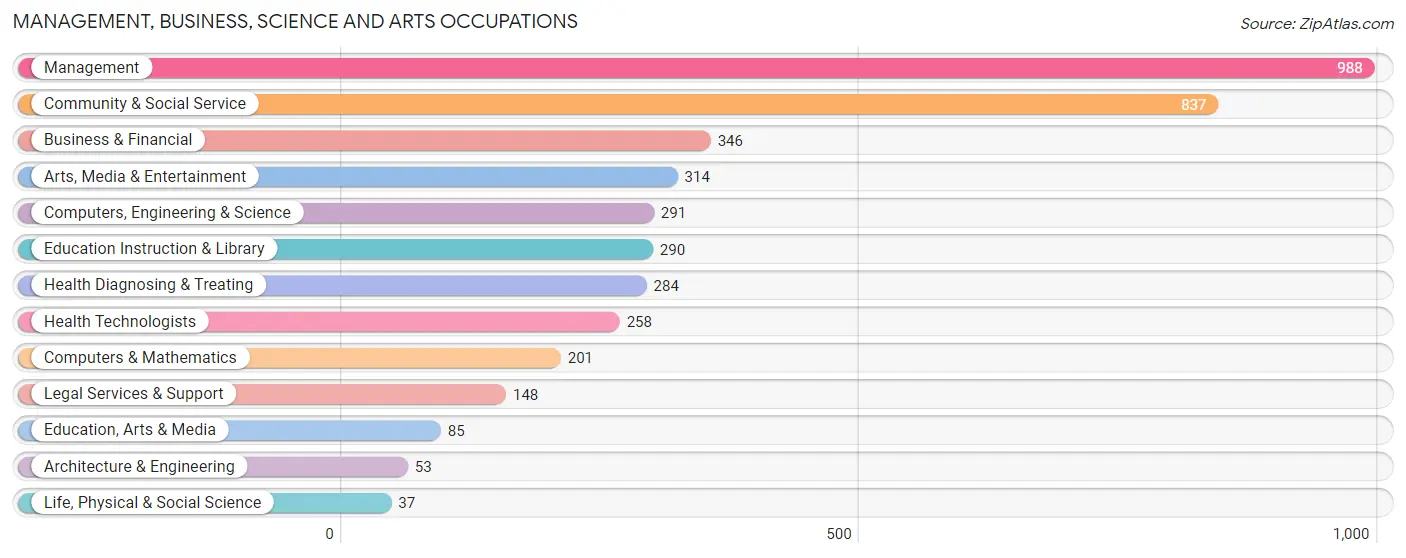
Management, Business, Science and Arts Occupations
The most common Management, Business, Science and Arts occupations in Riverside are Management (988 | 21.9%), Community & Social Service (837 | 18.6%), Business & Financial (346 | 7.7%), Arts, Media & Entertainment (314 | 7.0%), and Computers, Engineering & Science (291 | 6.5%).
Management, Business, Science and Arts Occupations by Sex
Within the Management, Business, Science and Arts occupations in Riverside, the most male-oriented occupations are Architecture & Engineering (100.0%), Life, Physical & Social Science (86.5%), and Computers, Engineering & Science (78.3%), while the most female-oriented occupations are Education, Arts & Media (84.7%), Arts, Media & Entertainment (76.4%), and Community & Social Service (74.4%).
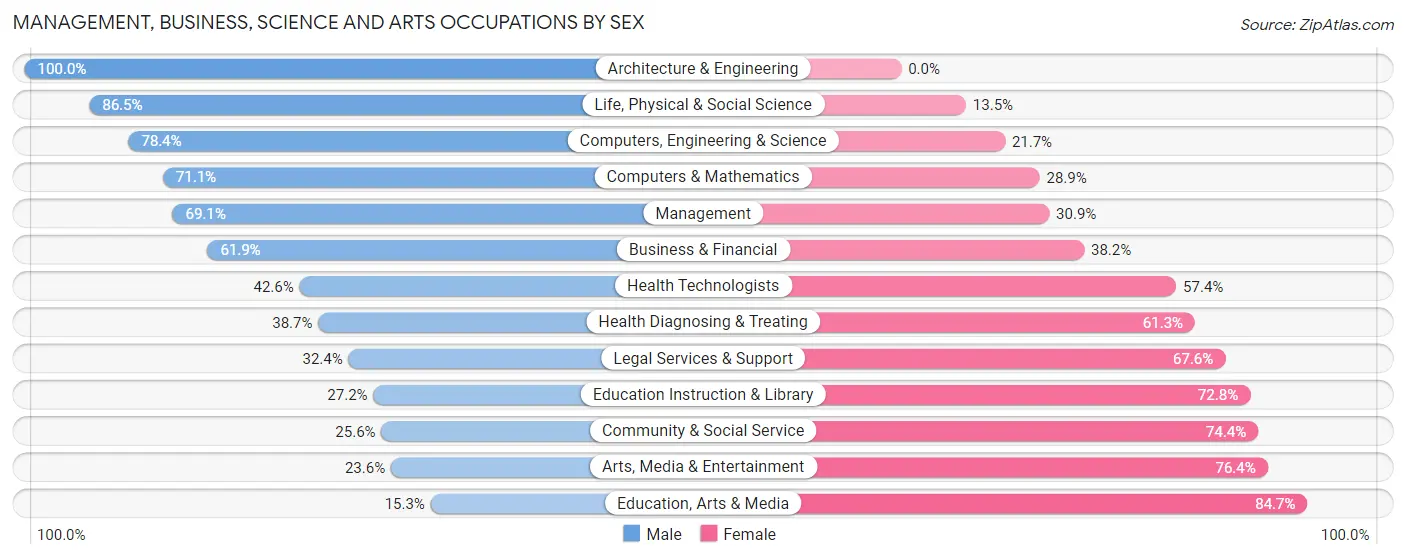
| Occupation | Male | Female |
| Management | 683 (69.1%) | 305 (30.9%) |
| Business & Financial | 214 (61.9%) | 132 (38.2%) |
| Computers, Engineering & Science | 228 (78.3%) | 63 (21.6%) |
| Computers & Mathematics | 143 (71.1%) | 58 (28.9%) |
| Architecture & Engineering | 53 (100.0%) | 0 (0.0%) |
| Life, Physical & Social Science | 32 (86.5%) | 5 (13.5%) |
| Community & Social Service | 214 (25.6%) | 623 (74.4%) |
| Education, Arts & Media | 13 (15.3%) | 72 (84.7%) |
| Legal Services & Support | 48 (32.4%) | 100 (67.6%) |
| Education Instruction & Library | 79 (27.2%) | 211 (72.8%) |
| Arts, Media & Entertainment | 74 (23.6%) | 240 (76.4%) |
| Health Diagnosing & Treating | 110 (38.7%) | 174 (61.3%) |
| Health Technologists | 110 (42.6%) | 148 (57.4%) |
| Total (Category) | 1,449 (52.8%) | 1,297 (47.2%) |
| Total (Overall) | 2,333 (51.8%) | 2,171 (48.2%) |
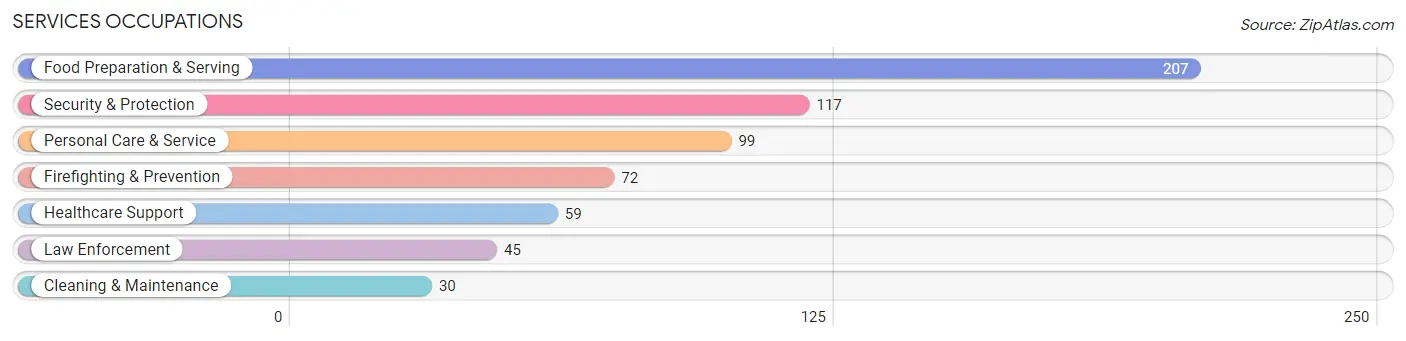
Services Occupations
The most common Services occupations in Riverside are Food Preparation & Serving (207 | 4.6%), Security & Protection (117 | 2.6%), Personal Care & Service (99 | 2.2%), Firefighting & Prevention (72 | 1.6%), and Healthcare Support (59 | 1.3%).
Services Occupations by Sex
Within the Services occupations in Riverside, the most male-oriented occupations are Healthcare Support (100.0%), Law Enforcement (100.0%), and Cleaning & Maintenance (100.0%), while the most female-oriented occupations are Personal Care & Service (100.0%), Firefighting & Prevention (80.6%), and Security & Protection (49.6%).
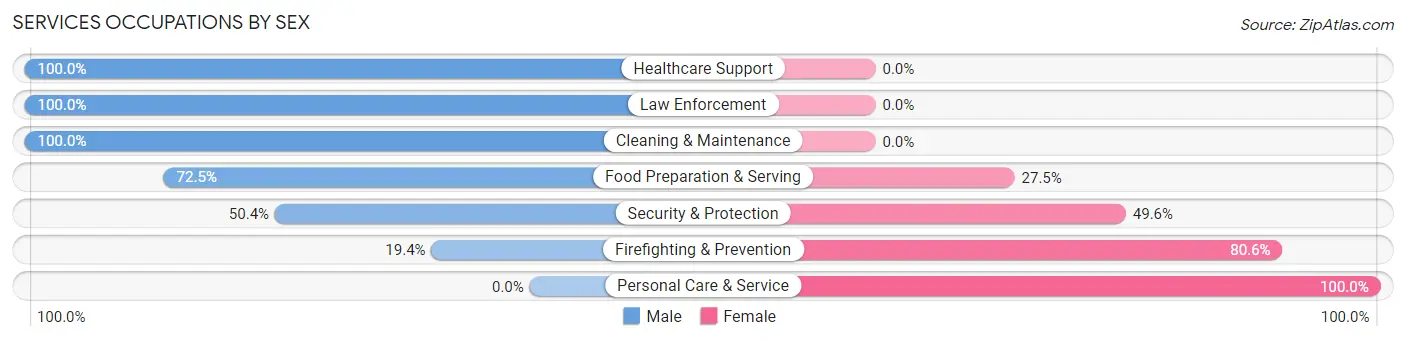
| Occupation | Male | Female |
| Healthcare Support | 59 (100.0%) | 0 (0.0%) |
| Security & Protection | 59 (50.4%) | 58 (49.6%) |
| Firefighting & Prevention | 14 (19.4%) | 58 (80.6%) |
| Law Enforcement | 45 (100.0%) | 0 (0.0%) |
| Food Preparation & Serving | 150 (72.5%) | 57 (27.5%) |
| Cleaning & Maintenance | 30 (100.0%) | 0 (0.0%) |
| Personal Care & Service | 0 (0.0%) | 99 (100.0%) |
| Total (Category) | 298 (58.2%) | 214 (41.8%) |
| Total (Overall) | 2,333 (51.8%) | 2,171 (48.2%) |
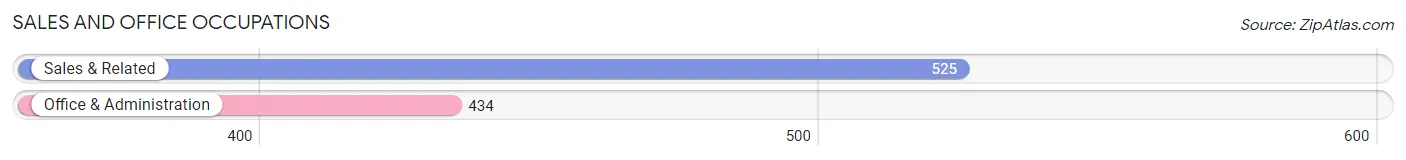
Sales and Office Occupations
The most common Sales and Office occupations in Riverside are Sales & Related (525 | 11.7%), and Office & Administration (434 | 9.6%).
Sales and Office Occupations by Sex
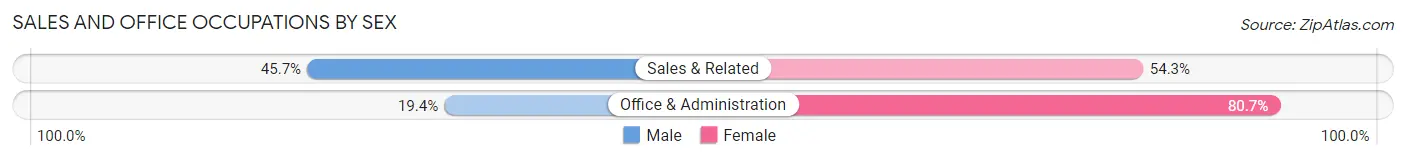
| Occupation | Male | Female |
| Sales & Related | 240 (45.7%) | 285 (54.3%) |
| Office & Administration | 84 (19.4%) | 350 (80.6%) |
| Total (Category) | 324 (33.8%) | 635 (66.2%) |
| Total (Overall) | 2,333 (51.8%) | 2,171 (48.2%) |
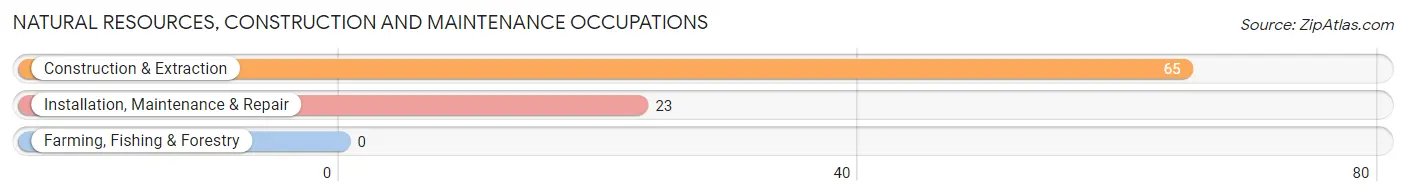
Natural Resources, Construction and Maintenance Occupations
The most common Natural Resources, Construction and Maintenance occupations in Riverside are Construction & Extraction (65 | 1.4%), and Installation, Maintenance & Repair (23 | 0.5%).
Natural Resources, Construction and Maintenance Occupations by Sex
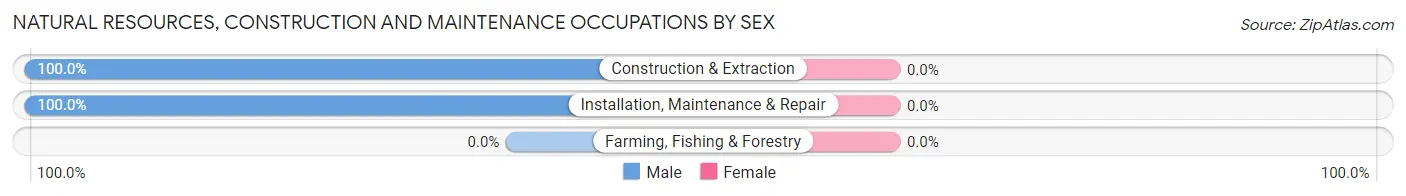
| Occupation | Male | Female |
| Farming, Fishing & Forestry | 0 (0.0%) | 0 (0.0%) |
| Construction & Extraction | 65 (100.0%) | 0 (0.0%) |
| Installation, Maintenance & Repair | 23 (100.0%) | 0 (0.0%) |
| Total (Category) | 88 (100.0%) | 0 (0.0%) |
| Total (Overall) | 2,333 (51.8%) | 2,171 (48.2%) |
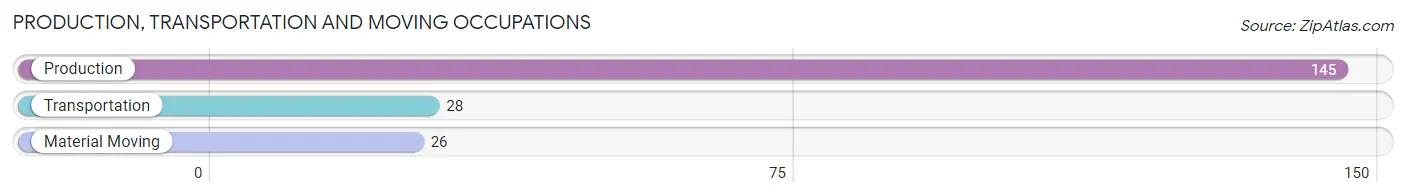
Production, Transportation and Moving Occupations
The most common Production, Transportation and Moving occupations in Riverside are Production (145 | 3.2%), Transportation (28 | 0.6%), and Material Moving (26 | 0.6%).
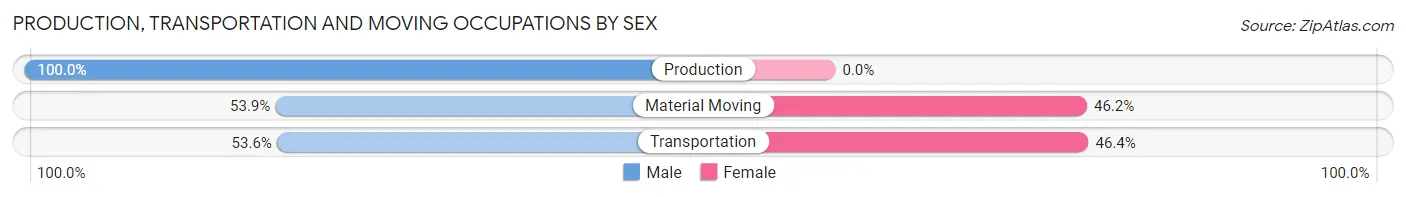
Production, Transportation and Moving Occupations by Sex
| Occupation | Male | Female |
| Production | 145 (100.0%) | 0 (0.0%) |
| Transportation | 15 (53.6%) | 13 (46.4%) |
| Material Moving | 14 (53.8%) | 12 (46.2%) |
| Total (Category) | 174 (87.4%) | 25 (12.6%) |
| Total (Overall) | 2,333 (51.8%) | 2,171 (48.2%) |
Employment Industries by Sex in Riverside
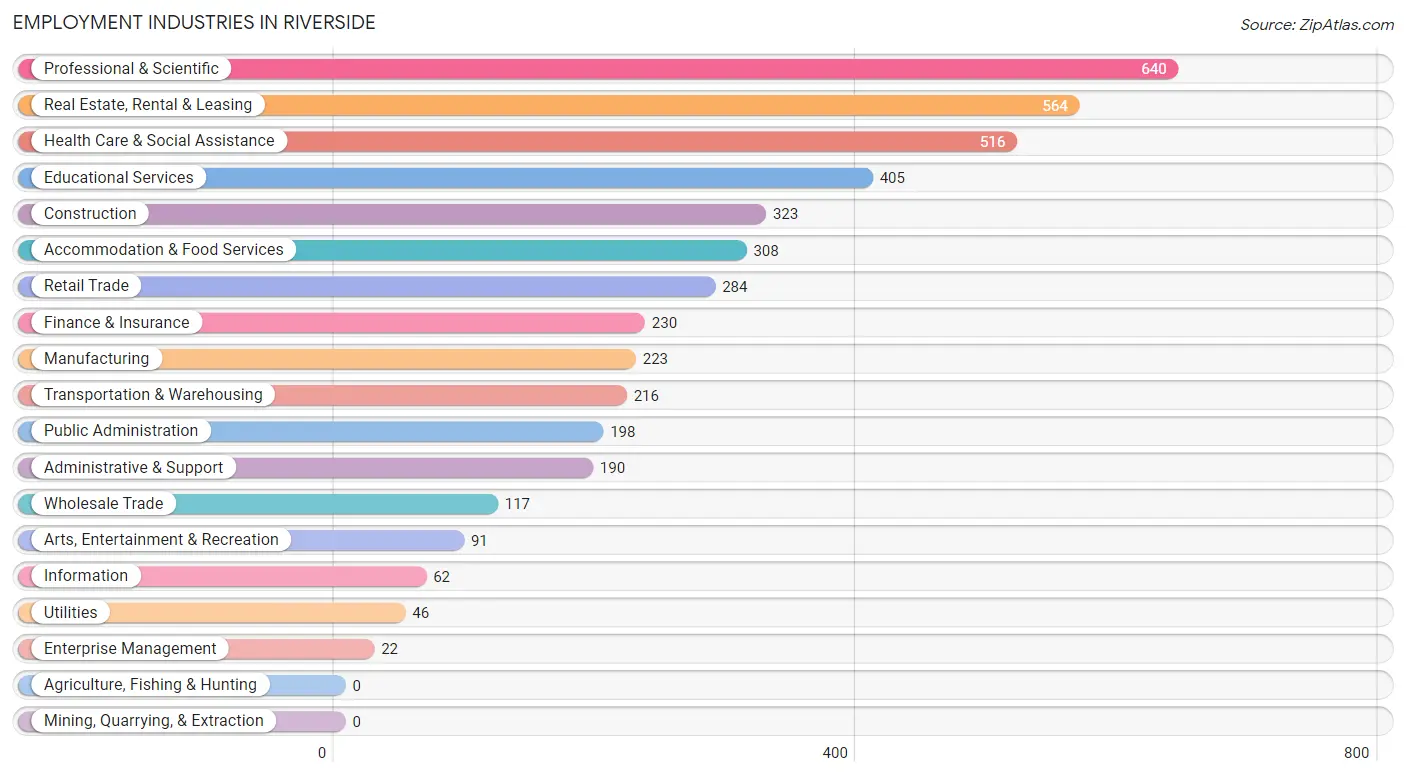
Employment Industries in Riverside
The major employment industries in Riverside include Professional & Scientific (640 | 14.2%), Real Estate, Rental & Leasing (564 | 12.5%), Health Care & Social Assistance (516 | 11.5%), Educational Services (405 | 9.0%), and Construction (323 | 7.2%).
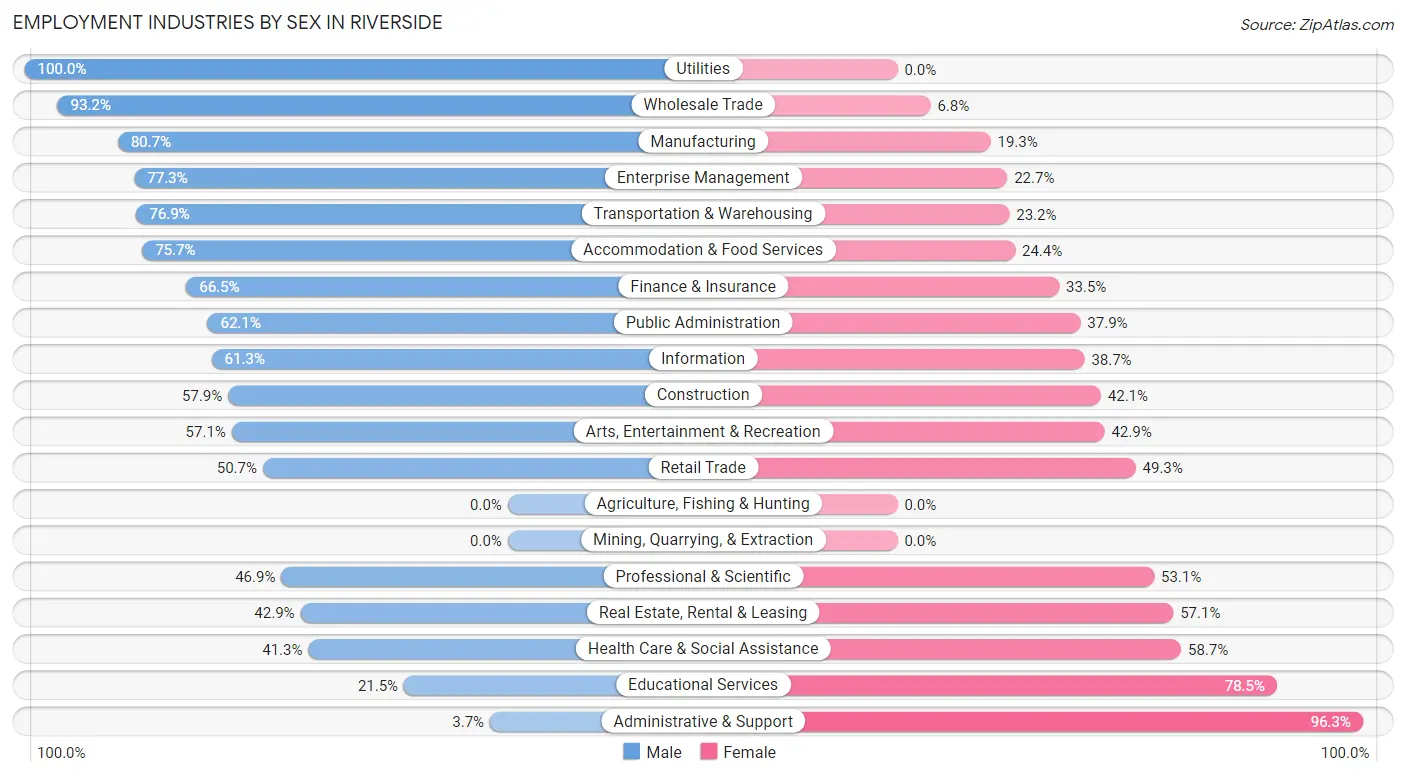
Employment Industries by Sex in Riverside
The Riverside industries that see more men than women are Utilities (100.0%), Wholesale Trade (93.2%), and Manufacturing (80.7%), whereas the industries that tend to have a higher number of women are Administrative & Support (96.3%), Educational Services (78.5%), and Health Care & Social Assistance (58.7%).
| Industry | Male | Female |
| Agriculture, Fishing & Hunting | 0 (0.0%) | 0 (0.0%) |
| Mining, Quarrying, & Extraction | 0 (0.0%) | 0 (0.0%) |
| Construction | 187 (57.9%) | 136 (42.1%) |
| Manufacturing | 180 (80.7%) | 43 (19.3%) |
| Wholesale Trade | 109 (93.2%) | 8 (6.8%) |
| Retail Trade | 144 (50.7%) | 140 (49.3%) |
| Transportation & Warehousing | 166 (76.8%) | 50 (23.2%) |
| Utilities | 46 (100.0%) | 0 (0.0%) |
| Information | 38 (61.3%) | 24 (38.7%) |
| Finance & Insurance | 153 (66.5%) | 77 (33.5%) |
| Real Estate, Rental & Leasing | 242 (42.9%) | 322 (57.1%) |
| Professional & Scientific | 300 (46.9%) | 340 (53.1%) |
| Enterprise Management | 17 (77.3%) | 5 (22.7%) |
| Administrative & Support | 7 (3.7%) | 183 (96.3%) |
| Educational Services | 87 (21.5%) | 318 (78.5%) |
| Health Care & Social Assistance | 213 (41.3%) | 303 (58.7%) |
| Arts, Entertainment & Recreation | 52 (57.1%) | 39 (42.9%) |
| Accommodation & Food Services | 233 (75.6%) | 75 (24.3%) |
| Public Administration | 123 (62.1%) | 75 (37.9%) |
| Total | 2,333 (51.8%) | 2,171 (48.2%) |
Education in Riverside
School Enrollment in Riverside
The most common levels of schooling among the 2,434 students in Riverside are high school (983 | 40.4%), elementary school (500 | 20.5%), and middle school (494 | 20.3%).
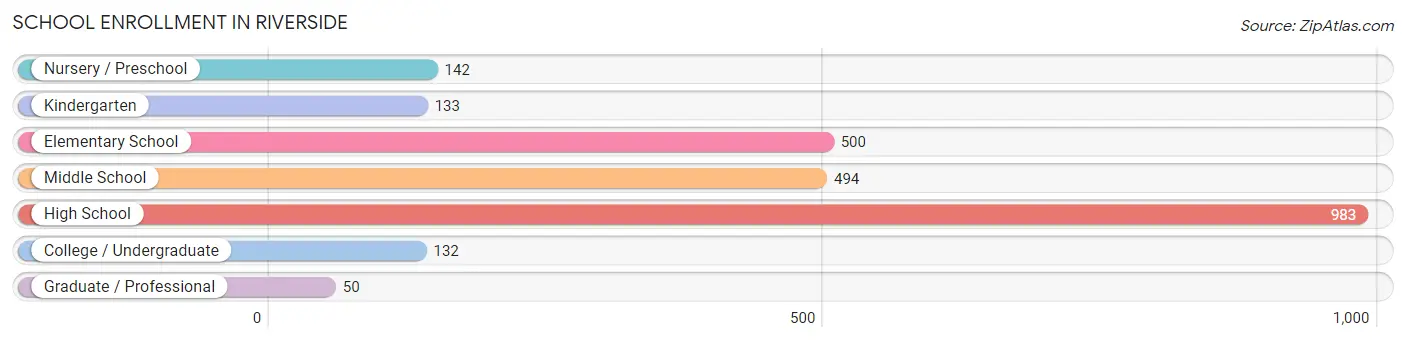
| School Level | # Students | % Students |
| Nursery / Preschool | 142 | 5.8% |
| Kindergarten | 133 | 5.5% |
| Elementary School | 500 | 20.5% |
| Middle School | 494 | 20.3% |
| High School | 983 | 40.4% |
| College / Undergraduate | 132 | 5.4% |
| Graduate / Professional | 50 | 2.1% |
| Total | 2,434 | 100.0% |
School Enrollment by Age by Funding Source in Riverside
Out of a total of 2,434 students who are enrolled in schools in Riverside, 392 (16.1%) attend a private institution, while the remaining 2,042 (83.9%) are enrolled in public schools. The age group of 25 to 34 year olds has the highest likelihood of being enrolled in private schools, with 23 (59.0% in the age bracket) enrolled. Conversely, the age group of 10 to 14 year olds has the lowest likelihood of being enrolled in a private school, with 812 (98.0% in the age bracket) attending a public institution.
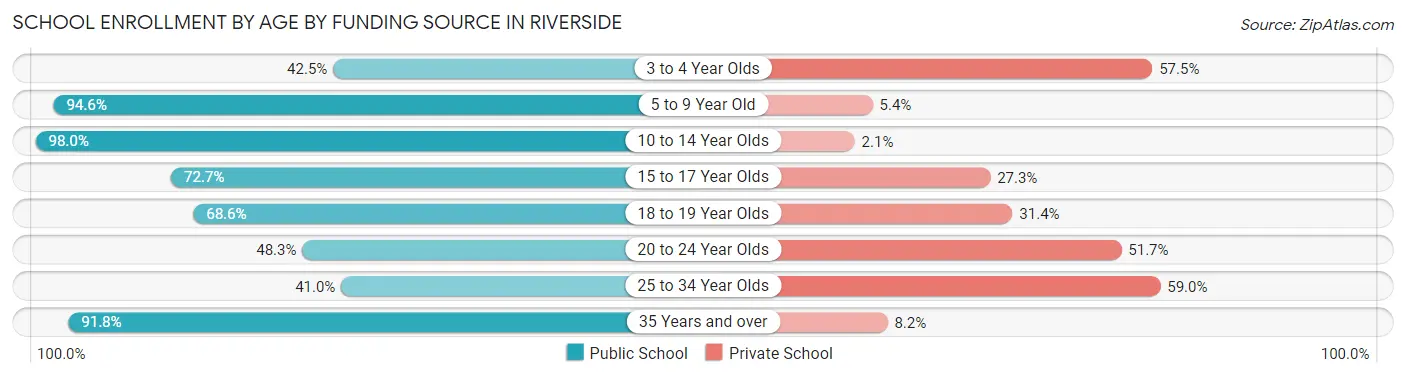
| Age Bracket | Public School | Private School |
| 3 to 4 Year Olds | 37 (42.5%) | 50 (57.5%) |
| 5 to 9 Year Old | 491 (94.6%) | 28 (5.4%) |
| 10 to 14 Year Olds | 812 (98.0%) | 17 (2.1%) |
| 15 to 17 Year Olds | 493 (72.7%) | 185 (27.3%) |
| 18 to 19 Year Olds | 120 (68.6%) | 55 (31.4%) |
| 20 to 24 Year Olds | 28 (48.3%) | 30 (51.7%) |
| 25 to 34 Year Olds | 16 (41.0%) | 23 (59.0%) |
| 35 Years and over | 45 (91.8%) | 4 (8.2%) |
| Total | 2,042 (83.9%) | 392 (16.1%) |
Educational Attainment by Field of Study in Riverside
Business (978 | 23.9%), education (458 | 11.2%), bio, nature & agricultural (419 | 10.2%), social sciences (382 | 9.3%), and visual & performing arts (309 | 7.5%) are the most common fields of study among 4,098 individuals in Riverside who have obtained a bachelor's degree or higher.
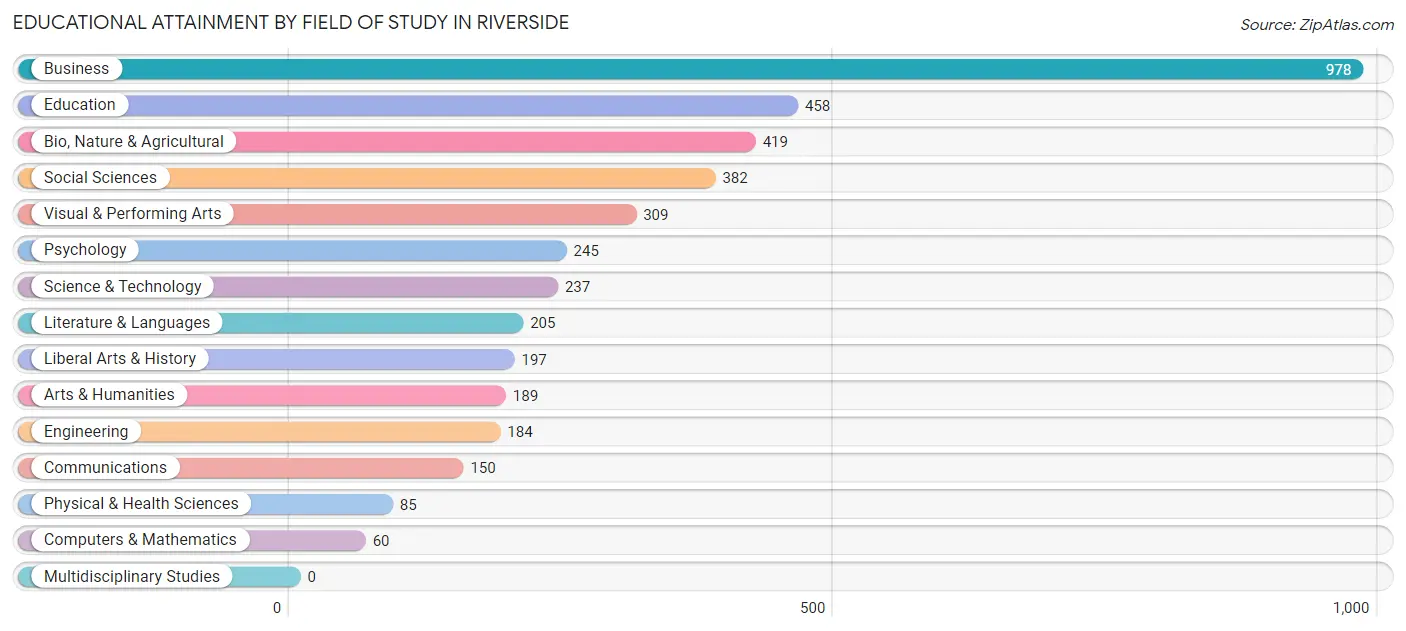
| Field of Study | # Graduates | % Graduates |
| Computers & Mathematics | 60 | 1.5% |
| Bio, Nature & Agricultural | 419 | 10.2% |
| Physical & Health Sciences | 85 | 2.1% |
| Psychology | 245 | 6.0% |
| Social Sciences | 382 | 9.3% |
| Engineering | 184 | 4.5% |
| Multidisciplinary Studies | 0 | 0.0% |
| Science & Technology | 237 | 5.8% |
| Business | 978 | 23.9% |
| Education | 458 | 11.2% |
| Literature & Languages | 205 | 5.0% |
| Liberal Arts & History | 197 | 4.8% |
| Visual & Performing Arts | 309 | 7.5% |
| Communications | 150 | 3.7% |
| Arts & Humanities | 189 | 4.6% |
| Total | 4,098 | 100.0% |
Transportation & Commute in Riverside
Vehicle Availability by Sex in Riverside
The most prevalent vehicle ownership categories in Riverside are males with 2 vehicles (1,410, accounting for 60.9%) and females with 2 vehicles (1,257, making up 65.5%).
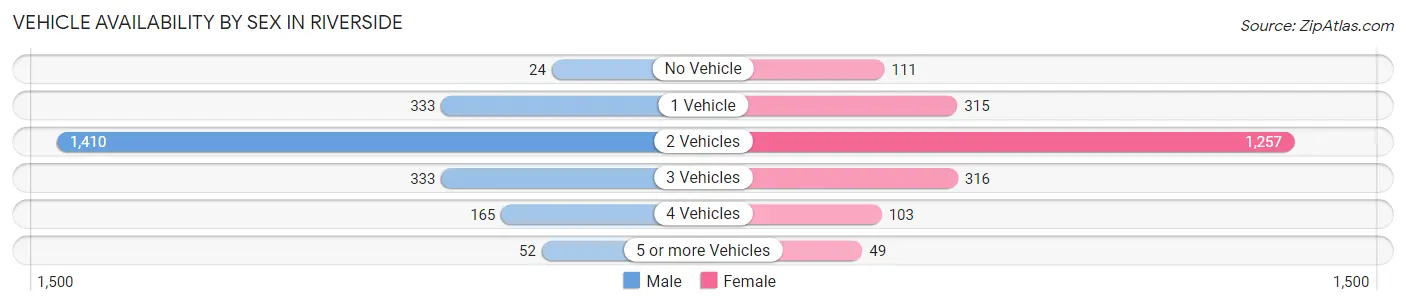
| Vehicles Available | Male | Female |
| No Vehicle | 24 (1.0%) | 111 (5.2%) |
| 1 Vehicle | 333 (14.4%) | 315 (14.6%) |
| 2 Vehicles | 1,410 (60.9%) | 1,257 (58.4%) |
| 3 Vehicles | 333 (14.4%) | 316 (14.7%) |
| 4 Vehicles | 165 (7.1%) | 103 (4.8%) |
| 5 or more Vehicles | 52 (2.2%) | 49 (2.3%) |
| Total | 2,317 (100.0%) | 2,151 (100.0%) |
Commute Time in Riverside
The most frequently occuring commute durations in Riverside are 45 to 59 minutes (861 commuters, 23.6%), 30 to 34 minutes (599 commuters, 16.4%), and 10 to 14 minutes (567 commuters, 15.5%).
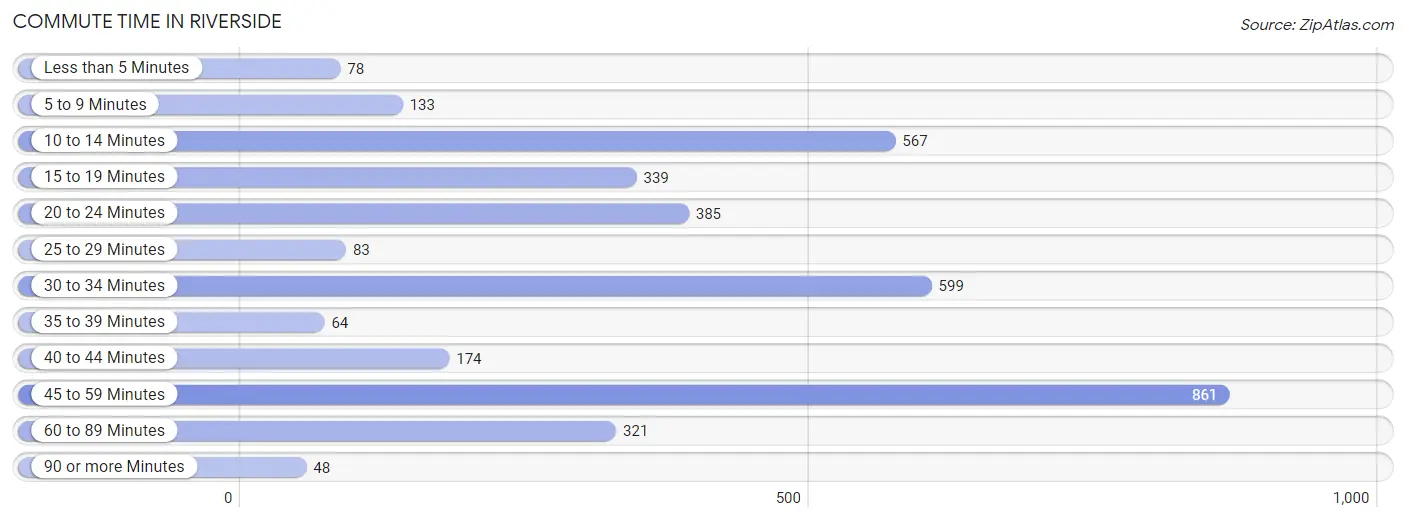
| Commute Time | # Commuters | % Commuters |
| Less than 5 Minutes | 78 | 2.1% |
| 5 to 9 Minutes | 133 | 3.6% |
| 10 to 14 Minutes | 567 | 15.5% |
| 15 to 19 Minutes | 339 | 9.3% |
| 20 to 24 Minutes | 385 | 10.5% |
| 25 to 29 Minutes | 83 | 2.3% |
| 30 to 34 Minutes | 599 | 16.4% |
| 35 to 39 Minutes | 64 | 1.8% |
| 40 to 44 Minutes | 174 | 4.8% |
| 45 to 59 Minutes | 861 | 23.6% |
| 60 to 89 Minutes | 321 | 8.8% |
| 90 or more Minutes | 48 | 1.3% |
Commute Time by Sex in Riverside
The most common commute times in Riverside are 45 to 59 minutes (474 commuters, 24.6%) for males and 45 to 59 minutes (387 commuters, 22.4%) for females.
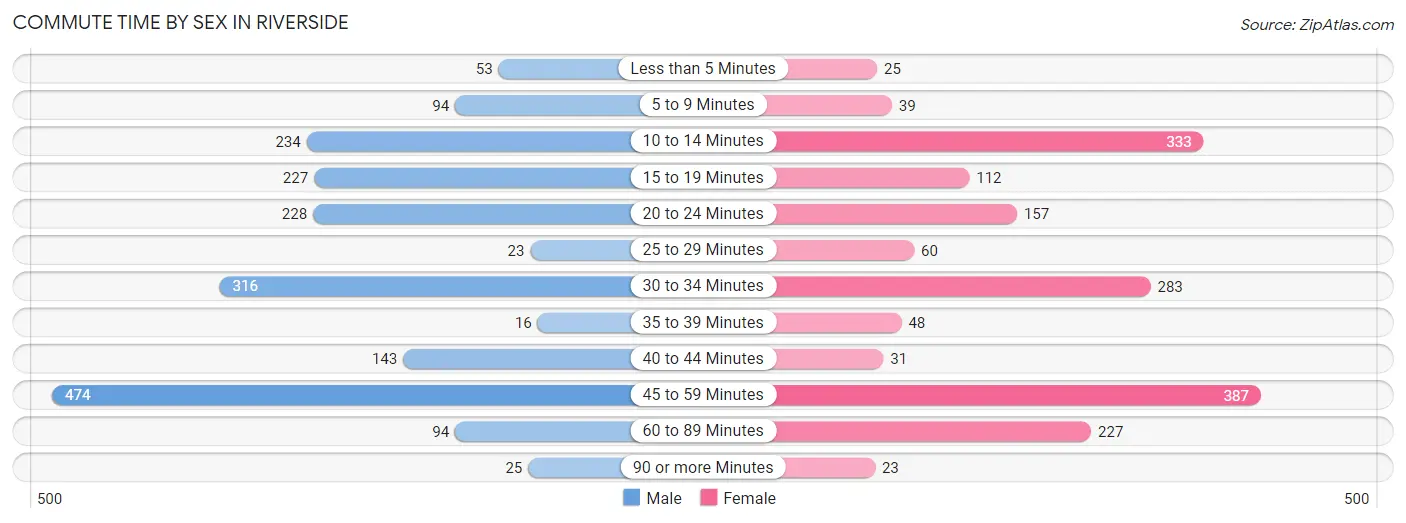
| Commute Time | Male | Female |
| Less than 5 Minutes | 53 (2.8%) | 25 (1.5%) |
| 5 to 9 Minutes | 94 (4.9%) | 39 (2.3%) |
| 10 to 14 Minutes | 234 (12.1%) | 333 (19.3%) |
| 15 to 19 Minutes | 227 (11.8%) | 112 (6.5%) |
| 20 to 24 Minutes | 228 (11.8%) | 157 (9.1%) |
| 25 to 29 Minutes | 23 (1.2%) | 60 (3.5%) |
| 30 to 34 Minutes | 316 (16.4%) | 283 (16.4%) |
| 35 to 39 Minutes | 16 (0.8%) | 48 (2.8%) |
| 40 to 44 Minutes | 143 (7.4%) | 31 (1.8%) |
| 45 to 59 Minutes | 474 (24.6%) | 387 (22.4%) |
| 60 to 89 Minutes | 94 (4.9%) | 227 (13.2%) |
| 90 or more Minutes | 25 (1.3%) | 23 (1.3%) |
Time of Departure to Work by Sex in Riverside
The most frequent times of departure to work in Riverside are 8:00 AM to 8:29 AM (587, 30.5%) for males and 7:30 AM to 7:59 AM (445, 25.8%) for females.
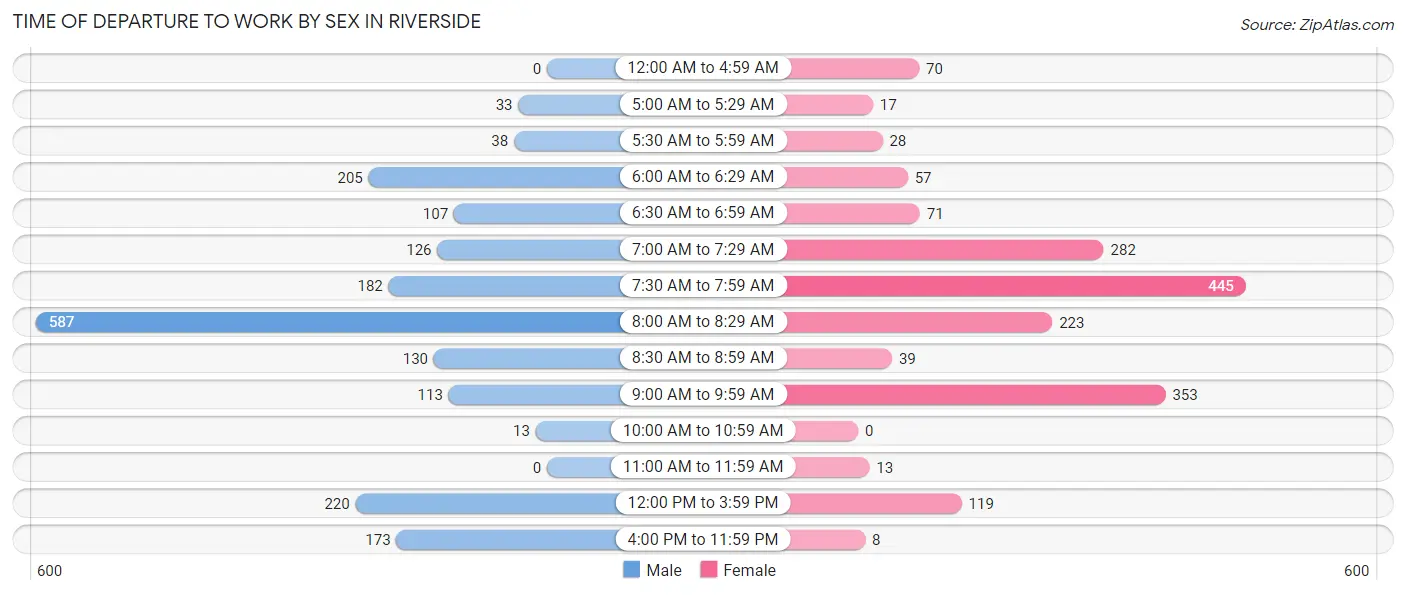
| Time of Departure | Male | Female |
| 12:00 AM to 4:59 AM | 0 (0.0%) | 70 (4.1%) |
| 5:00 AM to 5:29 AM | 33 (1.7%) | 17 (1.0%) |
| 5:30 AM to 5:59 AM | 38 (2.0%) | 28 (1.6%) |
| 6:00 AM to 6:29 AM | 205 (10.6%) | 57 (3.3%) |
| 6:30 AM to 6:59 AM | 107 (5.6%) | 71 (4.1%) |
| 7:00 AM to 7:29 AM | 126 (6.5%) | 282 (16.4%) |
| 7:30 AM to 7:59 AM | 182 (9.4%) | 445 (25.8%) |
| 8:00 AM to 8:29 AM | 587 (30.5%) | 223 (12.9%) |
| 8:30 AM to 8:59 AM | 130 (6.8%) | 39 (2.3%) |
| 9:00 AM to 9:59 AM | 113 (5.9%) | 353 (20.5%) |
| 10:00 AM to 10:59 AM | 13 (0.7%) | 0 (0.0%) |
| 11:00 AM to 11:59 AM | 0 (0.0%) | 13 (0.7%) |
| 12:00 PM to 3:59 PM | 220 (11.4%) | 119 (6.9%) |
| 4:00 PM to 11:59 PM | 173 (9.0%) | 8 (0.5%) |
| Total | 1,927 (100.0%) | 1,725 (100.0%) |
Housing Occupancy in Riverside
Occupancy by Ownership in Riverside
Of the total 3,386 dwellings in Riverside, owner-occupied units account for 2,869 (84.7%), while renter-occupied units make up 517 (15.3%).
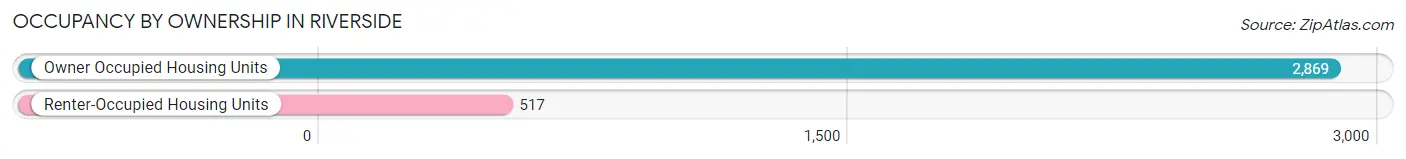
| Occupancy | # Housing Units | % Housing Units |
| Owner Occupied Housing Units | 2,869 | 84.7% |
| Renter-Occupied Housing Units | 517 | 15.3% |
| Total Occupied Housing Units | 3,386 | 100.0% |
Occupancy by Household Size in Riverside
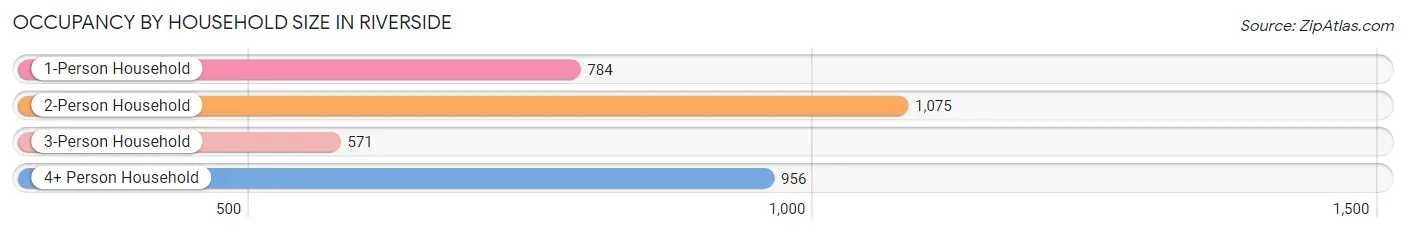
| Household Size | # Housing Units | % Housing Units |
| 1-Person Household | 784 | 23.2% |
| 2-Person Household | 1,075 | 31.8% |
| 3-Person Household | 571 | 16.9% |
| 4+ Person Household | 956 | 28.2% |
| Total Housing Units | 3,386 | 100.0% |
Occupancy by Ownership by Household Size in Riverside
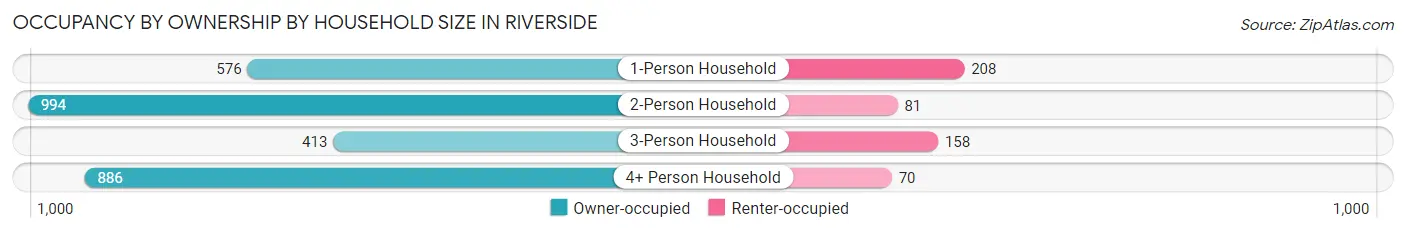
| Household Size | Owner-occupied | Renter-occupied |
| 1-Person Household | 576 (73.5%) | 208 (26.5%) |
| 2-Person Household | 994 (92.5%) | 81 (7.5%) |
| 3-Person Household | 413 (72.3%) | 158 (27.7%) |
| 4+ Person Household | 886 (92.7%) | 70 (7.3%) |
| Total Housing Units | 2,869 (84.7%) | 517 (15.3%) |
Occupancy by Educational Attainment in Riverside
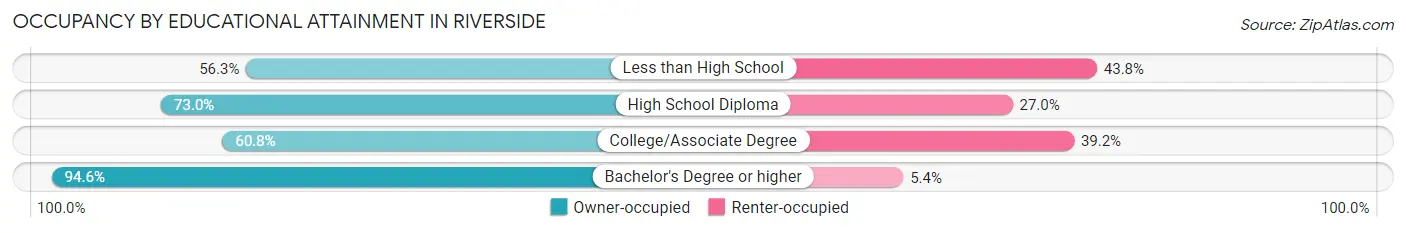
| Household Size | Owner-occupied | Renter-occupied |
| Less than High School | 18 (56.2%) | 14 (43.8%) |
| High School Diploma | 189 (73.0%) | 70 (27.0%) |
| College/Associate Degree | 479 (60.8%) | 309 (39.2%) |
| Bachelor's Degree or higher | 2,183 (94.6%) | 124 (5.4%) |
Occupancy by Age of Householder in Riverside
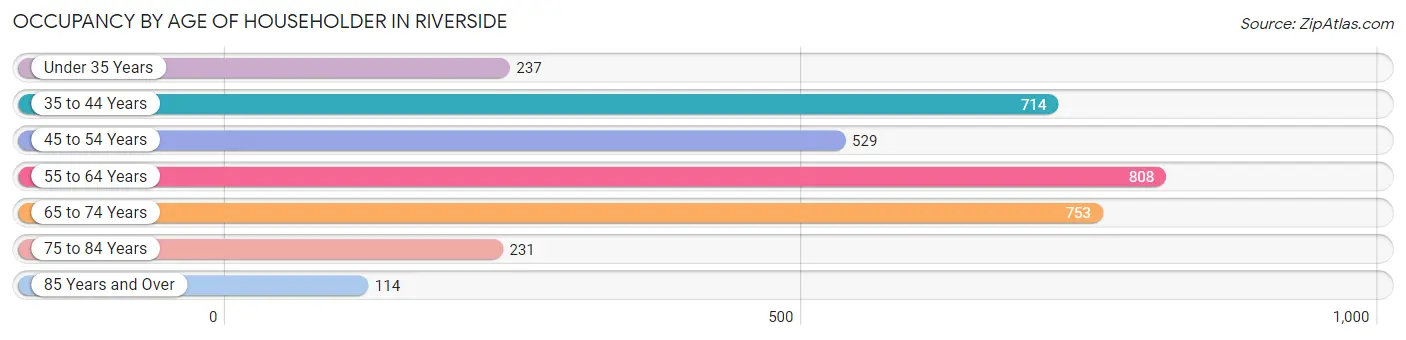
| Age Bracket | # Households | % Households |
| Under 35 Years | 237 | 7.0% |
| 35 to 44 Years | 714 | 21.1% |
| 45 to 54 Years | 529 | 15.6% |
| 55 to 64 Years | 808 | 23.9% |
| 65 to 74 Years | 753 | 22.2% |
| 75 to 84 Years | 231 | 6.8% |
| 85 Years and Over | 114 | 3.4% |
| Total | 3,386 | 100.0% |
Housing Finances in Riverside
Median Income by Occupancy in Riverside
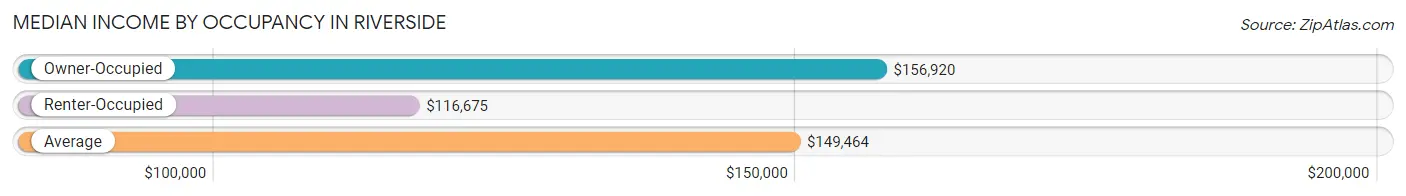
| Occupancy Type | # Households | Median Income |
| Owner-Occupied | 2,869 (84.7%) | $156,920 |
| Renter-Occupied | 517 (15.3%) | $116,675 |
| Average | 3,386 (100.0%) | $149,464 |
Occupancy by Householder Income Bracket in Riverside
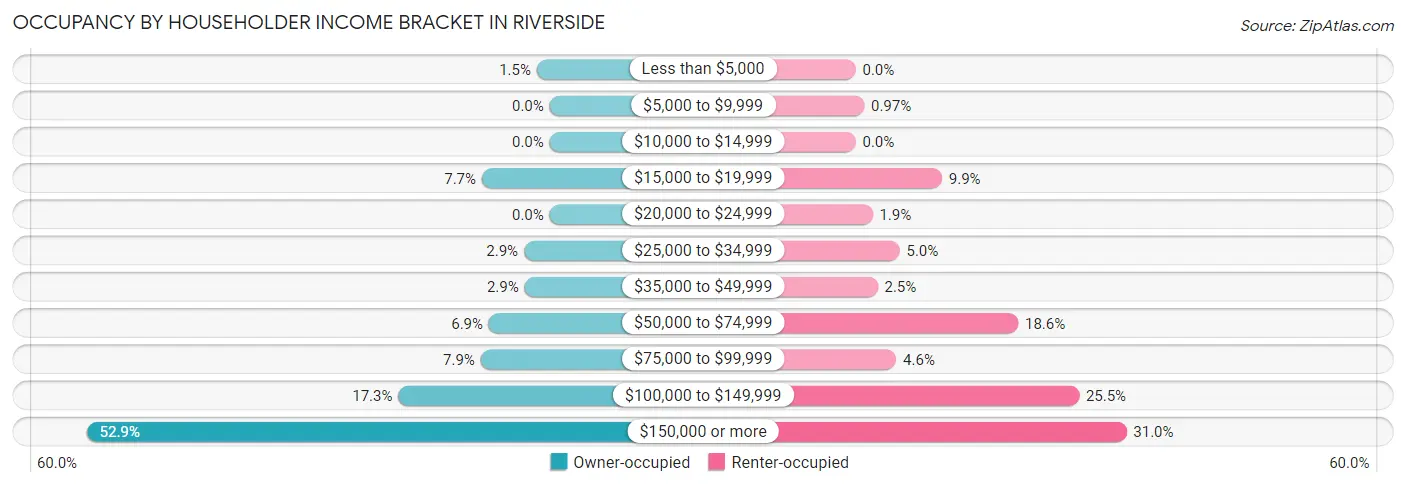
| Income Bracket | Owner-occupied | Renter-occupied |
| Less than $5,000 | 42 (1.5%) | 0 (0.0%) |
| $5,000 to $9,999 | 0 (0.0%) | 5 (1.0%) |
| $10,000 to $14,999 | 0 (0.0%) | 0 (0.0%) |
| $15,000 to $19,999 | 222 (7.7%) | 51 (9.9%) |
| $20,000 to $24,999 | 0 (0.0%) | 10 (1.9%) |
| $25,000 to $34,999 | 84 (2.9%) | 26 (5.0%) |
| $35,000 to $49,999 | 82 (2.9%) | 13 (2.5%) |
| $50,000 to $74,999 | 199 (6.9%) | 96 (18.6%) |
| $75,000 to $99,999 | 226 (7.9%) | 24 (4.6%) |
| $100,000 to $149,999 | 496 (17.3%) | 132 (25.5%) |
| $150,000 or more | 1,518 (52.9%) | 160 (30.9%) |
| Total | 2,869 (100.0%) | 517 (100.0%) |
Monthly Housing Cost Tiers in Riverside
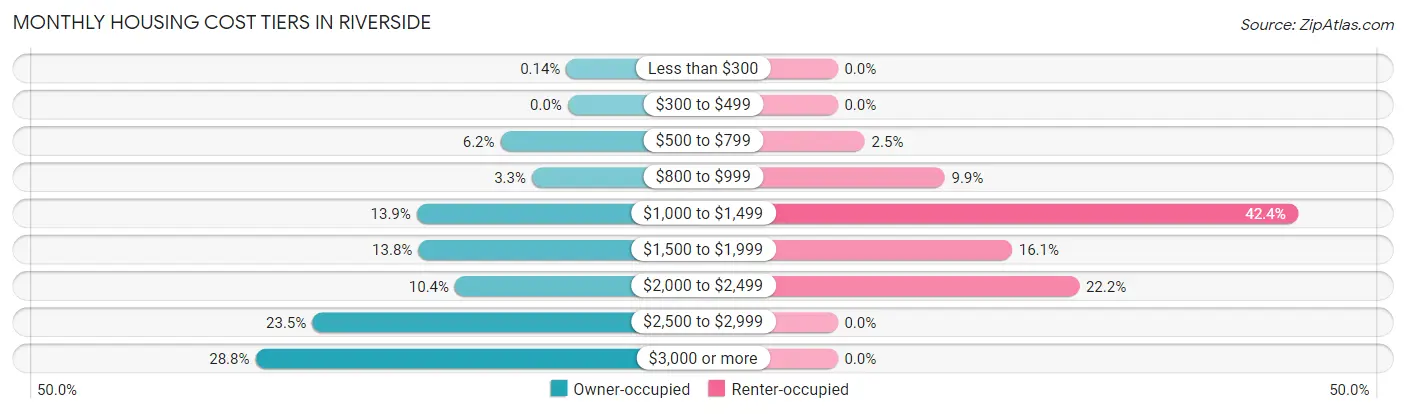
| Monthly Cost | Owner-occupied | Renter-occupied |
| Less than $300 | 4 (0.1%) | 0 (0.0%) |
| $300 to $499 | 0 (0.0%) | 0 (0.0%) |
| $500 to $799 | 178 (6.2%) | 13 (2.5%) |
| $800 to $999 | 95 (3.3%) | 51 (9.9%) |
| $1,000 to $1,499 | 399 (13.9%) | 219 (42.4%) |
| $1,500 to $1,999 | 395 (13.8%) | 83 (16.1%) |
| $2,000 to $2,499 | 298 (10.4%) | 115 (22.2%) |
| $2,500 to $2,999 | 675 (23.5%) | 0 (0.0%) |
| $3,000 or more | 825 (28.8%) | 0 (0.0%) |
| Total | 2,869 (100.0%) | 517 (100.0%) |
Physical Housing Characteristics in Riverside
Housing Structures in Riverside
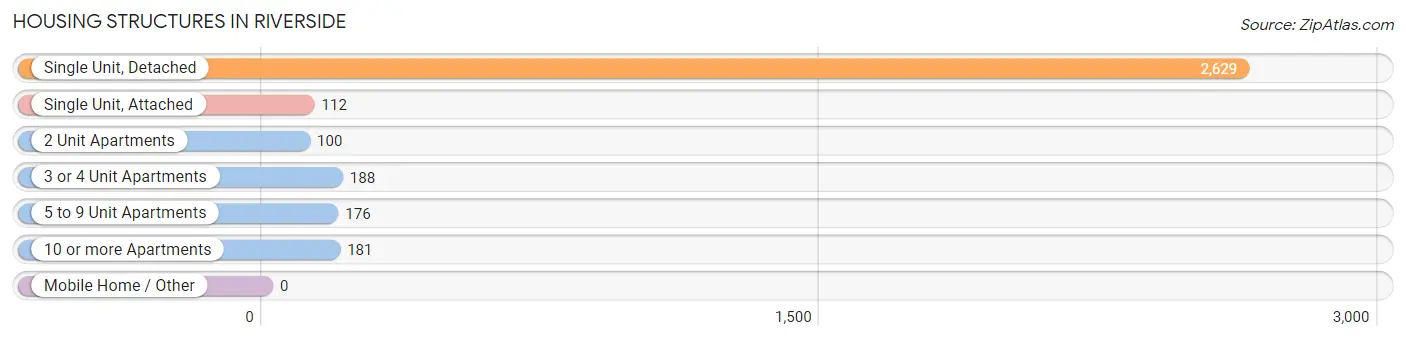
| Structure Type | # Housing Units | % Housing Units |
| Single Unit, Detached | 2,629 | 77.6% |
| Single Unit, Attached | 112 | 3.3% |
| 2 Unit Apartments | 100 | 2.9% |
| 3 or 4 Unit Apartments | 188 | 5.6% |
| 5 to 9 Unit Apartments | 176 | 5.2% |
| 10 or more Apartments | 181 | 5.3% |
| Mobile Home / Other | 0 | 0.0% |
| Total | 3,386 | 100.0% |
Housing Structures by Occupancy in Riverside
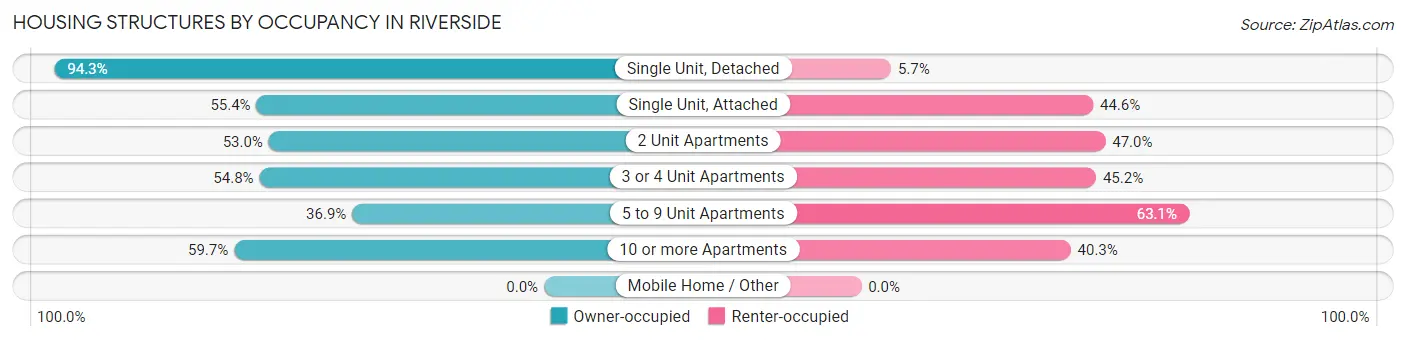
| Structure Type | Owner-occupied | Renter-occupied |
| Single Unit, Detached | 2,478 (94.3%) | 151 (5.7%) |
| Single Unit, Attached | 62 (55.4%) | 50 (44.6%) |
| 2 Unit Apartments | 53 (53.0%) | 47 (47.0%) |
| 3 or 4 Unit Apartments | 103 (54.8%) | 85 (45.2%) |
| 5 to 9 Unit Apartments | 65 (36.9%) | 111 (63.1%) |
| 10 or more Apartments | 108 (59.7%) | 73 (40.3%) |
| Mobile Home / Other | 0 (0.0%) | 0 (0.0%) |
| Total | 2,869 (84.7%) | 517 (15.3%) |
Housing Structures by Number of Rooms in Riverside
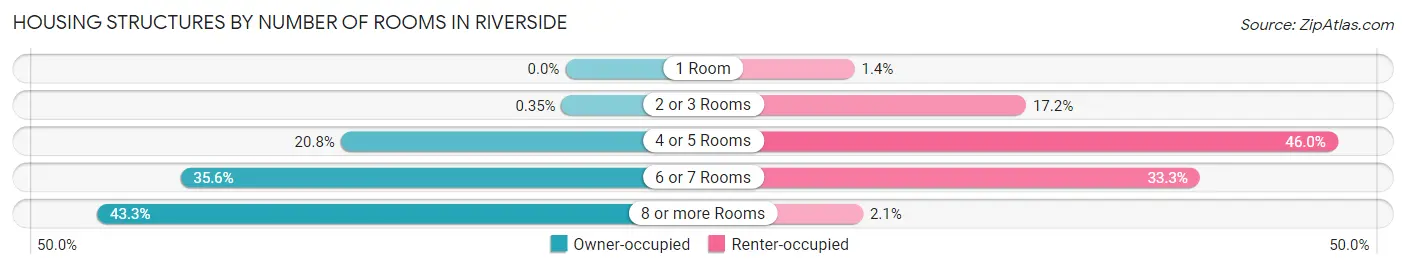
| Number of Rooms | Owner-occupied | Renter-occupied |
| 1 Room | 0 (0.0%) | 7 (1.3%) |
| 2 or 3 Rooms | 10 (0.4%) | 89 (17.2%) |
| 4 or 5 Rooms | 596 (20.8%) | 238 (46.0%) |
| 6 or 7 Rooms | 1,021 (35.6%) | 172 (33.3%) |
| 8 or more Rooms | 1,242 (43.3%) | 11 (2.1%) |
| Total | 2,869 (100.0%) | 517 (100.0%) |
Housing Structure by Heating Type in Riverside
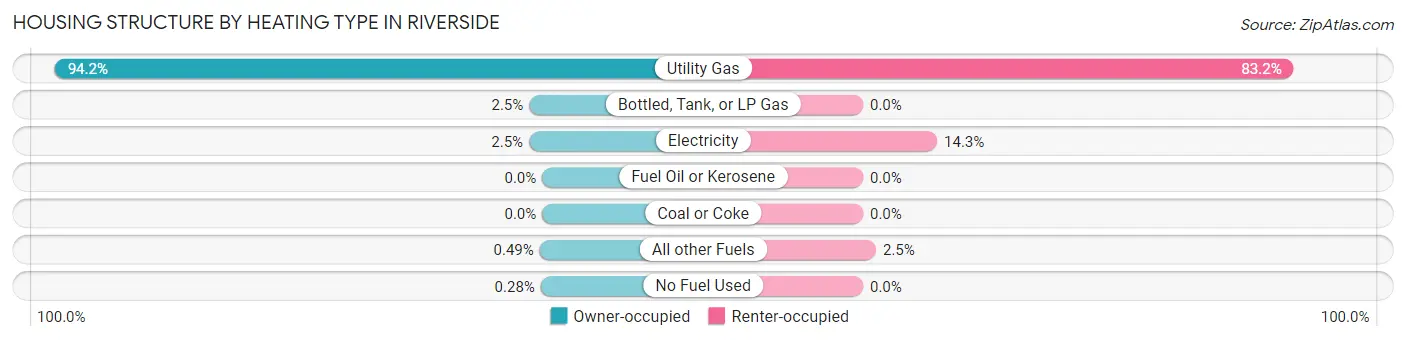
| Heating Type | Owner-occupied | Renter-occupied |
| Utility Gas | 2,702 (94.2%) | 430 (83.2%) |
| Bottled, Tank, or LP Gas | 72 (2.5%) | 0 (0.0%) |
| Electricity | 73 (2.5%) | 74 (14.3%) |
| Fuel Oil or Kerosene | 0 (0.0%) | 0 (0.0%) |
| Coal or Coke | 0 (0.0%) | 0 (0.0%) |
| All other Fuels | 14 (0.5%) | 13 (2.5%) |
| No Fuel Used | 8 (0.3%) | 0 (0.0%) |
| Total | 2,869 (100.0%) | 517 (100.0%) |
Household Vehicle Usage in Riverside
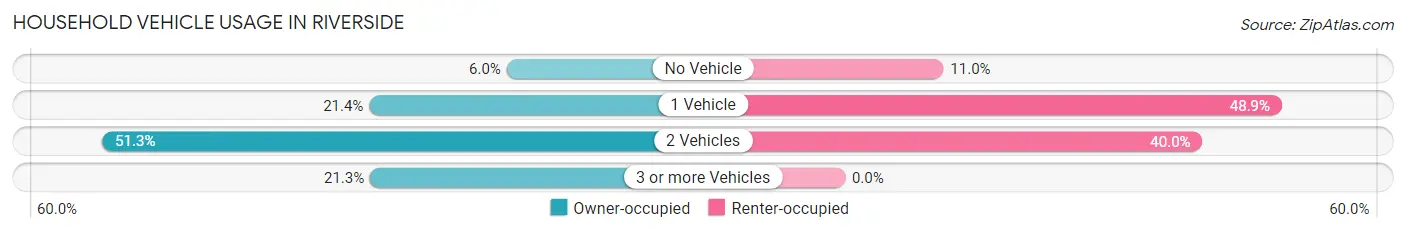
| Vehicles per Household | Owner-occupied | Renter-occupied |
| No Vehicle | 172 (6.0%) | 57 (11.0%) |
| 1 Vehicle | 614 (21.4%) | 253 (48.9%) |
| 2 Vehicles | 1,472 (51.3%) | 207 (40.0%) |
| 3 or more Vehicles | 611 (21.3%) | 0 (0.0%) |
| Total | 2,869 (100.0%) | 517 (100.0%) |
Real Estate & Mortgages in Riverside
Real Estate and Mortgage Overview in Riverside
| Characteristic | Without Mortgage | With Mortgage |
| Housing Units | 1,018 | 1,851 |
| Median Property Value | $406,400 | $501,300 |
| Median Household Income | $92,833 | $1,099 |
| Monthly Housing Costs | $1,396 | $800 |
| Real Estate Taxes | $9,089 | $0 |
Property Value by Mortgage Status in Riverside
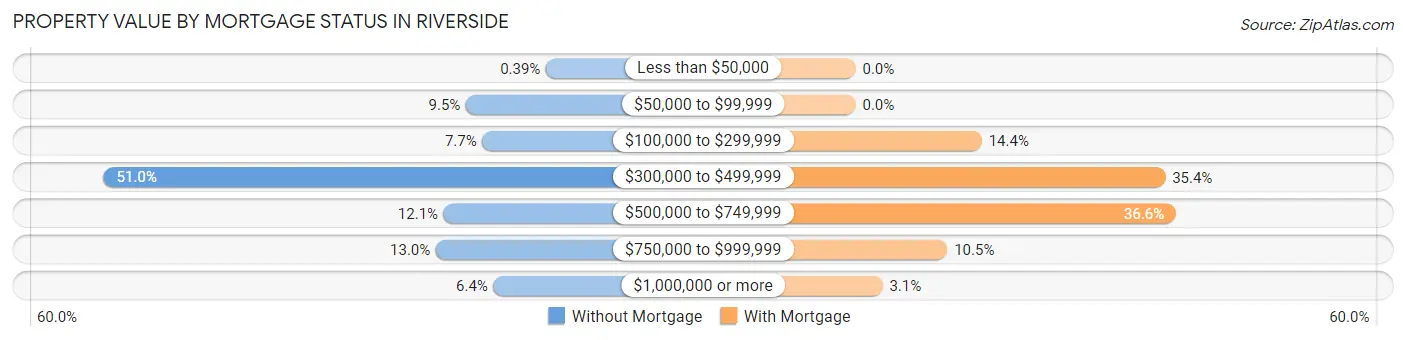
| Property Value | Without Mortgage | With Mortgage |
| Less than $50,000 | 4 (0.4%) | 0 (0.0%) |
| $50,000 to $99,999 | 97 (9.5%) | 0 (0.0%) |
| $100,000 to $299,999 | 78 (7.7%) | 267 (14.4%) |
| $300,000 to $499,999 | 519 (51.0%) | 655 (35.4%) |
| $500,000 to $749,999 | 123 (12.1%) | 678 (36.6%) |
| $750,000 to $999,999 | 132 (13.0%) | 194 (10.5%) |
| $1,000,000 or more | 65 (6.4%) | 57 (3.1%) |
| Total | 1,018 (100.0%) | 1,851 (100.0%) |
Household Income by Mortgage Status in Riverside
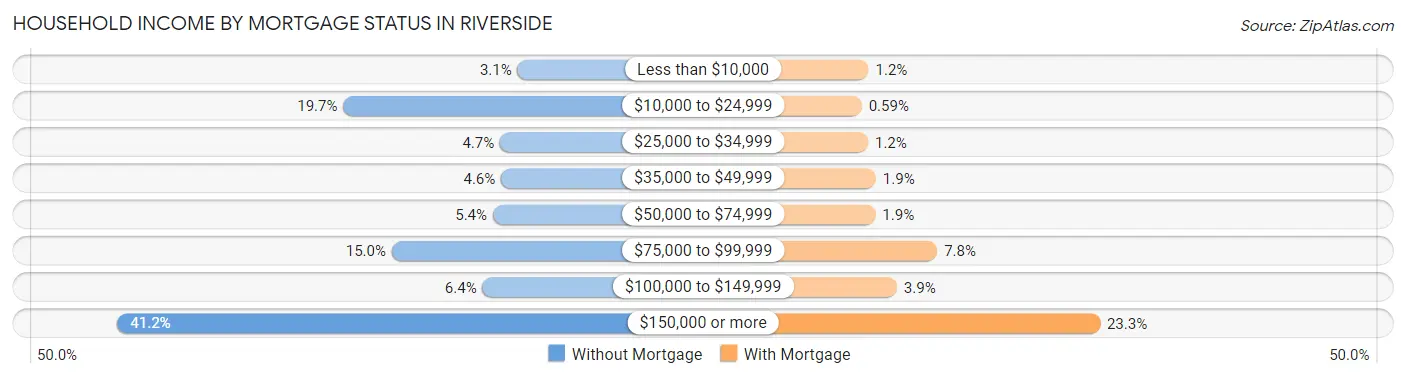
| Household Income | Without Mortgage | With Mortgage |
| Less than $10,000 | 31 (3.0%) | 23 (1.2%) |
| $10,000 to $24,999 | 200 (19.7%) | 11 (0.6%) |
| $25,000 to $34,999 | 48 (4.7%) | 22 (1.2%) |
| $35,000 to $49,999 | 47 (4.6%) | 36 (1.9%) |
| $50,000 to $74,999 | 55 (5.4%) | 35 (1.9%) |
| $75,000 to $99,999 | 153 (15.0%) | 144 (7.8%) |
| $100,000 to $149,999 | 65 (6.4%) | 73 (3.9%) |
| $150,000 or more | 419 (41.2%) | 431 (23.3%) |
| Total | 1,018 (100.0%) | 1,851 (100.0%) |
Property Value to Household Income Ratio in Riverside
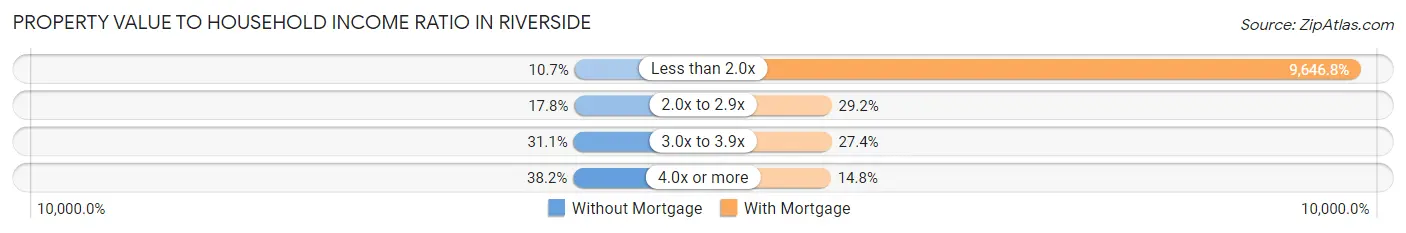
| Value-to-Income Ratio | Without Mortgage | With Mortgage |
| Less than 2.0x | 109 (10.7%) | 178,563 (9,646.8%) |
| 2.0x to 2.9x | 181 (17.8%) | 541 (29.2%) |
| 3.0x to 3.9x | 317 (31.1%) | 507 (27.4%) |
| 4.0x or more | 389 (38.2%) | 274 (14.8%) |
| Total | 1,018 (100.0%) | 1,851 (100.0%) |
Real Estate Taxes by Mortgage Status in Riverside
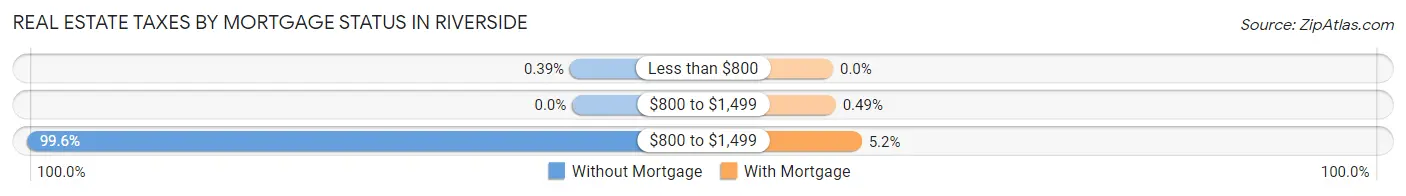
| Property Taxes | Without Mortgage | With Mortgage |
| Less than $800 | 4 (0.4%) | 0 (0.0%) |
| $800 to $1,499 | 0 (0.0%) | 9 (0.5%) |
| $800 to $1,499 | 1,014 (99.6%) | 97 (5.2%) |
| Total | 1,018 (100.0%) | 1,851 (100.0%) |
Health & Disability in Riverside
Health Insurance Coverage by Age in Riverside
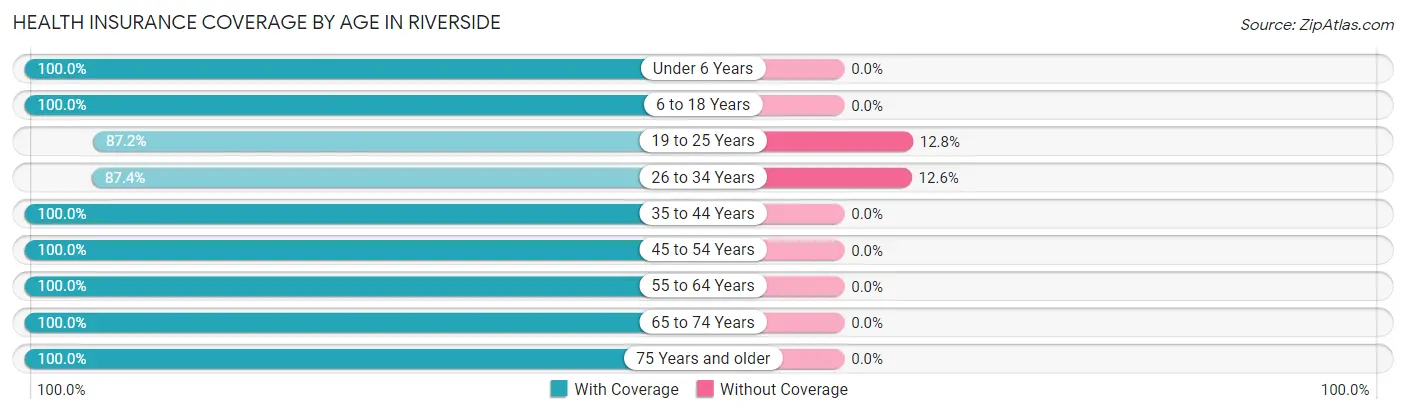
| Age Bracket | With Coverage | Without Coverage |
| Under 6 Years | 806 (100.0%) | 0 (0.0%) |
| 6 to 18 Years | 2,095 (100.0%) | 0 (0.0%) |
| 19 to 25 Years | 362 (87.2%) | 53 (12.8%) |
| 26 to 34 Years | 369 (87.4%) | 53 (12.6%) |
| 35 to 44 Years | 1,302 (100.0%) | 0 (0.0%) |
| 45 to 54 Years | 1,183 (100.0%) | 0 (0.0%) |
| 55 to 64 Years | 1,328 (100.0%) | 0 (0.0%) |
| 65 to 74 Years | 1,162 (100.0%) | 0 (0.0%) |
| 75 Years and older | 512 (100.0%) | 0 (0.0%) |
| Total | 9,119 (98.9%) | 106 (1.1%) |
Health Insurance Coverage by Citizenship Status in Riverside
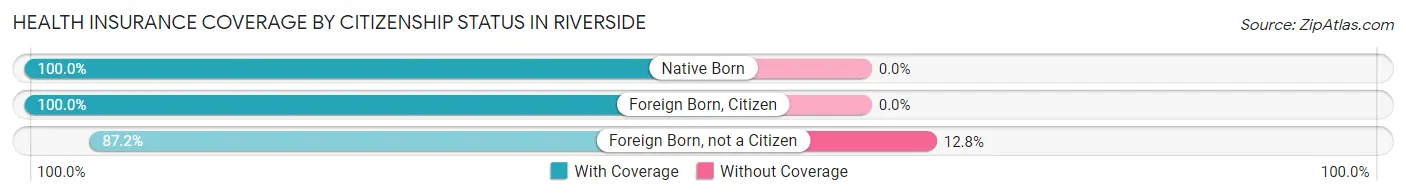
| Citizenship Status | With Coverage | Without Coverage |
| Native Born | 806 (100.0%) | 0 (0.0%) |
| Foreign Born, Citizen | 2,095 (100.0%) | 0 (0.0%) |
| Foreign Born, not a Citizen | 362 (87.2%) | 53 (12.8%) |
Health Insurance Coverage by Household Income in Riverside
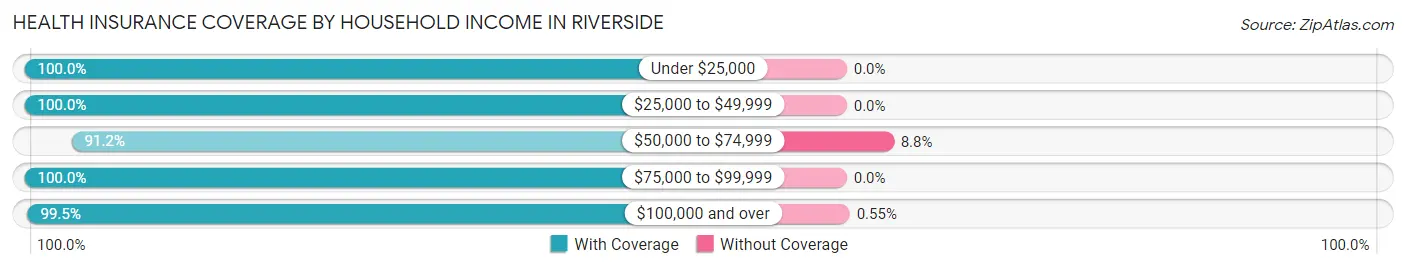
| Household Income | With Coverage | Without Coverage |
| Under $25,000 | 482 (100.0%) | 0 (0.0%) |
| $25,000 to $49,999 | 227 (100.0%) | 0 (0.0%) |
| $50,000 to $74,999 | 685 (91.2%) | 66 (8.8%) |
| $75,000 to $99,999 | 495 (100.0%) | 0 (0.0%) |
| $100,000 and over | 7,226 (99.5%) | 40 (0.5%) |
Public vs Private Health Insurance Coverage by Age in Riverside
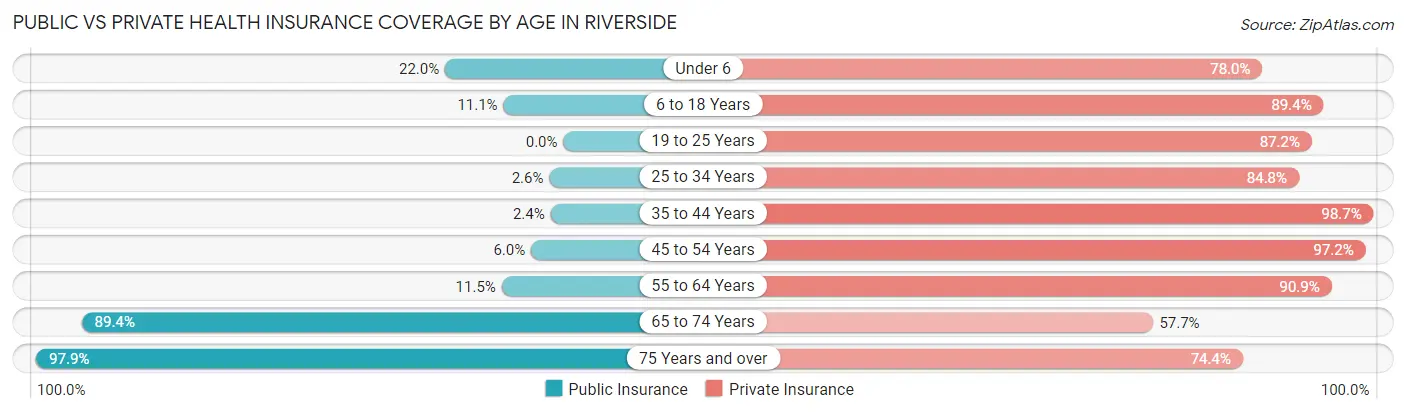
| Age Bracket | Public Insurance | Private Insurance |
| Under 6 | 177 (22.0%) | 629 (78.0%) |
| 6 to 18 Years | 233 (11.1%) | 1,873 (89.4%) |
| 19 to 25 Years | 0 (0.0%) | 362 (87.2%) |
| 25 to 34 Years | 11 (2.6%) | 358 (84.8%) |
| 35 to 44 Years | 31 (2.4%) | 1,285 (98.7%) |
| 45 to 54 Years | 71 (6.0%) | 1,150 (97.2%) |
| 55 to 64 Years | 152 (11.5%) | 1,207 (90.9%) |
| 65 to 74 Years | 1,039 (89.4%) | 670 (57.7%) |
| 75 Years and over | 501 (97.9%) | 381 (74.4%) |
| Total | 2,215 (24.0%) | 7,915 (85.8%) |
Disability Status by Sex by Age in Riverside
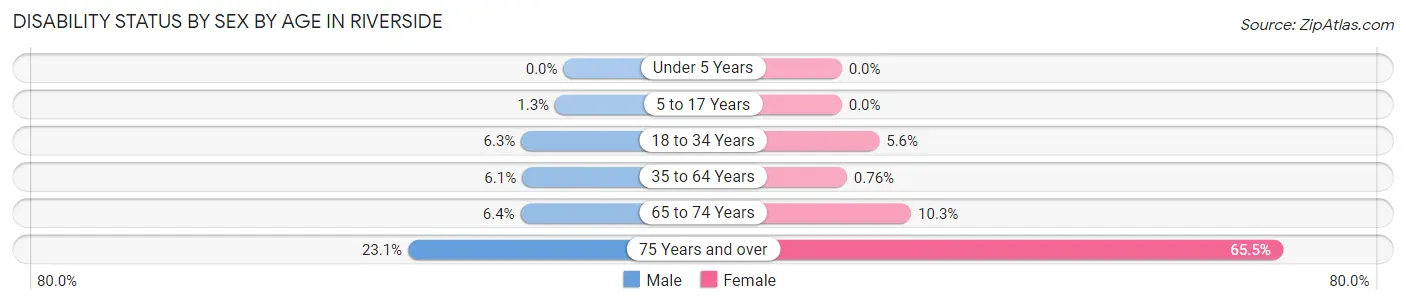
| Age Bracket | Male | Female |
| Under 5 Years | 0 (0.0%) | 0 (0.0%) |
| 5 to 17 Years | 19 (1.3%) | 0 (0.0%) |
| 18 to 34 Years | 36 (6.3%) | 24 (5.6%) |
| 35 to 64 Years | 105 (6.1%) | 16 (0.8%) |
| 65 to 74 Years | 27 (6.4%) | 76 (10.3%) |
| 75 Years and over | 48 (23.1%) | 199 (65.5%) |
Disability Class by Sex by Age in Riverside
Disability Class: Hearing Difficulty
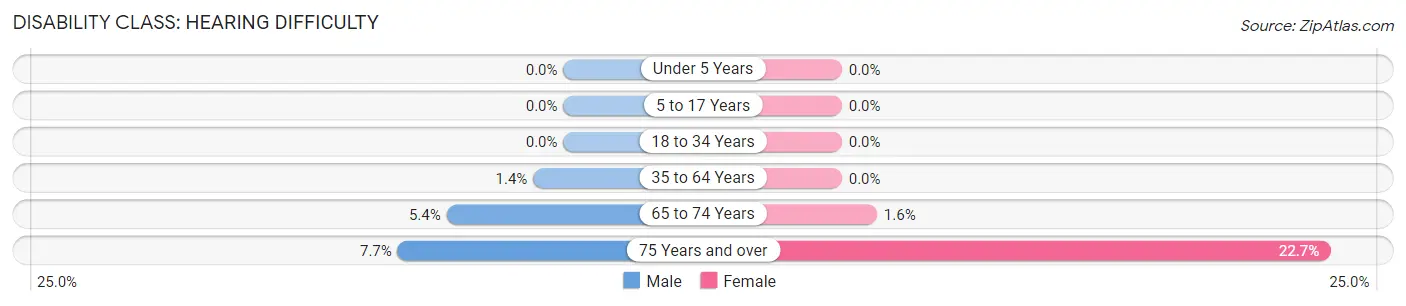
| Age Bracket | Male | Female |
| Under 5 Years | 0 (0.0%) | 0 (0.0%) |
| 5 to 17 Years | 0 (0.0%) | 0 (0.0%) |
| 18 to 34 Years | 0 (0.0%) | 0 (0.0%) |
| 35 to 64 Years | 24 (1.4%) | 0 (0.0%) |
| 65 to 74 Years | 23 (5.4%) | 12 (1.6%) |
| 75 Years and over | 16 (7.7%) | 69 (22.7%) |
Disability Class: Vision Difficulty
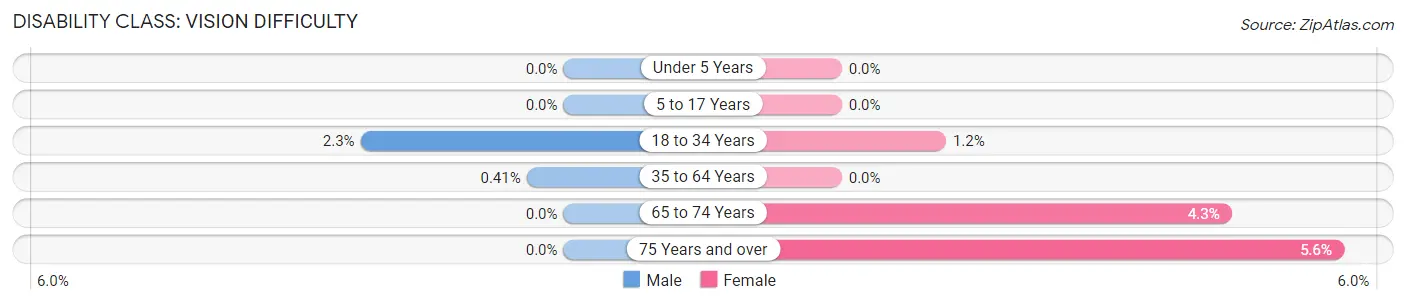
| Age Bracket | Male | Female |
| Under 5 Years | 0 (0.0%) | 0 (0.0%) |
| 5 to 17 Years | 0 (0.0%) | 0 (0.0%) |
| 18 to 34 Years | 13 (2.3%) | 5 (1.2%) |
| 35 to 64 Years | 7 (0.4%) | 0 (0.0%) |
| 65 to 74 Years | 0 (0.0%) | 32 (4.3%) |
| 75 Years and over | 0 (0.0%) | 17 (5.6%) |
Disability Class: Cognitive Difficulty
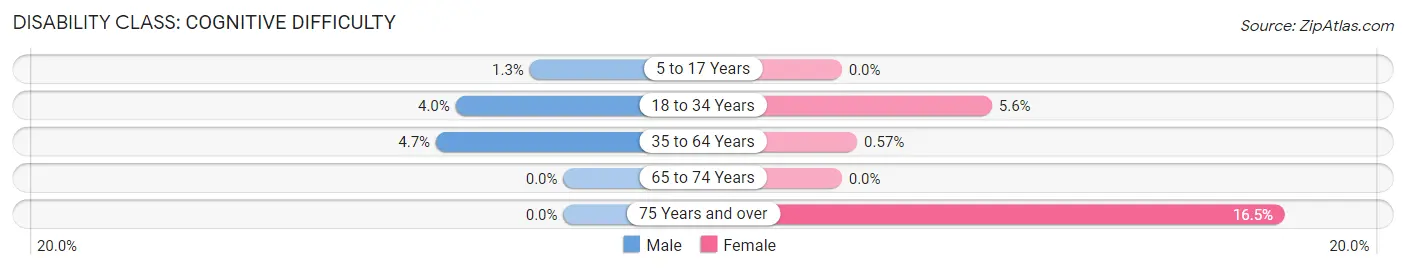
| Age Bracket | Male | Female |
| 5 to 17 Years | 19 (1.3%) | 0 (0.0%) |
| 18 to 34 Years | 23 (4.0%) | 24 (5.6%) |
| 35 to 64 Years | 81 (4.7%) | 12 (0.6%) |
| 65 to 74 Years | 0 (0.0%) | 0 (0.0%) |
| 75 Years and over | 0 (0.0%) | 50 (16.5%) |
Disability Class: Ambulatory Difficulty
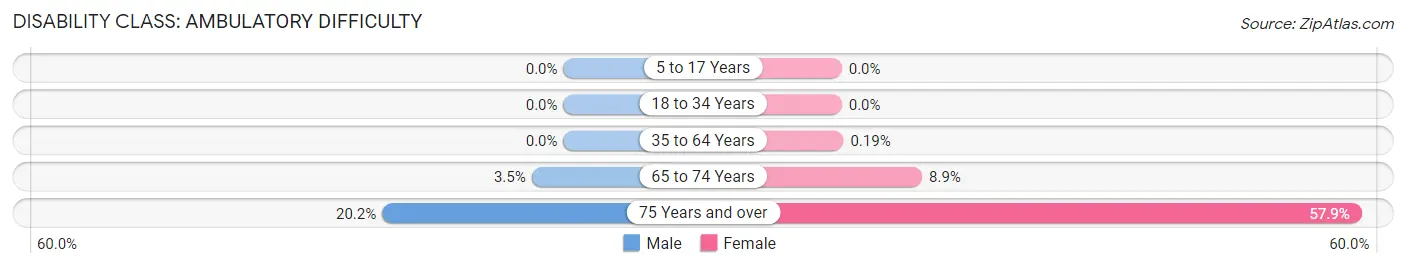
| Age Bracket | Male | Female |
| 5 to 17 Years | 0 (0.0%) | 0 (0.0%) |
| 18 to 34 Years | 0 (0.0%) | 0 (0.0%) |
| 35 to 64 Years | 0 (0.0%) | 4 (0.2%) |
| 65 to 74 Years | 15 (3.5%) | 66 (8.9%) |
| 75 Years and over | 42 (20.2%) | 176 (57.9%) |
Disability Class: Self-Care Difficulty
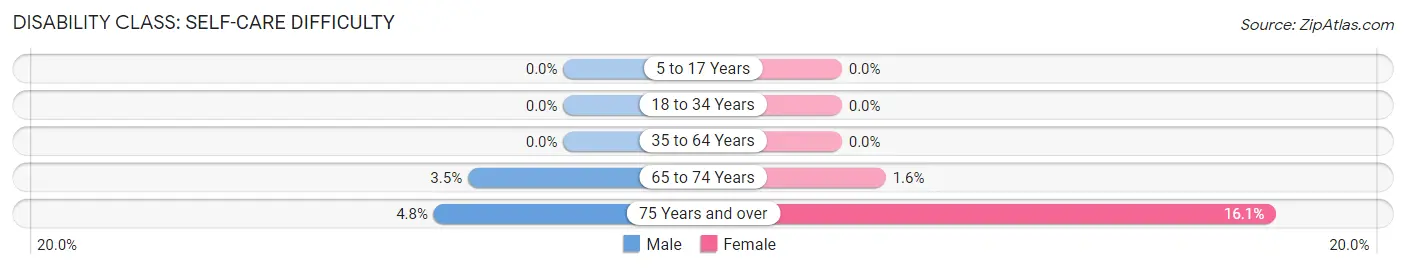
| Age Bracket | Male | Female |
| 5 to 17 Years | 0 (0.0%) | 0 (0.0%) |
| 18 to 34 Years | 0 (0.0%) | 0 (0.0%) |
| 35 to 64 Years | 0 (0.0%) | 0 (0.0%) |
| 65 to 74 Years | 15 (3.5%) | 12 (1.6%) |
| 75 Years and over | 10 (4.8%) | 49 (16.1%) |
Technology Access in Riverside
Computing Device Access in Riverside
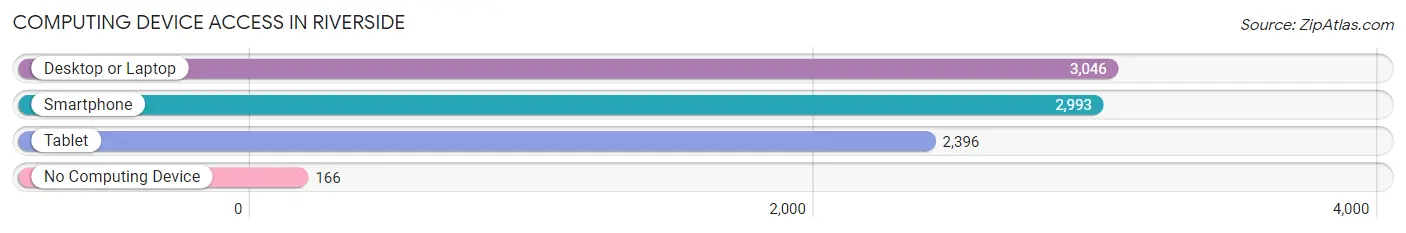
| Device Type | # Households | % Households |
| Desktop or Laptop | 3,046 | 90.0% |
| Smartphone | 2,993 | 88.4% |
| Tablet | 2,396 | 70.8% |
| No Computing Device | 166 | 4.9% |
| Total | 3,386 | 100.0% |
Internet Access in Riverside
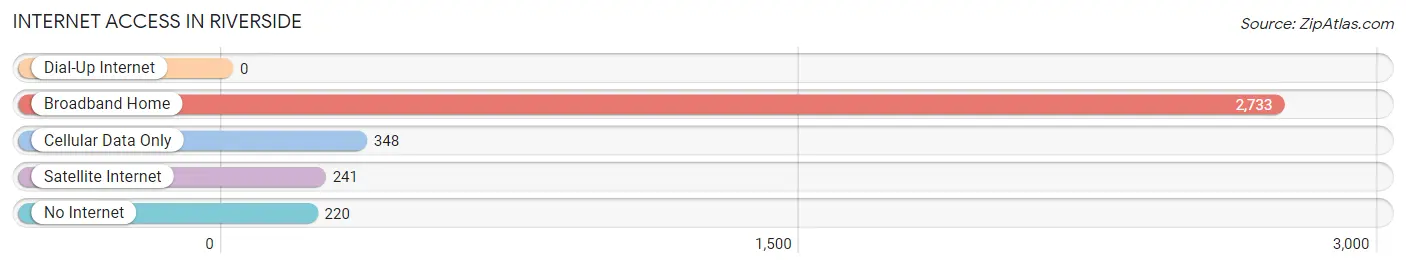
| Internet Type | # Households | % Households |
| Dial-Up Internet | 0 | 0.0% |
| Broadband Home | 2,733 | 80.7% |
| Cellular Data Only | 348 | 10.3% |
| Satellite Internet | 241 | 7.1% |
| No Internet | 220 | 6.5% |
| Total | 3,386 | 100.0% |
Riverside Summary
Riverside, Illinois is a village located in Cook County, Illinois, United States. It is a suburb of Chicago, located approximately 13 miles west of the city's downtown. The population was 8,875 at the 2010 census.
History
Riverside was founded in 1869 by a group of entrepreneurs led by William B. Ogden, the first mayor of Chicago. The village was named after the nearby Des Plaines River. The original plat of Riverside was designed by Frederick Law Olmsted, the renowned landscape architect who also designed New York City's Central Park. Riverside was the first planned community in the United States and is considered one of the first suburbs of Chicago.
The village was incorporated in 1875 and was home to many prominent Chicagoans, including the Pullman family, who built a large estate in the village. Riverside was also home to the Riverside Golf Club, which was founded in 1899 and is one of the oldest golf clubs in the United States.
Geography
Riverside is located at 41°49'17" North, 87°49'17" West (41.8214, -87.8214). According to the 2010 census, the village has a total area of 2.2 square miles (5.7 km2), all land.
Economy
Riverside is a primarily residential community, with a small commercial district located along the Des Plaines River. The village is home to several small businesses, including restaurants, retail stores, and professional services. The village is also home to the Riverside Golf Club, which is one of the oldest golf clubs in the United States.
Demographics
As of the 2010 census, there were 8,875 people, 3,541 households, and 2,521 families residing in the village. The population density was 4,039.2 people per square mile (1,561.2/km2). There were 3,717 housing units at an average density of 1,683.2 per square mile (649.7/km2). The racial makeup of the village was 87.2% White, 4.2% African American, 0.2% Native American, 4.7% Asian, 0.1% Pacific Islander, 1.7% from other races, and 2.0% from two or more races. Hispanic or Latino of any race were 5.7% of the population.
There were 3,541 households, out of which 33.2% had children under the age of 18 living with them, 58.2% were married couples living together, 8.7% had a female householder with no husband present, and 30.2% were non-families. 25.2% of all households were made up of individuals, and 11.2% had someone living alone who was 65 years of age or older. The average household size was 2.51 and the average family size was 3.05.
In the village, the population was spread out, with 24.7% under the age of 18, 5.3% from 18 to 24, 25.2% from 25 to 44, 28.7% from 45 to 64, and 16.1% who were 65 years of age or older. The median age was 42 years. For every 100 females, there were 92.2 males. For every 100 females age 18 and over, there were 88.3 males.
The median income for a household in the village was $76,945, and the median income for a family was $93,917. Males had a median income of $60,938 versus $41,919 for females. The per capita income for the village was $37,945. About 2.2% of families and 3.3% of the population were below the poverty line, including 3.7% of those under age 18 and 4.2% of those age 65 or over.
Common Questions
What is Per Capita Income in Riverside?
Per Capita income in Riverside is $64,469.
What is the Median Family Income in Riverside?
Median Family Income in Riverside is $178,200.
What is the Median Household income in Riverside?
Median Household Income in Riverside is $149,464.
What is Income or Wage Gap in Riverside?
Income or Wage Gap in Riverside is 17.3%.
Women in Riverside earn 82.7 cents for every dollar earned by a man.
What is Inequality or Gini Index in Riverside?
Inequality or Gini Index in Riverside is 0.41.
What is the Total Population of Riverside?
Total Population of Riverside is 9,225.
What is the Total Male Population of Riverside?
Total Male Population of Riverside is 4,717.
What is the Total Female Population of Riverside?
Total Female Population of Riverside is 4,508.
What is the Ratio of Males per 100 Females in Riverside?
There are 104.64 Males per 100 Females in Riverside.
What is the Ratio of Females per 100 Males in Riverside?
There are 95.57 Females per 100 Males in Riverside.
What is the Median Population Age in Riverside?
Median Population Age in Riverside is 41.6 Years.
What is the Average Family Size in Riverside
Average Family Size in Riverside is 3.2 People.
What is the Average Household Size in Riverside
Average Household Size in Riverside is 2.7 People.
How Large is the Labor Force in Riverside?
There are 4,647 People in the Labor Forcein in Riverside.
What is the Percentage of People in the Labor Force in Riverside?
65.4% of People are in the Labor Force in Riverside.
What is the Unemployment Rate in Riverside?
Unemployment Rate in Riverside is 3.1%.