Zip Codes with the Highest Percentage of Population Employed in Legal Services & Support in Quincy, IL
RELATED REPORTS & OPTIONS
Legal Services & Support
Quincy
Compare Zip Codes
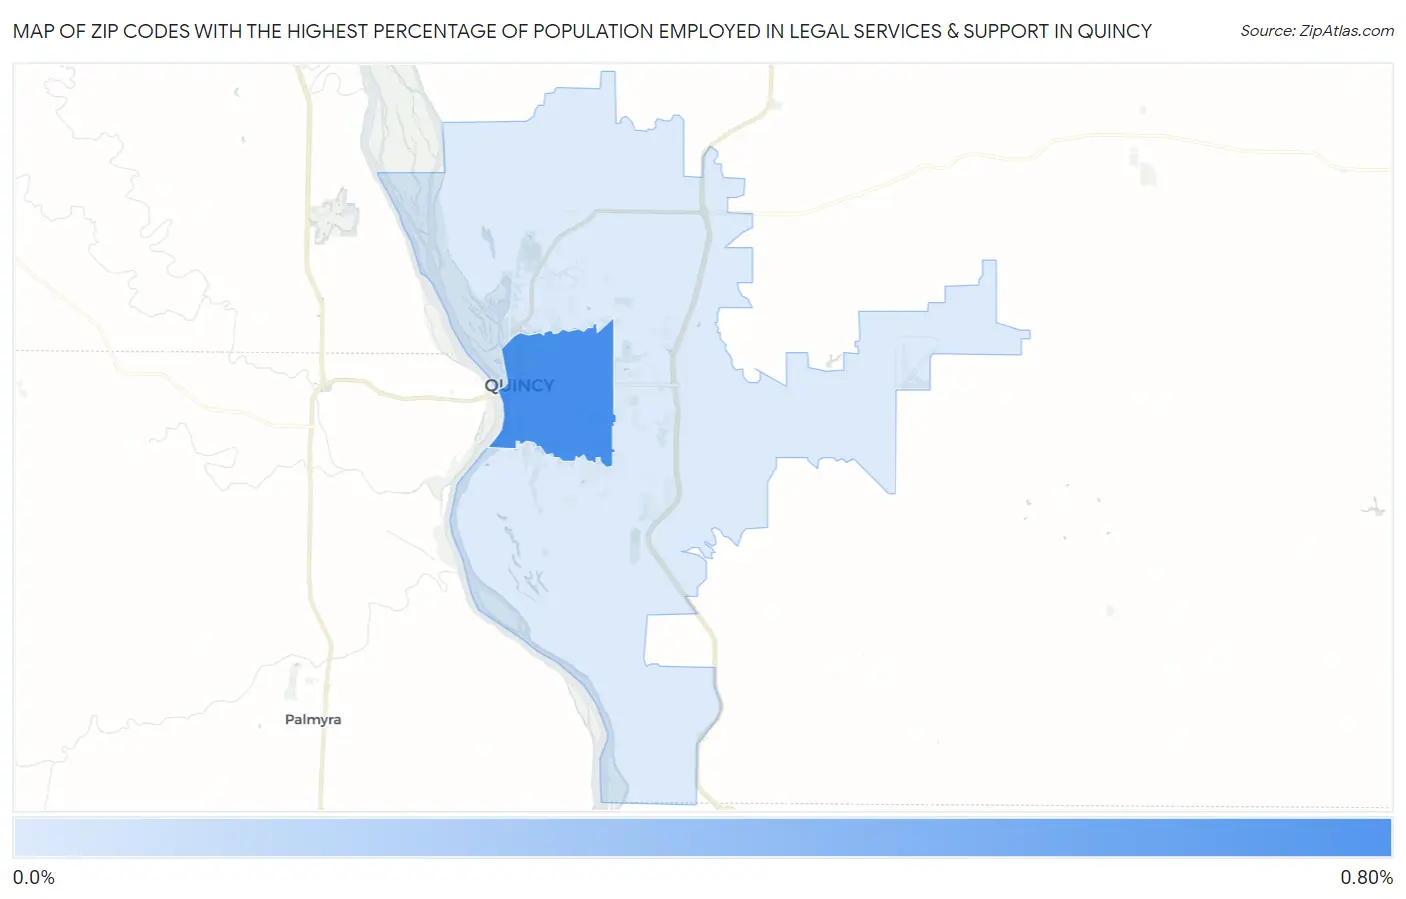
Map of Zip Codes with the Highest Percentage of Population Employed in Legal Services & Support in Quincy
0.14%
0.79%
Zip Codes with the Highest Percentage of Population Employed in Legal Services & Support in Quincy, IL
| Zip Code | % Employed | vs State | vs National | |
| 1. | 62301 | 0.79% | 1.3%(-0.558)#350 | 1.2%(-0.393)#9,545 |
| 2. | 62305 | 0.14% | 1.3%(-1.20)#681 | 1.2%(-1.04)#16,740 |
1
Common Questions
What are the Top Zip Codes with the Highest Percentage of Population Employed in Legal Services & Support in Quincy, IL?
Top Zip Codes with the Highest Percentage of Population Employed in Legal Services & Support in Quincy, IL are:
What zip code has the Highest Percentage of Population Employed in Legal Services & Support in Quincy, IL?
62301 has the Highest Percentage of Population Employed in Legal Services & Support in Quincy, IL with 0.79%.
What is the Percentage of Population Employed in Legal Services & Support in Quincy, IL?
Percentage of Population Employed in Legal Services & Support in Quincy is 0.65%.
What is the Percentage of Population Employed in Legal Services & Support in Illinois?
Percentage of Population Employed in Legal Services & Support in Illinois is 1.3%.
What is the Percentage of Population Employed in Legal Services & Support in the United States?
Percentage of Population Employed in Legal Services & Support in the United States is 1.2%.