Matteson, IL Map & Demographics
Matteson Map
Matteson Overview
$42,795
PER CAPITA INCOME
$105,824
AVG FAMILY INCOME
$88,591
AVG HOUSEHOLD INCOME
8.6%
WAGE / INCOME GAP [ % ]
91.4¢/ $1
WAGE / INCOME GAP [ $ ]
0.42
INEQUALITY / GINI INDEX
18,898
TOTAL POPULATION
8,395
MALE POPULATION
10,503
FEMALE POPULATION
79.93
MALES / 100 FEMALES
125.11
FEMALES / 100 MALES
43.8
MEDIAN AGE
3.2
AVG FAMILY SIZE
2.5
AVG HOUSEHOLD SIZE
10,146
LABOR FORCE [ PEOPLE ]
66.0%
PERCENT IN LABOR FORCE
12.5%
UNEMPLOYMENT RATE
Matteson Zip Codes
Income in Matteson
Income Overview in Matteson
Per Capita Income in Matteson is $42,795, while median incomes of families and households are $105,824 and $88,591 respectively.
| Characteristic | Number | Measure |
| Per Capita Income | 18,898 | $42,795 |
| Median Family Income | 4,773 | $105,824 |
| Mean Family Income | 4,773 | $123,127 |
| Median Household Income | 7,547 | $88,591 |
| Mean Household Income | 7,547 | $103,629 |
| Income Deficit | 4,773 | $0 |
| Wage / Income Gap (%) | 18,898 | 8.59% |
| Wage / Income Gap ($) | 18,898 | 91.41¢ per $1 |
| Gini / Inequality Index | 18,898 | 0.42 |
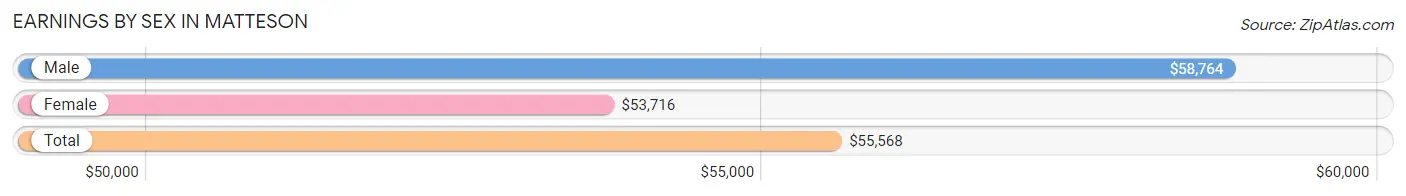
Earnings by Sex in Matteson
Average Earnings in Matteson are $55,568, $58,764 for men and $53,716 for women, a difference of 8.6%.
| Sex | Number | Average Earnings |
| Male | 4,068 (42.6%) | $58,764 |
| Female | 5,469 (57.4%) | $53,716 |
| Total | 9,537 (100.0%) | $55,568 |
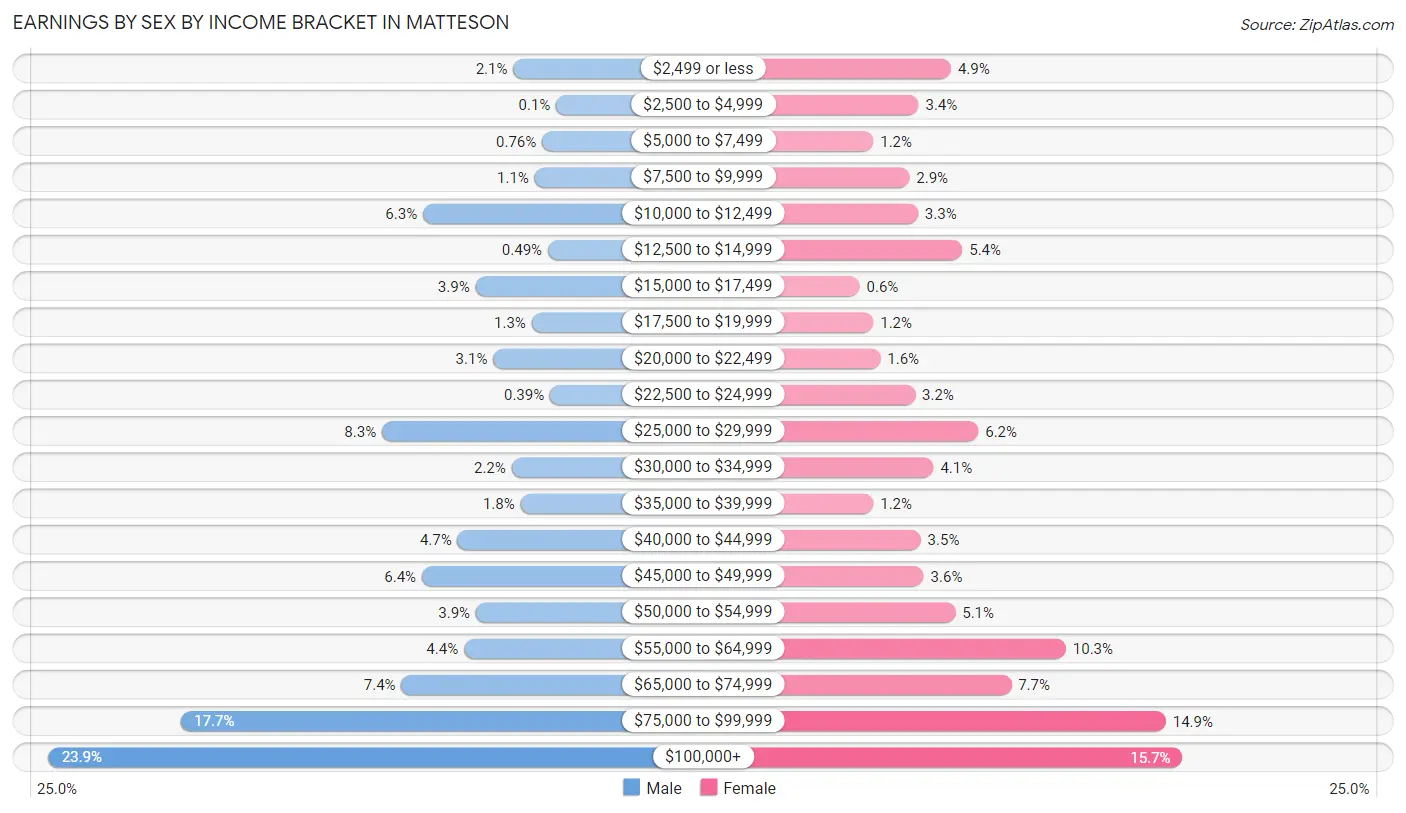
Earnings by Sex by Income Bracket in Matteson
The most common earnings brackets in Matteson are $100,000+ for men (971 | 23.9%) and $100,000+ for women (860 | 15.7%).
| Income | Male | Female |
| $2,499 or less | 86 (2.1%) | 267 (4.9%) |
| $2,500 to $4,999 | 4 (0.1%) | 184 (3.4%) |
| $5,000 to $7,499 | 31 (0.8%) | 68 (1.2%) |
| $7,500 to $9,999 | 45 (1.1%) | 160 (2.9%) |
| $10,000 to $12,499 | 258 (6.3%) | 182 (3.3%) |
| $12,500 to $14,999 | 20 (0.5%) | 296 (5.4%) |
| $15,000 to $17,499 | 158 (3.9%) | 33 (0.6%) |
| $17,500 to $19,999 | 51 (1.3%) | 68 (1.2%) |
| $20,000 to $22,499 | 124 (3.0%) | 86 (1.6%) |
| $22,500 to $24,999 | 16 (0.4%) | 175 (3.2%) |
| $25,000 to $29,999 | 336 (8.3%) | 337 (6.2%) |
| $30,000 to $34,999 | 89 (2.2%) | 222 (4.1%) |
| $35,000 to $39,999 | 72 (1.8%) | 68 (1.2%) |
| $40,000 to $44,999 | 192 (4.7%) | 189 (3.5%) |
| $45,000 to $49,999 | 260 (6.4%) | 197 (3.6%) |
| $50,000 to $54,999 | 157 (3.9%) | 278 (5.1%) |
| $55,000 to $64,999 | 180 (4.4%) | 561 (10.3%) |
| $65,000 to $74,999 | 299 (7.3%) | 421 (7.7%) |
| $75,000 to $99,999 | 719 (17.7%) | 817 (14.9%) |
| $100,000+ | 971 (23.9%) | 860 (15.7%) |
| Total | 4,068 (100.0%) | 5,469 (100.0%) |
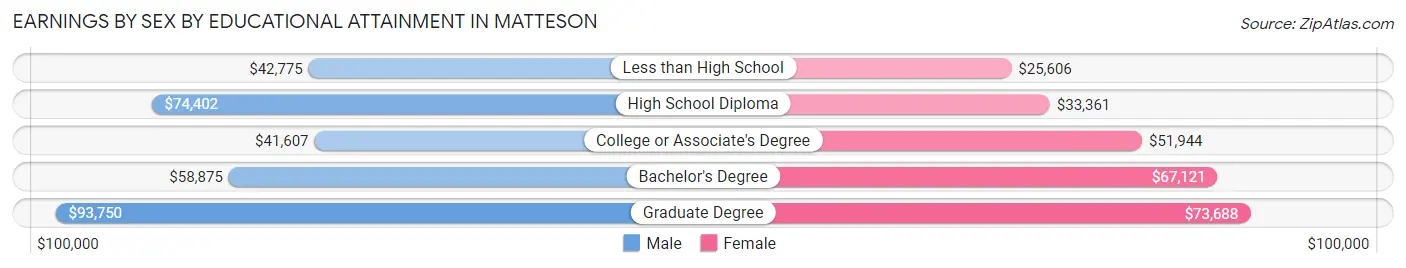
Earnings by Sex by Educational Attainment in Matteson
Average earnings in Matteson are $68,183 for men and $57,860 for women, a difference of 15.1%. Men with an educational attainment of graduate degree enjoy the highest average annual earnings of $93,750, while those with college or associate's degree education earn the least with $41,607. Women with an educational attainment of graduate degree earn the most with the average annual earnings of $73,688, while those with less than high school education have the smallest earnings of $25,606.
| Educational Attainment | Male Income | Female Income |
| Less than High School | $42,775 | $25,606 |
| High School Diploma | $74,402 | $33,361 |
| College or Associate's Degree | $41,607 | $51,944 |
| Bachelor's Degree | $58,875 | $67,121 |
| Graduate Degree | $93,750 | $73,688 |
| Total | $68,183 | $57,860 |
Family Income in Matteson
Family Income Brackets in Matteson
According to the Matteson family income data, there are 1,002 families falling into the $100,000 to $149,999 income range, which is the most common income bracket and makes up 21.0% of all families. Conversely, the $10,000 to $14,999 income bracket is the least frequent group with only 14 families (0.3%) belonging to this category.
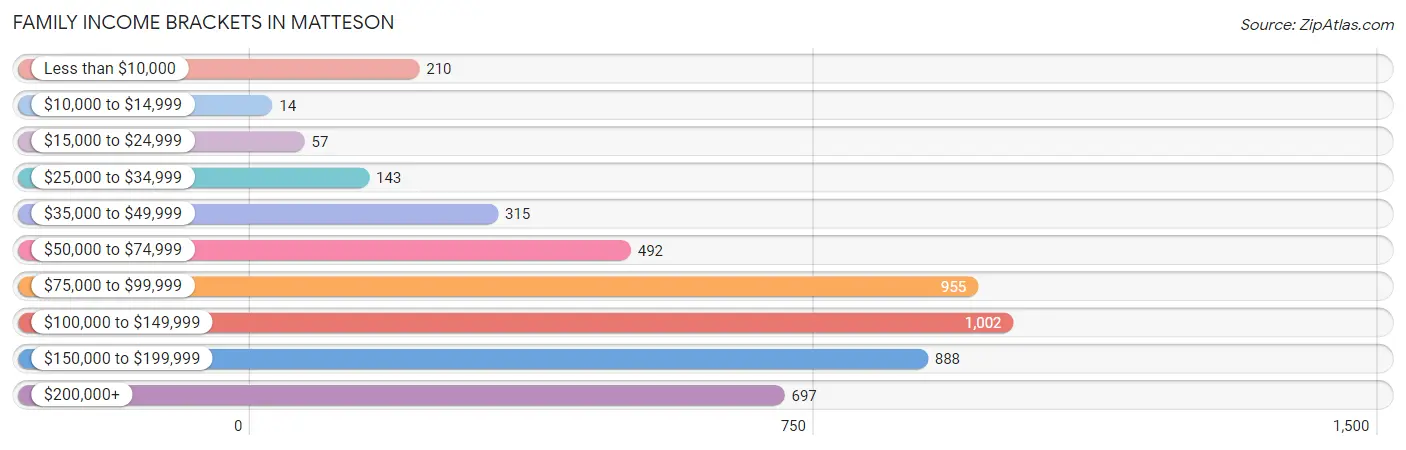
| Income Bracket | # Families | % Families |
| Less than $10,000 | 210 | 4.4% |
| $10,000 to $14,999 | 14 | 0.3% |
| $15,000 to $24,999 | 57 | 1.2% |
| $25,000 to $34,999 | 143 | 3.0% |
| $35,000 to $49,999 | 315 | 6.6% |
| $50,000 to $74,999 | 492 | 10.3% |
| $75,000 to $99,999 | 955 | 20.0% |
| $100,000 to $149,999 | 1,002 | 21.0% |
| $150,000 to $199,999 | 888 | 18.6% |
| $200,000+ | 697 | 14.6% |
Family Income by Famaliy Size in Matteson
6-person families (85 | 1.8%) account for the highest median family income in Matteson with $183,882 per family, while 2-person families (2,392 | 50.1%) have the highest median income of $47,570 per family member.
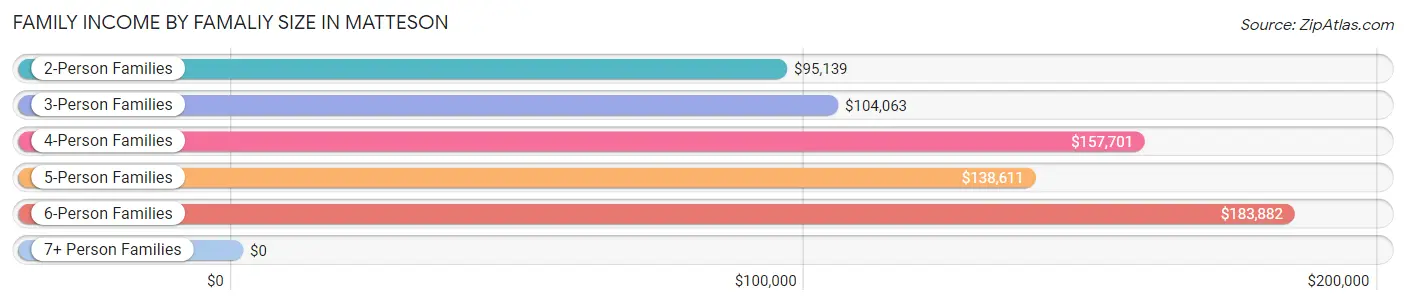
| Income Bracket | # Families | Median Income |
| 2-Person Families | 2,392 (50.1%) | $95,139 |
| 3-Person Families | 1,014 (21.2%) | $104,063 |
| 4-Person Families | 850 (17.8%) | $157,701 |
| 5-Person Families | 422 (8.8%) | $138,611 |
| 6-Person Families | 85 (1.8%) | $183,882 |
| 7+ Person Families | 10 (0.2%) | $0 |
| Total | 4,773 (100.0%) | $105,824 |
Family Income by Number of Earners in Matteson
The median family income in Matteson is $105,824, with families comprising 2 earners (1,889) having the highest median family income of $153,802, while families with no earners (897) have the lowest median family income of $75,043, accounting for 39.6% and 18.8% of families, respectively.
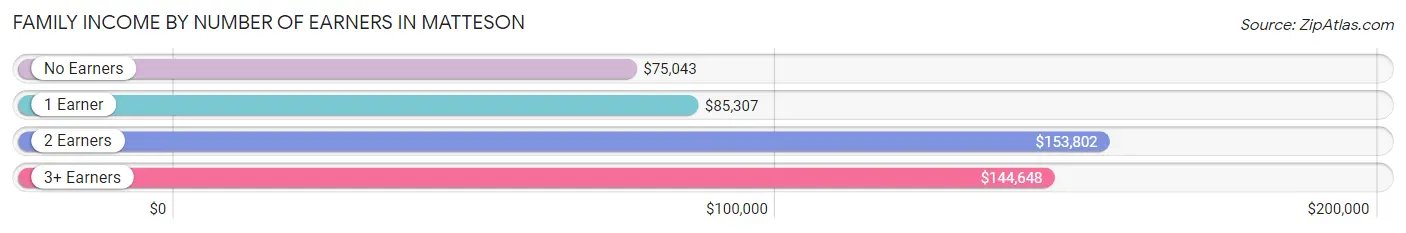
| Number of Earners | # Families | Median Income |
| No Earners | 897 (18.8%) | $75,043 |
| 1 Earner | 1,446 (30.3%) | $85,307 |
| 2 Earners | 1,889 (39.6%) | $153,802 |
| 3+ Earners | 541 (11.3%) | $144,648 |
| Total | 4,773 (100.0%) | $105,824 |
Household Income in Matteson
Household Income Brackets in Matteson
With 1,268 households falling in the category, the $75,000 to $99,999 income range is the most frequent in Matteson, accounting for 16.8% of all households. In contrast, only 294 households (3.9%) fall into the $25,000 to $34,999 income bracket, making it the least populous group.
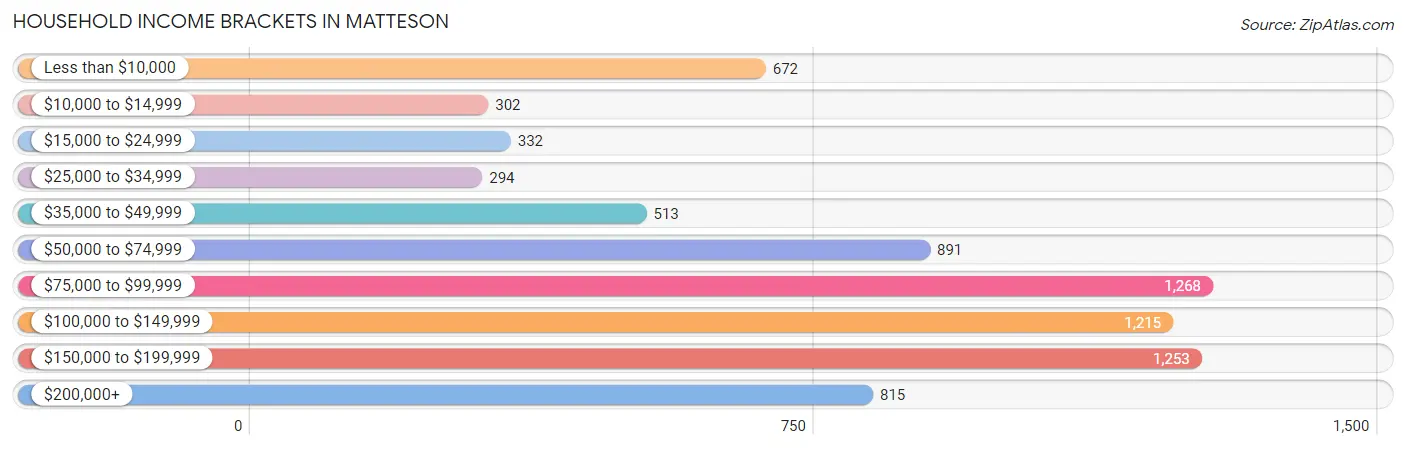
| Income Bracket | # Households | % Households |
| Less than $10,000 | 672 | 8.9% |
| $10,000 to $14,999 | 302 | 4.0% |
| $15,000 to $24,999 | 332 | 4.4% |
| $25,000 to $34,999 | 294 | 3.9% |
| $35,000 to $49,999 | 513 | 6.8% |
| $50,000 to $74,999 | 891 | 11.8% |
| $75,000 to $99,999 | 1,268 | 16.8% |
| $100,000 to $149,999 | 1,215 | 16.1% |
| $150,000 to $199,999 | 1,253 | 16.6% |
| $200,000+ | 815 | 10.8% |
Household Income by Householder Age in Matteson
The median household income in Matteson is $88,591, with the highest median household income of $97,533 found in the 25 to 44 years age bracket for the primary householder. A total of 1,818 households (24.1%) fall into this category. Meanwhile, the 15 to 24 years age bracket for the primary householder has the lowest median household income of $0, with 114 households (1.5%) in this group.
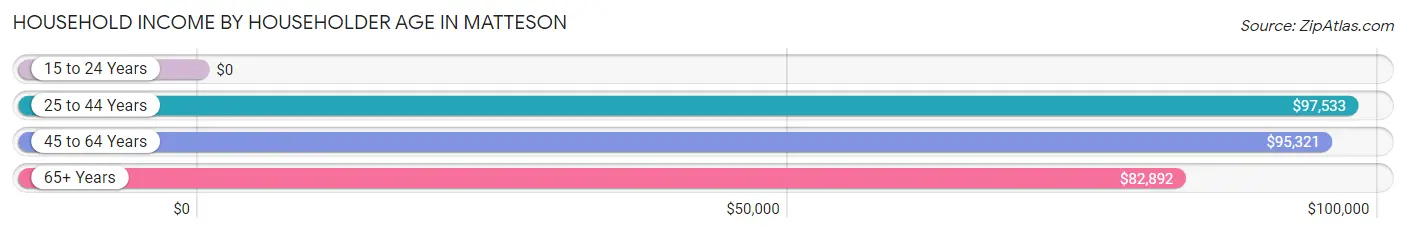
| Income Bracket | # Households | Median Income |
| 15 to 24 Years | 114 (1.5%) | $0 |
| 25 to 44 Years | 1,818 (24.1%) | $97,533 |
| 45 to 64 Years | 3,152 (41.8%) | $95,321 |
| 65+ Years | 2,463 (32.6%) | $82,892 |
| Total | 7,547 (100.0%) | $88,591 |
Poverty in Matteson
Income Below Poverty by Sex and Age in Matteson
With 8.3% poverty level for males and 12.9% for females among the residents of Matteson, 16 and 17 year old males and 18 to 24 year old females are the most vulnerable to poverty, with 52 males (24.5%) and 256 females (26.3%) in their respective age groups living below the poverty level.
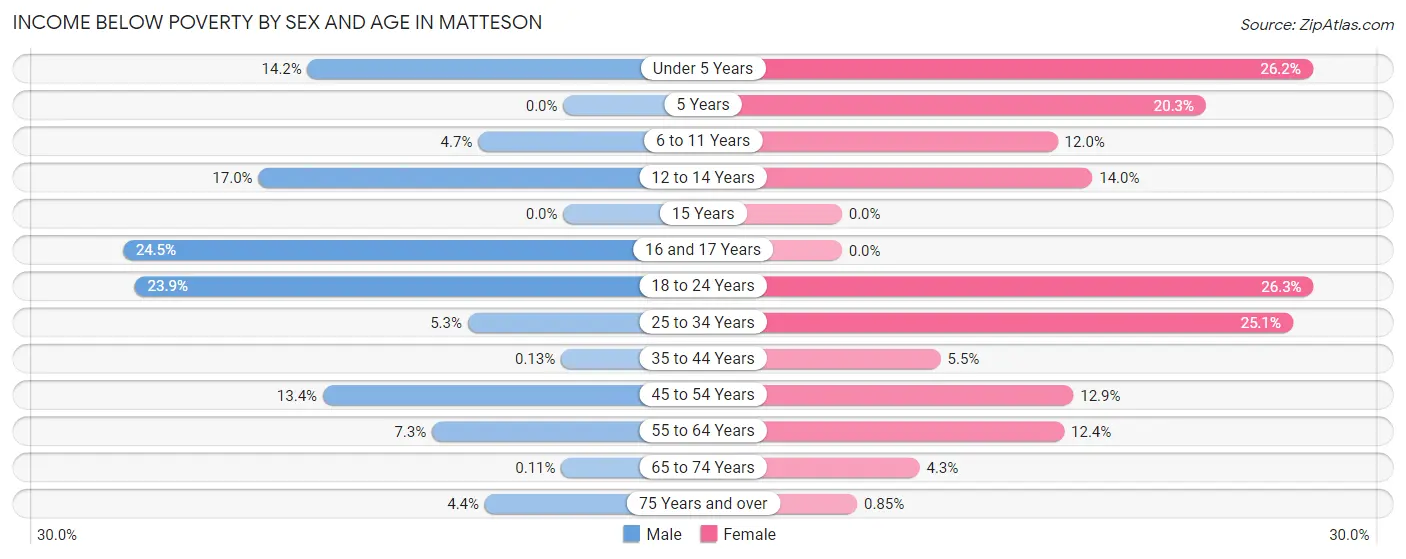
| Age Bracket | Male | Female |
| Under 5 Years | 45 (14.2%) | 146 (26.2%) |
| 5 Years | 0 (0.0%) | 15 (20.3%) |
| 6 to 11 Years | 42 (4.7%) | 44 (12.0%) |
| 12 to 14 Years | 54 (17.0%) | 66 (14.0%) |
| 15 Years | 0 (0.0%) | 0 (0.0%) |
| 16 and 17 Years | 52 (24.5%) | 0 (0.0%) |
| 18 to 24 Years | 158 (23.9%) | 256 (26.3%) |
| 25 to 34 Years | 52 (5.3%) | 294 (25.1%) |
| 35 to 44 Years | 1 (0.1%) | 69 (5.5%) |
| 45 to 54 Years | 181 (13.4%) | 182 (12.9%) |
| 55 to 64 Years | 75 (7.3%) | 218 (12.4%) |
| 65 to 74 Years | 1 (0.1%) | 55 (4.3%) |
| 75 Years and over | 28 (4.4%) | 6 (0.9%) |
| Total | 689 (8.3%) | 1,351 (12.9%) |
Income Above Poverty by Sex and Age in Matteson
According to the poverty statistics in Matteson, males aged 5 years and females aged 15 years are the age groups that are most secure financially, with 100.0% of males and 100.0% of females in these age groups living above the poverty line.
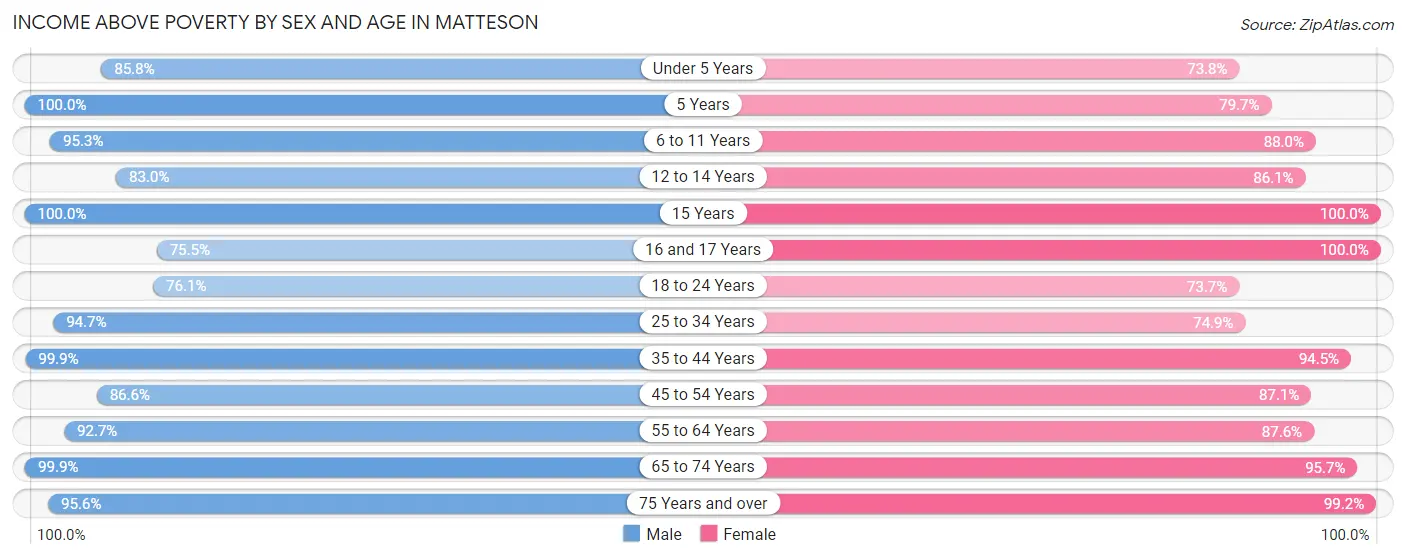
| Age Bracket | Male | Female |
| Under 5 Years | 271 (85.8%) | 411 (73.8%) |
| 5 Years | 35 (100.0%) | 59 (79.7%) |
| 6 to 11 Years | 845 (95.3%) | 322 (88.0%) |
| 12 to 14 Years | 264 (83.0%) | 407 (86.1%) |
| 15 Years | 147 (100.0%) | 279 (100.0%) |
| 16 and 17 Years | 160 (75.5%) | 150 (100.0%) |
| 18 to 24 Years | 504 (76.1%) | 719 (73.7%) |
| 25 to 34 Years | 925 (94.7%) | 877 (74.9%) |
| 35 to 44 Years | 757 (99.9%) | 1,186 (94.5%) |
| 45 to 54 Years | 1,171 (86.6%) | 1,230 (87.1%) |
| 55 to 64 Years | 951 (92.7%) | 1,543 (87.6%) |
| 65 to 74 Years | 951 (99.9%) | 1,214 (95.7%) |
| 75 Years and over | 613 (95.6%) | 696 (99.2%) |
| Total | 7,594 (91.7%) | 9,093 (87.1%) |
Income Below Poverty Among Married-Couple Families in Matteson
The poverty statistics for married-couple families in Matteson show that 0.5% or 15 of the total 3,019 families live below the poverty line. Families with 1 or 2 children have the highest poverty rate of 1.9%, comprising of 15 families. On the other hand, families with no children have the lowest poverty rate of 0.0%, which includes 0 families.
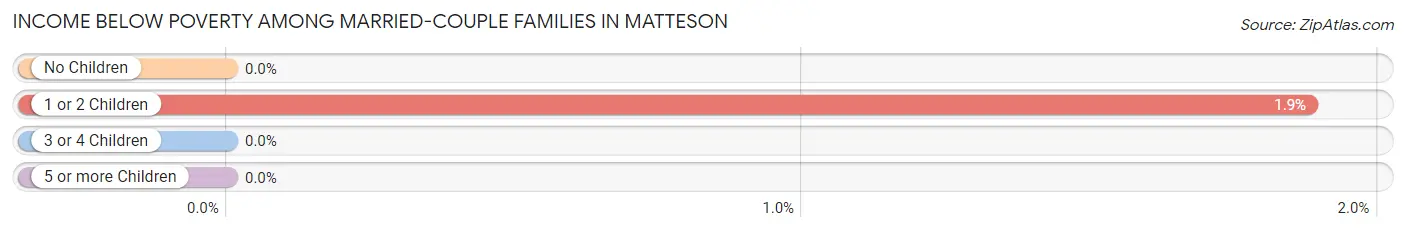
| Children | Above Poverty | Below Poverty |
| No Children | 2,001 (100.0%) | 0 (0.0%) |
| 1 or 2 Children | 785 (98.1%) | 15 (1.9%) |
| 3 or 4 Children | 218 (100.0%) | 0 (0.0%) |
| 5 or more Children | 0 (0.0%) | 0 (0.0%) |
| Total | 3,004 (99.5%) | 15 (0.5%) |
Income Below Poverty Among Single-Parent Households in Matteson
According to the poverty data in Matteson, 20.4% or 64 single-father households and 14.3% or 206 single-mother households are living below the poverty line. Among single-father households, those with 1 or 2 children have the highest poverty rate, with 64 households (37.9%) experiencing poverty. Likewise, among single-mother households, those with 3 or 4 children have the highest poverty rate, with 89 households (64.5%) falling below the poverty line.
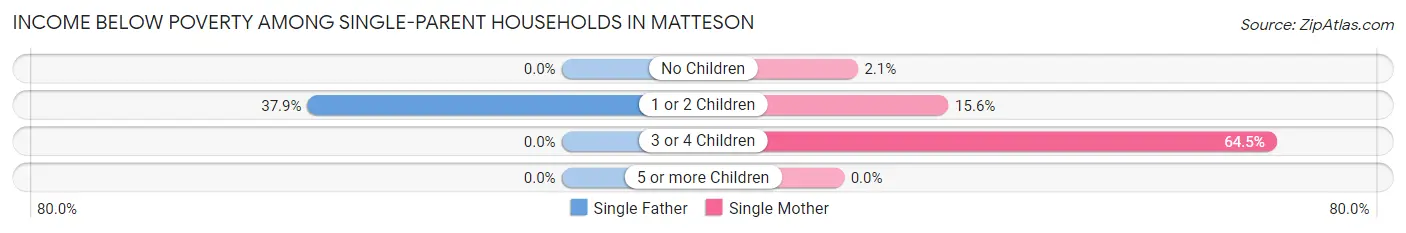
| Children | Single Father | Single Mother |
| No Children | 0 (0.0%) | 13 (2.1%) |
| 1 or 2 Children | 64 (37.9%) | 104 (15.6%) |
| 3 or 4 Children | 0 (0.0%) | 89 (64.5%) |
| 5 or more Children | 0 (0.0%) | 0 (0.0%) |
| Total | 64 (20.4%) | 206 (14.3%) |
Income Below Poverty Among Married-Couple vs Single-Parent Households in Matteson
The poverty data for Matteson shows that 15 of the married-couple family households (0.5%) and 270 of the single-parent households (15.4%) are living below the poverty level. Within the married-couple family households, those with 1 or 2 children have the highest poverty rate, with 15 households (1.9%) falling below the poverty line. Among the single-parent households, those with 3 or 4 children have the highest poverty rate, with 89 household (60.1%) living below poverty.
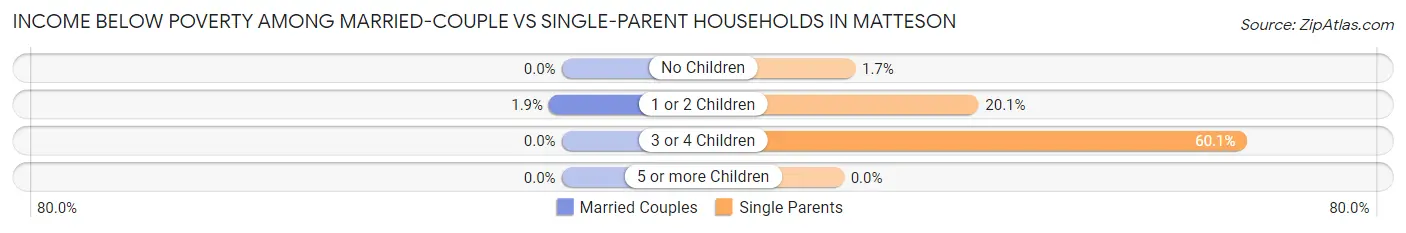
| Children | Married-Couple Families | Single-Parent Households |
| No Children | 0 (0.0%) | 13 (1.7%) |
| 1 or 2 Children | 15 (1.9%) | 168 (20.1%) |
| 3 or 4 Children | 0 (0.0%) | 89 (60.1%) |
| 5 or more Children | 0 (0.0%) | 0 (0.0%) |
| Total | 15 (0.5%) | 270 (15.4%) |
Race in Matteson
The most populous races in Matteson are Black / African American (15,194 | 80.4%), White / Caucasian (2,258 | 11.9%), and Two or more Races (854 | 4.5%).
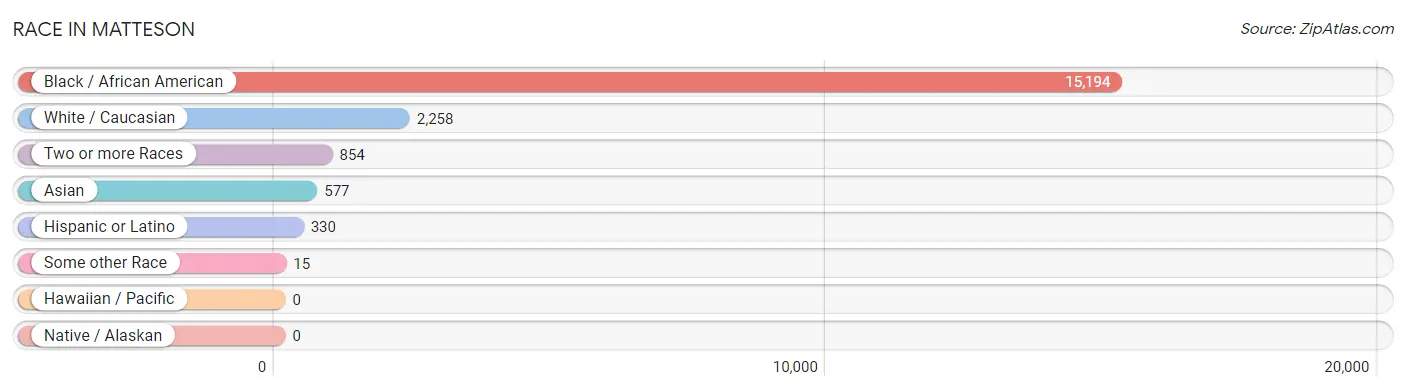
| Race | # Population | % Population |
| Asian | 577 | 3.0% |
| Black / African American | 15,194 | 80.4% |
| Hawaiian / Pacific | 0 | 0.0% |
| Hispanic or Latino | 330 | 1.8% |
| Native / Alaskan | 0 | 0.0% |
| White / Caucasian | 2,258 | 11.9% |
| Two or more Races | 854 | 4.5% |
| Some other Race | 15 | 0.1% |
| Total | 18,898 | 100.0% |
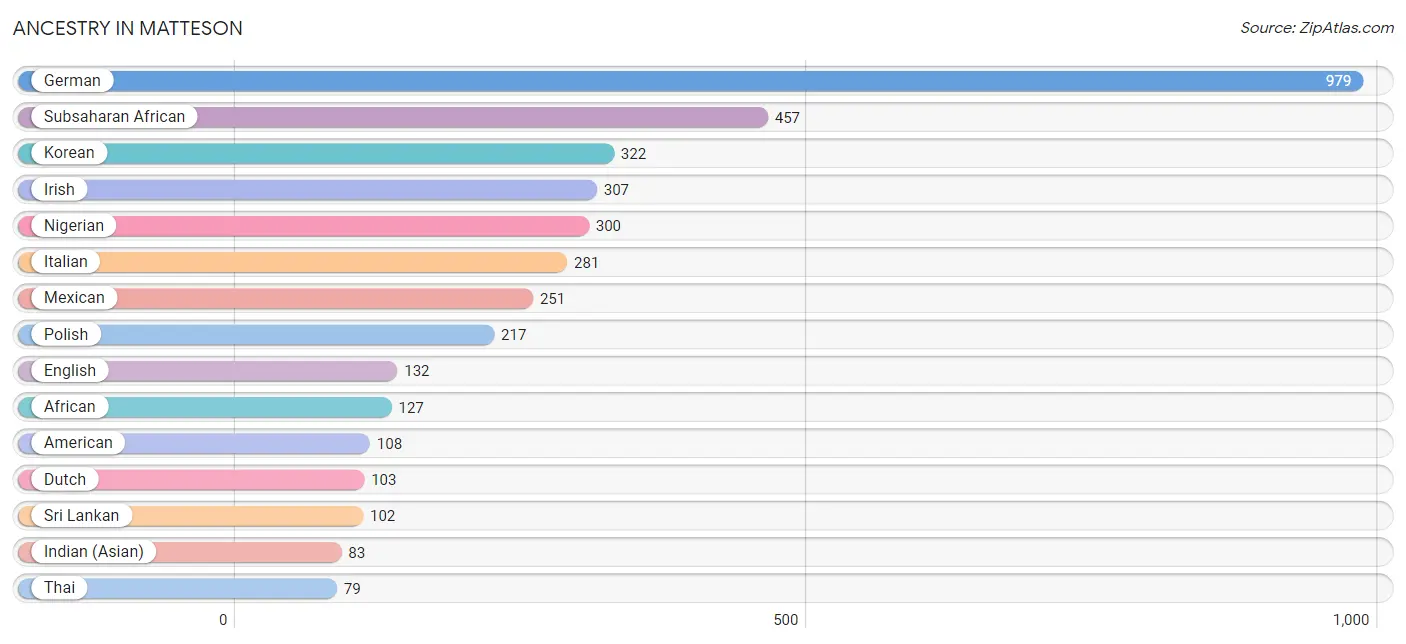
Ancestry in Matteson
The most populous ancestries reported in Matteson are German (979 | 5.2%), Subsaharan African (457 | 2.4%), Korean (322 | 1.7%), Irish (307 | 1.6%), and Nigerian (300 | 1.6%), together accounting for 12.5% of all Matteson residents.
| Ancestry | # Population | % Population |
| African | 127 | 0.7% |
| American | 108 | 0.6% |
| Arab | 15 | 0.1% |
| Basque | 15 | 0.1% |
| Belizean | 17 | 0.1% |
| Bhutanese | 30 | 0.2% |
| British | 18 | 0.1% |
| Burmese | 19 | 0.1% |
| Cape Verdean | 30 | 0.2% |
| Cherokee | 34 | 0.2% |
| Dutch | 103 | 0.5% |
| Eastern European | 17 | 0.1% |
| English | 132 | 0.7% |
| Finnish | 32 | 0.2% |
| French | 49 | 0.3% |
| French Canadian | 27 | 0.1% |
| German | 979 | 5.2% |
| Greek | 34 | 0.2% |
| Indian (Asian) | 83 | 0.4% |
| Irish | 307 | 1.6% |
| Italian | 281 | 1.5% |
| Jamaican | 50 | 0.3% |
| Korean | 322 | 1.7% |
| Lumbee | 71 | 0.4% |
| Mexican | 251 | 1.3% |
| Native Hawaiian | 21 | 0.1% |
| Nigerian | 300 | 1.6% |
| Norwegian | 33 | 0.2% |
| Palestinian | 15 | 0.1% |
| Polish | 217 | 1.1% |
| Puerto Rican | 69 | 0.4% |
| Russian | 51 | 0.3% |
| Scotch-Irish | 33 | 0.2% |
| Sri Lankan | 102 | 0.5% |
| Subsaharan African | 457 | 2.4% |
| Swedish | 26 | 0.1% |
| Thai | 79 | 0.4% |
| Welsh | 15 | 0.1% | View All 38 Rows |
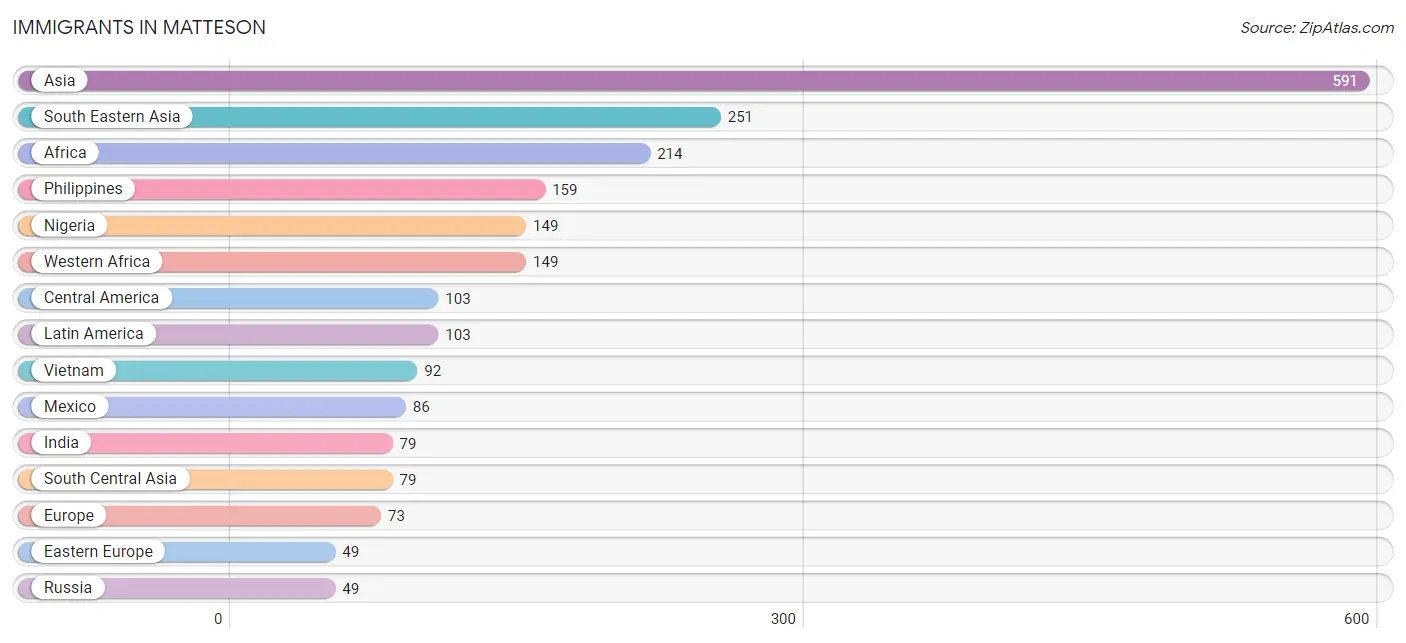
Immigrants in Matteson
The most numerous immigrant groups reported in Matteson came from Asia (591 | 3.1%), South Eastern Asia (251 | 1.3%), Africa (214 | 1.1%), Philippines (159 | 0.8%), and Nigeria (149 | 0.8%), together accounting for 7.2% of all Matteson residents.
| Immigration Origin | # Population | % Population |
| Africa | 214 | 1.1% |
| Asia | 591 | 3.1% |
| Belize | 17 | 0.1% |
| Central America | 103 | 0.5% |
| China | 26 | 0.1% |
| Eastern Asia | 45 | 0.2% |
| Eastern Europe | 49 | 0.3% |
| Europe | 73 | 0.4% |
| Germany | 24 | 0.1% |
| India | 79 | 0.4% |
| Korea | 19 | 0.1% |
| Latin America | 103 | 0.5% |
| Mexico | 86 | 0.5% |
| Nigeria | 149 | 0.8% |
| Philippines | 159 | 0.8% |
| Russia | 49 | 0.3% |
| South Central Asia | 79 | 0.4% |
| South Eastern Asia | 251 | 1.3% |
| Vietnam | 92 | 0.5% |
| Western Africa | 149 | 0.8% |
| Western Europe | 24 | 0.1% | View All 21 Rows |
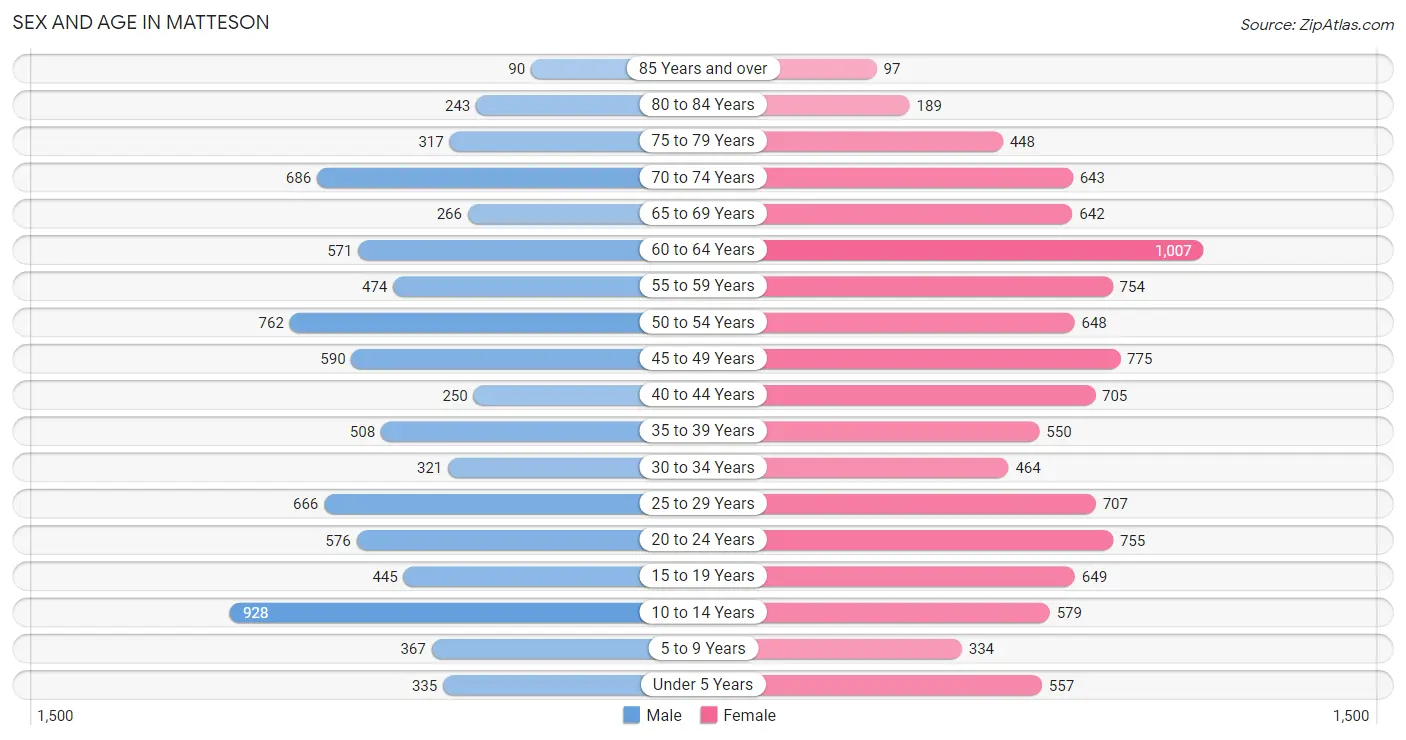
Sex and Age in Matteson
Sex and Age in Matteson
The most populous age groups in Matteson are 10 to 14 Years (928 | 11.1%) for men and 60 to 64 Years (1,007 | 9.6%) for women.
| Age Bracket | Male | Female |
| Under 5 Years | 335 (4.0%) | 557 (5.3%) |
| 5 to 9 Years | 367 (4.4%) | 334 (3.2%) |
| 10 to 14 Years | 928 (11.1%) | 579 (5.5%) |
| 15 to 19 Years | 445 (5.3%) | 649 (6.2%) |
| 20 to 24 Years | 576 (6.9%) | 755 (7.2%) |
| 25 to 29 Years | 666 (7.9%) | 707 (6.7%) |
| 30 to 34 Years | 321 (3.8%) | 464 (4.4%) |
| 35 to 39 Years | 508 (6.0%) | 550 (5.2%) |
| 40 to 44 Years | 250 (3.0%) | 705 (6.7%) |
| 45 to 49 Years | 590 (7.0%) | 775 (7.4%) |
| 50 to 54 Years | 762 (9.1%) | 648 (6.2%) |
| 55 to 59 Years | 474 (5.7%) | 754 (7.2%) |
| 60 to 64 Years | 571 (6.8%) | 1,007 (9.6%) |
| 65 to 69 Years | 266 (3.2%) | 642 (6.1%) |
| 70 to 74 Years | 686 (8.2%) | 643 (6.1%) |
| 75 to 79 Years | 317 (3.8%) | 448 (4.3%) |
| 80 to 84 Years | 243 (2.9%) | 189 (1.8%) |
| 85 Years and over | 90 (1.1%) | 97 (0.9%) |
| Total | 8,395 (100.0%) | 10,503 (100.0%) |
Families and Households in Matteson
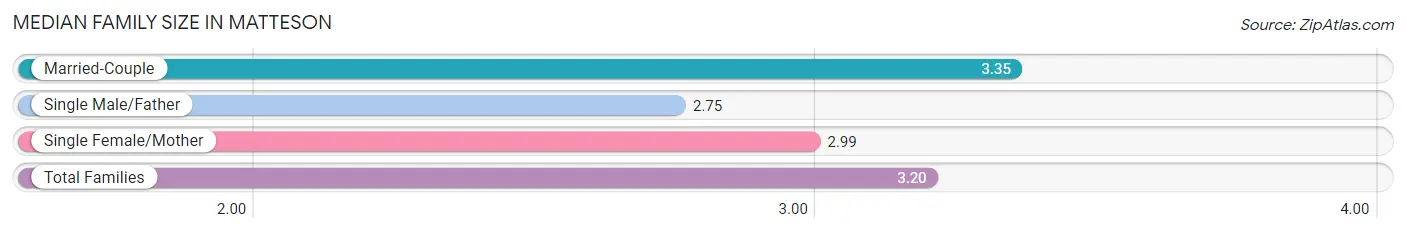
Median Family Size in Matteson
The median family size in Matteson is 3.20 persons per family, with married-couple families (3,019 | 63.2%) accounting for the largest median family size of 3.35 persons per family. On the other hand, single male/father families (314 | 6.6%) represent the smallest median family size with 2.75 persons per family.
| Family Type | # Families | Family Size |
| Married-Couple | 3,019 (63.2%) | 3.35 |
| Single Male/Father | 314 (6.6%) | 2.75 |
| Single Female/Mother | 1,440 (30.2%) | 2.99 |
| Total Families | 4,773 (100.0%) | 3.20 |
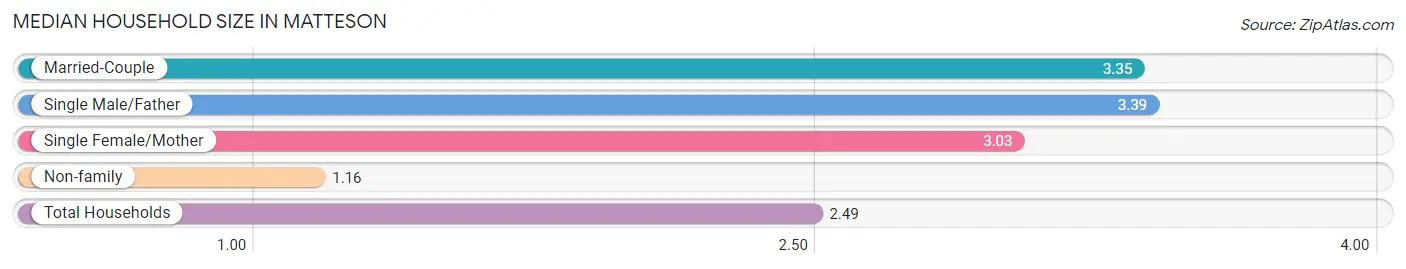
Median Household Size in Matteson
The median household size in Matteson is 2.49 persons per household, with single male/father households (314 | 4.2%) accounting for the largest median household size of 3.39 persons per household. non-family households (2,774 | 36.8%) represent the smallest median household size with 1.16 persons per household.
| Household Type | # Households | Household Size |
| Married-Couple | 3,019 (40.0%) | 3.35 |
| Single Male/Father | 314 (4.2%) | 3.39 |
| Single Female/Mother | 1,440 (19.1%) | 3.03 |
| Non-family | 2,774 (36.8%) | 1.16 |
| Total Households | 7,547 (100.0%) | 2.49 |
Household Size by Marriage Status in Matteson
Out of a total of 7,547 households in Matteson, 4,773 (63.2%) are family households, while 2,774 (36.8%) are nonfamily households. The most numerous type of family households are 2-person households, comprising 2,275, and the most common type of nonfamily households are 1-person households, comprising 2,519.
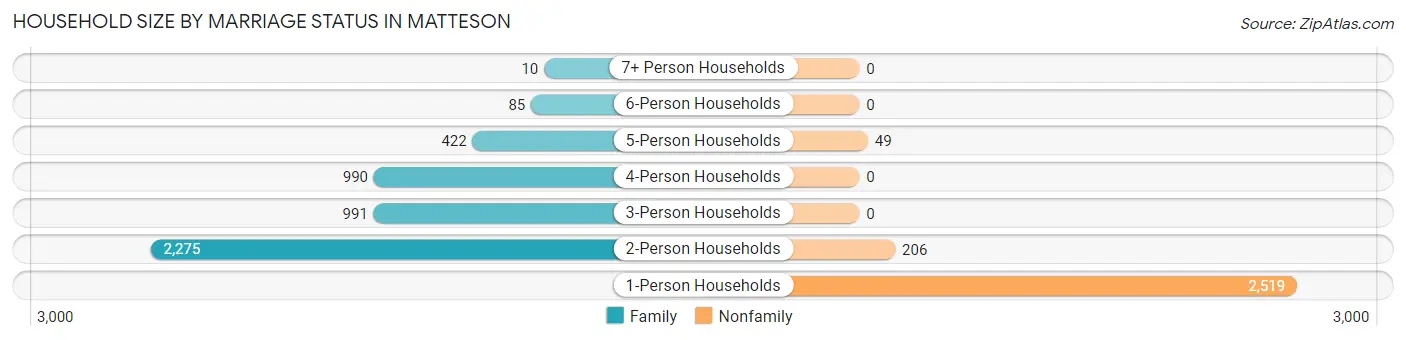
| Household Size | Family Households | Nonfamily Households |
| 1-Person Households | - | 2,519 (33.4%) |
| 2-Person Households | 2,275 (30.1%) | 206 (2.7%) |
| 3-Person Households | 991 (13.1%) | 0 (0.0%) |
| 4-Person Households | 990 (13.1%) | 0 (0.0%) |
| 5-Person Households | 422 (5.6%) | 49 (0.6%) |
| 6-Person Households | 85 (1.1%) | 0 (0.0%) |
| 7+ Person Households | 10 (0.1%) | 0 (0.0%) |
| Total | 4,773 (63.2%) | 2,774 (36.8%) |
Female Fertility in Matteson
Fertility by Age in Matteson
Average fertility rate in Matteson is 61.0 births per 1,000 women. Women in the age bracket of 20 to 34 years have the highest fertility rate with 130.0 births per 1,000 women. Women in the age bracket of 20 to 34 years acount for 84.5% of all women with births.
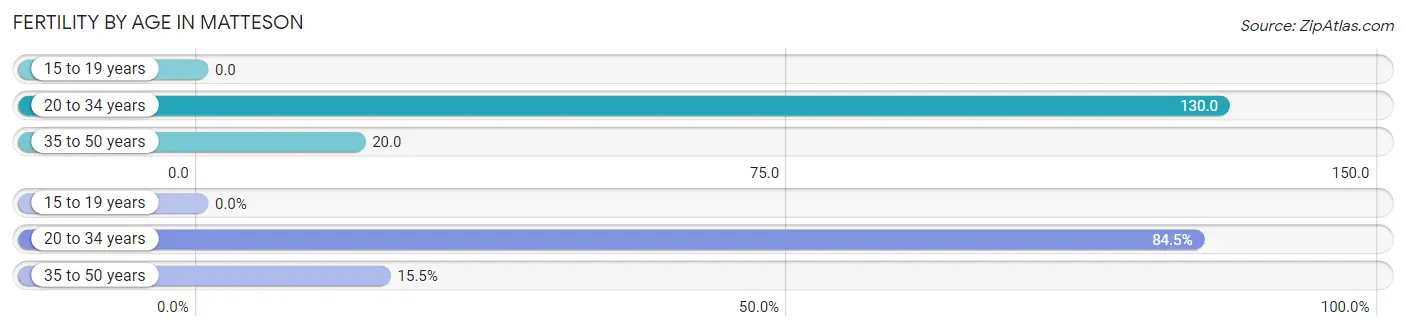
| Age Bracket | Women with Births | Births / 1,000 Women |
| 15 to 19 years | 0 (0.0%) | 0.0 |
| 20 to 34 years | 251 (84.5%) | 130.0 |
| 35 to 50 years | 46 (15.5%) | 20.0 |
| Total | 297 (100.0%) | 61.0 |
Fertility by Age by Marriage Status in Matteson
27.3% of women with births (297) in Matteson are married. The highest percentage of unmarried women with births falls into 20 to 34 years age bracket with 78.1% of them unmarried at the time of birth, while the lowest percentage of unmarried women with births belong to 35 to 50 years age bracket with 43.5% of them unmarried.
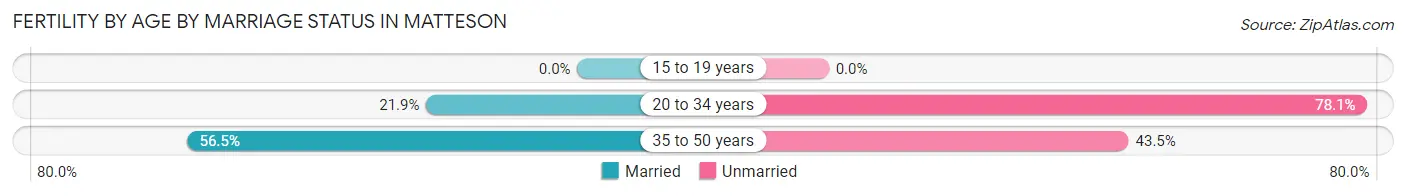
| Age Bracket | Married | Unmarried |
| 15 to 19 years | 0 (0.0%) | 0 (0.0%) |
| 20 to 34 years | 55 (21.9%) | 196 (78.1%) |
| 35 to 50 years | 26 (56.5%) | 20 (43.5%) |
| Total | 81 (27.3%) | 216 (72.7%) |
Fertility by Education in Matteson
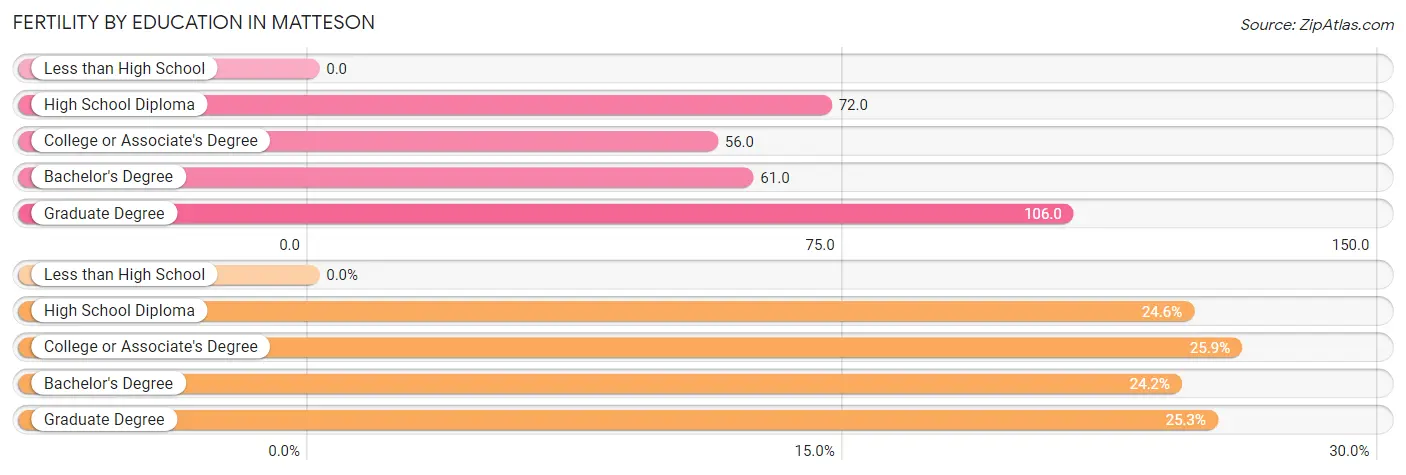
| Educational Attainment | Women with Births | Births / 1,000 Women |
| Less than High School | 0 (0.0%) | 0.0 |
| High School Diploma | 73 (24.6%) | 72.0 |
| College or Associate's Degree | 77 (25.9%) | 56.0 |
| Bachelor's Degree | 72 (24.2%) | 61.0 |
| Graduate Degree | 75 (25.3%) | 106.0 |
| Total | 297 (100.0%) | 61.0 |
Fertility by Education by Marriage Status in Matteson
72.7% of women with births in Matteson are unmarried. Women with the educational attainment of graduate degree are most likely to be married with 73.3% of them married at childbirth, while women with the educational attainment of high school diploma are least likely to be married with 100.0% of them unmarried at childbirth.
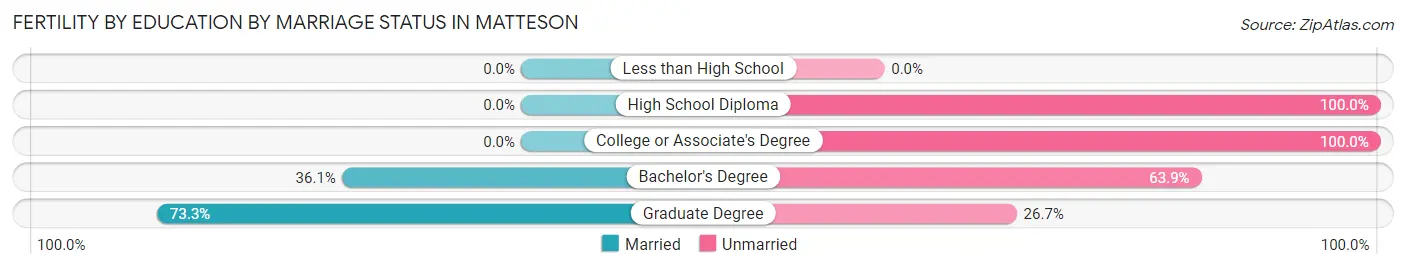
| Educational Attainment | Married | Unmarried |
| Less than High School | 0 (0.0%) | 0 (0.0%) |
| High School Diploma | 0 (0.0%) | 73 (100.0%) |
| College or Associate's Degree | 0 (0.0%) | 77 (100.0%) |
| Bachelor's Degree | 26 (36.1%) | 46 (63.9%) |
| Graduate Degree | 55 (73.3%) | 20 (26.7%) |
| Total | 81 (27.3%) | 216 (72.7%) |
Employment Characteristics in Matteson
Employment by Class of Employer in Matteson
Among the 8,665 employed individuals in Matteson, private company employees (4,752 | 54.8%), local government employees (1,358 | 15.7%), and not-for-profit organizations (972 | 11.2%) make up the most common classes of employment.
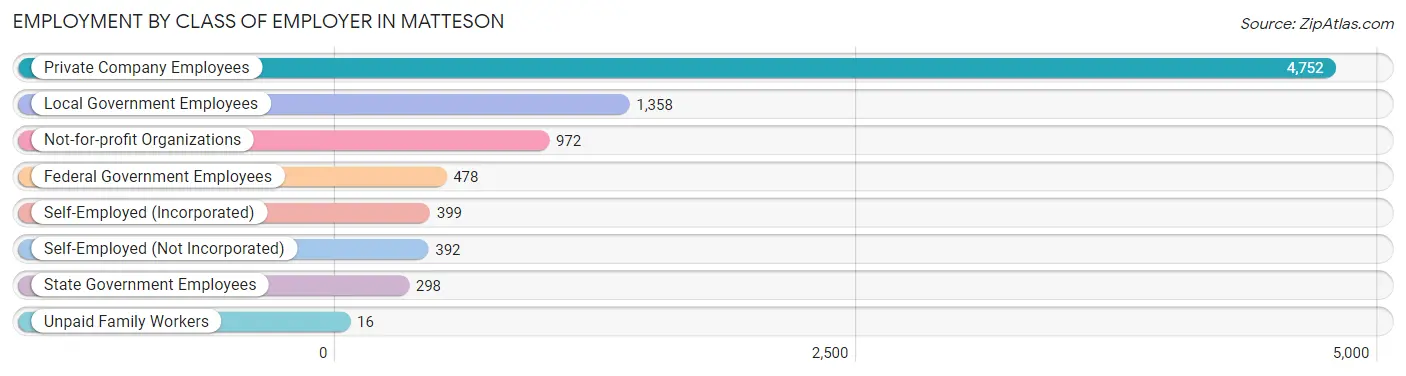
| Employer Class | # Employees | % Employees |
| Private Company Employees | 4,752 | 54.8% |
| Self-Employed (Incorporated) | 399 | 4.6% |
| Self-Employed (Not Incorporated) | 392 | 4.5% |
| Not-for-profit Organizations | 972 | 11.2% |
| Local Government Employees | 1,358 | 15.7% |
| State Government Employees | 298 | 3.4% |
| Federal Government Employees | 478 | 5.5% |
| Unpaid Family Workers | 16 | 0.2% |
| Total | 8,665 | 100.0% |
Employment Status by Age in Matteson
According to the labor force statistics for Matteson, out of the total population over 16 years of age (15,372), 66.0% or 10,146 individuals are in the labor force, with 12.5% or 1,268 of them unemployed. The age group with the highest labor force participation rate is 45 to 54 years, with 93.4% or 2,592 individuals in the labor force. Within the labor force, the 16 to 19 years age range has the highest percentage of unemployed individuals, with 34.3% or 62 of them being unemployed.
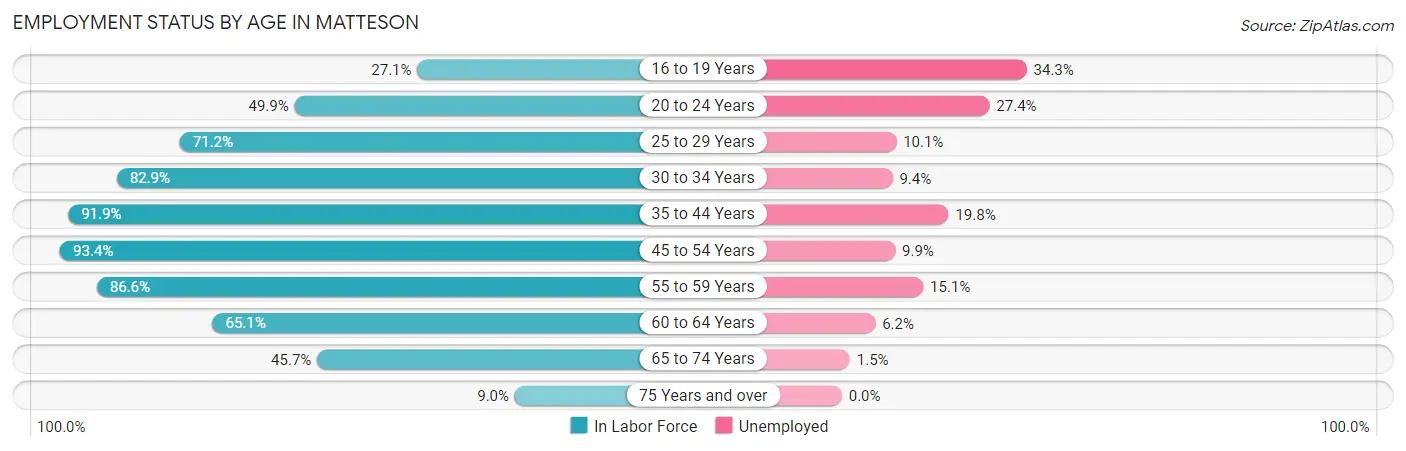
| Age Bracket | In Labor Force | Unemployed |
| 16 to 19 Years | 181 (27.1%) | 62 (34.3%) |
| 20 to 24 Years | 664 (49.9%) | 182 (27.4%) |
| 25 to 29 Years | 978 (71.2%) | 99 (10.1%) |
| 30 to 34 Years | 651 (82.9%) | 61 (9.4%) |
| 35 to 44 Years | 1,850 (91.9%) | 366 (19.8%) |
| 45 to 54 Years | 2,592 (93.4%) | 257 (9.9%) |
| 55 to 59 Years | 1,063 (86.6%) | 161 (15.1%) |
| 60 to 64 Years | 1,027 (65.1%) | 64 (6.2%) |
| 65 to 74 Years | 1,022 (45.7%) | 15 (1.5%) |
| 75 Years and over | 125 (9.0%) | 0 (0.0%) |
| Total | 10,146 (66.0%) | 1,268 (12.5%) |
Employment Status by Educational Attainment in Matteson
According to labor force statistics for Matteson, 83.7% of individuals (8,162) out of the total population between 25 and 64 years of age (9,752) are in the labor force, with 12.4% or 1,012 of them being unemployed. The group with the highest labor force participation rate are those with the educational attainment of bachelor's degree or higher, with 91.5% or 3,916 individuals in the labor force. Within the labor force, individuals with college / associate degree education have the highest percentage of unemployment, with 18.2% or 456 of them being unemployed.
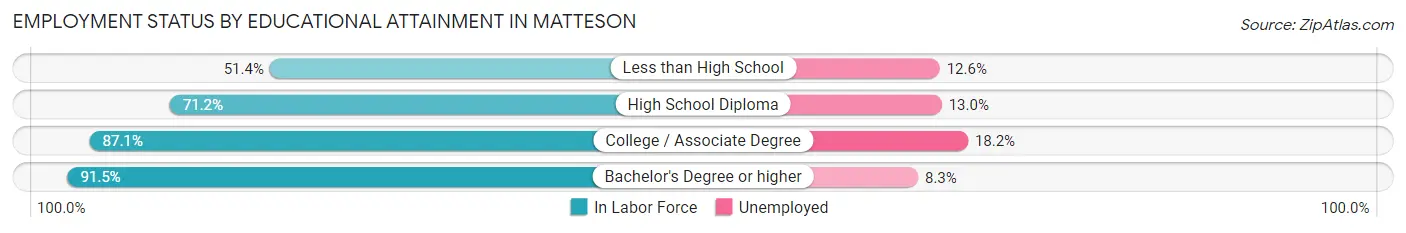
| Educational Attainment | In Labor Force | Unemployed |
| Less than High School | 294 (51.4%) | 72 (12.6%) |
| High School Diploma | 1,440 (71.2%) | 263 (13.0%) |
| College / Associate Degree | 2,506 (87.1%) | 524 (18.2%) |
| Bachelor's Degree or higher | 3,916 (91.5%) | 355 (8.3%) |
| Total | 8,162 (83.7%) | 1,209 (12.4%) |
Employment Occupations by Sex in Matteson
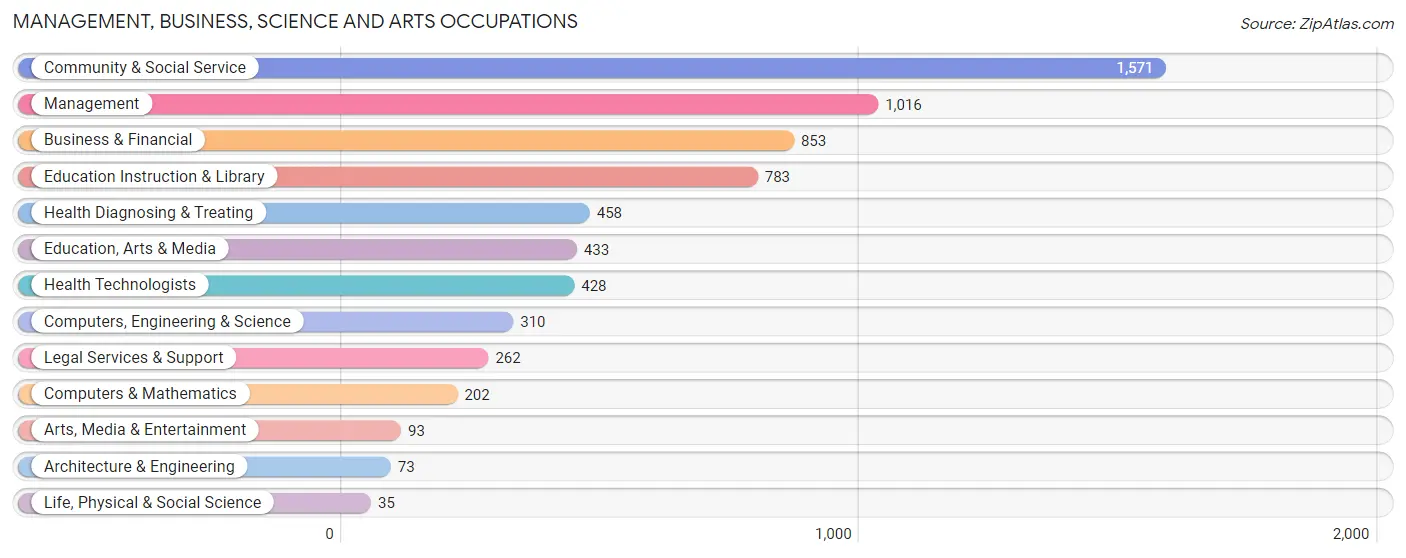
Management, Business, Science and Arts Occupations
The most common Management, Business, Science and Arts occupations in Matteson are Community & Social Service (1,571 | 17.7%), Management (1,016 | 11.4%), Business & Financial (853 | 9.6%), Education Instruction & Library (783 | 8.8%), and Health Diagnosing & Treating (458 | 5.1%).
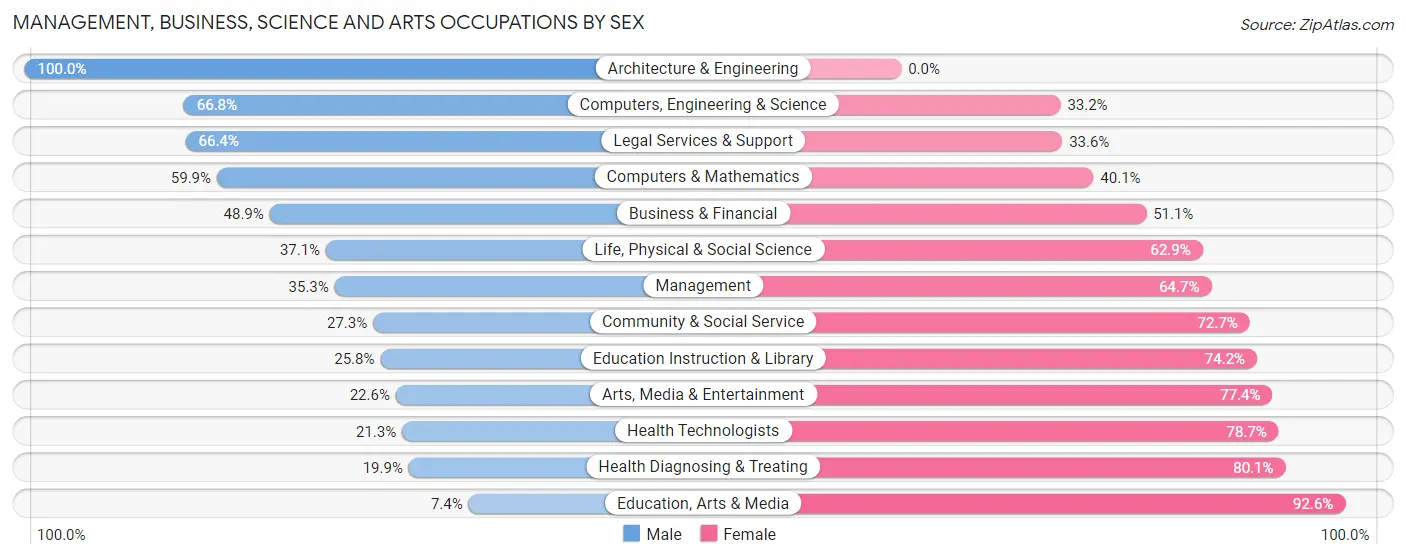
Management, Business, Science and Arts Occupations by Sex
Within the Management, Business, Science and Arts occupations in Matteson, the most male-oriented occupations are Architecture & Engineering (100.0%), Computers, Engineering & Science (66.8%), and Legal Services & Support (66.4%), while the most female-oriented occupations are Education, Arts & Media (92.6%), Health Diagnosing & Treating (80.1%), and Health Technologists (78.7%).
| Occupation | Male | Female |
| Management | 359 (35.3%) | 657 (64.7%) |
| Business & Financial | 417 (48.9%) | 436 (51.1%) |
| Computers, Engineering & Science | 207 (66.8%) | 103 (33.2%) |
| Computers & Mathematics | 121 (59.9%) | 81 (40.1%) |
| Architecture & Engineering | 73 (100.0%) | 0 (0.0%) |
| Life, Physical & Social Science | 13 (37.1%) | 22 (62.9%) |
| Community & Social Service | 429 (27.3%) | 1,142 (72.7%) |
| Education, Arts & Media | 32 (7.4%) | 401 (92.6%) |
| Legal Services & Support | 174 (66.4%) | 88 (33.6%) |
| Education Instruction & Library | 202 (25.8%) | 581 (74.2%) |
| Arts, Media & Entertainment | 21 (22.6%) | 72 (77.4%) |
| Health Diagnosing & Treating | 91 (19.9%) | 367 (80.1%) |
| Health Technologists | 91 (21.3%) | 337 (78.7%) |
| Total (Category) | 1,503 (35.7%) | 2,705 (64.3%) |
| Total (Overall) | 3,823 (43.0%) | 5,062 (57.0%) |
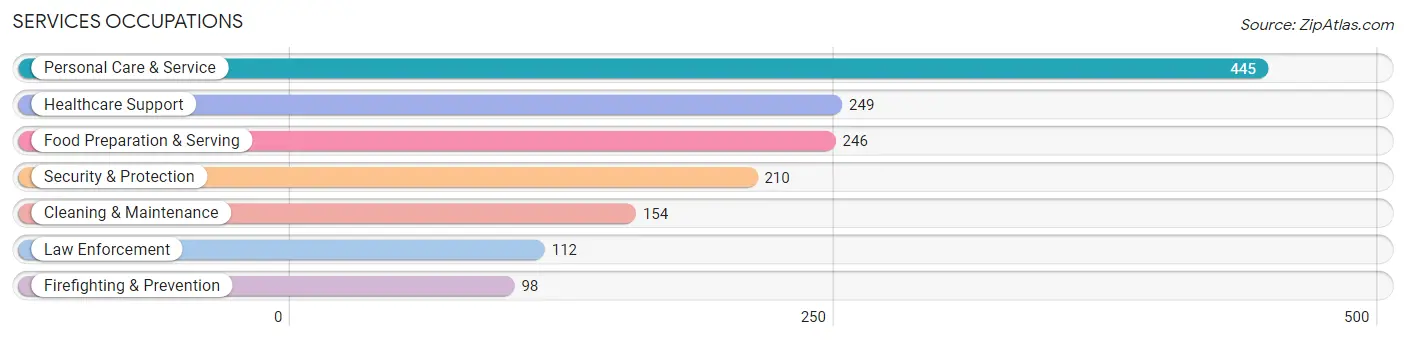
Services Occupations
The most common Services occupations in Matteson are Personal Care & Service (445 | 5.0%), Healthcare Support (249 | 2.8%), Food Preparation & Serving (246 | 2.8%), Security & Protection (210 | 2.4%), and Cleaning & Maintenance (154 | 1.7%).
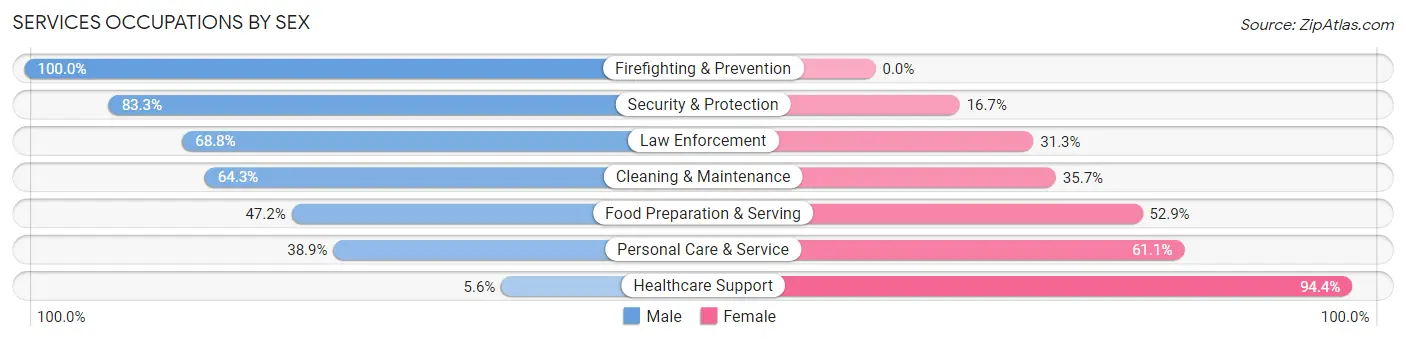
Services Occupations by Sex
Within the Services occupations in Matteson, the most male-oriented occupations are Firefighting & Prevention (100.0%), Security & Protection (83.3%), and Law Enforcement (68.8%), while the most female-oriented occupations are Healthcare Support (94.4%), Personal Care & Service (61.1%), and Food Preparation & Serving (52.8%).
| Occupation | Male | Female |
| Healthcare Support | 14 (5.6%) | 235 (94.4%) |
| Security & Protection | 175 (83.3%) | 35 (16.7%) |
| Firefighting & Prevention | 98 (100.0%) | 0 (0.0%) |
| Law Enforcement | 77 (68.8%) | 35 (31.2%) |
| Food Preparation & Serving | 116 (47.1%) | 130 (52.8%) |
| Cleaning & Maintenance | 99 (64.3%) | 55 (35.7%) |
| Personal Care & Service | 173 (38.9%) | 272 (61.1%) |
| Total (Category) | 577 (44.3%) | 727 (55.7%) |
| Total (Overall) | 3,823 (43.0%) | 5,062 (57.0%) |
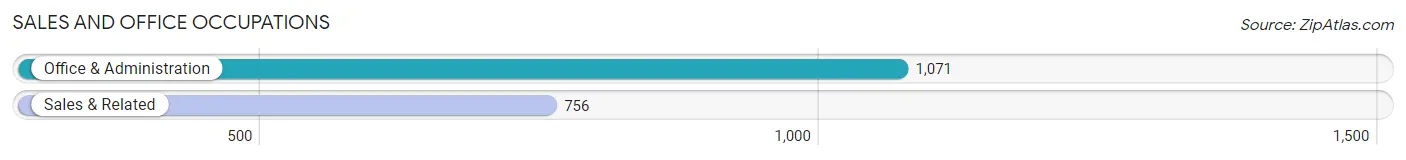
Sales and Office Occupations
The most common Sales and Office occupations in Matteson are Office & Administration (1,071 | 12.0%), and Sales & Related (756 | 8.5%).
Sales and Office Occupations by Sex
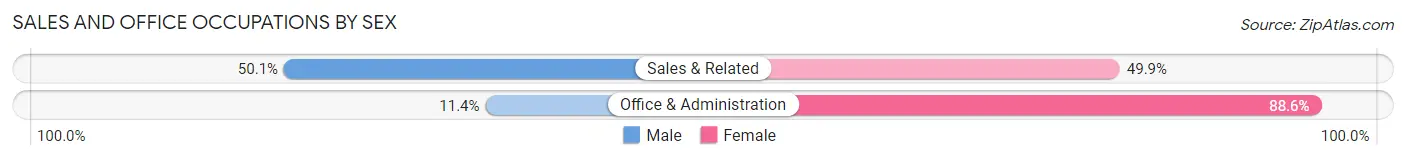
| Occupation | Male | Female |
| Sales & Related | 379 (50.1%) | 377 (49.9%) |
| Office & Administration | 122 (11.4%) | 949 (88.6%) |
| Total (Category) | 501 (27.4%) | 1,326 (72.6%) |
| Total (Overall) | 3,823 (43.0%) | 5,062 (57.0%) |
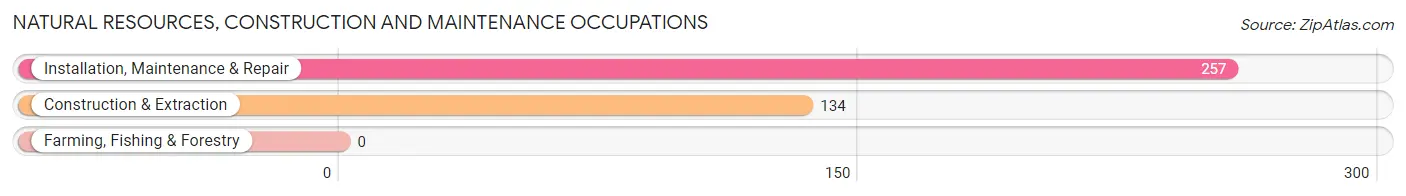
Natural Resources, Construction and Maintenance Occupations
The most common Natural Resources, Construction and Maintenance occupations in Matteson are Installation, Maintenance & Repair (257 | 2.9%), and Construction & Extraction (134 | 1.5%).
Natural Resources, Construction and Maintenance Occupations by Sex
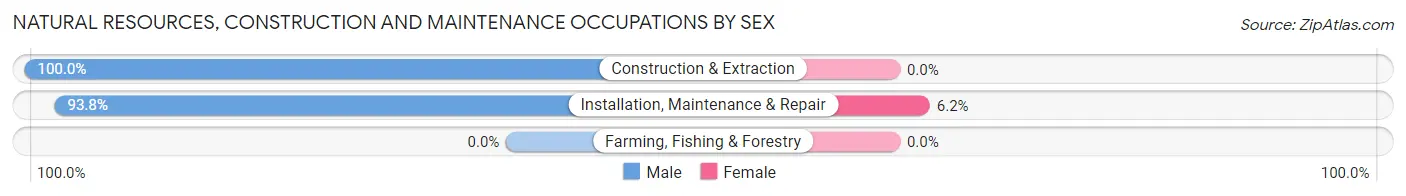
| Occupation | Male | Female |
| Farming, Fishing & Forestry | 0 (0.0%) | 0 (0.0%) |
| Construction & Extraction | 134 (100.0%) | 0 (0.0%) |
| Installation, Maintenance & Repair | 241 (93.8%) | 16 (6.2%) |
| Total (Category) | 375 (95.9%) | 16 (4.1%) |
| Total (Overall) | 3,823 (43.0%) | 5,062 (57.0%) |
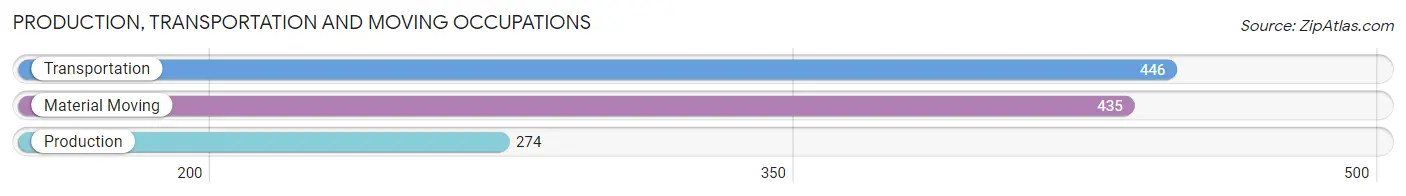
Production, Transportation and Moving Occupations
The most common Production, Transportation and Moving occupations in Matteson are Transportation (446 | 5.0%), Material Moving (435 | 4.9%), and Production (274 | 3.1%).
Production, Transportation and Moving Occupations by Sex
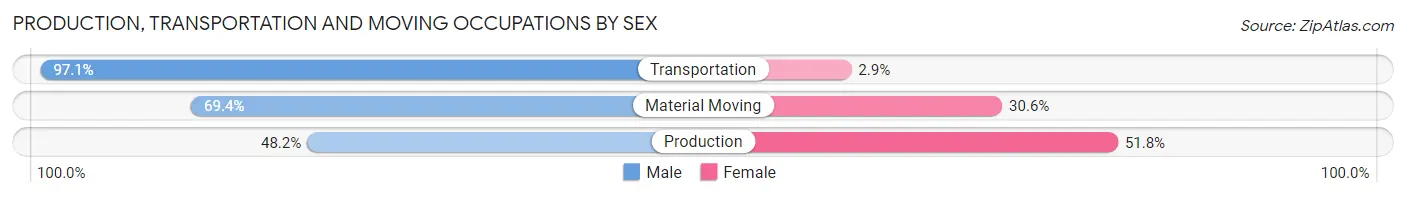
| Occupation | Male | Female |
| Production | 132 (48.2%) | 142 (51.8%) |
| Transportation | 433 (97.1%) | 13 (2.9%) |
| Material Moving | 302 (69.4%) | 133 (30.6%) |
| Total (Category) | 867 (75.1%) | 288 (24.9%) |
| Total (Overall) | 3,823 (43.0%) | 5,062 (57.0%) |
Employment Industries by Sex in Matteson
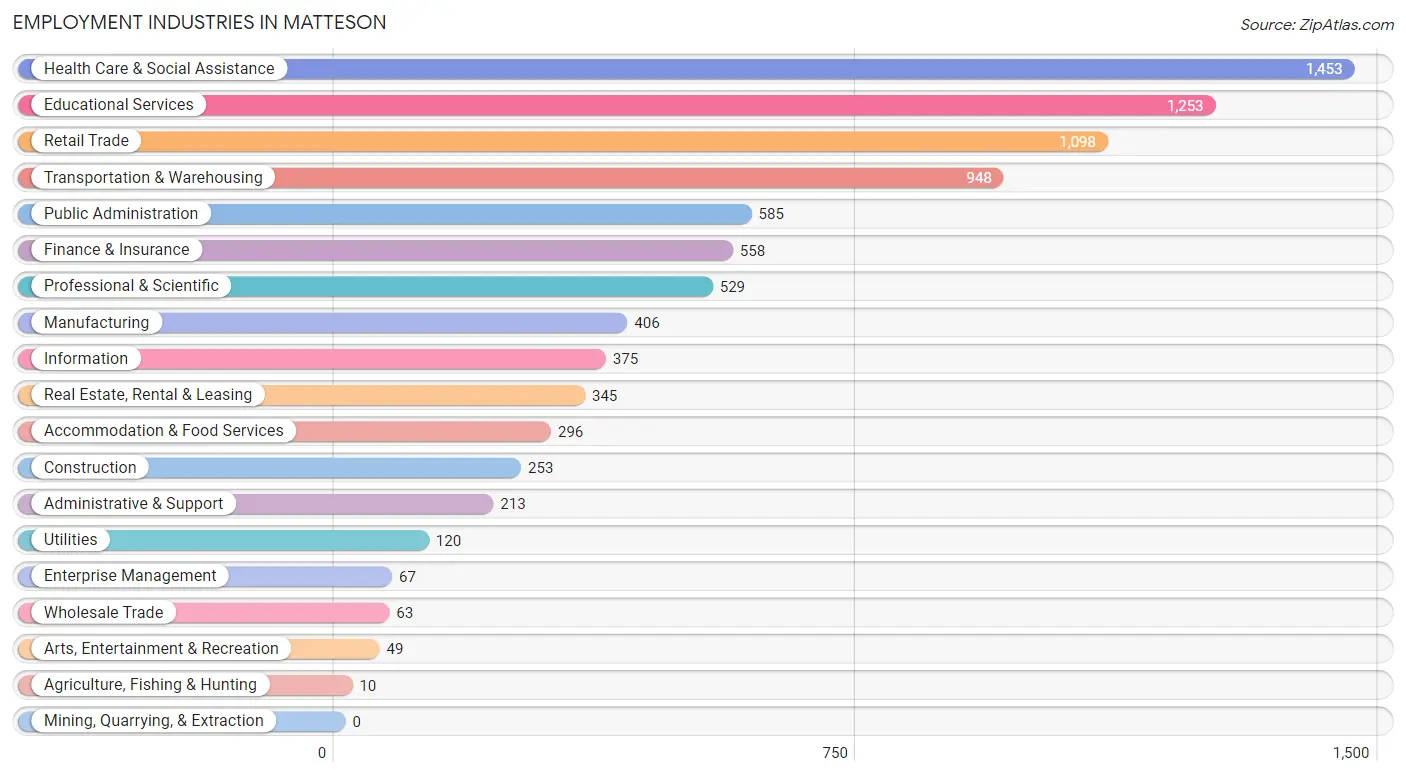
Employment Industries in Matteson
The major employment industries in Matteson include Health Care & Social Assistance (1,453 | 16.4%), Educational Services (1,253 | 14.1%), Retail Trade (1,098 | 12.4%), Transportation & Warehousing (948 | 10.7%), and Public Administration (585 | 6.6%).
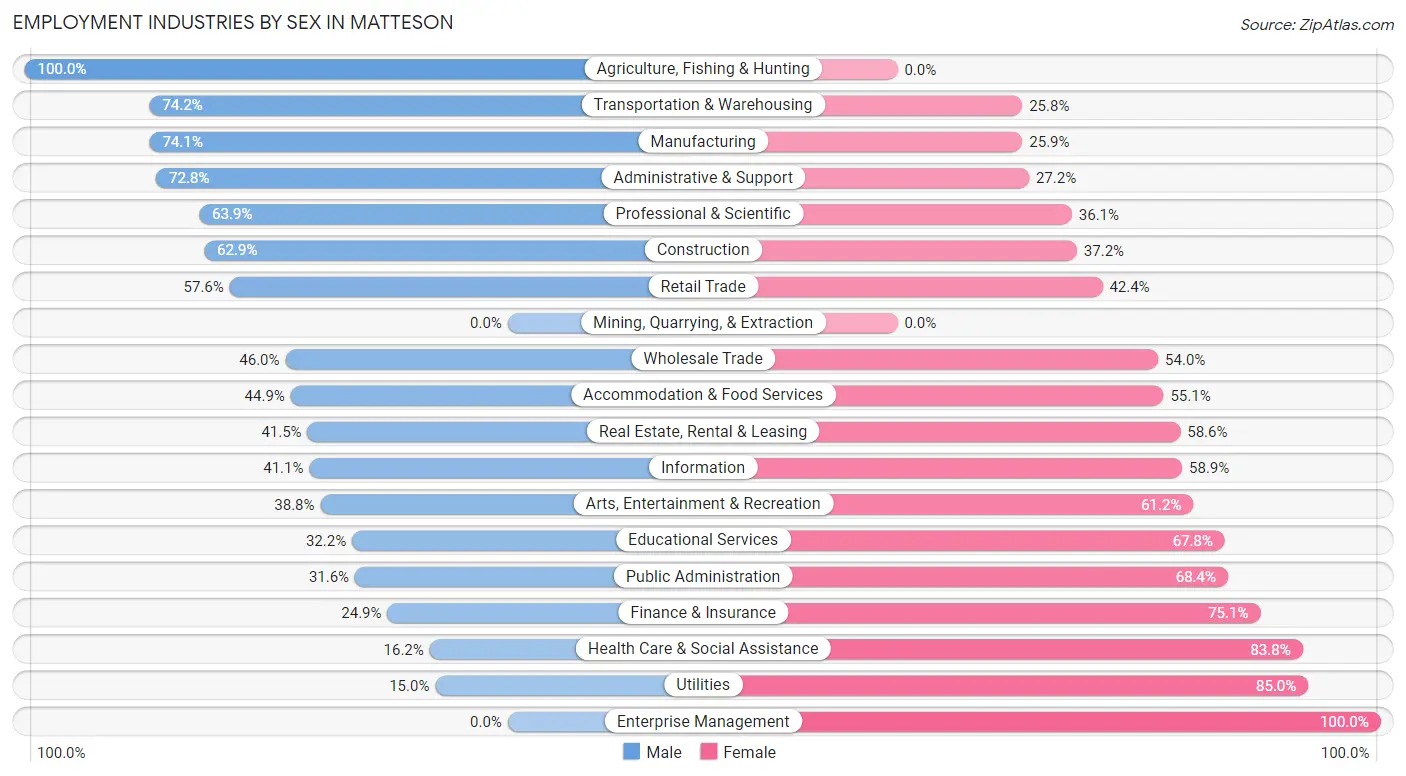
Employment Industries by Sex in Matteson
The Matteson industries that see more men than women are Agriculture, Fishing & Hunting (100.0%), Transportation & Warehousing (74.2%), and Manufacturing (74.1%), whereas the industries that tend to have a higher number of women are Enterprise Management (100.0%), Utilities (85.0%), and Health Care & Social Assistance (83.8%).
| Industry | Male | Female |
| Agriculture, Fishing & Hunting | 10 (100.0%) | 0 (0.0%) |
| Mining, Quarrying, & Extraction | 0 (0.0%) | 0 (0.0%) |
| Construction | 159 (62.8%) | 94 (37.1%) |
| Manufacturing | 301 (74.1%) | 105 (25.9%) |
| Wholesale Trade | 29 (46.0%) | 34 (54.0%) |
| Retail Trade | 632 (57.6%) | 466 (42.4%) |
| Transportation & Warehousing | 703 (74.2%) | 245 (25.8%) |
| Utilities | 18 (15.0%) | 102 (85.0%) |
| Information | 154 (41.1%) | 221 (58.9%) |
| Finance & Insurance | 139 (24.9%) | 419 (75.1%) |
| Real Estate, Rental & Leasing | 143 (41.4%) | 202 (58.6%) |
| Professional & Scientific | 338 (63.9%) | 191 (36.1%) |
| Enterprise Management | 0 (0.0%) | 67 (100.0%) |
| Administrative & Support | 155 (72.8%) | 58 (27.2%) |
| Educational Services | 404 (32.2%) | 849 (67.8%) |
| Health Care & Social Assistance | 235 (16.2%) | 1,218 (83.8%) |
| Arts, Entertainment & Recreation | 19 (38.8%) | 30 (61.2%) |
| Accommodation & Food Services | 133 (44.9%) | 163 (55.1%) |
| Public Administration | 185 (31.6%) | 400 (68.4%) |
| Total | 3,823 (43.0%) | 5,062 (57.0%) |
Education in Matteson
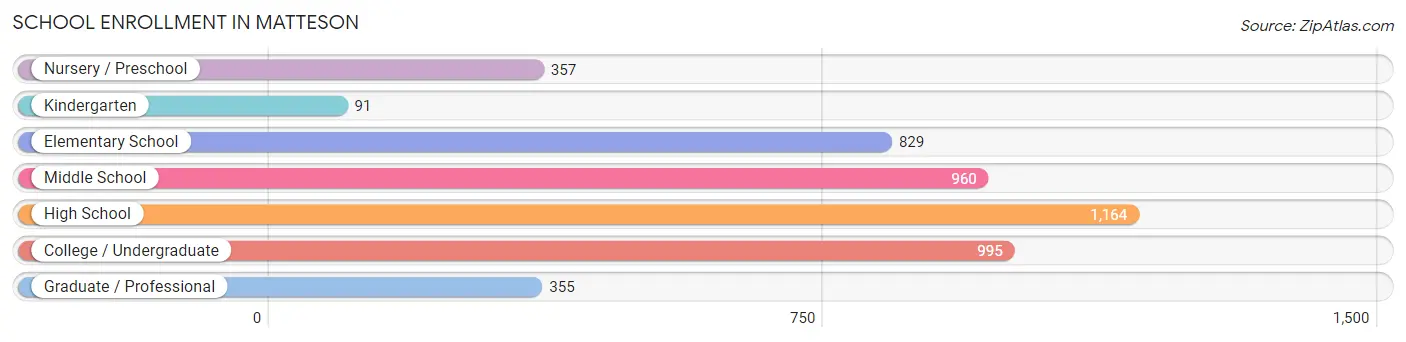
School Enrollment in Matteson
The most common levels of schooling among the 4,751 students in Matteson are high school (1,164 | 24.5%), college / undergraduate (995 | 20.9%), and middle school (960 | 20.2%).
| School Level | # Students | % Students |
| Nursery / Preschool | 357 | 7.5% |
| Kindergarten | 91 | 1.9% |
| Elementary School | 829 | 17.4% |
| Middle School | 960 | 20.2% |
| High School | 1,164 | 24.5% |
| College / Undergraduate | 995 | 20.9% |
| Graduate / Professional | 355 | 7.5% |
| Total | 4,751 | 100.0% |
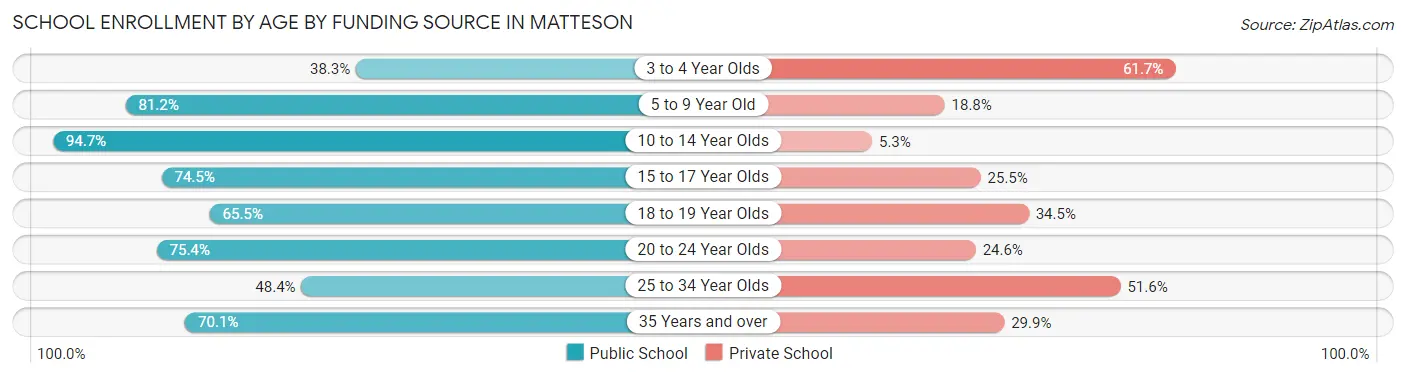
School Enrollment by Age by Funding Source in Matteson
Out of a total of 4,751 students who are enrolled in schools in Matteson, 1,102 (23.2%) attend a private institution, while the remaining 3,649 (76.8%) are enrolled in public schools. The age group of 3 to 4 year olds has the highest likelihood of being enrolled in private schools, with 184 (61.7% in the age bracket) enrolled. Conversely, the age group of 10 to 14 year olds has the lowest likelihood of being enrolled in a private school, with 1,363 (94.7% in the age bracket) attending a public institution.
| Age Bracket | Public School | Private School |
| 3 to 4 Year Olds | 114 (38.3%) | 184 (61.7%) |
| 5 to 9 Year Old | 557 (81.2%) | 129 (18.8%) |
| 10 to 14 Year Olds | 1,363 (94.7%) | 76 (5.3%) |
| 15 to 17 Year Olds | 587 (74.5%) | 201 (25.5%) |
| 18 to 19 Year Olds | 192 (65.5%) | 101 (34.5%) |
| 20 to 24 Year Olds | 457 (75.4%) | 149 (24.6%) |
| 25 to 34 Year Olds | 155 (48.4%) | 165 (51.6%) |
| 35 Years and over | 225 (70.1%) | 96 (29.9%) |
| Total | 3,649 (76.8%) | 1,102 (23.2%) |
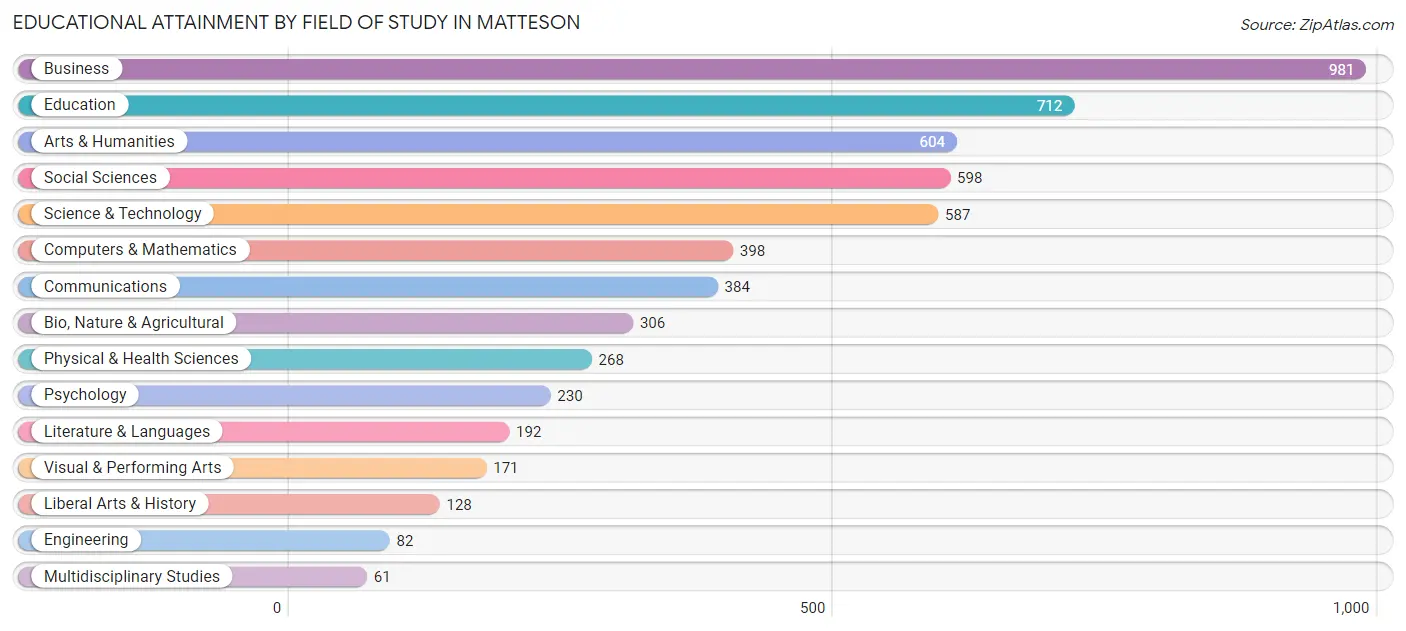
Educational Attainment by Field of Study in Matteson
Business (981 | 17.2%), education (712 | 12.5%), arts & humanities (604 | 10.6%), social sciences (598 | 10.5%), and science & technology (587 | 10.3%) are the most common fields of study among 5,702 individuals in Matteson who have obtained a bachelor's degree or higher.
| Field of Study | # Graduates | % Graduates |
| Computers & Mathematics | 398 | 7.0% |
| Bio, Nature & Agricultural | 306 | 5.4% |
| Physical & Health Sciences | 268 | 4.7% |
| Psychology | 230 | 4.0% |
| Social Sciences | 598 | 10.5% |
| Engineering | 82 | 1.4% |
| Multidisciplinary Studies | 61 | 1.1% |
| Science & Technology | 587 | 10.3% |
| Business | 981 | 17.2% |
| Education | 712 | 12.5% |
| Literature & Languages | 192 | 3.4% |
| Liberal Arts & History | 128 | 2.2% |
| Visual & Performing Arts | 171 | 3.0% |
| Communications | 384 | 6.7% |
| Arts & Humanities | 604 | 10.6% |
| Total | 5,702 | 100.0% |
Transportation & Commute in Matteson
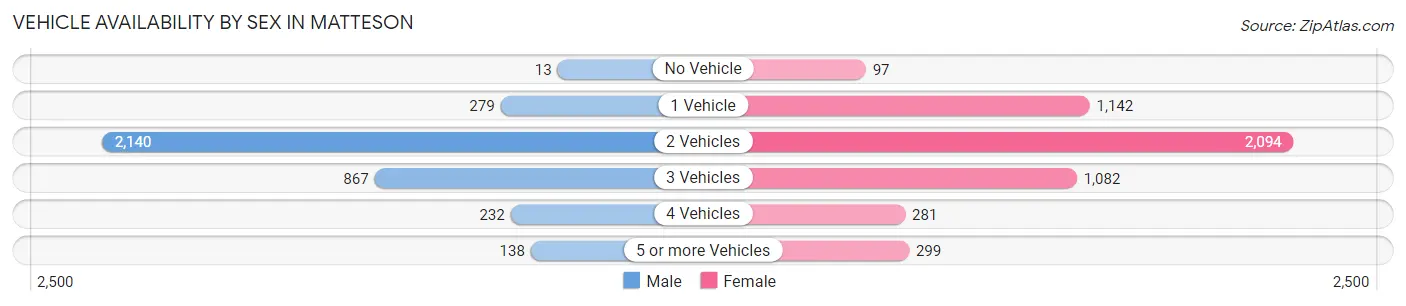
Vehicle Availability by Sex in Matteson
The most prevalent vehicle ownership categories in Matteson are males with 2 vehicles (2,140, accounting for 58.3%) and females with 2 vehicles (2,094, making up 42.8%).
| Vehicles Available | Male | Female |
| No Vehicle | 13 (0.4%) | 97 (1.9%) |
| 1 Vehicle | 279 (7.6%) | 1,142 (22.9%) |
| 2 Vehicles | 2,140 (58.3%) | 2,094 (41.9%) |
| 3 Vehicles | 867 (23.6%) | 1,082 (21.7%) |
| 4 Vehicles | 232 (6.3%) | 281 (5.6%) |
| 5 or more Vehicles | 138 (3.8%) | 299 (6.0%) |
| Total | 3,669 (100.0%) | 4,995 (100.0%) |
Commute Time in Matteson
The most frequently occuring commute durations in Matteson are 60 to 89 minutes (1,622 commuters, 22.1%), 30 to 34 minutes (1,260 commuters, 17.2%), and 45 to 59 minutes (849 commuters, 11.6%).
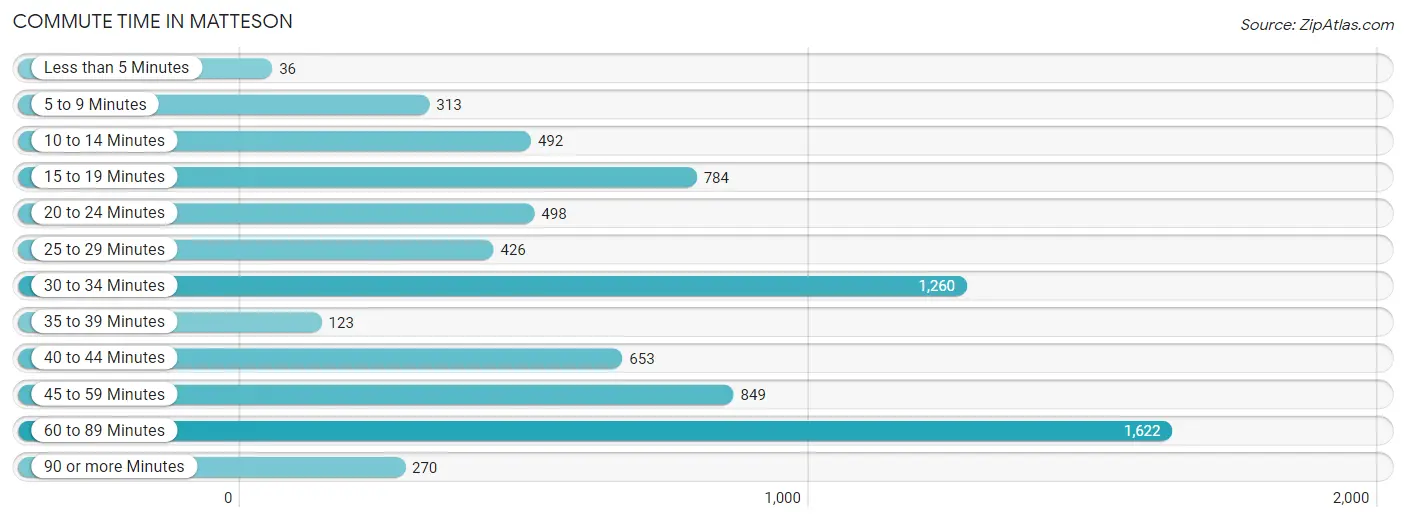
| Commute Time | # Commuters | % Commuters |
| Less than 5 Minutes | 36 | 0.5% |
| 5 to 9 Minutes | 313 | 4.3% |
| 10 to 14 Minutes | 492 | 6.7% |
| 15 to 19 Minutes | 784 | 10.7% |
| 20 to 24 Minutes | 498 | 6.8% |
| 25 to 29 Minutes | 426 | 5.8% |
| 30 to 34 Minutes | 1,260 | 17.2% |
| 35 to 39 Minutes | 123 | 1.7% |
| 40 to 44 Minutes | 653 | 8.9% |
| 45 to 59 Minutes | 849 | 11.6% |
| 60 to 89 Minutes | 1,622 | 22.1% |
| 90 or more Minutes | 270 | 3.7% |
Commute Time by Sex in Matteson
The most common commute times in Matteson are 60 to 89 minutes (718 commuters, 22.6%) for males and 60 to 89 minutes (904 commuters, 21.8%) for females.
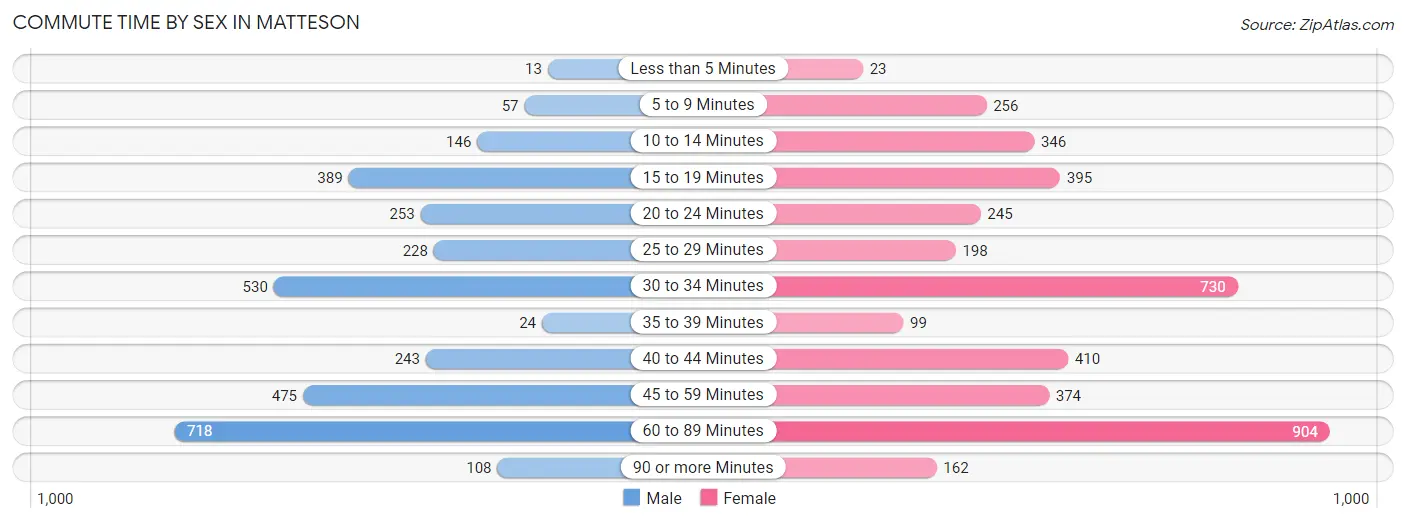
| Commute Time | Male | Female |
| Less than 5 Minutes | 13 (0.4%) | 23 (0.6%) |
| 5 to 9 Minutes | 57 (1.8%) | 256 (6.2%) |
| 10 to 14 Minutes | 146 (4.6%) | 346 (8.4%) |
| 15 to 19 Minutes | 389 (12.2%) | 395 (9.5%) |
| 20 to 24 Minutes | 253 (8.0%) | 245 (5.9%) |
| 25 to 29 Minutes | 228 (7.2%) | 198 (4.8%) |
| 30 to 34 Minutes | 530 (16.7%) | 730 (17.6%) |
| 35 to 39 Minutes | 24 (0.7%) | 99 (2.4%) |
| 40 to 44 Minutes | 243 (7.6%) | 410 (9.9%) |
| 45 to 59 Minutes | 475 (14.9%) | 374 (9.0%) |
| 60 to 89 Minutes | 718 (22.6%) | 904 (21.8%) |
| 90 or more Minutes | 108 (3.4%) | 162 (3.9%) |
Time of Departure to Work by Sex in Matteson
The most frequent times of departure to work in Matteson are 7:00 AM to 7:29 AM (680, 21.4%) for males and 7:30 AM to 7:59 AM (668, 16.1%) for females.
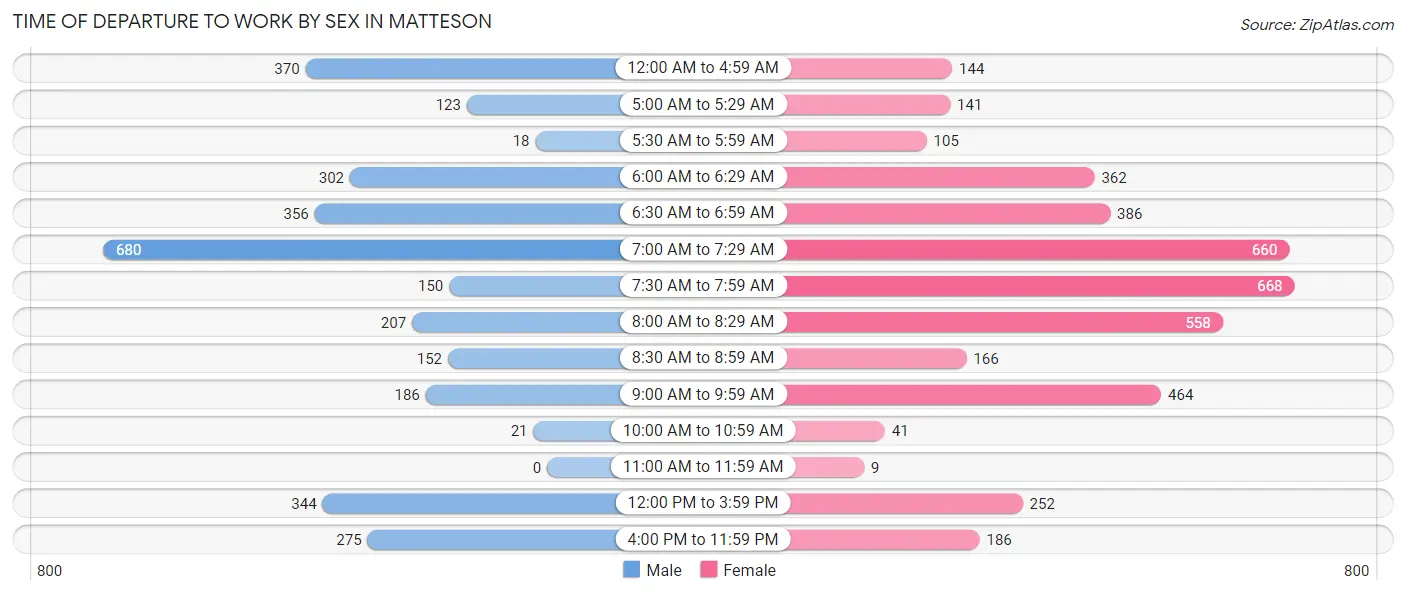
| Time of Departure | Male | Female |
| 12:00 AM to 4:59 AM | 370 (11.6%) | 144 (3.5%) |
| 5:00 AM to 5:29 AM | 123 (3.9%) | 141 (3.4%) |
| 5:30 AM to 5:59 AM | 18 (0.6%) | 105 (2.5%) |
| 6:00 AM to 6:29 AM | 302 (9.5%) | 362 (8.7%) |
| 6:30 AM to 6:59 AM | 356 (11.2%) | 386 (9.3%) |
| 7:00 AM to 7:29 AM | 680 (21.4%) | 660 (15.9%) |
| 7:30 AM to 7:59 AM | 150 (4.7%) | 668 (16.1%) |
| 8:00 AM to 8:29 AM | 207 (6.5%) | 558 (13.5%) |
| 8:30 AM to 8:59 AM | 152 (4.8%) | 166 (4.0%) |
| 9:00 AM to 9:59 AM | 186 (5.8%) | 464 (11.2%) |
| 10:00 AM to 10:59 AM | 21 (0.7%) | 41 (1.0%) |
| 11:00 AM to 11:59 AM | 0 (0.0%) | 9 (0.2%) |
| 12:00 PM to 3:59 PM | 344 (10.8%) | 252 (6.1%) |
| 4:00 PM to 11:59 PM | 275 (8.6%) | 186 (4.5%) |
| Total | 3,184 (100.0%) | 4,142 (100.0%) |
Housing Occupancy in Matteson
Occupancy by Ownership in Matteson
Of the total 7,547 dwellings in Matteson, owner-occupied units account for 5,754 (76.2%), while renter-occupied units make up 1,793 (23.8%).
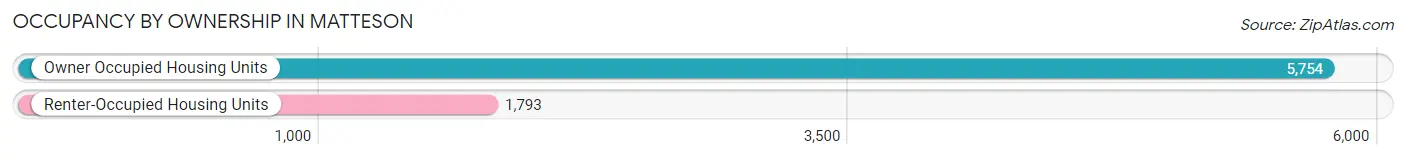
| Occupancy | # Housing Units | % Housing Units |
| Owner Occupied Housing Units | 5,754 | 76.2% |
| Renter-Occupied Housing Units | 1,793 | 23.8% |
| Total Occupied Housing Units | 7,547 | 100.0% |
Occupancy by Household Size in Matteson
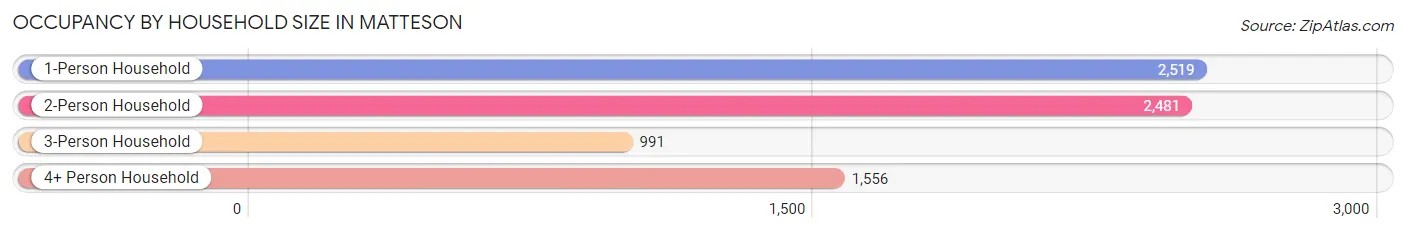
| Household Size | # Housing Units | % Housing Units |
| 1-Person Household | 2,519 | 33.4% |
| 2-Person Household | 2,481 | 32.9% |
| 3-Person Household | 991 | 13.1% |
| 4+ Person Household | 1,556 | 20.6% |
| Total Housing Units | 7,547 | 100.0% |
Occupancy by Ownership by Household Size in Matteson
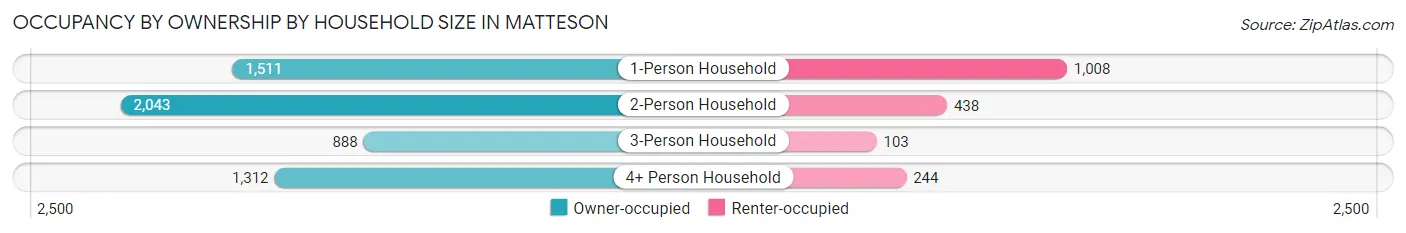
| Household Size | Owner-occupied | Renter-occupied |
| 1-Person Household | 1,511 (60.0%) | 1,008 (40.0%) |
| 2-Person Household | 2,043 (82.4%) | 438 (17.6%) |
| 3-Person Household | 888 (89.6%) | 103 (10.4%) |
| 4+ Person Household | 1,312 (84.3%) | 244 (15.7%) |
| Total Housing Units | 5,754 (76.2%) | 1,793 (23.8%) |
Occupancy by Educational Attainment in Matteson
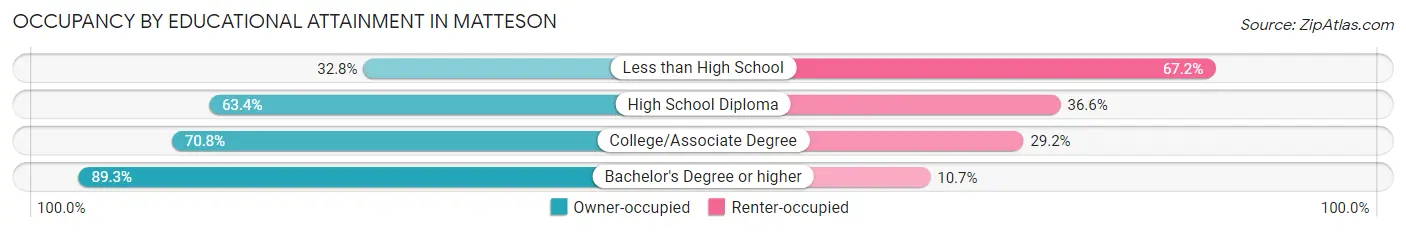
| Household Size | Owner-occupied | Renter-occupied |
| Less than High School | 87 (32.8%) | 178 (67.2%) |
| High School Diploma | 949 (63.4%) | 547 (36.6%) |
| College/Associate Degree | 1,714 (70.8%) | 707 (29.2%) |
| Bachelor's Degree or higher | 3,004 (89.3%) | 361 (10.7%) |
Occupancy by Age of Householder in Matteson
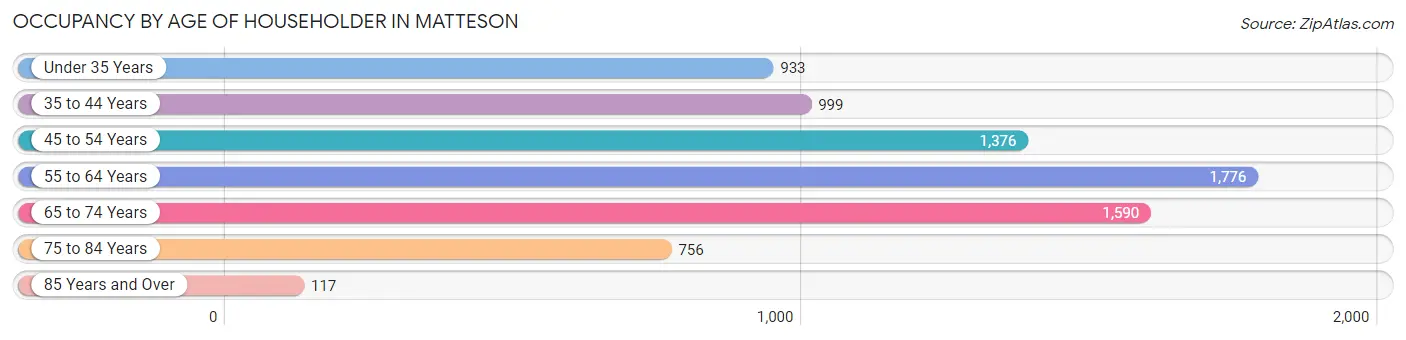
| Age Bracket | # Households | % Households |
| Under 35 Years | 933 | 12.4% |
| 35 to 44 Years | 999 | 13.2% |
| 45 to 54 Years | 1,376 | 18.2% |
| 55 to 64 Years | 1,776 | 23.5% |
| 65 to 74 Years | 1,590 | 21.1% |
| 75 to 84 Years | 756 | 10.0% |
| 85 Years and Over | 117 | 1.5% |
| Total | 7,547 | 100.0% |
Housing Finances in Matteson
Median Income by Occupancy in Matteson
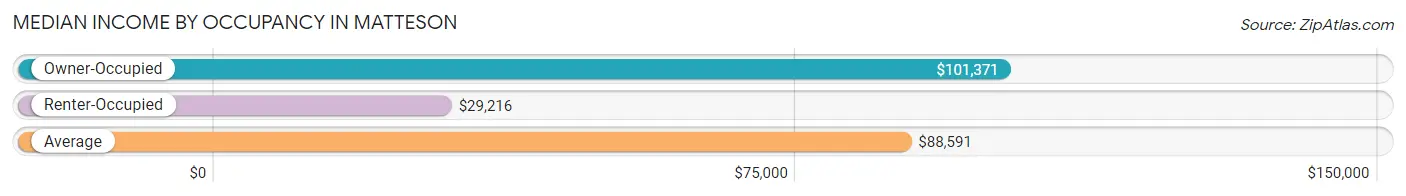
| Occupancy Type | # Households | Median Income |
| Owner-Occupied | 5,754 (76.2%) | $101,371 |
| Renter-Occupied | 1,793 (23.8%) | $29,216 |
| Average | 7,547 (100.0%) | $88,591 |
Occupancy by Householder Income Bracket in Matteson
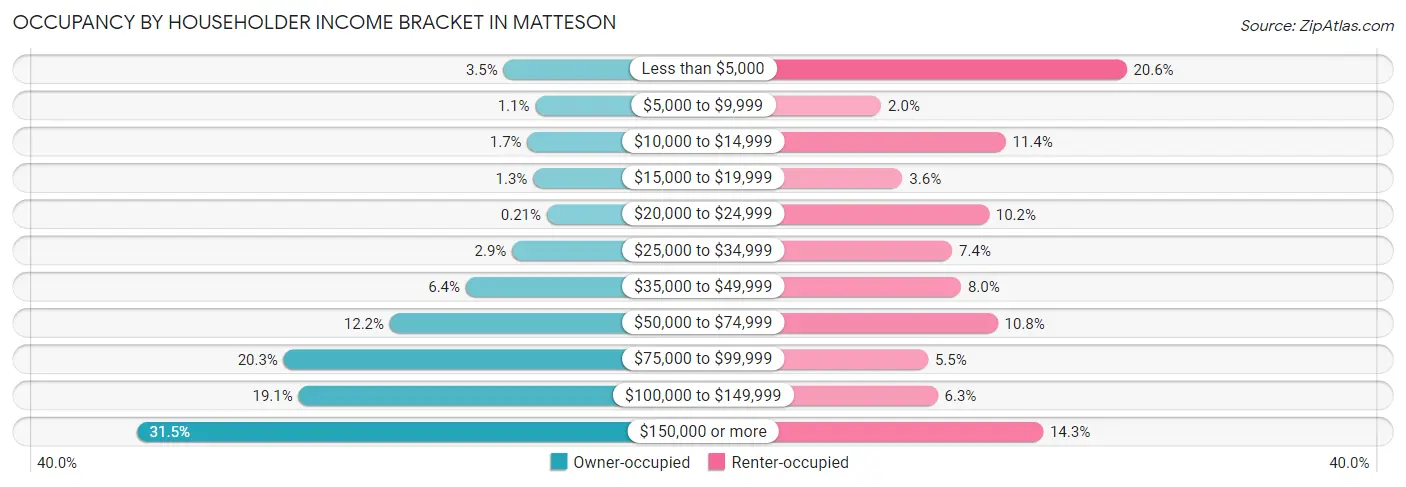
| Income Bracket | Owner-occupied | Renter-occupied |
| Less than $5,000 | 202 (3.5%) | 370 (20.6%) |
| $5,000 to $9,999 | 63 (1.1%) | 35 (1.9%) |
| $10,000 to $14,999 | 97 (1.7%) | 205 (11.4%) |
| $15,000 to $19,999 | 72 (1.3%) | 64 (3.6%) |
| $20,000 to $24,999 | 12 (0.2%) | 182 (10.2%) |
| $25,000 to $34,999 | 164 (2.9%) | 132 (7.4%) |
| $35,000 to $49,999 | 367 (6.4%) | 144 (8.0%) |
| $50,000 to $74,999 | 700 (12.2%) | 194 (10.8%) |
| $75,000 to $99,999 | 1,166 (20.3%) | 99 (5.5%) |
| $100,000 to $149,999 | 1,101 (19.1%) | 112 (6.2%) |
| $150,000 or more | 1,810 (31.5%) | 256 (14.3%) |
| Total | 5,754 (100.0%) | 1,793 (100.0%) |
Monthly Housing Cost Tiers in Matteson
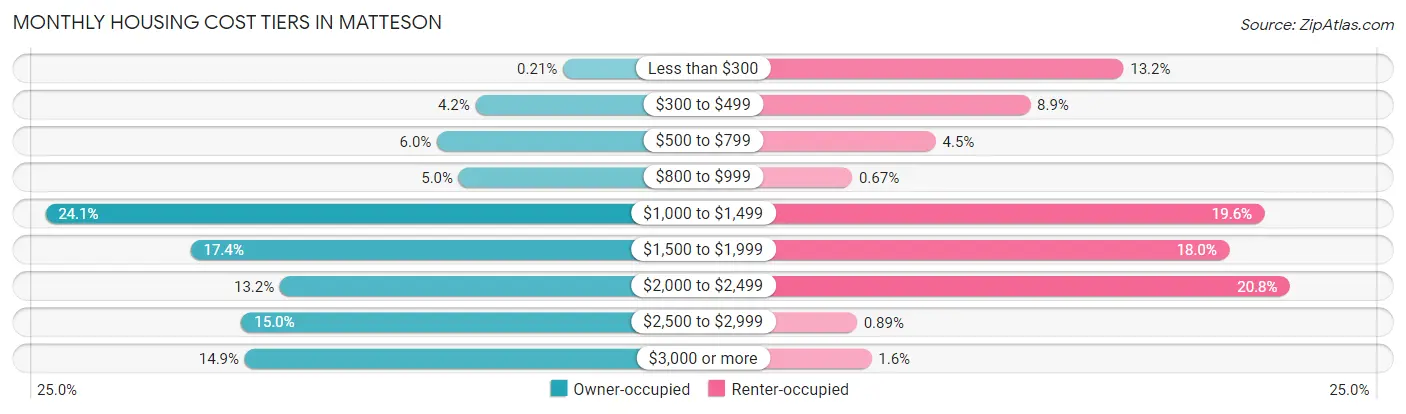
| Monthly Cost | Owner-occupied | Renter-occupied |
| Less than $300 | 12 (0.2%) | 236 (13.2%) |
| $300 to $499 | 244 (4.2%) | 159 (8.9%) |
| $500 to $799 | 346 (6.0%) | 81 (4.5%) |
| $800 to $999 | 288 (5.0%) | 12 (0.7%) |
| $1,000 to $1,499 | 1,384 (24.0%) | 352 (19.6%) |
| $1,500 to $1,999 | 999 (17.4%) | 323 (18.0%) |
| $2,000 to $2,499 | 762 (13.2%) | 373 (20.8%) |
| $2,500 to $2,999 | 864 (15.0%) | 16 (0.9%) |
| $3,000 or more | 855 (14.9%) | 28 (1.6%) |
| Total | 5,754 (100.0%) | 1,793 (100.0%) |
Physical Housing Characteristics in Matteson
Housing Structures in Matteson
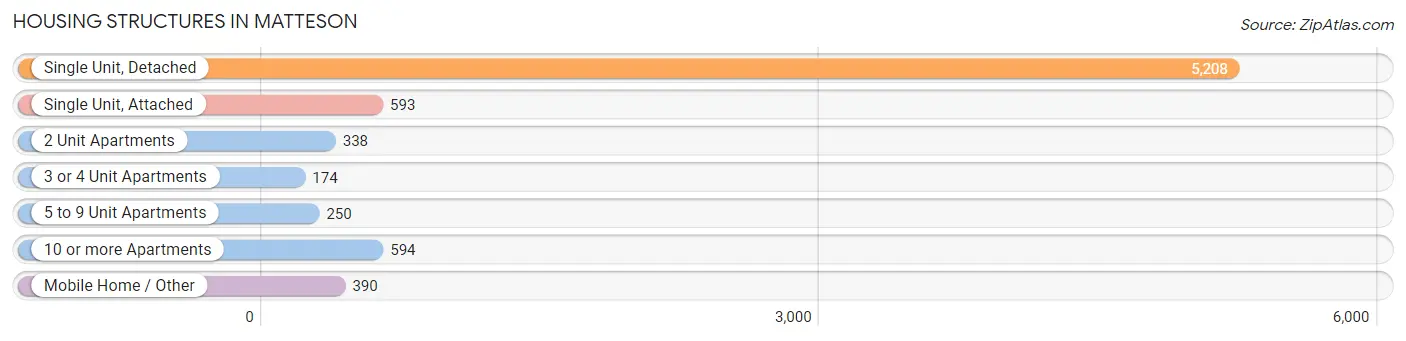
| Structure Type | # Housing Units | % Housing Units |
| Single Unit, Detached | 5,208 | 69.0% |
| Single Unit, Attached | 593 | 7.9% |
| 2 Unit Apartments | 338 | 4.5% |
| 3 or 4 Unit Apartments | 174 | 2.3% |
| 5 to 9 Unit Apartments | 250 | 3.3% |
| 10 or more Apartments | 594 | 7.9% |
| Mobile Home / Other | 390 | 5.2% |
| Total | 7,547 | 100.0% |
Housing Structures by Occupancy in Matteson
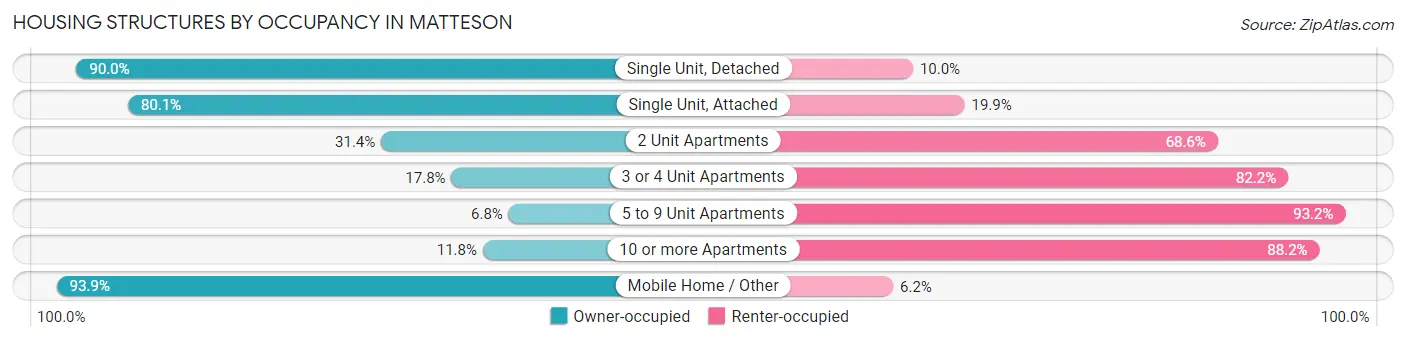
| Structure Type | Owner-occupied | Renter-occupied |
| Single Unit, Detached | 4,689 (90.0%) | 519 (10.0%) |
| Single Unit, Attached | 475 (80.1%) | 118 (19.9%) |
| 2 Unit Apartments | 106 (31.4%) | 232 (68.6%) |
| 3 or 4 Unit Apartments | 31 (17.8%) | 143 (82.2%) |
| 5 to 9 Unit Apartments | 17 (6.8%) | 233 (93.2%) |
| 10 or more Apartments | 70 (11.8%) | 524 (88.2%) |
| Mobile Home / Other | 366 (93.9%) | 24 (6.1%) |
| Total | 5,754 (76.2%) | 1,793 (23.8%) |
Housing Structures by Number of Rooms in Matteson
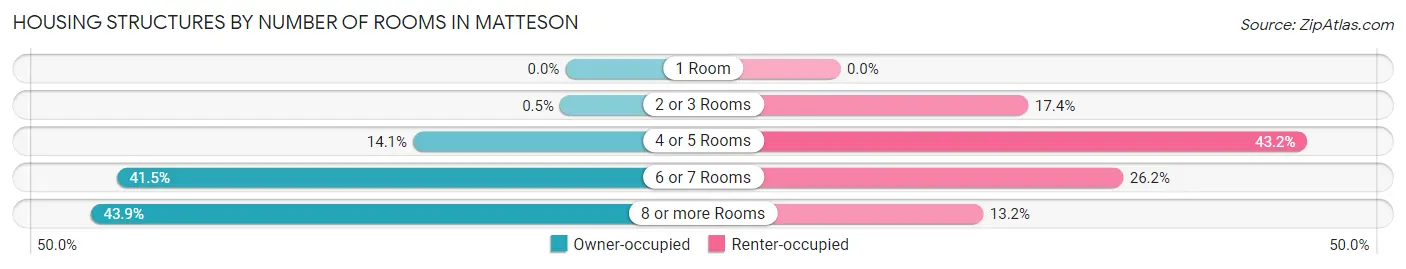
| Number of Rooms | Owner-occupied | Renter-occupied |
| 1 Room | 0 (0.0%) | 0 (0.0%) |
| 2 or 3 Rooms | 29 (0.5%) | 312 (17.4%) |
| 4 or 5 Rooms | 811 (14.1%) | 775 (43.2%) |
| 6 or 7 Rooms | 2,388 (41.5%) | 469 (26.2%) |
| 8 or more Rooms | 2,526 (43.9%) | 237 (13.2%) |
| Total | 5,754 (100.0%) | 1,793 (100.0%) |
Housing Structure by Heating Type in Matteson
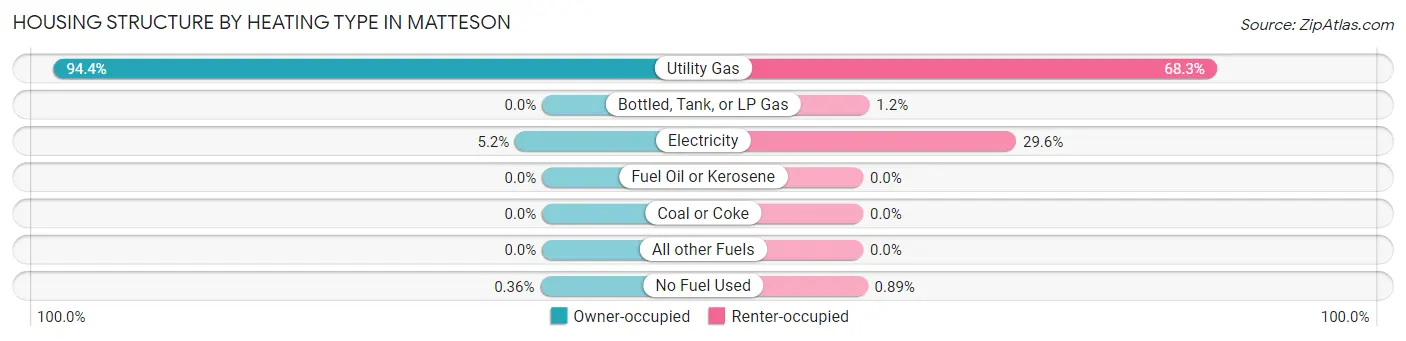
| Heating Type | Owner-occupied | Renter-occupied |
| Utility Gas | 5,433 (94.4%) | 1,225 (68.3%) |
| Bottled, Tank, or LP Gas | 0 (0.0%) | 22 (1.2%) |
| Electricity | 300 (5.2%) | 530 (29.6%) |
| Fuel Oil or Kerosene | 0 (0.0%) | 0 (0.0%) |
| Coal or Coke | 0 (0.0%) | 0 (0.0%) |
| All other Fuels | 0 (0.0%) | 0 (0.0%) |
| No Fuel Used | 21 (0.4%) | 16 (0.9%) |
| Total | 5,754 (100.0%) | 1,793 (100.0%) |
Household Vehicle Usage in Matteson
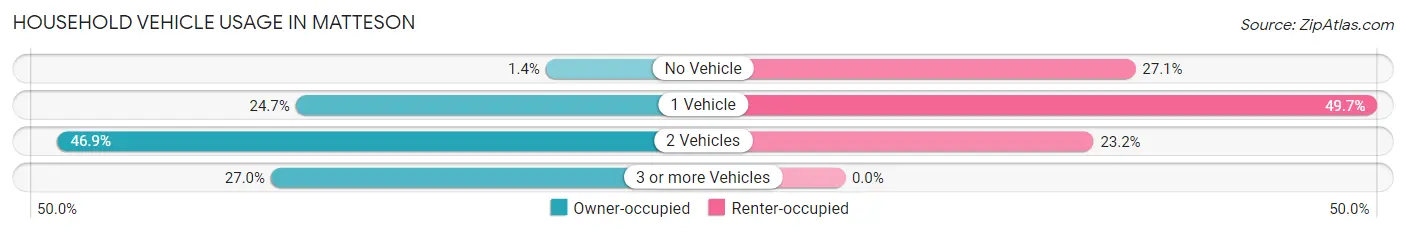
| Vehicles per Household | Owner-occupied | Renter-occupied |
| No Vehicle | 78 (1.4%) | 486 (27.1%) |
| 1 Vehicle | 1,422 (24.7%) | 891 (49.7%) |
| 2 Vehicles | 2,700 (46.9%) | 416 (23.2%) |
| 3 or more Vehicles | 1,554 (27.0%) | 0 (0.0%) |
| Total | 5,754 (100.0%) | 1,793 (100.0%) |
Real Estate & Mortgages in Matteson
Real Estate and Mortgage Overview in Matteson
| Characteristic | Without Mortgage | With Mortgage |
| Housing Units | 1,613 | 4,141 |
| Median Property Value | $151,500 | $244,500 |
| Median Household Income | $88,487 | $1,501 |
| Monthly Housing Costs | $987 | $855 |
| Real Estate Taxes | $4,963 | $72 |
Property Value by Mortgage Status in Matteson
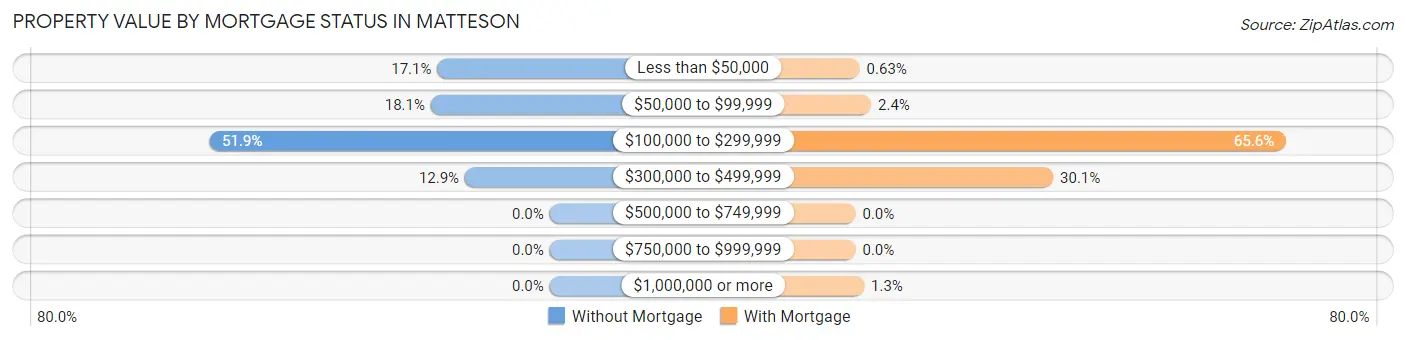
| Property Value | Without Mortgage | With Mortgage |
| Less than $50,000 | 276 (17.1%) | 26 (0.6%) |
| $50,000 to $99,999 | 292 (18.1%) | 98 (2.4%) |
| $100,000 to $299,999 | 837 (51.9%) | 2,716 (65.6%) |
| $300,000 to $499,999 | 208 (12.9%) | 1,247 (30.1%) |
| $500,000 to $749,999 | 0 (0.0%) | 0 (0.0%) |
| $750,000 to $999,999 | 0 (0.0%) | 0 (0.0%) |
| $1,000,000 or more | 0 (0.0%) | 54 (1.3%) |
| Total | 1,613 (100.0%) | 4,141 (100.0%) |
Household Income by Mortgage Status in Matteson
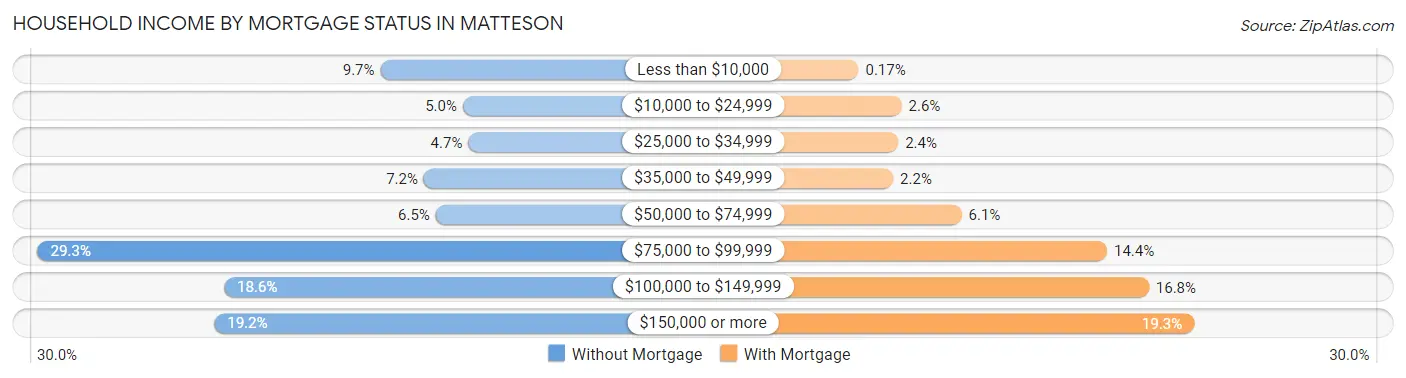
| Household Income | Without Mortgage | With Mortgage |
| Less than $10,000 | 156 (9.7%) | 7 (0.2%) |
| $10,000 to $24,999 | 80 (5.0%) | 109 (2.6%) |
| $25,000 to $34,999 | 75 (4.6%) | 101 (2.4%) |
| $35,000 to $49,999 | 116 (7.2%) | 89 (2.1%) |
| $50,000 to $74,999 | 105 (6.5%) | 251 (6.1%) |
| $75,000 to $99,999 | 472 (29.3%) | 595 (14.4%) |
| $100,000 to $149,999 | 300 (18.6%) | 694 (16.8%) |
| $150,000 or more | 309 (19.2%) | 801 (19.3%) |
| Total | 1,613 (100.0%) | 4,141 (100.0%) |
Property Value to Household Income Ratio in Matteson
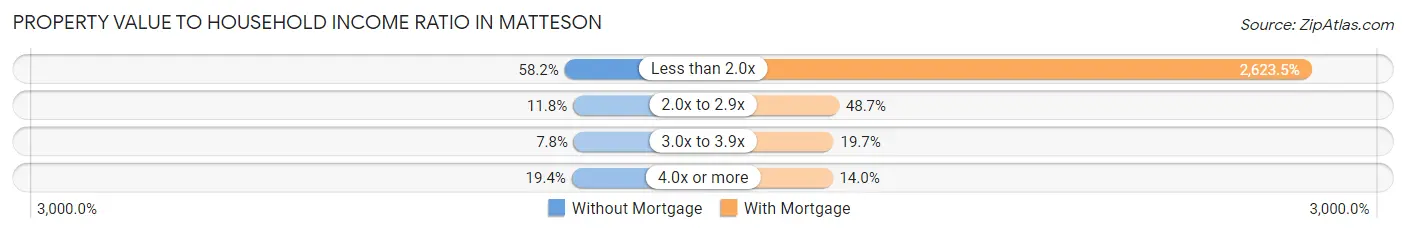
| Value-to-Income Ratio | Without Mortgage | With Mortgage |
| Less than 2.0x | 938 (58.2%) | 108,638 (2,623.5%) |
| 2.0x to 2.9x | 191 (11.8%) | 2,017 (48.7%) |
| 3.0x to 3.9x | 126 (7.8%) | 816 (19.7%) |
| 4.0x or more | 313 (19.4%) | 578 (14.0%) |
| Total | 1,613 (100.0%) | 4,141 (100.0%) |
Real Estate Taxes by Mortgage Status in Matteson
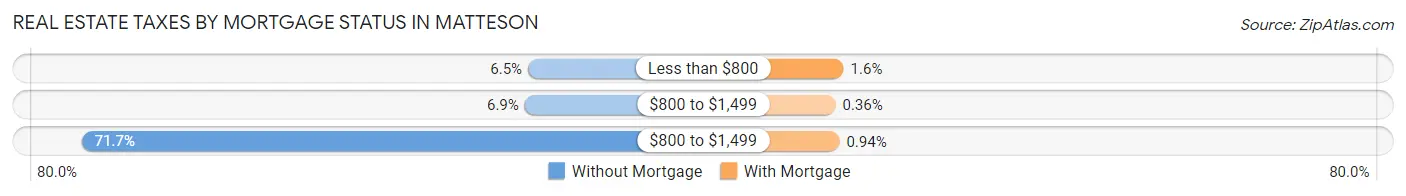
| Property Taxes | Without Mortgage | With Mortgage |
| Less than $800 | 104 (6.5%) | 64 (1.5%) |
| $800 to $1,499 | 112 (6.9%) | 15 (0.4%) |
| $800 to $1,499 | 1,156 (71.7%) | 39 (0.9%) |
| Total | 1,613 (100.0%) | 4,141 (100.0%) |
Health & Disability in Matteson
Health Insurance Coverage by Age in Matteson
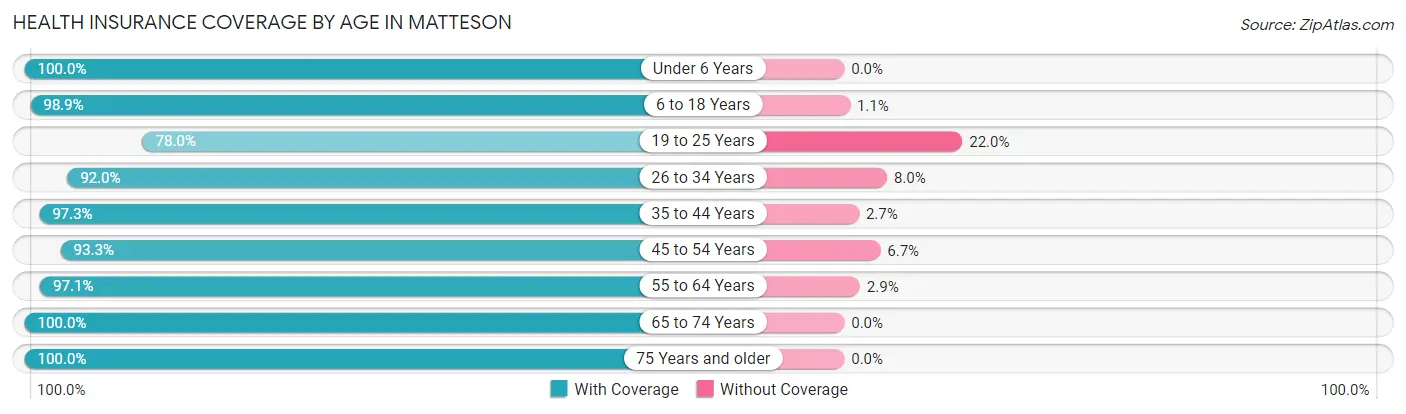
| Age Bracket | With Coverage | Without Coverage |
| Under 6 Years | 1,001 (100.0%) | 0 (0.0%) |
| 6 to 18 Years | 3,086 (98.9%) | 33 (1.1%) |
| 19 to 25 Years | 1,272 (78.0%) | 359 (22.0%) |
| 26 to 34 Years | 1,769 (92.0%) | 153 (8.0%) |
| 35 to 44 Years | 1,958 (97.3%) | 55 (2.7%) |
| 45 to 54 Years | 2,578 (93.3%) | 186 (6.7%) |
| 55 to 64 Years | 2,706 (97.1%) | 81 (2.9%) |
| 65 to 74 Years | 2,221 (100.0%) | 0 (0.0%) |
| 75 Years and older | 1,343 (100.0%) | 0 (0.0%) |
| Total | 17,934 (95.4%) | 867 (4.6%) |
Health Insurance Coverage by Citizenship Status in Matteson
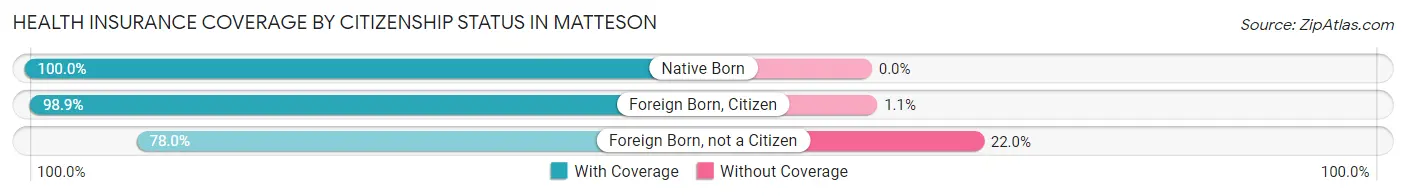
| Citizenship Status | With Coverage | Without Coverage |
| Native Born | 1,001 (100.0%) | 0 (0.0%) |
| Foreign Born, Citizen | 3,086 (98.9%) | 33 (1.1%) |
| Foreign Born, not a Citizen | 1,272 (78.0%) | 359 (22.0%) |
Health Insurance Coverage by Household Income in Matteson
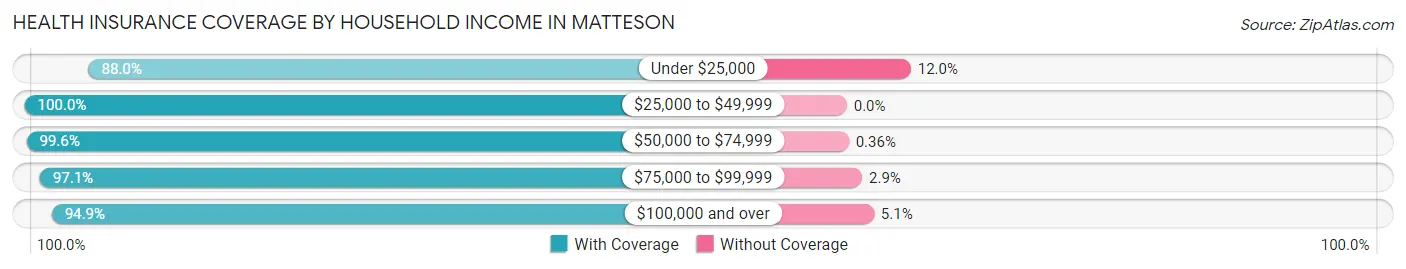
| Household Income | With Coverage | Without Coverage |
| Under $25,000 | 1,908 (88.0%) | 260 (12.0%) |
| $25,000 to $49,999 | 1,443 (100.0%) | 0 (0.0%) |
| $50,000 to $74,999 | 1,918 (99.6%) | 7 (0.4%) |
| $75,000 to $99,999 | 3,153 (97.1%) | 93 (2.9%) |
| $100,000 and over | 9,471 (94.9%) | 507 (5.1%) |
Public vs Private Health Insurance Coverage by Age in Matteson
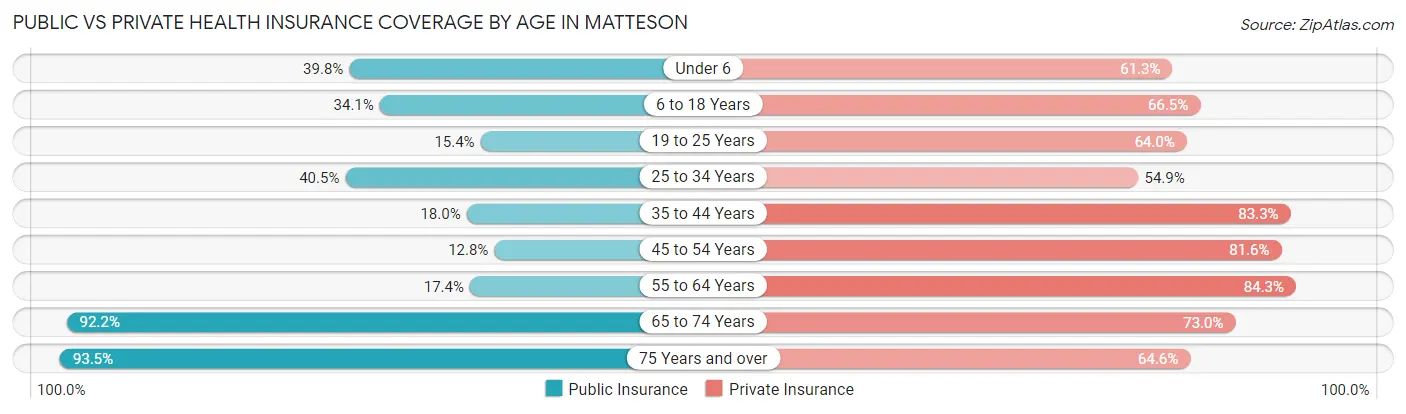
| Age Bracket | Public Insurance | Private Insurance |
| Under 6 | 398 (39.8%) | 614 (61.3%) |
| 6 to 18 Years | 1,064 (34.1%) | 2,074 (66.5%) |
| 19 to 25 Years | 251 (15.4%) | 1,044 (64.0%) |
| 25 to 34 Years | 778 (40.5%) | 1,055 (54.9%) |
| 35 to 44 Years | 362 (18.0%) | 1,676 (83.3%) |
| 45 to 54 Years | 355 (12.8%) | 2,255 (81.6%) |
| 55 to 64 Years | 484 (17.4%) | 2,349 (84.3%) |
| 65 to 74 Years | 2,048 (92.2%) | 1,622 (73.0%) |
| 75 Years and over | 1,255 (93.4%) | 868 (64.6%) |
| Total | 6,995 (37.2%) | 13,557 (72.1%) |
Disability Status by Sex by Age in Matteson
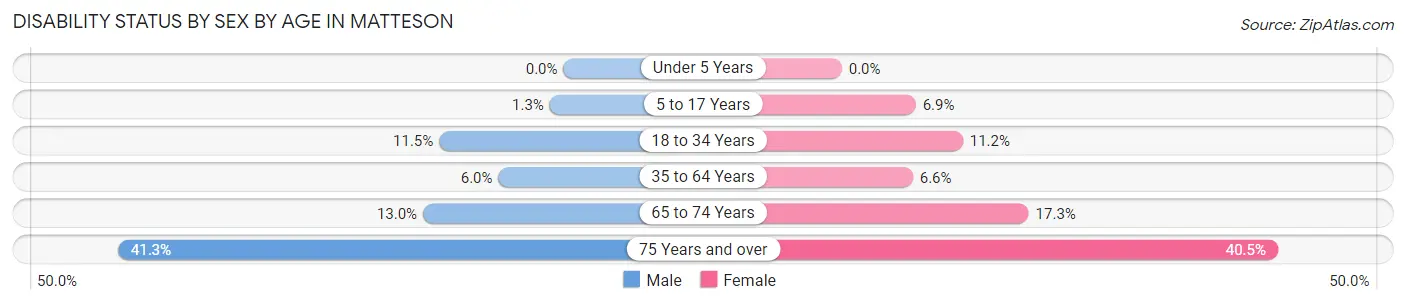
| Age Bracket | Male | Female |
| Under 5 Years | 0 (0.0%) | 0 (0.0%) |
| 5 to 17 Years | 21 (1.3%) | 92 (6.9%) |
| 18 to 34 Years | 189 (11.5%) | 241 (11.2%) |
| 35 to 64 Years | 189 (6.0%) | 292 (6.6%) |
| 65 to 74 Years | 124 (13.0%) | 220 (17.3%) |
| 75 Years and over | 265 (41.3%) | 284 (40.5%) |
Disability Class by Sex by Age in Matteson
Disability Class: Hearing Difficulty
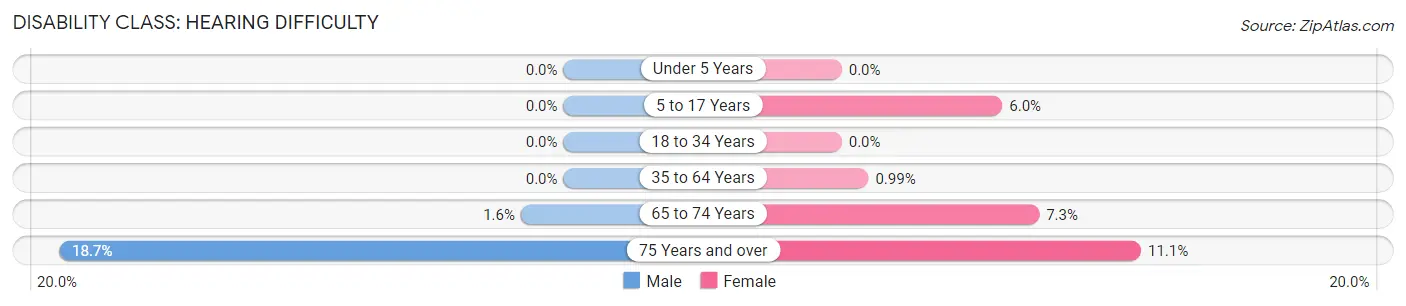
| Age Bracket | Male | Female |
| Under 5 Years | 0 (0.0%) | 0 (0.0%) |
| 5 to 17 Years | 0 (0.0%) | 80 (6.0%) |
| 18 to 34 Years | 0 (0.0%) | 0 (0.0%) |
| 35 to 64 Years | 0 (0.0%) | 44 (1.0%) |
| 65 to 74 Years | 15 (1.6%) | 93 (7.3%) |
| 75 Years and over | 120 (18.7%) | 78 (11.1%) |
Disability Class: Vision Difficulty
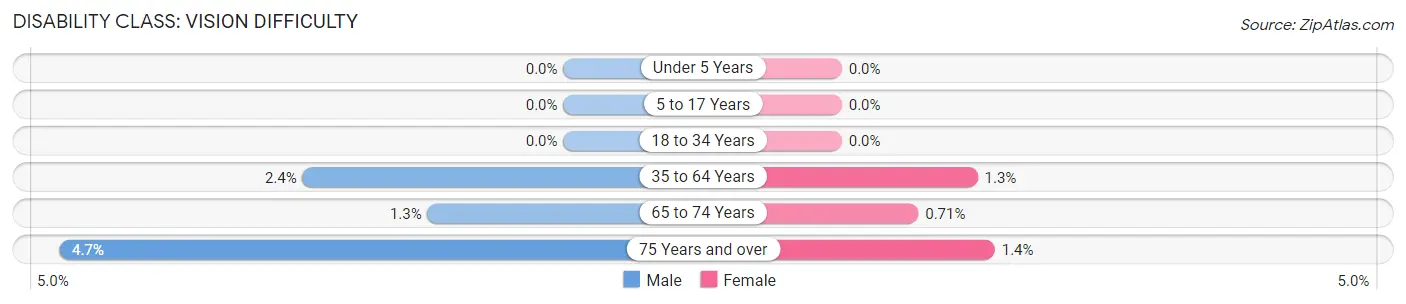
| Age Bracket | Male | Female |
| Under 5 Years | 0 (0.0%) | 0 (0.0%) |
| 5 to 17 Years | 0 (0.0%) | 0 (0.0%) |
| 18 to 34 Years | 0 (0.0%) | 0 (0.0%) |
| 35 to 64 Years | 76 (2.4%) | 56 (1.3%) |
| 65 to 74 Years | 12 (1.3%) | 9 (0.7%) |
| 75 Years and over | 30 (4.7%) | 10 (1.4%) |
Disability Class: Cognitive Difficulty
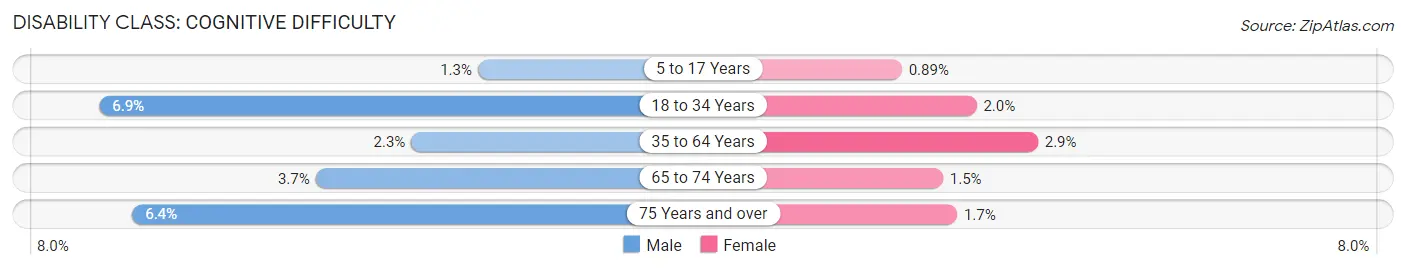
| Age Bracket | Male | Female |
| 5 to 17 Years | 21 (1.3%) | 12 (0.9%) |
| 18 to 34 Years | 113 (6.9%) | 43 (2.0%) |
| 35 to 64 Years | 71 (2.3%) | 129 (2.9%) |
| 65 to 74 Years | 35 (3.7%) | 19 (1.5%) |
| 75 Years and over | 41 (6.4%) | 12 (1.7%) |
Disability Class: Ambulatory Difficulty
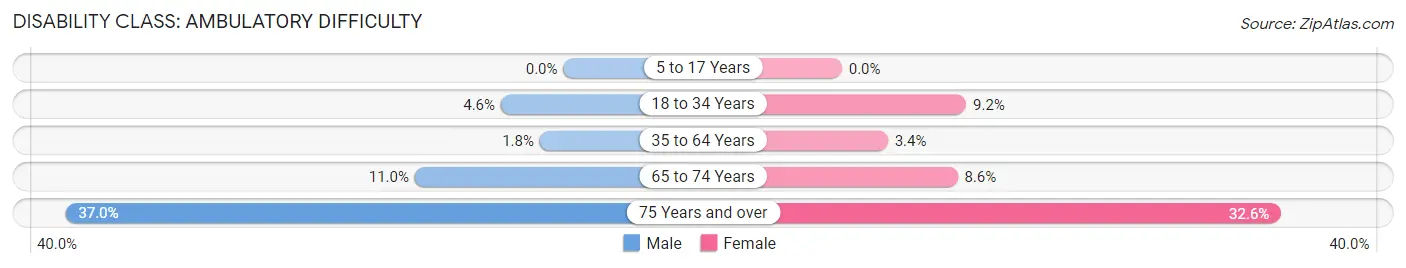
| Age Bracket | Male | Female |
| 5 to 17 Years | 0 (0.0%) | 0 (0.0%) |
| 18 to 34 Years | 76 (4.6%) | 198 (9.2%) |
| 35 to 64 Years | 55 (1.8%) | 151 (3.4%) |
| 65 to 74 Years | 105 (11.0%) | 109 (8.6%) |
| 75 Years and over | 237 (37.0%) | 229 (32.6%) |
Disability Class: Self-Care Difficulty
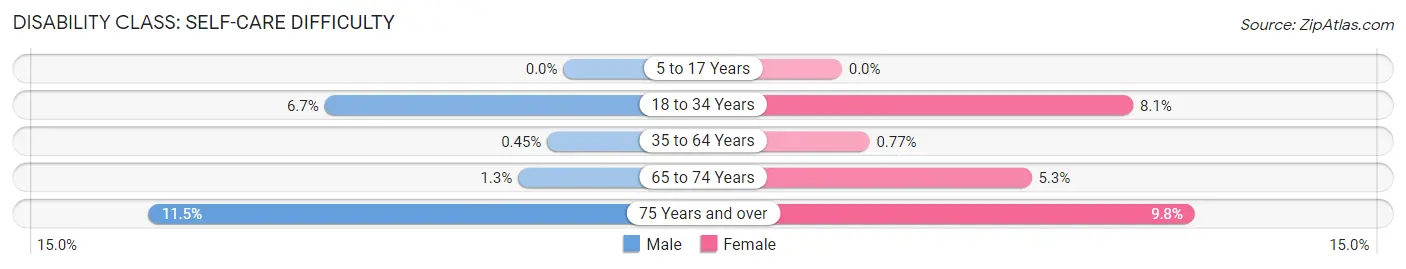
| Age Bracket | Male | Female |
| 5 to 17 Years | 0 (0.0%) | 0 (0.0%) |
| 18 to 34 Years | 109 (6.7%) | 174 (8.1%) |
| 35 to 64 Years | 14 (0.4%) | 34 (0.8%) |
| 65 to 74 Years | 12 (1.3%) | 67 (5.3%) |
| 75 Years and over | 74 (11.5%) | 69 (9.8%) |
Technology Access in Matteson
Computing Device Access in Matteson
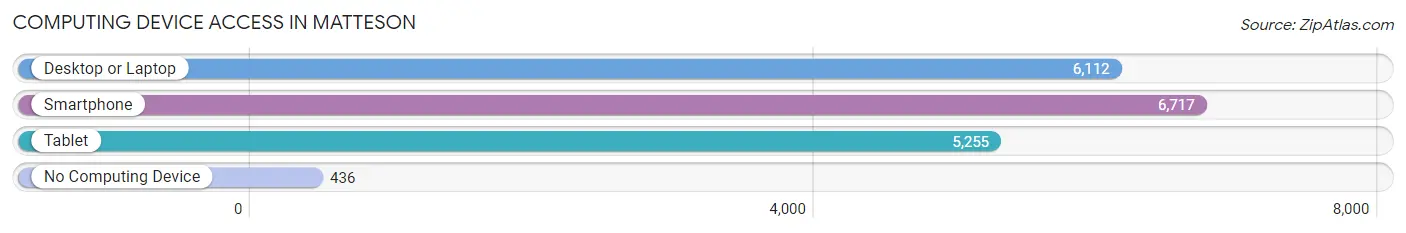
| Device Type | # Households | % Households |
| Desktop or Laptop | 6,112 | 81.0% |
| Smartphone | 6,717 | 89.0% |
| Tablet | 5,255 | 69.6% |
| No Computing Device | 436 | 5.8% |
| Total | 7,547 | 100.0% |
Internet Access in Matteson
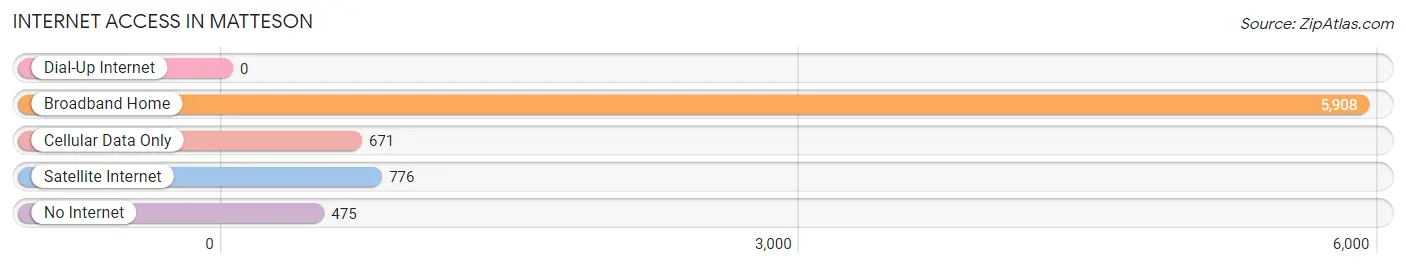
| Internet Type | # Households | % Households |
| Dial-Up Internet | 0 | 0.0% |
| Broadband Home | 5,908 | 78.3% |
| Cellular Data Only | 671 | 8.9% |
| Satellite Internet | 776 | 10.3% |
| No Internet | 475 | 6.3% |
| Total | 7,547 | 100.0% |
Matteson Summary
Matteson, Illinois is a village located in Cook and Will counties in the state of Illinois. It is a suburb of Chicago and is part of the Chicago metropolitan area. The population of Matteson was 19,009 at the 2010 census.
History
The area that is now Matteson was first settled in the 1830s by a group of German immigrants. The village was originally known as "Vollmer's Grove" after one of the settlers, John Vollmer. In 1855, the village was renamed "Matteson" after the first postmaster, William Matteson. The village was incorporated in 1859.
In the late 19th century, Matteson was a rural farming community. The village was home to several small businesses, including a general store, a blacksmith shop, and a hotel. In the early 20th century, the village began to grow as more people moved to the area. The village was connected to the Chicago and Alton Railroad in 1912, which helped to spur growth.
Geography
Matteson is located in northeastern Illinois, about 25 miles south of downtown Chicago. It is situated in both Cook and Will counties, with the majority of the village located in Cook County. The village is bordered by Richton Park to the north, Park Forest to the east, Olympia Fields to the south, and Frankfort to the west.
The village has a total area of 5.3 square miles, all of which is land. The village is located in the Kankakee River watershed. The Kankakee River runs through the village, and there are several small lakes and ponds in the area.
Economy
The economy of Matteson is largely based on retail and services. The village is home to several large shopping centers, including the Lincoln Mall, which is the largest shopping center in the area. The village is also home to several large employers, including the Matteson Auto Mall, the Matteson Medical Center, and the Matteson School District.
Demographics
As of the 2010 census, the population of Matteson was 19,009. The racial makeup of the village was 57.3% African American, 33.2% White, 4.2% Asian, and 2.3% Hispanic or Latino. The median household income was $50,945, and the median family income was $60,945.
The village is served by the Matteson School District, which includes two elementary schools, one middle school, and one high school. The village is also home to several private schools, including the Matteson Christian Academy and the Matteson Montessori School.
Conclusion
Matteson, Illinois is a village located in Cook and Will counties in the state of Illinois. It is a suburb of Chicago and is part of the Chicago metropolitan area. The village has a long history, dating back to the 1830s when it was first settled by German immigrants. The village has grown over the years and is now home to several large employers and shopping centers. The population of Matteson was 19,009 at the 2010 census, and the racial makeup of the village was 57.3% African American, 33.2% White, 4.2% Asian, and 2.3% Hispanic or Latino. The village is served by the Matteson School District, which includes two elementary schools, one middle school, and one high school.
Common Questions
What is Per Capita Income in Matteson?
Per Capita income in Matteson is $42,795.
What is the Median Family Income in Matteson?
Median Family Income in Matteson is $105,824.
What is the Median Household income in Matteson?
Median Household Income in Matteson is $88,591.
What is Income or Wage Gap in Matteson?
Income or Wage Gap in Matteson is 8.6%.
Women in Matteson earn 91.4 cents for every dollar earned by a man.
What is Inequality or Gini Index in Matteson?
Inequality or Gini Index in Matteson is 0.42.
What is the Total Population of Matteson?
Total Population of Matteson is 18,898.
What is the Total Male Population of Matteson?
Total Male Population of Matteson is 8,395.
What is the Total Female Population of Matteson?
Total Female Population of Matteson is 10,503.
What is the Ratio of Males per 100 Females in Matteson?
There are 79.93 Males per 100 Females in Matteson.
What is the Ratio of Females per 100 Males in Matteson?
There are 125.11 Females per 100 Males in Matteson.
What is the Median Population Age in Matteson?
Median Population Age in Matteson is 43.8 Years.
What is the Average Family Size in Matteson
Average Family Size in Matteson is 3.2 People.
What is the Average Household Size in Matteson
Average Household Size in Matteson is 2.5 People.
How Large is the Labor Force in Matteson?
There are 10,146 People in the Labor Forcein in Matteson.
What is the Percentage of People in the Labor Force in Matteson?
66.0% of People are in the Labor Force in Matteson.
What is the Unemployment Rate in Matteson?
Unemployment Rate in Matteson is 12.5%.