Glencoe, IL Map & Demographics
Glencoe Map
Glencoe Overview
$135,540
PER CAPITA INCOME
$250,001
AVG FAMILY INCOME
$228,750
AVG HOUSEHOLD INCOME
63.2%
WAGE / INCOME GAP [ % ]
36.8¢/ $1
WAGE / INCOME GAP [ $ ]
0.55
INEQUALITY / GINI INDEX
8,787
TOTAL POPULATION
4,254
MALE POPULATION
4,533
FEMALE POPULATION
93.85
MALES / 100 FEMALES
106.56
FEMALES / 100 MALES
44.9
MEDIAN AGE
3.1
AVG FAMILY SIZE
2.9
AVG HOUSEHOLD SIZE
3,457
LABOR FORCE [ PEOPLE ]
52.5%
PERCENT IN LABOR FORCE
3.9%
UNEMPLOYMENT RATE
Glencoe Zip Codes
Glencoe Area Codes
Income in Glencoe
Income Overview in Glencoe
Per Capita Income in Glencoe is $135,540, while median incomes of families and households are $250,001 and $228,750 respectively.
| Characteristic | Number | Measure |
| Per Capita Income | 8,787 | $135,540 |
| Median Family Income | 2,642 | $250,001 |
| Mean Family Income | 2,642 | $429,709 |
| Median Household Income | 3,072 | $228,750 |
| Mean Household Income | 3,072 | $383,105 |
| Income Deficit | 2,642 | $0 |
| Wage / Income Gap (%) | 8,787 | 63.24% |
| Wage / Income Gap ($) | 8,787 | 36.76¢ per $1 |
| Gini / Inequality Index | 8,787 | 0.55 |
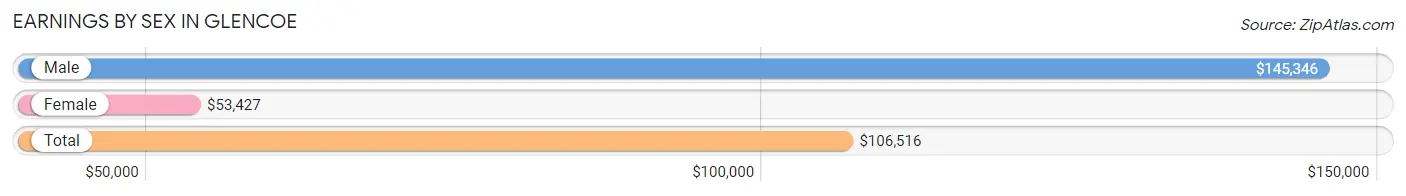
Earnings by Sex in Glencoe
Average Earnings in Glencoe are $106,516, $145,346 for men and $53,427 for women, a difference of 63.2%.
| Sex | Number | Average Earnings |
| Male | 2,225 (58.1%) | $145,346 |
| Female | 1,607 (41.9%) | $53,427 |
| Total | 3,832 (100.0%) | $106,516 |
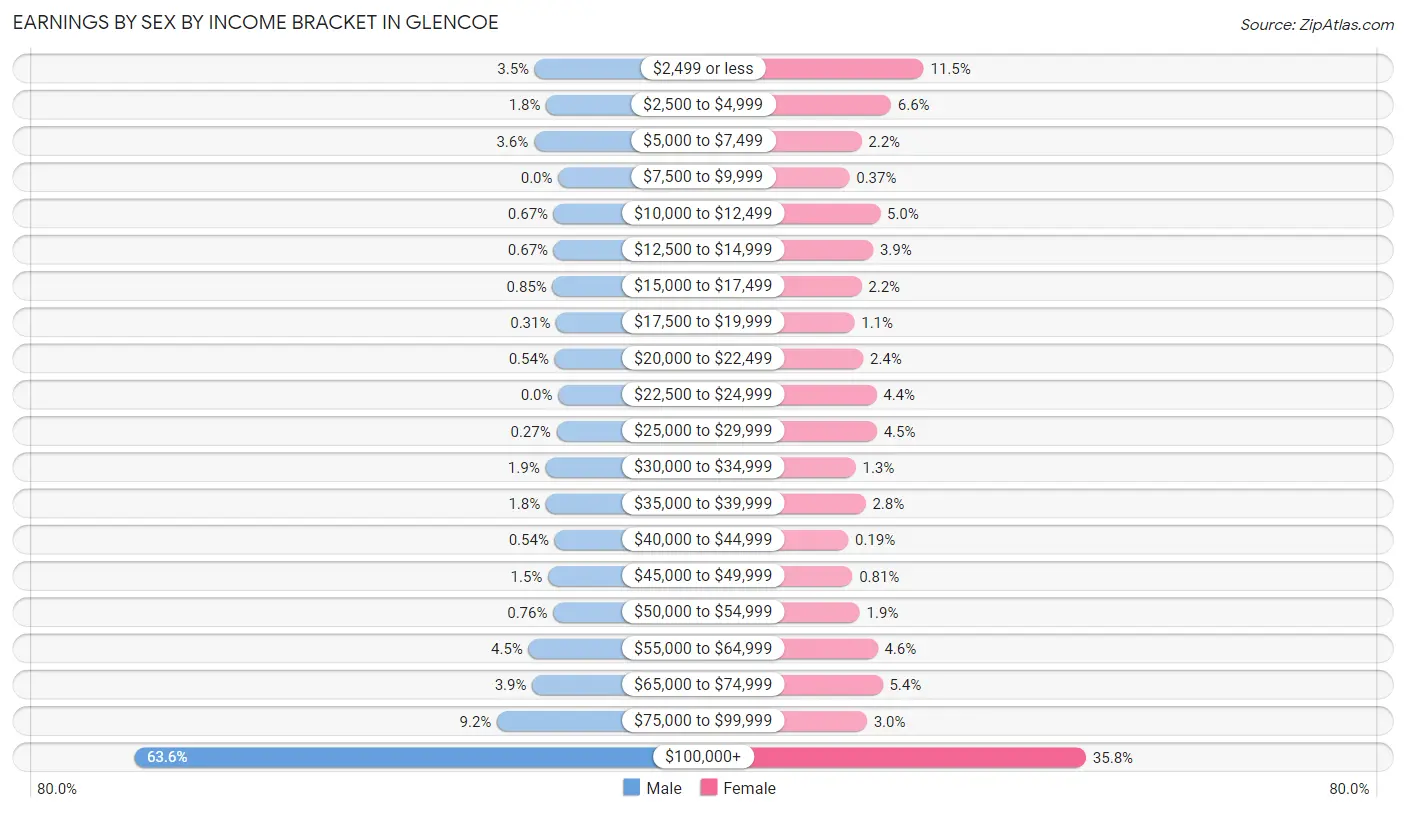
Earnings by Sex by Income Bracket in Glencoe
The most common earnings brackets in Glencoe are $100,000+ for men (1,415 | 63.6%) and $100,000+ for women (576 | 35.8%).
| Income | Male | Female |
| $2,499 or less | 78 (3.5%) | 185 (11.5%) |
| $2,500 to $4,999 | 40 (1.8%) | 106 (6.6%) |
| $5,000 to $7,499 | 81 (3.6%) | 35 (2.2%) |
| $7,500 to $9,999 | 0 (0.0%) | 6 (0.4%) |
| $10,000 to $12,499 | 15 (0.7%) | 80 (5.0%) |
| $12,500 to $14,999 | 15 (0.7%) | 63 (3.9%) |
| $15,000 to $17,499 | 19 (0.9%) | 35 (2.2%) |
| $17,500 to $19,999 | 7 (0.3%) | 18 (1.1%) |
| $20,000 to $22,499 | 12 (0.5%) | 39 (2.4%) |
| $22,500 to $24,999 | 0 (0.0%) | 71 (4.4%) |
| $25,000 to $29,999 | 6 (0.3%) | 72 (4.5%) |
| $30,000 to $34,999 | 43 (1.9%) | 21 (1.3%) |
| $35,000 to $39,999 | 41 (1.8%) | 45 (2.8%) |
| $40,000 to $44,999 | 12 (0.5%) | 3 (0.2%) |
| $45,000 to $49,999 | 34 (1.5%) | 13 (0.8%) |
| $50,000 to $54,999 | 17 (0.8%) | 31 (1.9%) |
| $55,000 to $64,999 | 99 (4.4%) | 74 (4.6%) |
| $65,000 to $74,999 | 87 (3.9%) | 86 (5.3%) |
| $75,000 to $99,999 | 204 (9.2%) | 48 (3.0%) |
| $100,000+ | 1,415 (63.6%) | 576 (35.8%) |
| Total | 2,225 (100.0%) | 1,607 (100.0%) |
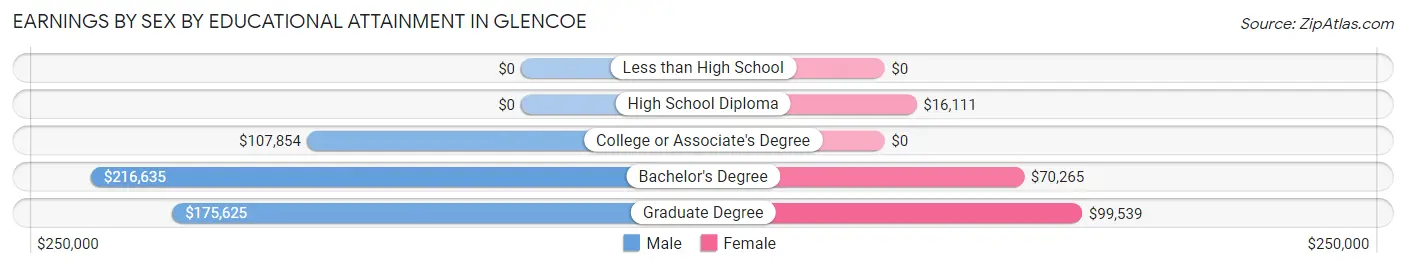
Earnings by Sex by Educational Attainment in Glencoe
Average earnings in Glencoe are $152,697 for men and $71,250 for women, a difference of 53.3%. Men with an educational attainment of bachelor's degree enjoy the highest average annual earnings of $216,635, while those with college or associate's degree education earn the least with $107,854. Women with an educational attainment of graduate degree earn the most with the average annual earnings of $99,539, while those with high school diploma education have the smallest earnings of $16,111.
| Educational Attainment | Male Income | Female Income |
| Less than High School | - | - |
| High School Diploma | - | - |
| College or Associate's Degree | $107,854 | $0 |
| Bachelor's Degree | $216,635 | $70,265 |
| Graduate Degree | $175,625 | $99,539 |
| Total | $152,697 | $71,250 |
Family Income in Glencoe
Family Income Brackets in Glencoe
According to the Glencoe family income data, there are 1,622 families falling into the $200,000+ income range, which is the most common income bracket and makes up 61.4% of all families.
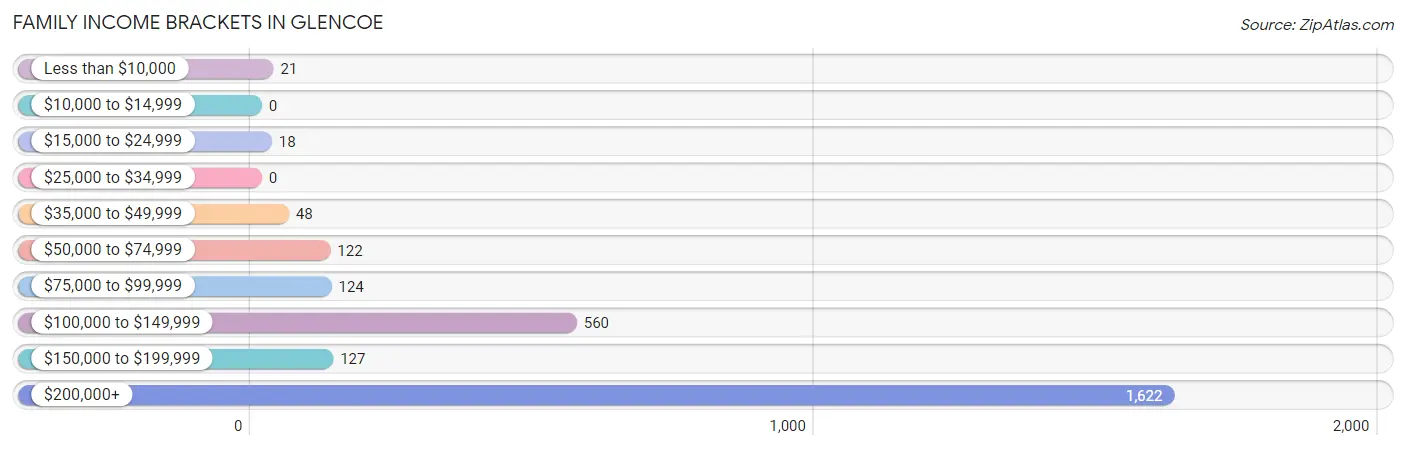
| Income Bracket | # Families | % Families |
| Less than $10,000 | 21 | 0.8% |
| $10,000 to $14,999 | 0 | 0.0% |
| $15,000 to $24,999 | 18 | 0.7% |
| $25,000 to $34,999 | 0 | 0.0% |
| $35,000 to $49,999 | 48 | 1.8% |
| $50,000 to $74,999 | 122 | 4.6% |
| $75,000 to $99,999 | 124 | 4.7% |
| $100,000 to $149,999 | 560 | 21.2% |
| $150,000 to $199,999 | 127 | 4.8% |
| $200,000+ | 1,622 | 61.4% |
Family Income by Famaliy Size in Glencoe
2-person families (1,117 | 42.3%) account for the highest median family income in Glencoe with $250,001 per family, while 2-person families (1,117 | 42.3%) have the highest median income of $125,000 per family member.
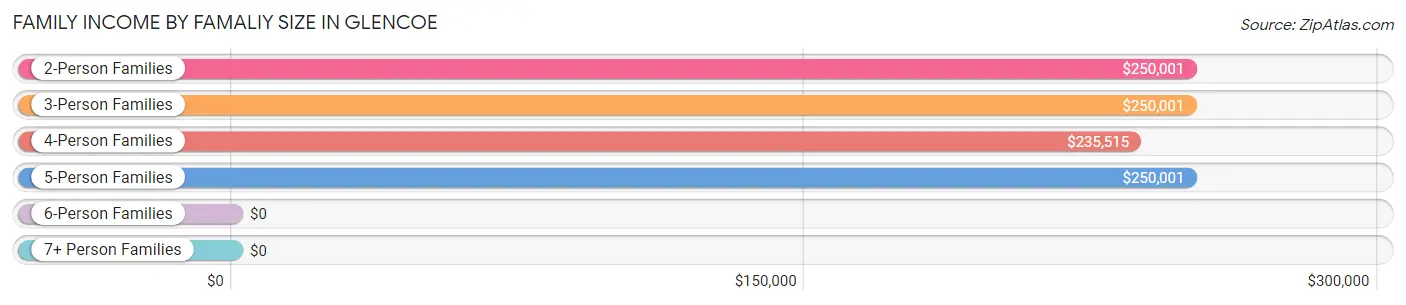
| Income Bracket | # Families | Median Income |
| 2-Person Families | 1,117 (42.3%) | $250,001 |
| 3-Person Families | 497 (18.8%) | $250,001 |
| 4-Person Families | 693 (26.2%) | $235,515 |
| 5-Person Families | 296 (11.2%) | $250,001 |
| 6-Person Families | 39 (1.5%) | $0 |
| 7+ Person Families | 0 (0.0%) | $0 |
| Total | 2,642 (100.0%) | $250,001 |
Family Income by Number of Earners in Glencoe
The median family income in Glencoe is $250,001, with families comprising no earners (408) having the highest median family income of $250,001, while families with 1 earner (1,073) have the lowest median family income of $225,982, accounting for 15.4% and 40.6% of families, respectively.
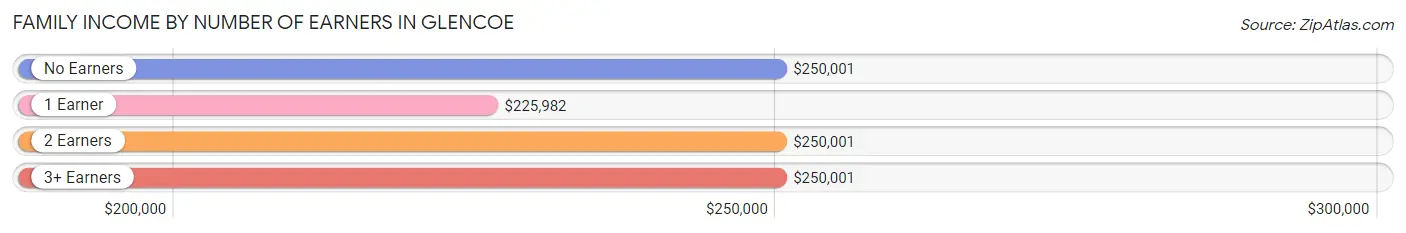
| Number of Earners | # Families | Median Income |
| No Earners | 408 (15.4%) | $250,001 |
| 1 Earner | 1,073 (40.6%) | $225,982 |
| 2 Earners | 986 (37.3%) | $250,001 |
| 3+ Earners | 175 (6.6%) | $250,001 |
| Total | 2,642 (100.0%) | $250,001 |
Household Income in Glencoe
Household Income Brackets in Glencoe
With 1,647 households falling in the category, the $200,000+ income range is the most frequent in Glencoe, accounting for 53.6% of all households.
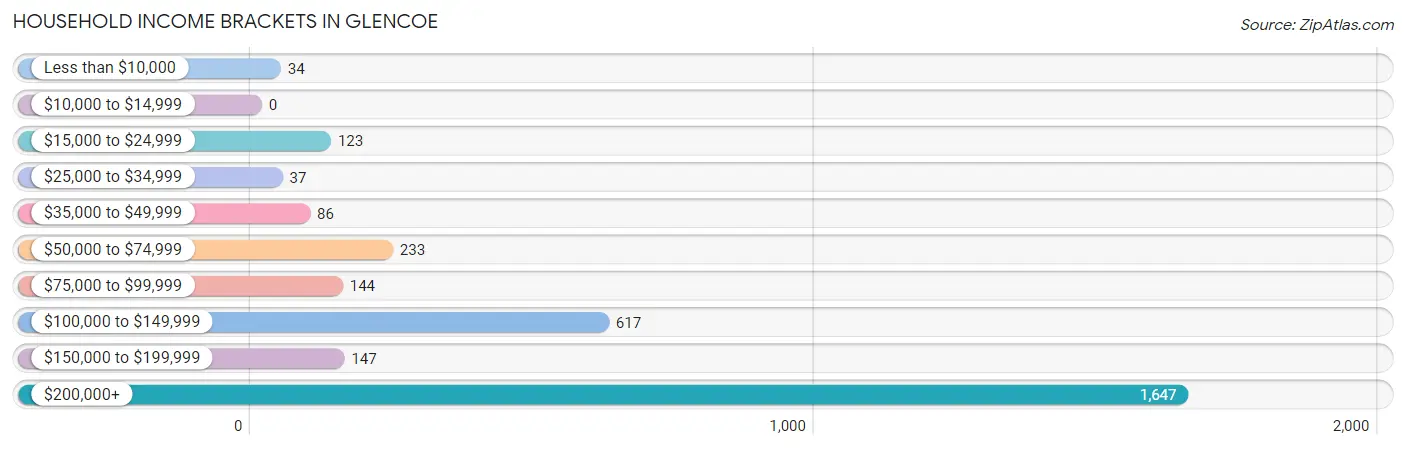
| Income Bracket | # Households | % Households |
| Less than $10,000 | 34 | 1.1% |
| $10,000 to $14,999 | 0 | 0.0% |
| $15,000 to $24,999 | 123 | 4.0% |
| $25,000 to $34,999 | 37 | 1.2% |
| $35,000 to $49,999 | 86 | 2.8% |
| $50,000 to $74,999 | 233 | 7.6% |
| $75,000 to $99,999 | 144 | 4.7% |
| $100,000 to $149,999 | 617 | 20.1% |
| $150,000 to $199,999 | 147 | 4.8% |
| $200,000+ | 1,647 | 53.6% |
Household Income by Householder Age in Glencoe
The median household income in Glencoe is $228,750, with the highest median household income of $250,001 found in the 25 to 44 years age bracket for the primary householder. A total of 609 households (19.8%) fall into this category. Meanwhile, the 15 to 24 years age bracket for the primary householder has the lowest median household income of $0, with 26 households (0.9%) in this group.
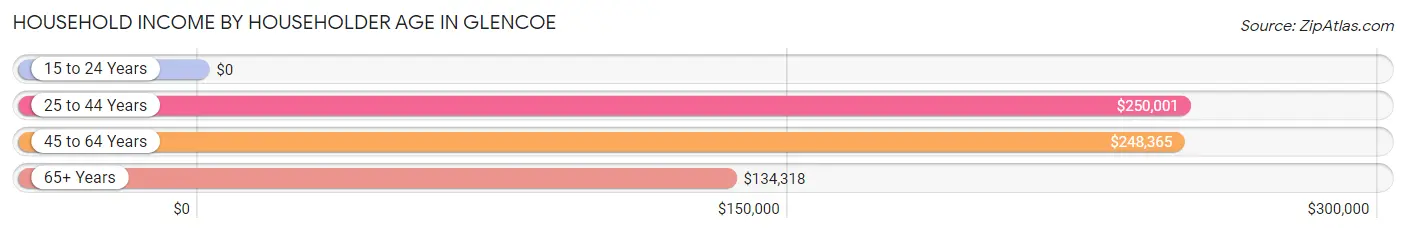
| Income Bracket | # Households | Median Income |
| 15 to 24 Years | 26 (0.9%) | $0 |
| 25 to 44 Years | 609 (19.8%) | $250,001 |
| 45 to 64 Years | 1,409 (45.9%) | $248,365 |
| 65+ Years | 1,028 (33.5%) | $134,318 |
| Total | 3,072 (100.0%) | $228,750 |
Poverty in Glencoe
Income Below Poverty by Sex and Age in Glencoe
With 0.9% poverty level for males and 2.8% for females among the residents of Glencoe, 55 to 64 year old males and 6 to 11 year old females are the most vulnerable to poverty, with 19 males (2.3%) and 57 females (11.5%) in their respective age groups living below the poverty level.
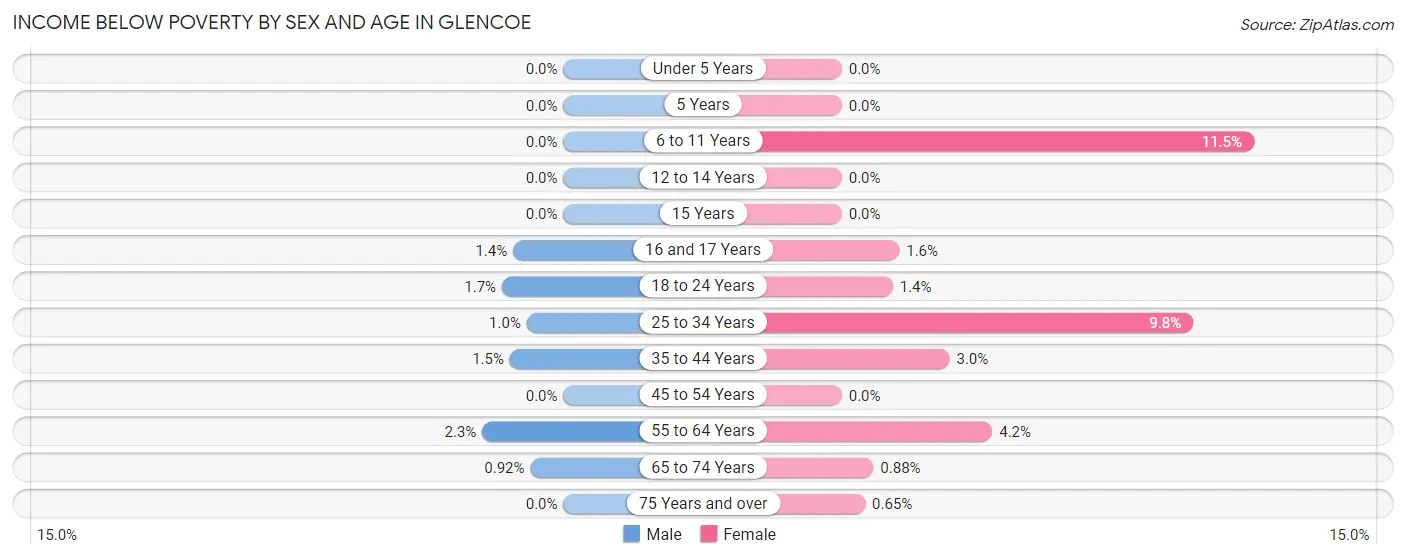
| Age Bracket | Male | Female |
| Under 5 Years | 0 (0.0%) | 0 (0.0%) |
| 5 Years | 0 (0.0%) | 0 (0.0%) |
| 6 to 11 Years | 0 (0.0%) | 57 (11.5%) |
| 12 to 14 Years | 0 (0.0%) | 0 (0.0%) |
| 15 Years | 0 (0.0%) | 0 (0.0%) |
| 16 and 17 Years | 2 (1.4%) | 2 (1.6%) |
| 18 to 24 Years | 3 (1.7%) | 6 (1.4%) |
| 25 to 34 Years | 1 (1.0%) | 9 (9.8%) |
| 35 to 44 Years | 8 (1.5%) | 18 (3.0%) |
| 45 to 54 Years | 0 (0.0%) | 0 (0.0%) |
| 55 to 64 Years | 19 (2.3%) | 28 (4.2%) |
| 65 to 74 Years | 4 (0.9%) | 4 (0.9%) |
| 75 Years and over | 0 (0.0%) | 3 (0.6%) |
| Total | 37 (0.9%) | 127 (2.8%) |
Income Above Poverty by Sex and Age in Glencoe
According to the poverty statistics in Glencoe, males aged under 5 years and females aged under 5 years are the age groups that are most secure financially, with 100.0% of males and 100.0% of females in these age groups living above the poverty line.
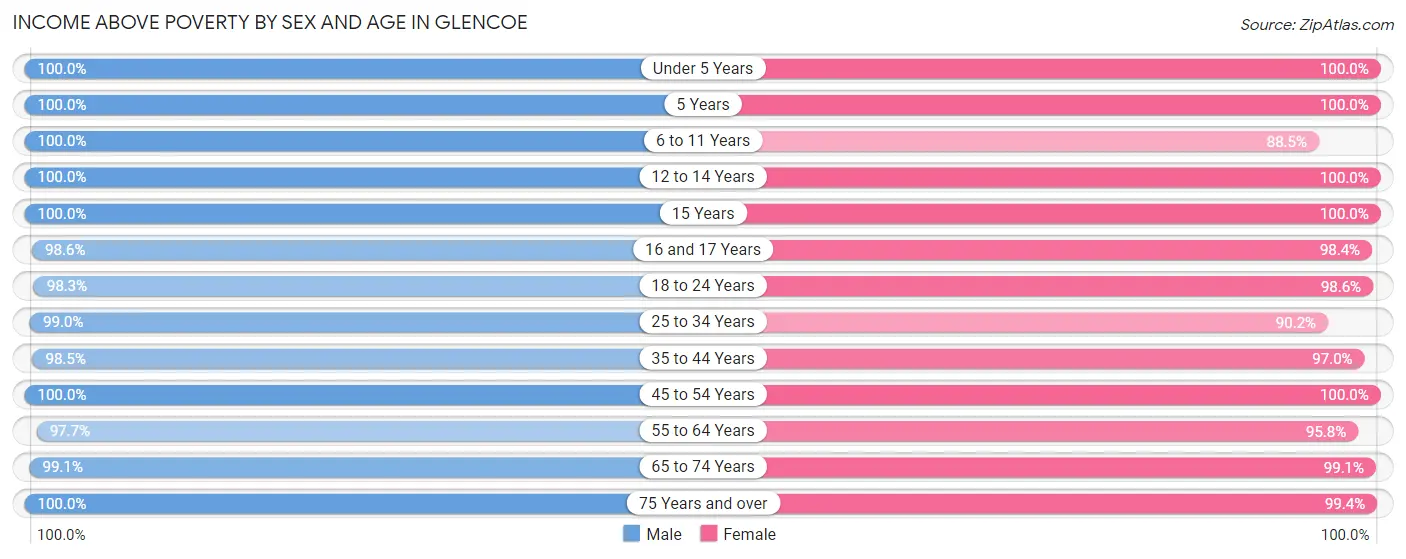
| Age Bracket | Male | Female |
| Under 5 Years | 267 (100.0%) | 203 (100.0%) |
| 5 Years | 41 (100.0%) | 121 (100.0%) |
| 6 to 11 Years | 659 (100.0%) | 440 (88.5%) |
| 12 to 14 Years | 134 (100.0%) | 156 (100.0%) |
| 15 Years | 71 (100.0%) | 54 (100.0%) |
| 16 and 17 Years | 141 (98.6%) | 123 (98.4%) |
| 18 to 24 Years | 172 (98.3%) | 418 (98.6%) |
| 25 to 34 Years | 97 (99.0%) | 83 (90.2%) |
| 35 to 44 Years | 529 (98.5%) | 583 (97.0%) |
| 45 to 54 Years | 461 (100.0%) | 676 (100.0%) |
| 55 to 64 Years | 822 (97.7%) | 640 (95.8%) |
| 65 to 74 Years | 432 (99.1%) | 452 (99.1%) |
| 75 Years and over | 391 (100.0%) | 457 (99.4%) |
| Total | 4,217 (99.1%) | 4,406 (97.2%) |
Income Below Poverty Among Married-Couple Families in Glencoe
The poverty statistics for married-couple families in Glencoe show that 0.9% or 21 of the total 2,412 families live below the poverty line. Families with no children have the highest poverty rate of 1.4%, comprising of 19 families. On the other hand, families with 3 or 4 children have the lowest poverty rate of 0.0%, which includes 0 families.
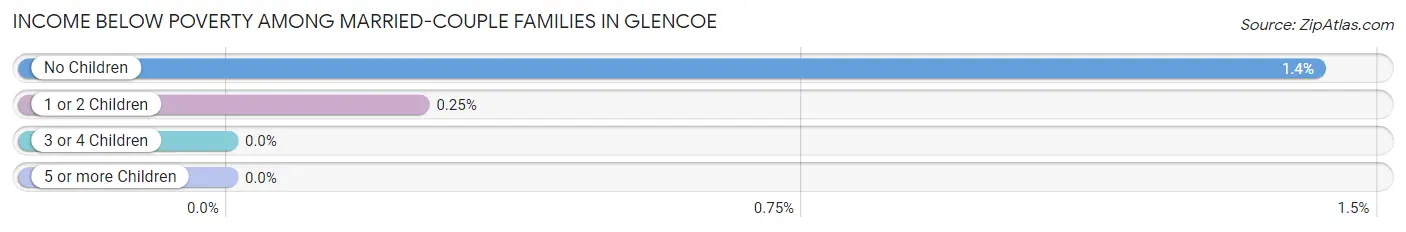
| Children | Above Poverty | Below Poverty |
| No Children | 1,316 (98.6%) | 19 (1.4%) |
| 1 or 2 Children | 800 (99.8%) | 2 (0.3%) |
| 3 or 4 Children | 275 (100.0%) | 0 (0.0%) |
| 5 or more Children | 0 (0.0%) | 0 (0.0%) |
| Total | 2,391 (99.1%) | 21 (0.9%) |
Income Below Poverty Among Single-Parent Households in Glencoe
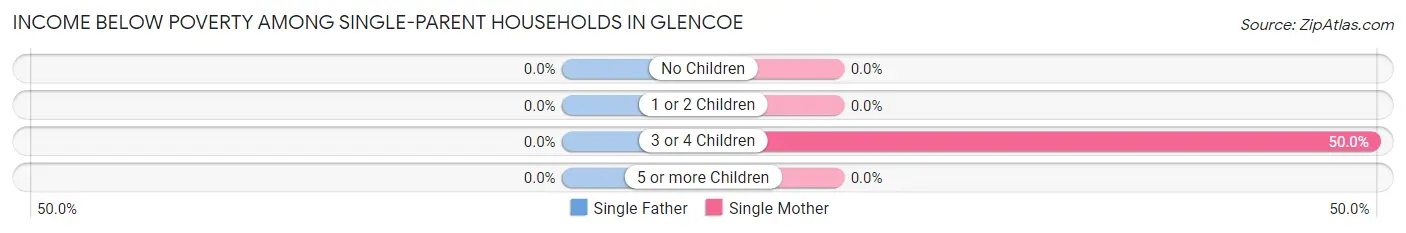
| Children | Single Father | Single Mother |
| No Children | 0 (0.0%) | 0 (0.0%) |
| 1 or 2 Children | 0 (0.0%) | 0 (0.0%) |
| 3 or 4 Children | 0 (0.0%) | 18 (50.0%) |
| 5 or more Children | 0 (0.0%) | 0 (0.0%) |
| Total | 0 (0.0%) | 18 (10.6%) |
Income Below Poverty Among Married-Couple vs Single-Parent Households in Glencoe
The poverty data for Glencoe shows that 21 of the married-couple family households (0.9%) and 18 of the single-parent households (7.8%) are living below the poverty level. Within the married-couple family households, those with no children have the highest poverty rate, with 19 households (1.4%) falling below the poverty line. Among the single-parent households, those with 3 or 4 children have the highest poverty rate, with 18 household (50.0%) living below poverty.
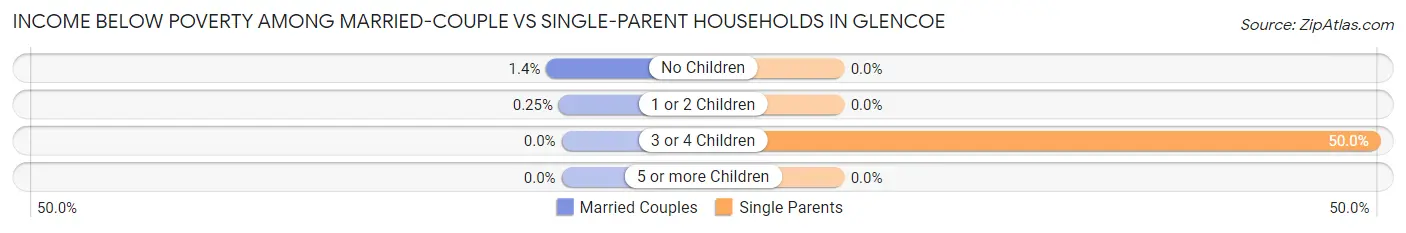
| Children | Married-Couple Families | Single-Parent Households |
| No Children | 19 (1.4%) | 0 (0.0%) |
| 1 or 2 Children | 2 (0.3%) | 0 (0.0%) |
| 3 or 4 Children | 0 (0.0%) | 18 (50.0%) |
| 5 or more Children | 0 (0.0%) | 0 (0.0%) |
| Total | 21 (0.9%) | 18 (7.8%) |
Race in Glencoe
The most populous races in Glencoe are White / Caucasian (8,249 | 93.9%), Asian (191 | 2.2%), and Hispanic or Latino (189 | 2.1%).
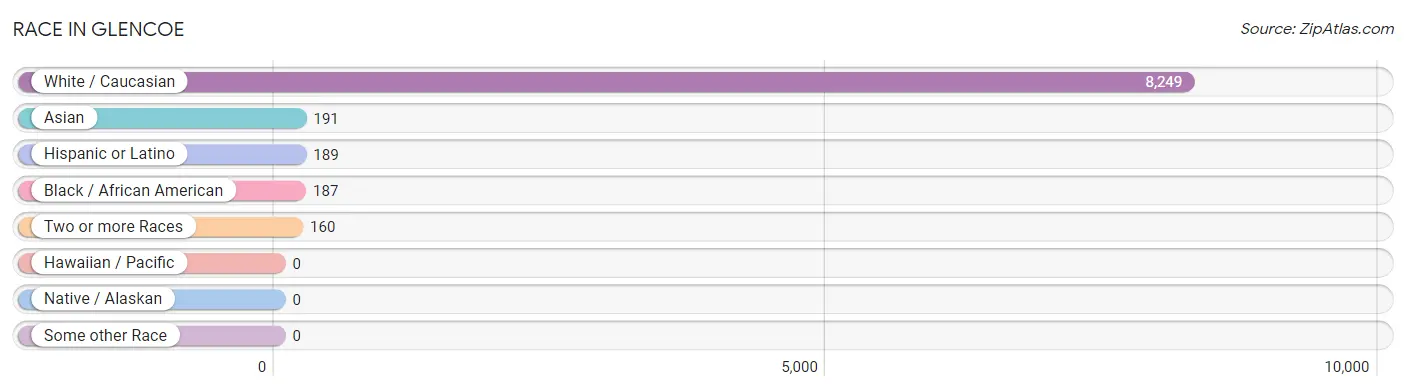
| Race | # Population | % Population |
| Asian | 191 | 2.2% |
| Black / African American | 187 | 2.1% |
| Hawaiian / Pacific | 0 | 0.0% |
| Hispanic or Latino | 189 | 2.1% |
| Native / Alaskan | 0 | 0.0% |
| White / Caucasian | 8,249 | 93.9% |
| Two or more Races | 160 | 1.8% |
| Some other Race | 0 | 0.0% |
| Total | 8,787 | 100.0% |
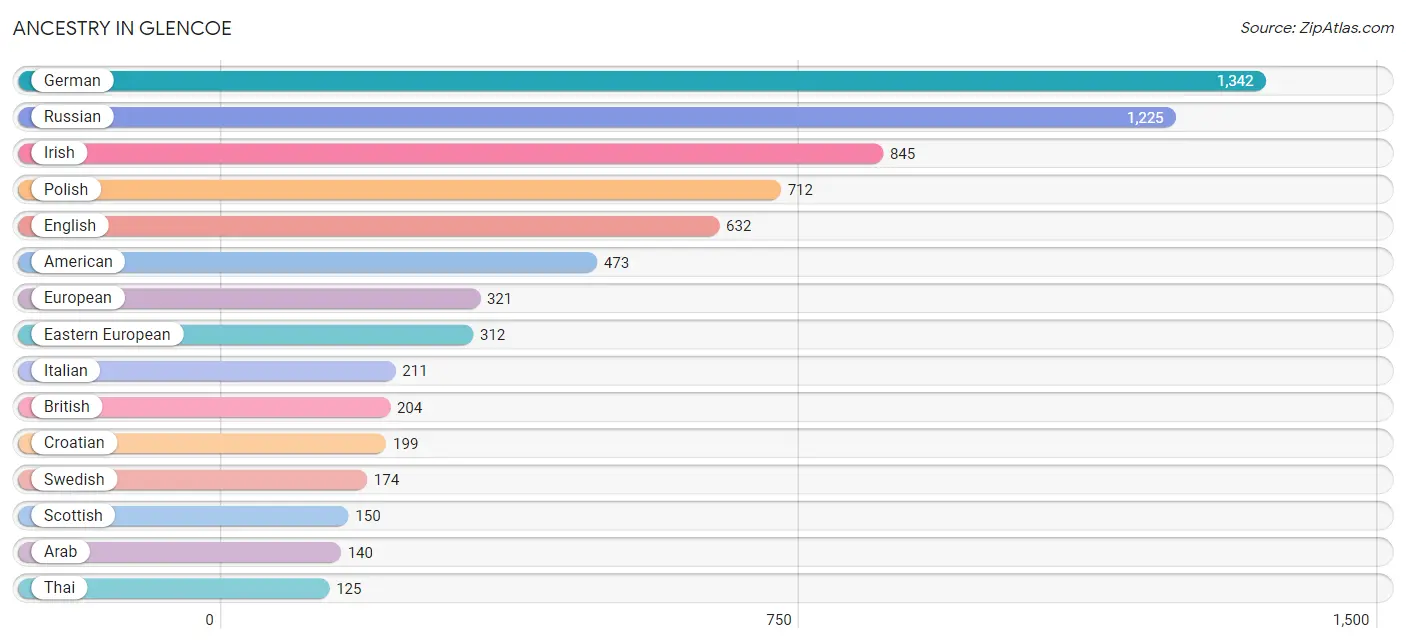
Ancestry in Glencoe
The most populous ancestries reported in Glencoe are German (1,342 | 15.3%), Russian (1,225 | 13.9%), Irish (845 | 9.6%), Polish (712 | 8.1%), and English (632 | 7.2%), together accounting for 54.1% of all Glencoe residents.
| Ancestry | # Population | % Population |
| African | 4 | 0.1% |
| American | 473 | 5.4% |
| Arab | 140 | 1.6% |
| Armenian | 55 | 0.6% |
| Assyrian / Chaldean / Syriac | 5 | 0.1% |
| Austrian | 47 | 0.5% |
| Belgian | 24 | 0.3% |
| Bhutanese | 8 | 0.1% |
| British | 204 | 2.3% |
| Burmese | 25 | 0.3% |
| Canadian | 12 | 0.1% |
| Central American Indian | 11 | 0.1% |
| Cherokee | 8 | 0.1% |
| Croatian | 199 | 2.3% |
| Czech | 13 | 0.2% |
| Czechoslovakian | 22 | 0.3% |
| Danish | 57 | 0.6% |
| Dutch | 19 | 0.2% |
| Eastern European | 312 | 3.5% |
| Ecuadorian | 7 | 0.1% |
| Egyptian | 30 | 0.3% |
| English | 632 | 7.2% |
| European | 321 | 3.6% |
| French | 58 | 0.7% |
| French Canadian | 16 | 0.2% |
| German | 1,342 | 15.3% |
| Greek | 38 | 0.4% |
| Hungarian | 60 | 0.7% |
| Icelander | 7 | 0.1% |
| Indian (Asian) | 14 | 0.2% |
| Iraqi | 9 | 0.1% |
| Irish | 845 | 9.6% |
| Israeli | 23 | 0.3% |
| Italian | 211 | 2.4% |
| Korean | 90 | 1.0% |
| Lithuanian | 105 | 1.2% |
| Luxembourger | 39 | 0.4% |
| Mexican | 108 | 1.2% |
| Mexican American Indian | 11 | 0.1% |
| Northern European | 63 | 0.7% |
| Norwegian | 6 | 0.1% |
| Polish | 712 | 8.1% |
| Portuguese | 90 | 1.0% |
| Puerto Rican | 69 | 0.8% |
| Romanian | 78 | 0.9% |
| Russian | 1,225 | 13.9% |
| Scandinavian | 13 | 0.2% |
| Scotch-Irish | 40 | 0.5% |
| Scottish | 150 | 1.7% |
| Serbian | 14 | 0.2% |
| Slovak | 12 | 0.1% |
| Slovene | 9 | 0.1% |
| South American | 7 | 0.1% |
| Spaniard | 1 | 0.0% |
| Subsaharan African | 4 | 0.1% |
| Swedish | 174 | 2.0% |
| Swiss | 12 | 0.1% |
| Syrian | 22 | 0.3% |
| Thai | 125 | 1.4% |
| Turkish | 24 | 0.3% |
| Ukrainian | 125 | 1.4% |
| Welsh | 4 | 0.1% | View All 62 Rows |
Immigrants in Glencoe
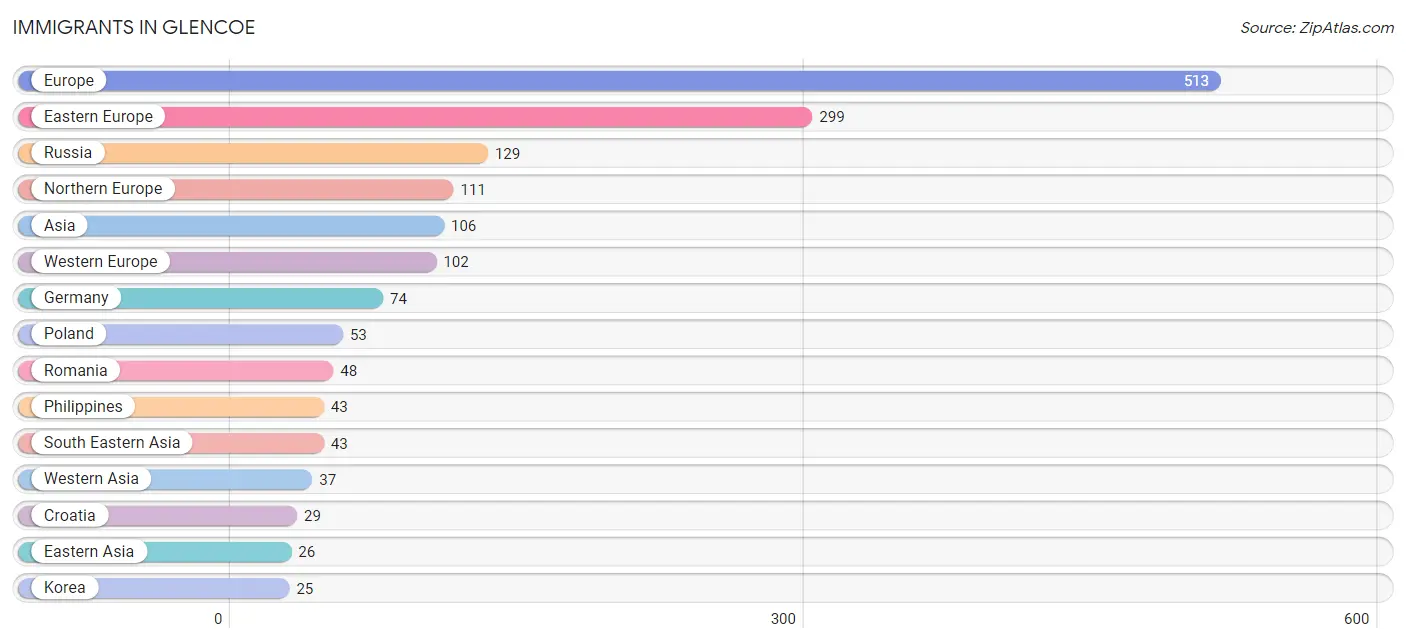
The most numerous immigrant groups reported in Glencoe came from Europe (513 | 5.8%), Eastern Europe (299 | 3.4%), Russia (129 | 1.5%), Northern Europe (111 | 1.3%), and Asia (106 | 1.2%), together accounting for 13.2% of all Glencoe residents.
| Immigration Origin | # Population | % Population |
| Africa | 6 | 0.1% |
| Argentina | 4 | 0.1% |
| Asia | 106 | 1.2% |
| Australia | 3 | 0.0% |
| Austria | 13 | 0.2% |
| Belarus | 3 | 0.0% |
| Belgium | 12 | 0.1% |
| Bosnia and Herzegovina | 5 | 0.1% |
| Canada | 24 | 0.3% |
| Central America | 4 | 0.1% |
| China | 1 | 0.0% |
| Croatia | 29 | 0.3% |
| Eastern Africa | 2 | 0.0% |
| Eastern Asia | 26 | 0.3% |
| Eastern Europe | 299 | 3.4% |
| Egypt | 4 | 0.1% |
| Europe | 513 | 5.8% |
| Germany | 74 | 0.8% |
| Iraq | 5 | 0.1% |
| Israel | 18 | 0.2% |
| Korea | 25 | 0.3% |
| Latin America | 8 | 0.1% |
| Mexico | 4 | 0.1% |
| Northern Africa | 4 | 0.1% |
| Northern Europe | 111 | 1.3% |
| Oceania | 3 | 0.0% |
| Philippines | 43 | 0.5% |
| Poland | 53 | 0.6% |
| Romania | 48 | 0.5% |
| Russia | 129 | 1.5% |
| Serbia | 4 | 0.1% |
| South America | 4 | 0.1% |
| South Eastern Asia | 43 | 0.5% |
| Southern Europe | 1 | 0.0% |
| Spain | 1 | 0.0% |
| Switzerland | 3 | 0.0% |
| Taiwan | 1 | 0.0% |
| Turkey | 14 | 0.2% |
| Western Asia | 37 | 0.4% |
| Western Europe | 102 | 1.2% |
| Zimbabwe | 2 | 0.0% | View All 41 Rows |
Sex and Age in Glencoe
Sex and Age in Glencoe
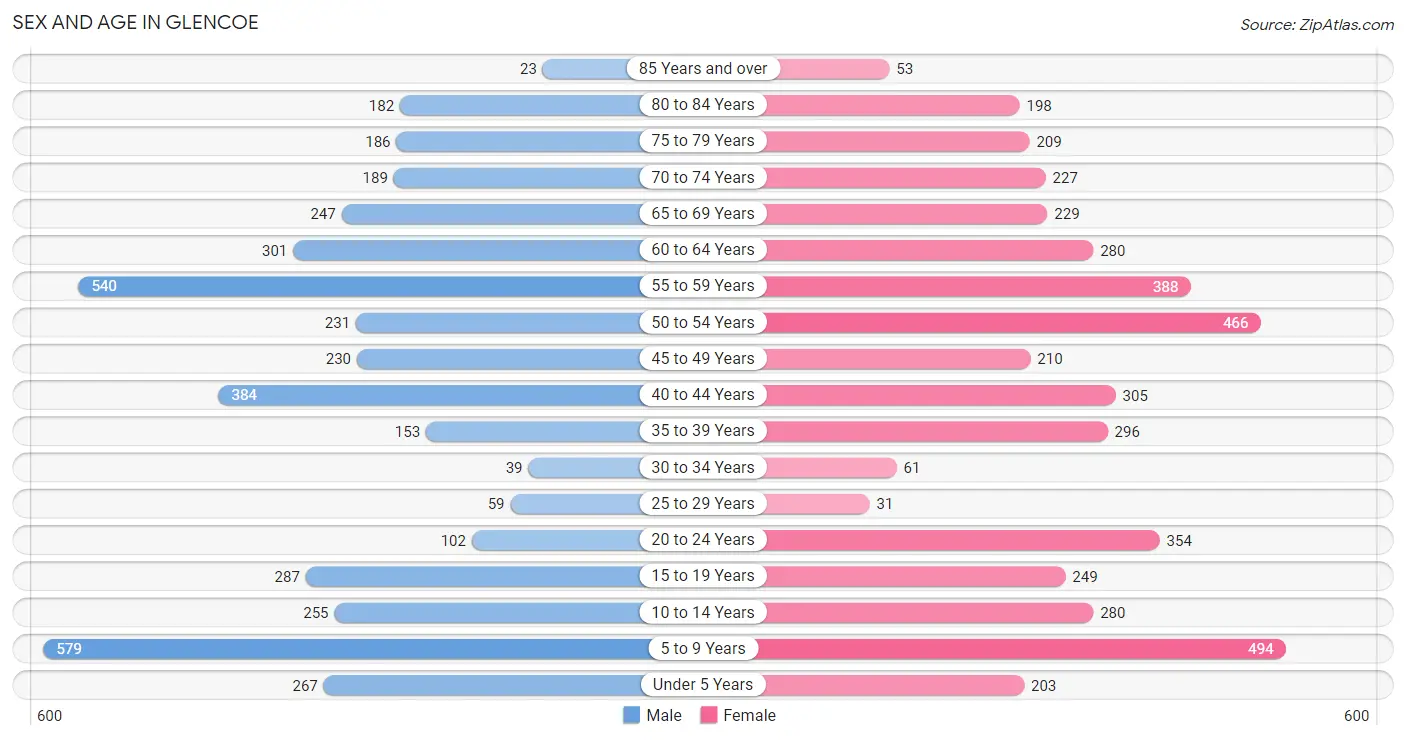
The most populous age groups in Glencoe are 5 to 9 Years (579 | 13.6%) for men and 5 to 9 Years (494 | 10.9%) for women.
| Age Bracket | Male | Female |
| Under 5 Years | 267 (6.3%) | 203 (4.5%) |
| 5 to 9 Years | 579 (13.6%) | 494 (10.9%) |
| 10 to 14 Years | 255 (6.0%) | 280 (6.2%) |
| 15 to 19 Years | 287 (6.8%) | 249 (5.5%) |
| 20 to 24 Years | 102 (2.4%) | 354 (7.8%) |
| 25 to 29 Years | 59 (1.4%) | 31 (0.7%) |
| 30 to 34 Years | 39 (0.9%) | 61 (1.3%) |
| 35 to 39 Years | 153 (3.6%) | 296 (6.5%) |
| 40 to 44 Years | 384 (9.0%) | 305 (6.7%) |
| 45 to 49 Years | 230 (5.4%) | 210 (4.6%) |
| 50 to 54 Years | 231 (5.4%) | 466 (10.3%) |
| 55 to 59 Years | 540 (12.7%) | 388 (8.6%) |
| 60 to 64 Years | 301 (7.1%) | 280 (6.2%) |
| 65 to 69 Years | 247 (5.8%) | 229 (5.1%) |
| 70 to 74 Years | 189 (4.4%) | 227 (5.0%) |
| 75 to 79 Years | 186 (4.4%) | 209 (4.6%) |
| 80 to 84 Years | 182 (4.3%) | 198 (4.4%) |
| 85 Years and over | 23 (0.5%) | 53 (1.2%) |
| Total | 4,254 (100.0%) | 4,533 (100.0%) |
Families and Households in Glencoe
Median Family Size in Glencoe
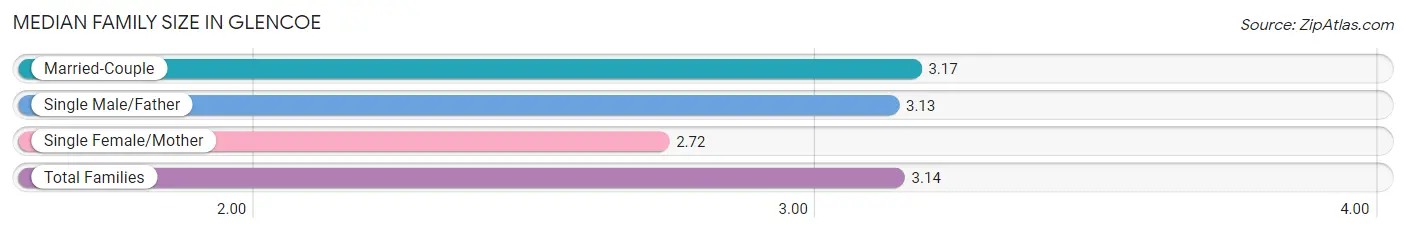
The median family size in Glencoe is 3.14 persons per family, with married-couple families (2,412 | 91.3%) accounting for the largest median family size of 3.17 persons per family. On the other hand, single female/mother families (170 | 6.4%) represent the smallest median family size with 2.72 persons per family.
| Family Type | # Families | Family Size |
| Married-Couple | 2,412 (91.3%) | 3.17 |
| Single Male/Father | 60 (2.3%) | 3.13 |
| Single Female/Mother | 170 (6.4%) | 2.72 |
| Total Families | 2,642 (100.0%) | 3.14 |
Median Household Size in Glencoe
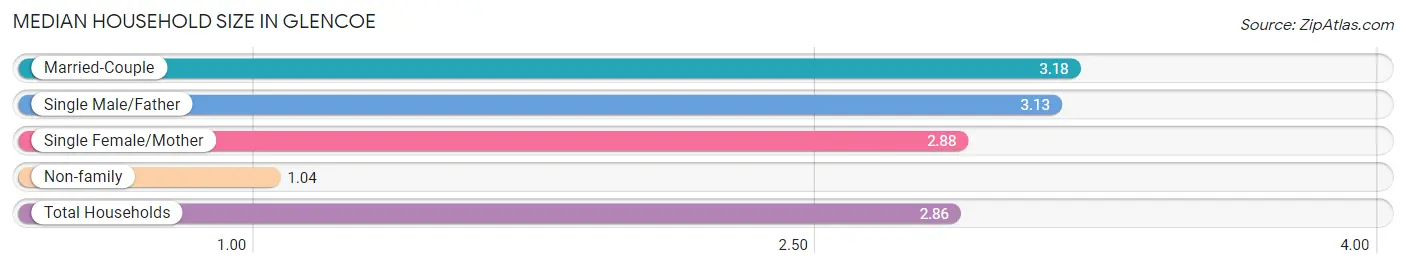
The median household size in Glencoe is 2.86 persons per household, with married-couple households (2,412 | 78.5%) accounting for the largest median household size of 3.18 persons per household. non-family households (430 | 14.0%) represent the smallest median household size with 1.04 persons per household.
| Household Type | # Households | Household Size |
| Married-Couple | 2,412 (78.5%) | 3.18 |
| Single Male/Father | 60 (1.9%) | 3.13 |
| Single Female/Mother | 170 (5.5%) | 2.88 |
| Non-family | 430 (14.0%) | 1.04 |
| Total Households | 3,072 (100.0%) | 2.86 |
Household Size by Marriage Status in Glencoe
Out of a total of 3,072 households in Glencoe, 2,642 (86.0%) are family households, while 430 (14.0%) are nonfamily households. The most numerous type of family households are 2-person households, comprising 1,117, and the most common type of nonfamily households are 1-person households, comprising 413.
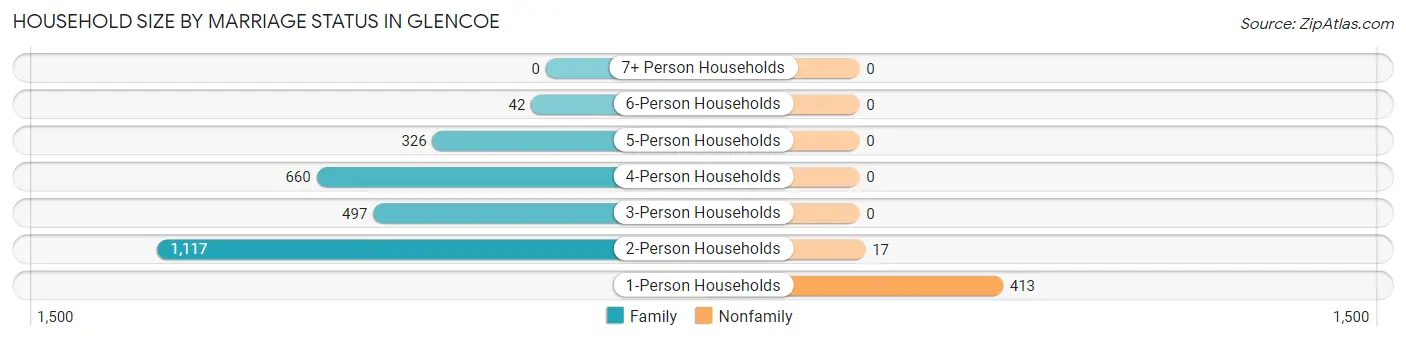
| Household Size | Family Households | Nonfamily Households |
| 1-Person Households | - | 413 (13.4%) |
| 2-Person Households | 1,117 (36.4%) | 17 (0.5%) |
| 3-Person Households | 497 (16.2%) | 0 (0.0%) |
| 4-Person Households | 660 (21.5%) | 0 (0.0%) |
| 5-Person Households | 326 (10.6%) | 0 (0.0%) |
| 6-Person Households | 42 (1.4%) | 0 (0.0%) |
| 7+ Person Households | 0 (0.0%) | 0 (0.0%) |
| Total | 2,642 (86.0%) | 430 (14.0%) |
Female Fertility in Glencoe
Fertility by Age in Glencoe
Average fertility rate in Glencoe is 45.0 births per 1,000 women. Women in the age bracket of 35 to 50 years have the highest fertility rate with 60.0 births per 1,000 women. Women in the age bracket of 35 to 50 years acount for 73.9% of all women with births.
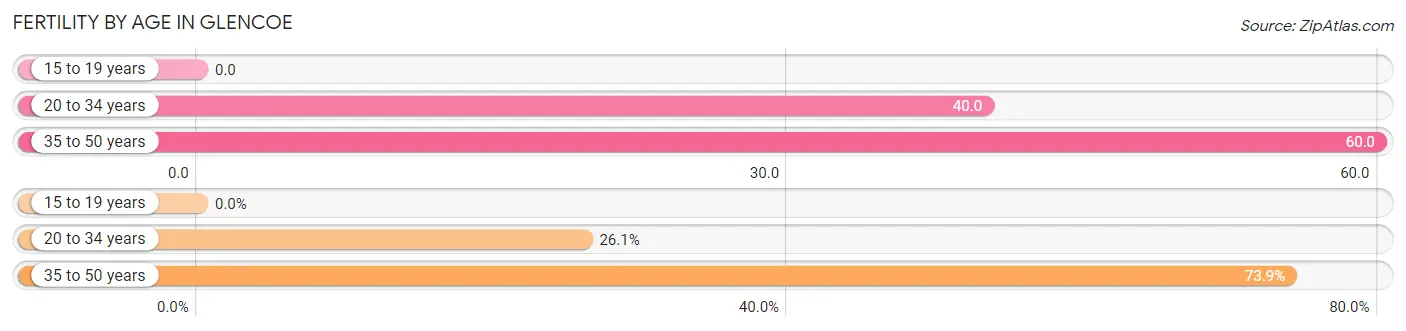
| Age Bracket | Women with Births | Births / 1,000 Women |
| 15 to 19 years | 0 (0.0%) | 0.0 |
| 20 to 34 years | 18 (26.1%) | 40.0 |
| 35 to 50 years | 51 (73.9%) | 60.0 |
| Total | 69 (100.0%) | 45.0 |
Fertility by Age by Marriage Status in Glencoe
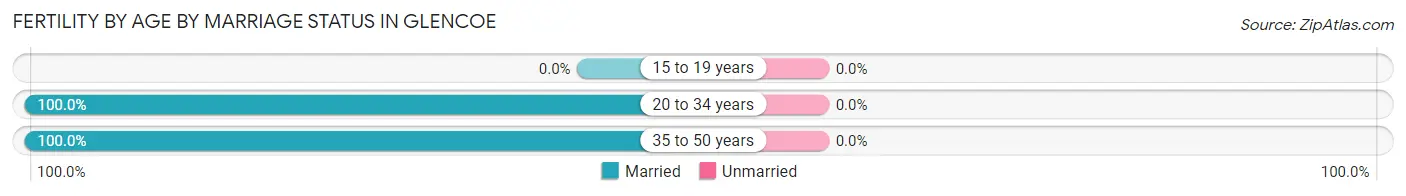
| Age Bracket | Married | Unmarried |
| 15 to 19 years | 0 (0.0%) | 0 (0.0%) |
| 20 to 34 years | 18 (100.0%) | 0 (0.0%) |
| 35 to 50 years | 51 (100.0%) | 0 (0.0%) |
| Total | 69 (100.0%) | 0 (0.0%) |
Fertility by Education in Glencoe
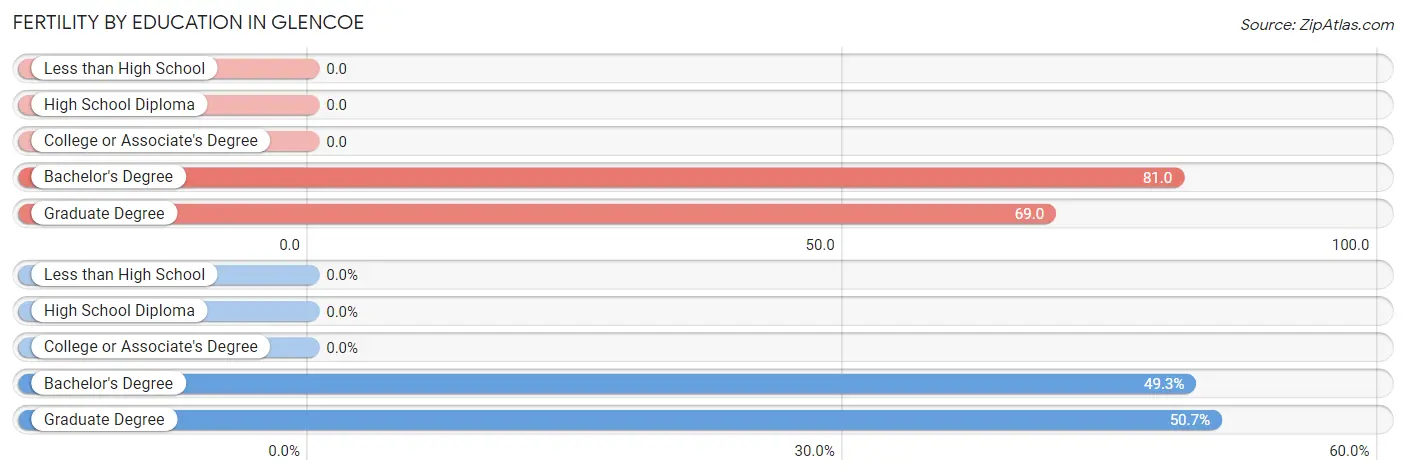
| Educational Attainment | Women with Births | Births / 1,000 Women |
| Less than High School | 0 (0.0%) | 0.0 |
| High School Diploma | 0 (0.0%) | 0.0 |
| College or Associate's Degree | 0 (0.0%) | 0.0 |
| Bachelor's Degree | 34 (49.3%) | 81.0 |
| Graduate Degree | 35 (50.7%) | 69.0 |
| Total | 69 (100.0%) | 45.0 |
Fertility by Education by Marriage Status in Glencoe
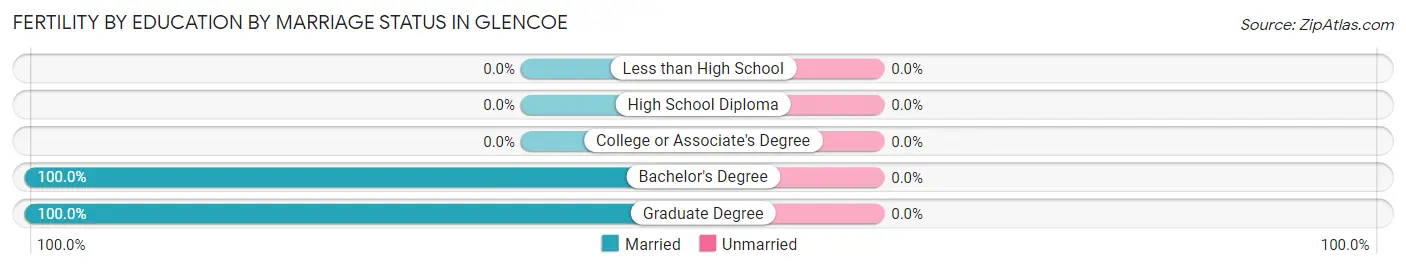
| Educational Attainment | Married | Unmarried |
| Less than High School | 0 (0.0%) | 0 (0.0%) |
| High School Diploma | 0 (0.0%) | 0 (0.0%) |
| College or Associate's Degree | 0 (0.0%) | 0 (0.0%) |
| Bachelor's Degree | 34 (100.0%) | 0 (0.0%) |
| Graduate Degree | 35 (100.0%) | 0 (0.0%) |
| Total | 69 (100.0%) | 0 (0.0%) |
Employment Characteristics in Glencoe
Employment by Class of Employer in Glencoe
Among the 3,301 employed individuals in Glencoe, private company employees (1,878 | 56.9%), not-for-profit organizations (513 | 15.5%), and self-employed (incorporated) (408 | 12.4%) make up the most common classes of employment.
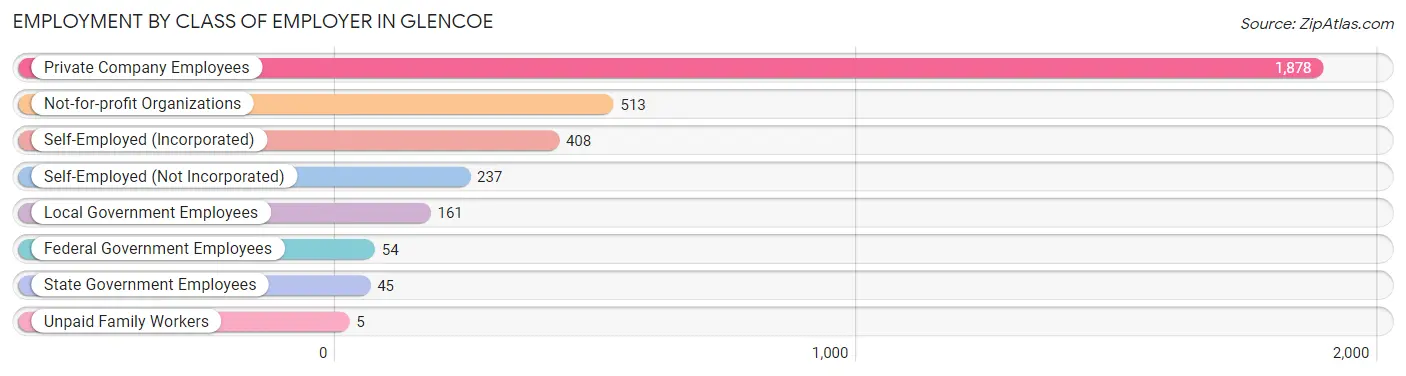
| Employer Class | # Employees | % Employees |
| Private Company Employees | 1,878 | 56.9% |
| Self-Employed (Incorporated) | 408 | 12.4% |
| Self-Employed (Not Incorporated) | 237 | 7.2% |
| Not-for-profit Organizations | 513 | 15.5% |
| Local Government Employees | 161 | 4.9% |
| State Government Employees | 45 | 1.4% |
| Federal Government Employees | 54 | 1.6% |
| Unpaid Family Workers | 5 | 0.2% |
| Total | 3,301 | 100.0% |
Employment Status by Age in Glencoe
According to the labor force statistics for Glencoe, out of the total population over 16 years of age (6,584), 52.5% or 3,457 individuals are in the labor force, with 3.9% or 135 of them unemployed. The age group with the highest labor force participation rate is 35 to 44 years, with 84.1% or 957 individuals in the labor force. Within the labor force, the 25 to 29 years age range has the highest percentage of unemployed individuals, with 29.8% or 17 of them being unemployed.
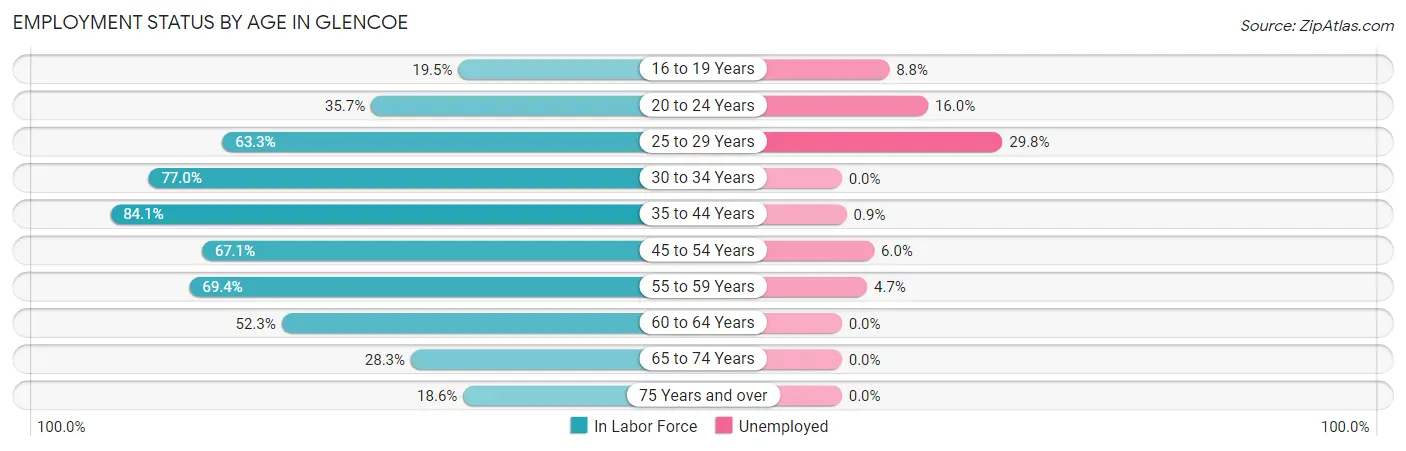
| Age Bracket | In Labor Force | Unemployed |
| 16 to 19 Years | 80 (19.5%) | 7 (8.8%) |
| 20 to 24 Years | 163 (35.7%) | 26 (16.0%) |
| 25 to 29 Years | 57 (63.3%) | 17 (29.8%) |
| 30 to 34 Years | 77 (77.0%) | 0 (0.0%) |
| 35 to 44 Years | 957 (84.1%) | 9 (0.9%) |
| 45 to 54 Years | 763 (67.1%) | 46 (6.0%) |
| 55 to 59 Years | 644 (69.4%) | 30 (4.7%) |
| 60 to 64 Years | 304 (52.3%) | 0 (0.0%) |
| 65 to 74 Years | 252 (28.3%) | 0 (0.0%) |
| 75 Years and over | 158 (18.6%) | 0 (0.0%) |
| Total | 3,457 (52.5%) | 135 (3.9%) |
Employment Status by Educational Attainment in Glencoe
According to labor force statistics for Glencoe, 70.5% of individuals (2,802) out of the total population between 25 and 64 years of age (3,974) are in the labor force, with 3.6% or 101 of them being unemployed. The group with the highest labor force participation rate are those with the educational attainment of college / associate degree, with 87.4% or 297 individuals in the labor force. Within the labor force, individuals with college / associate degree education have the highest percentage of unemployment, with 6.1% or 18 of them being unemployed.
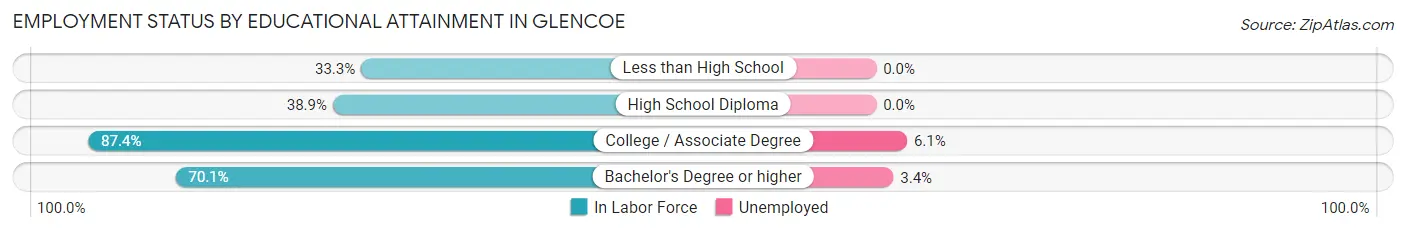
| Educational Attainment | In Labor Force | Unemployed |
| Less than High School | 1 (33.3%) | 0 (0.0%) |
| High School Diploma | 51 (38.9%) | 0 (0.0%) |
| College / Associate Degree | 297 (87.4%) | 21 (6.1%) |
| Bachelor's Degree or higher | 2,453 (70.1%) | 119 (3.4%) |
| Total | 2,802 (70.5%) | 143 (3.6%) |
Employment Occupations by Sex in Glencoe
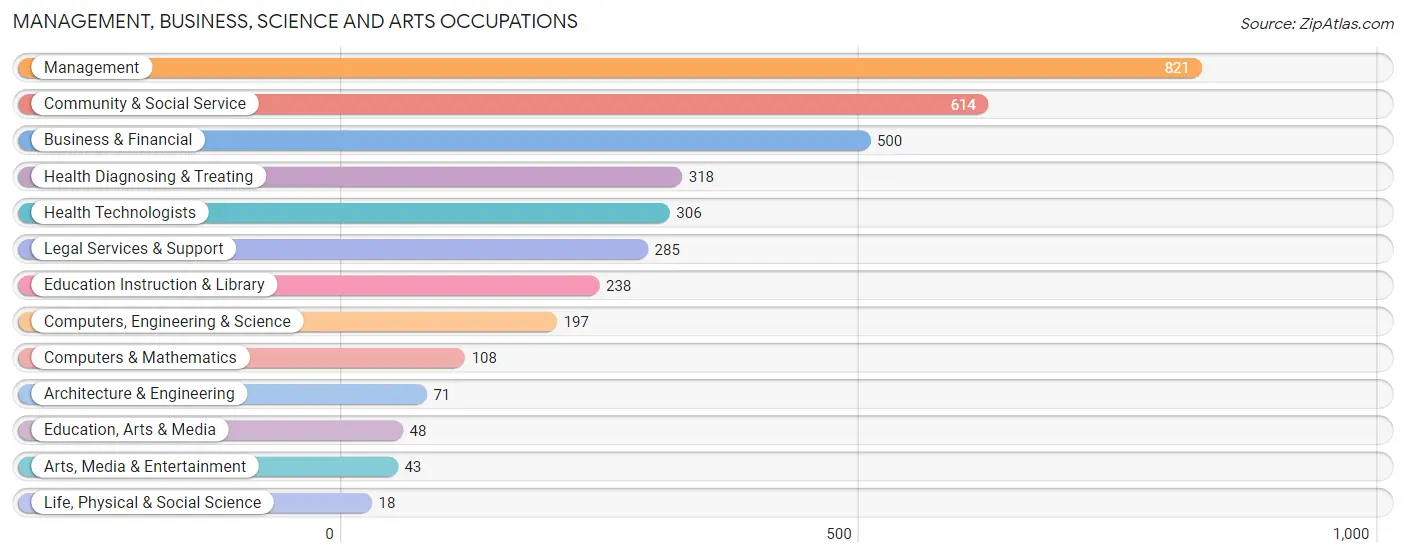
Management, Business, Science and Arts Occupations
The most common Management, Business, Science and Arts occupations in Glencoe are Management (821 | 24.7%), Community & Social Service (614 | 18.5%), Business & Financial (500 | 15.1%), Health Diagnosing & Treating (318 | 9.6%), and Health Technologists (306 | 9.2%).
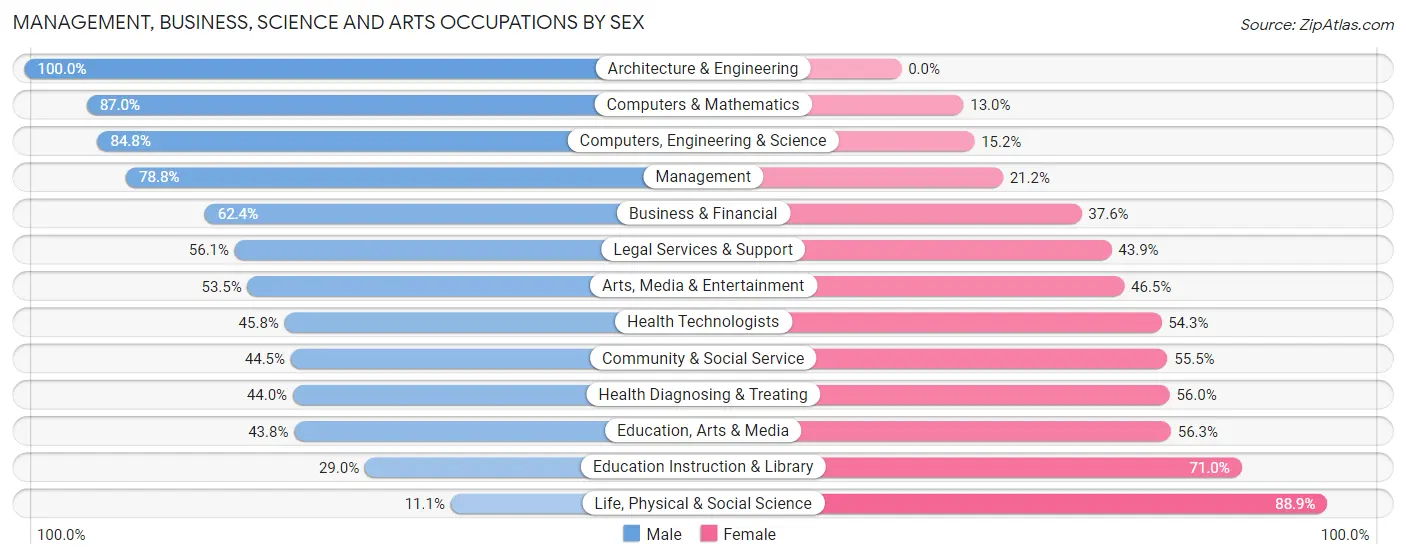
Management, Business, Science and Arts Occupations by Sex
Within the Management, Business, Science and Arts occupations in Glencoe, the most male-oriented occupations are Architecture & Engineering (100.0%), Computers & Mathematics (87.0%), and Computers, Engineering & Science (84.8%), while the most female-oriented occupations are Life, Physical & Social Science (88.9%), Education Instruction & Library (71.0%), and Education, Arts & Media (56.2%).
| Occupation | Male | Female |
| Management | 647 (78.8%) | 174 (21.2%) |
| Business & Financial | 312 (62.4%) | 188 (37.6%) |
| Computers, Engineering & Science | 167 (84.8%) | 30 (15.2%) |
| Computers & Mathematics | 94 (87.0%) | 14 (13.0%) |
| Architecture & Engineering | 71 (100.0%) | 0 (0.0%) |
| Life, Physical & Social Science | 2 (11.1%) | 16 (88.9%) |
| Community & Social Service | 273 (44.5%) | 341 (55.5%) |
| Education, Arts & Media | 21 (43.8%) | 27 (56.2%) |
| Legal Services & Support | 160 (56.1%) | 125 (43.9%) |
| Education Instruction & Library | 69 (29.0%) | 169 (71.0%) |
| Arts, Media & Entertainment | 23 (53.5%) | 20 (46.5%) |
| Health Diagnosing & Treating | 140 (44.0%) | 178 (56.0%) |
| Health Technologists | 140 (45.8%) | 166 (54.2%) |
| Total (Category) | 1,539 (62.8%) | 911 (37.2%) |
| Total (Overall) | 2,081 (62.7%) | 1,239 (37.3%) |
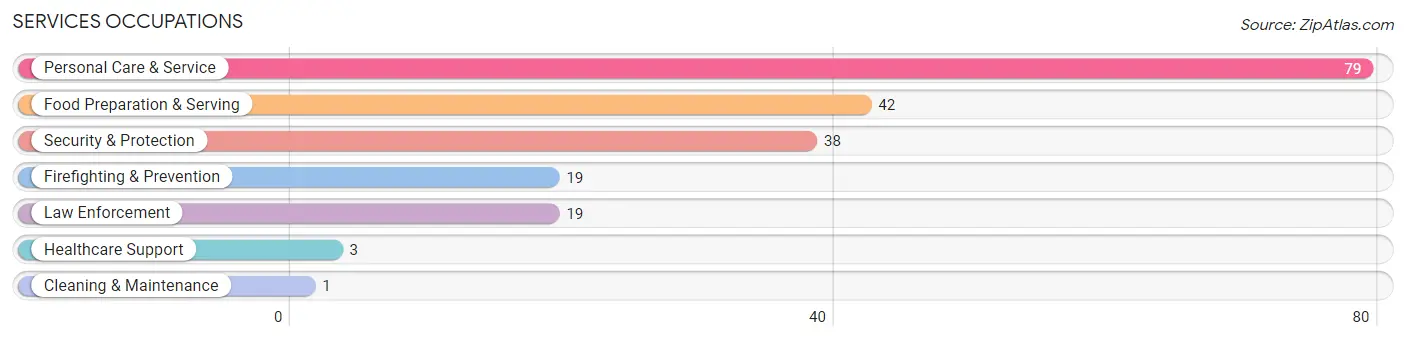
Services Occupations
The most common Services occupations in Glencoe are Personal Care & Service (79 | 2.4%), Food Preparation & Serving (42 | 1.3%), Security & Protection (38 | 1.1%), Firefighting & Prevention (19 | 0.6%), and Law Enforcement (19 | 0.6%).
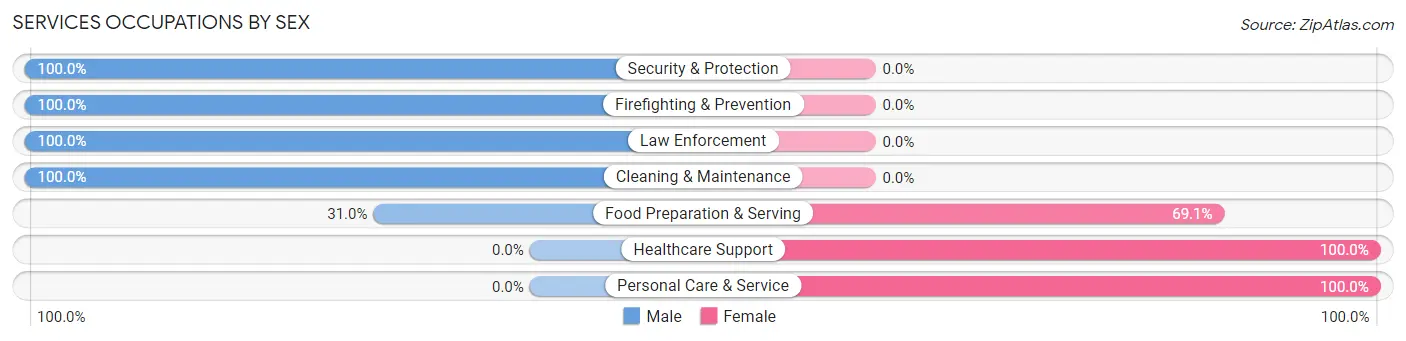
Services Occupations by Sex
Within the Services occupations in Glencoe, the most male-oriented occupations are Security & Protection (100.0%), Firefighting & Prevention (100.0%), and Law Enforcement (100.0%), while the most female-oriented occupations are Healthcare Support (100.0%), Personal Care & Service (100.0%), and Food Preparation & Serving (69.1%).
| Occupation | Male | Female |
| Healthcare Support | 0 (0.0%) | 3 (100.0%) |
| Security & Protection | 38 (100.0%) | 0 (0.0%) |
| Firefighting & Prevention | 19 (100.0%) | 0 (0.0%) |
| Law Enforcement | 19 (100.0%) | 0 (0.0%) |
| Food Preparation & Serving | 13 (30.9%) | 29 (69.1%) |
| Cleaning & Maintenance | 1 (100.0%) | 0 (0.0%) |
| Personal Care & Service | 0 (0.0%) | 79 (100.0%) |
| Total (Category) | 52 (31.9%) | 111 (68.1%) |
| Total (Overall) | 2,081 (62.7%) | 1,239 (37.3%) |
Sales and Office Occupations
The most common Sales and Office occupations in Glencoe are Sales & Related (480 | 14.5%), and Office & Administration (80 | 2.4%).
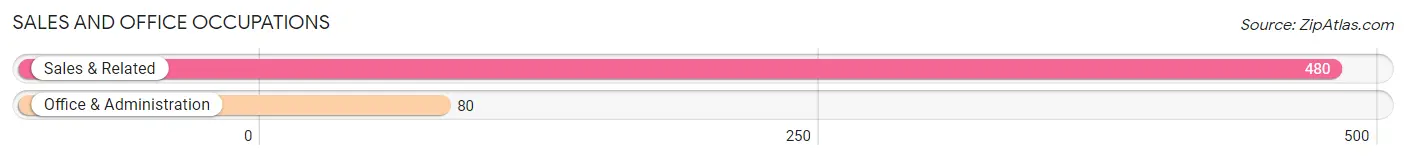
Sales and Office Occupations by Sex
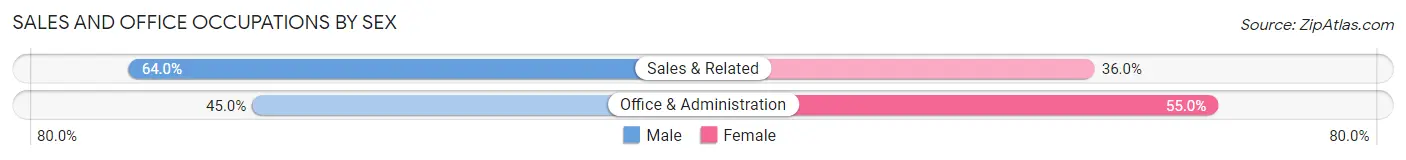
| Occupation | Male | Female |
| Sales & Related | 307 (64.0%) | 173 (36.0%) |
| Office & Administration | 36 (45.0%) | 44 (55.0%) |
| Total (Category) | 343 (61.3%) | 217 (38.8%) |
| Total (Overall) | 2,081 (62.7%) | 1,239 (37.3%) |
Natural Resources, Construction and Maintenance Occupations
The most common Natural Resources, Construction and Maintenance occupations in Glencoe are , and Construction & Extraction (77 | 2.3%).
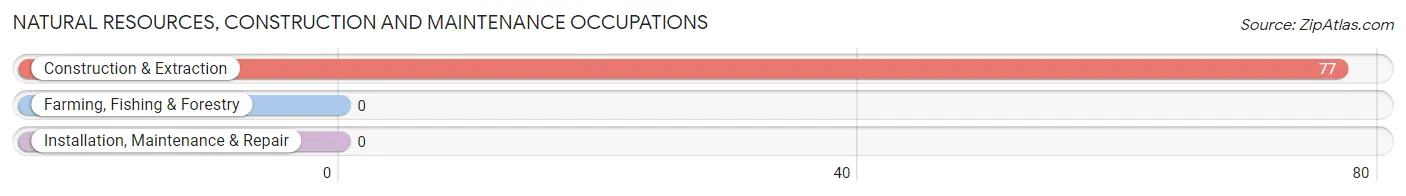
Natural Resources, Construction and Maintenance Occupations by Sex
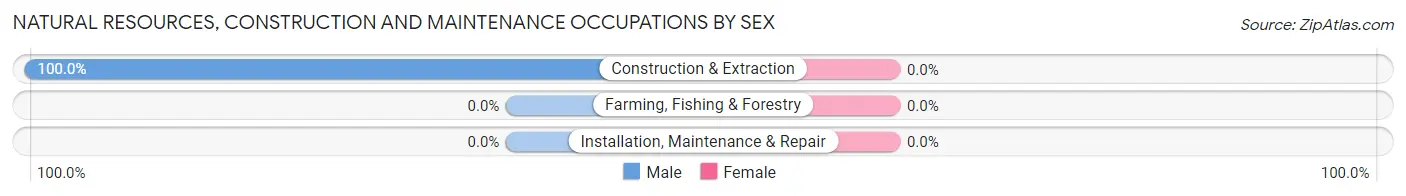
| Occupation | Male | Female |
| Farming, Fishing & Forestry | 0 (0.0%) | 0 (0.0%) |
| Construction & Extraction | 77 (100.0%) | 0 (0.0%) |
| Installation, Maintenance & Repair | 0 (0.0%) | 0 (0.0%) |
| Total (Category) | 77 (100.0%) | 0 (0.0%) |
| Total (Overall) | 2,081 (62.7%) | 1,239 (37.3%) |
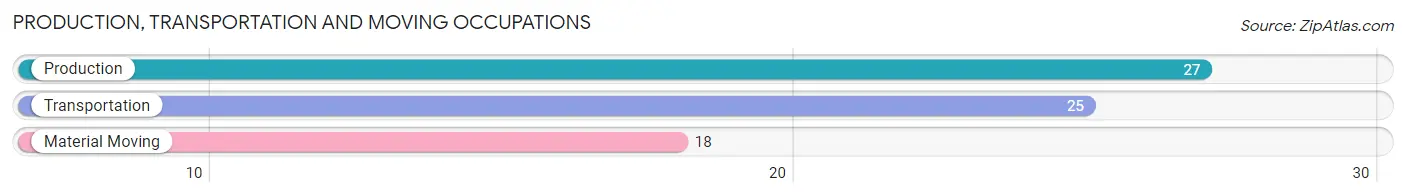
Production, Transportation and Moving Occupations
The most common Production, Transportation and Moving occupations in Glencoe are Production (27 | 0.8%), Transportation (25 | 0.7%), and Material Moving (18 | 0.5%).
Production, Transportation and Moving Occupations by Sex
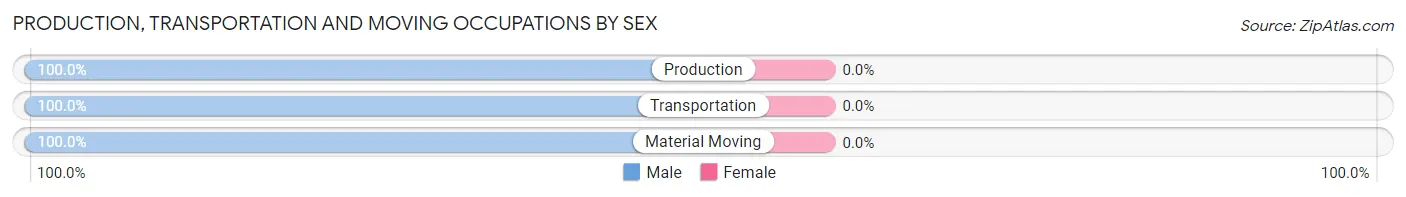
| Occupation | Male | Female |
| Production | 27 (100.0%) | 0 (0.0%) |
| Transportation | 25 (100.0%) | 0 (0.0%) |
| Material Moving | 18 (100.0%) | 0 (0.0%) |
| Total (Category) | 70 (100.0%) | 0 (0.0%) |
| Total (Overall) | 2,081 (62.7%) | 1,239 (37.3%) |
Employment Industries by Sex in Glencoe
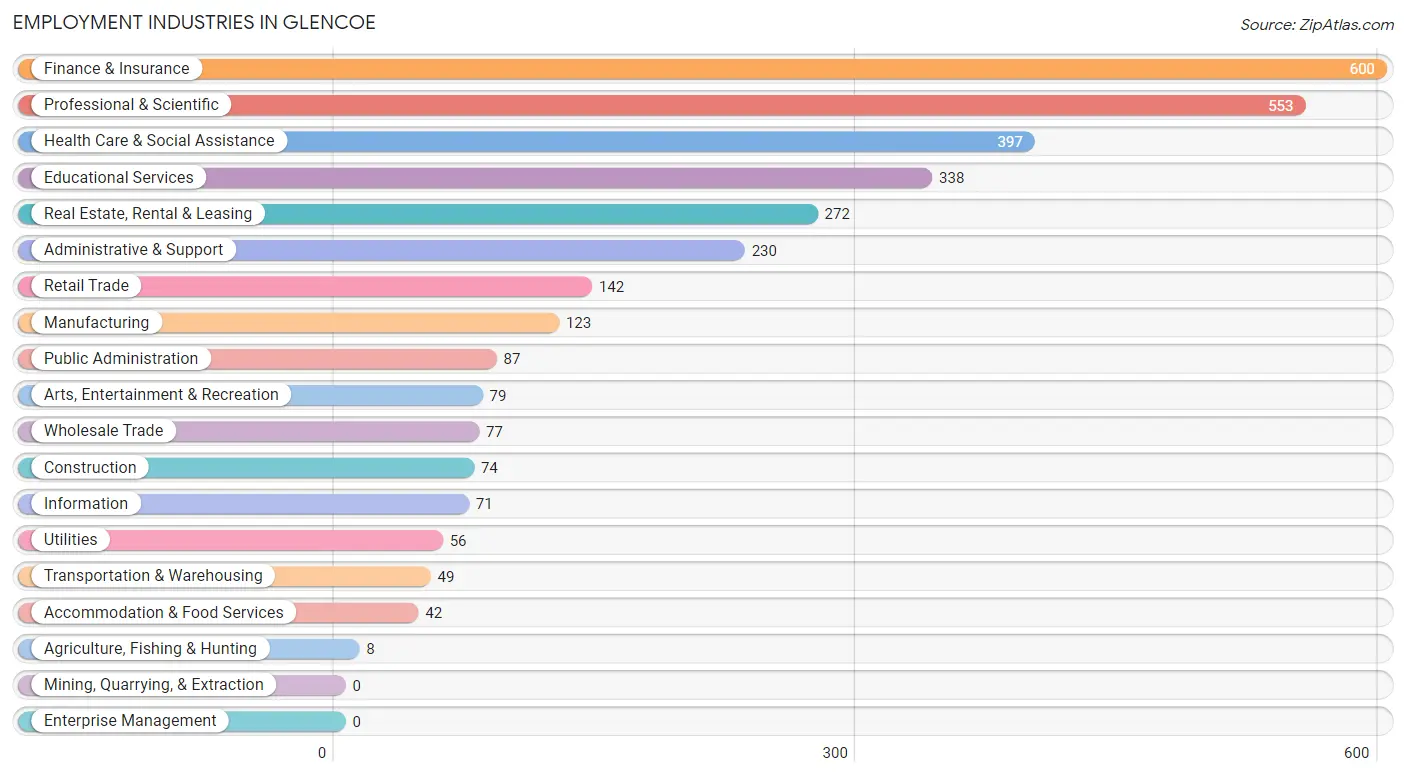
Employment Industries in Glencoe
The major employment industries in Glencoe include Finance & Insurance (600 | 18.1%), Professional & Scientific (553 | 16.7%), Health Care & Social Assistance (397 | 12.0%), Educational Services (338 | 10.2%), and Real Estate, Rental & Leasing (272 | 8.2%).
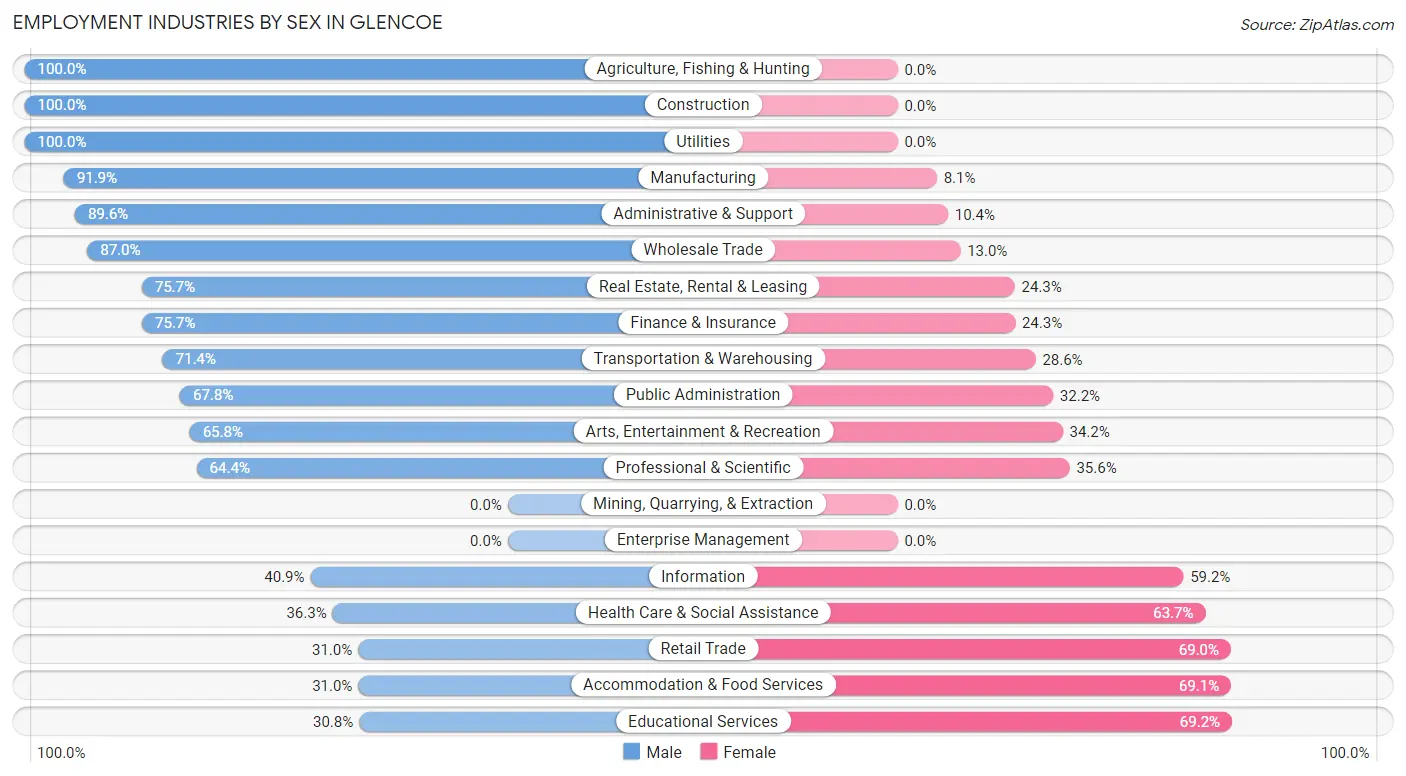
Employment Industries by Sex in Glencoe
The Glencoe industries that see more men than women are Agriculture, Fishing & Hunting (100.0%), Construction (100.0%), and Utilities (100.0%), whereas the industries that tend to have a higher number of women are Educational Services (69.2%), Accommodation & Food Services (69.1%), and Retail Trade (69.0%).
| Industry | Male | Female |
| Agriculture, Fishing & Hunting | 8 (100.0%) | 0 (0.0%) |
| Mining, Quarrying, & Extraction | 0 (0.0%) | 0 (0.0%) |
| Construction | 74 (100.0%) | 0 (0.0%) |
| Manufacturing | 113 (91.9%) | 10 (8.1%) |
| Wholesale Trade | 67 (87.0%) | 10 (13.0%) |
| Retail Trade | 44 (31.0%) | 98 (69.0%) |
| Transportation & Warehousing | 35 (71.4%) | 14 (28.6%) |
| Utilities | 56 (100.0%) | 0 (0.0%) |
| Information | 29 (40.8%) | 42 (59.2%) |
| Finance & Insurance | 454 (75.7%) | 146 (24.3%) |
| Real Estate, Rental & Leasing | 206 (75.7%) | 66 (24.3%) |
| Professional & Scientific | 356 (64.4%) | 197 (35.6%) |
| Enterprise Management | 0 (0.0%) | 0 (0.0%) |
| Administrative & Support | 206 (89.6%) | 24 (10.4%) |
| Educational Services | 104 (30.8%) | 234 (69.2%) |
| Health Care & Social Assistance | 144 (36.3%) | 253 (63.7%) |
| Arts, Entertainment & Recreation | 52 (65.8%) | 27 (34.2%) |
| Accommodation & Food Services | 13 (30.9%) | 29 (69.1%) |
| Public Administration | 59 (67.8%) | 28 (32.2%) |
| Total | 2,081 (62.7%) | 1,239 (37.3%) |
Education in Glencoe
School Enrollment in Glencoe
The most common levels of schooling among the 2,832 students in Glencoe are elementary school (762 | 26.9%), high school (616 | 21.7%), and middle school (367 | 13.0%).
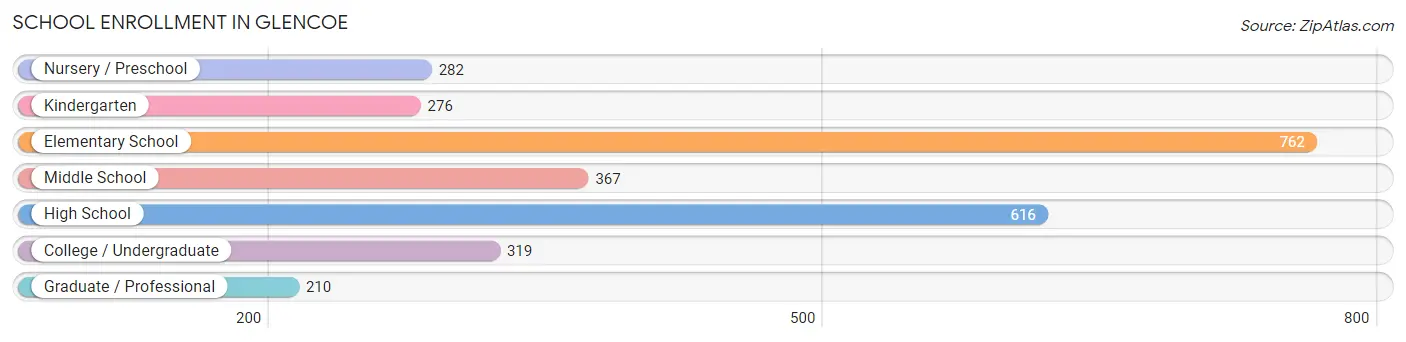
| School Level | # Students | % Students |
| Nursery / Preschool | 282 | 10.0% |
| Kindergarten | 276 | 9.8% |
| Elementary School | 762 | 26.9% |
| Middle School | 367 | 13.0% |
| High School | 616 | 21.7% |
| College / Undergraduate | 319 | 11.3% |
| Graduate / Professional | 210 | 7.4% |
| Total | 2,832 | 100.0% |
School Enrollment by Age by Funding Source in Glencoe
Out of a total of 2,832 students who are enrolled in schools in Glencoe, 906 (32.0%) attend a private institution, while the remaining 1,926 (68.0%) are enrolled in public schools. The age group of 25 to 34 year olds has the highest likelihood of being enrolled in private schools, with 41 (100.0% in the age bracket) enrolled. Conversely, the age group of 10 to 14 year olds has the lowest likelihood of being enrolled in a private school, with 461 (91.1% in the age bracket) attending a public institution.
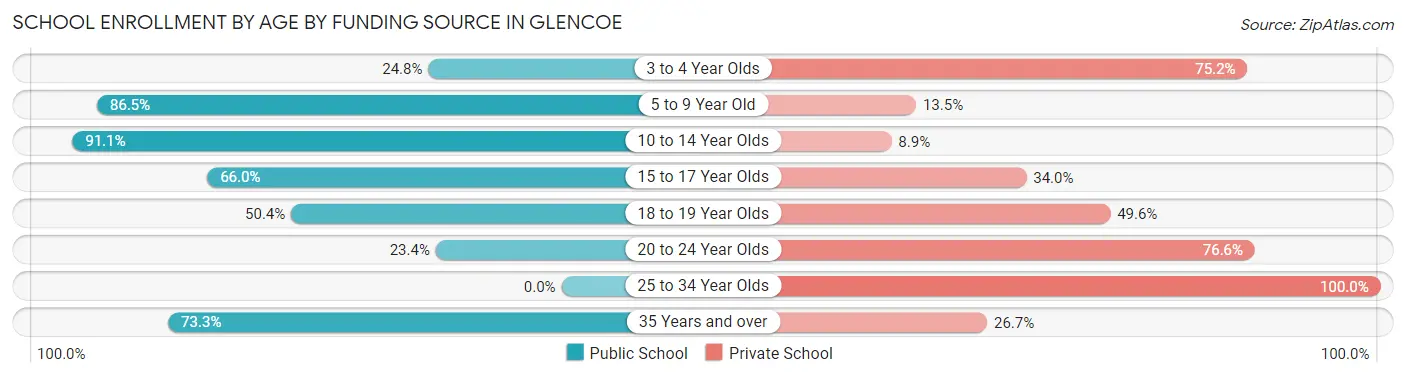
| Age Bracket | Public School | Private School |
| 3 to 4 Year Olds | 61 (24.8%) | 185 (75.2%) |
| 5 to 9 Year Old | 880 (86.5%) | 137 (13.5%) |
| 10 to 14 Year Olds | 461 (91.1%) | 45 (8.9%) |
| 15 to 17 Year Olds | 258 (66.0%) | 133 (34.0%) |
| 18 to 19 Year Olds | 69 (50.4%) | 68 (49.6%) |
| 20 to 24 Year Olds | 78 (23.4%) | 255 (76.6%) |
| 25 to 34 Year Olds | 0 (0.0%) | 41 (100.0%) |
| 35 Years and over | 118 (73.3%) | 43 (26.7%) |
| Total | 1,926 (68.0%) | 906 (32.0%) |
Educational Attainment by Field of Study in Glencoe
Business (1,255 | 23.6%), social sciences (830 | 15.6%), arts & humanities (427 | 8.1%), literature & languages (410 | 7.7%), and education (388 | 7.3%) are the most common fields of study among 5,306 individuals in Glencoe who have obtained a bachelor's degree or higher.
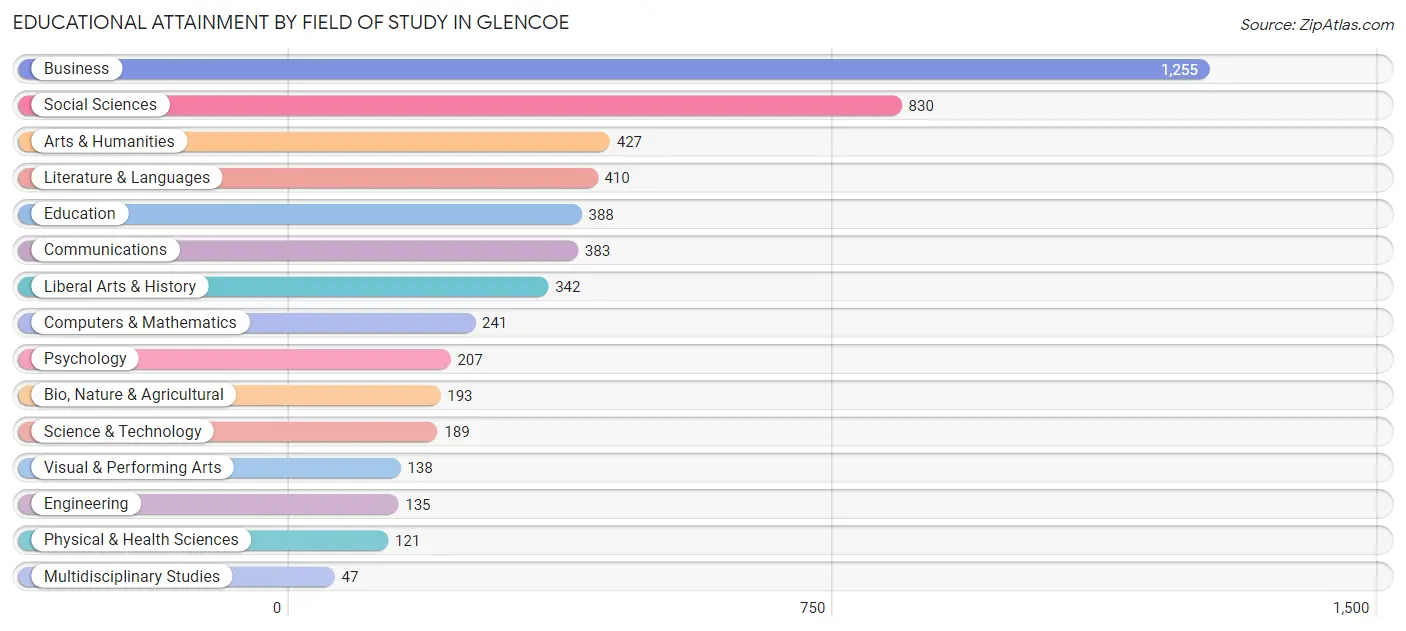
| Field of Study | # Graduates | % Graduates |
| Computers & Mathematics | 241 | 4.5% |
| Bio, Nature & Agricultural | 193 | 3.6% |
| Physical & Health Sciences | 121 | 2.3% |
| Psychology | 207 | 3.9% |
| Social Sciences | 830 | 15.6% |
| Engineering | 135 | 2.5% |
| Multidisciplinary Studies | 47 | 0.9% |
| Science & Technology | 189 | 3.6% |
| Business | 1,255 | 23.6% |
| Education | 388 | 7.3% |
| Literature & Languages | 410 | 7.7% |
| Liberal Arts & History | 342 | 6.5% |
| Visual & Performing Arts | 138 | 2.6% |
| Communications | 383 | 7.2% |
| Arts & Humanities | 427 | 8.1% |
| Total | 5,306 | 100.0% |
Transportation & Commute in Glencoe
Vehicle Availability by Sex in Glencoe
The most prevalent vehicle ownership categories in Glencoe are males with 2 vehicles (1,195, accounting for 58.0%) and females with 2 vehicles (696, making up 96.5%).
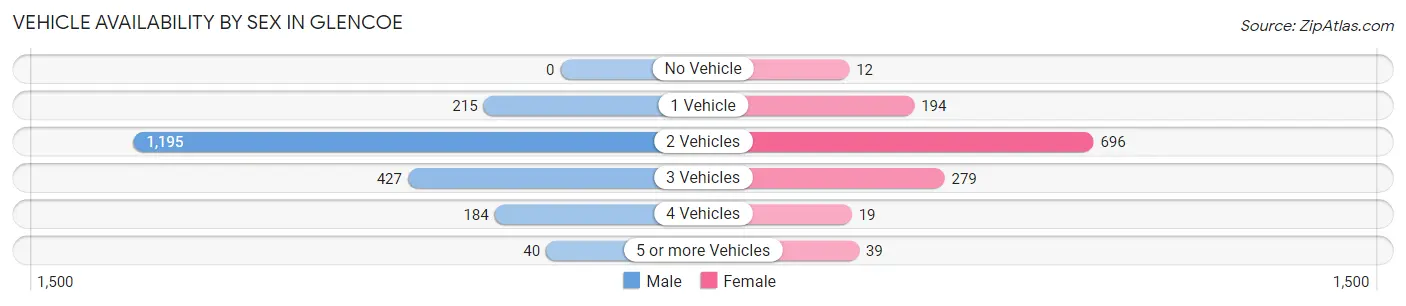
| Vehicles Available | Male | Female |
| No Vehicle | 0 (0.0%) | 12 (1.0%) |
| 1 Vehicle | 215 (10.4%) | 194 (15.7%) |
| 2 Vehicles | 1,195 (58.0%) | 696 (56.2%) |
| 3 Vehicles | 427 (20.7%) | 279 (22.5%) |
| 4 Vehicles | 184 (8.9%) | 19 (1.5%) |
| 5 or more Vehicles | 40 (1.9%) | 39 (3.2%) |
| Total | 2,061 (100.0%) | 1,239 (100.0%) |
Commute Time in Glencoe
The most frequently occuring commute durations in Glencoe are 60 to 89 minutes (597 commuters, 24.6%), 45 to 59 minutes (402 commuters, 16.5%), and 5 to 9 minutes (249 commuters, 10.2%).
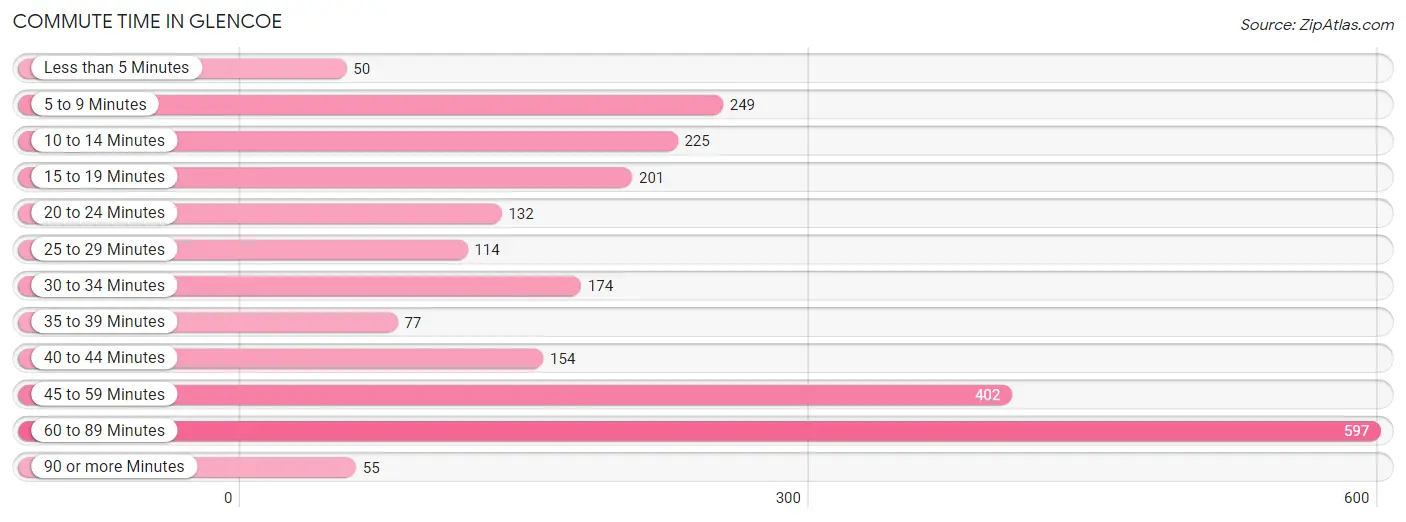
| Commute Time | # Commuters | % Commuters |
| Less than 5 Minutes | 50 | 2.1% |
| 5 to 9 Minutes | 249 | 10.2% |
| 10 to 14 Minutes | 225 | 9.3% |
| 15 to 19 Minutes | 201 | 8.3% |
| 20 to 24 Minutes | 132 | 5.4% |
| 25 to 29 Minutes | 114 | 4.7% |
| 30 to 34 Minutes | 174 | 7.2% |
| 35 to 39 Minutes | 77 | 3.2% |
| 40 to 44 Minutes | 154 | 6.3% |
| 45 to 59 Minutes | 402 | 16.5% |
| 60 to 89 Minutes | 597 | 24.6% |
| 90 or more Minutes | 55 | 2.3% |
Commute Time by Sex in Glencoe
The most common commute times in Glencoe are 60 to 89 minutes (469 commuters, 29.3%) for males and 10 to 14 minutes (188 commuters, 22.7%) for females.
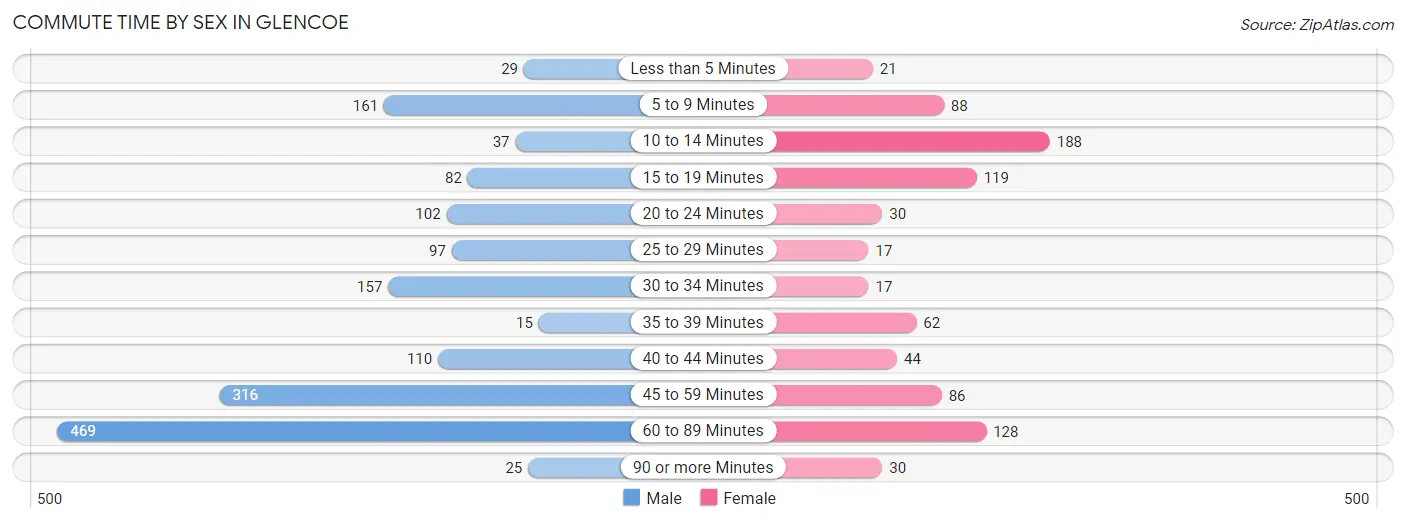
| Commute Time | Male | Female |
| Less than 5 Minutes | 29 (1.8%) | 21 (2.5%) |
| 5 to 9 Minutes | 161 (10.1%) | 88 (10.6%) |
| 10 to 14 Minutes | 37 (2.3%) | 188 (22.7%) |
| 15 to 19 Minutes | 82 (5.1%) | 119 (14.3%) |
| 20 to 24 Minutes | 102 (6.4%) | 30 (3.6%) |
| 25 to 29 Minutes | 97 (6.1%) | 17 (2.1%) |
| 30 to 34 Minutes | 157 (9.8%) | 17 (2.1%) |
| 35 to 39 Minutes | 15 (0.9%) | 62 (7.5%) |
| 40 to 44 Minutes | 110 (6.9%) | 44 (5.3%) |
| 45 to 59 Minutes | 316 (19.8%) | 86 (10.4%) |
| 60 to 89 Minutes | 469 (29.3%) | 128 (15.4%) |
| 90 or more Minutes | 25 (1.6%) | 30 (3.6%) |
Time of Departure to Work by Sex in Glencoe
The most frequent times of departure to work in Glencoe are 8:00 AM to 8:29 AM (330, 20.6%) for males and 7:00 AM to 7:29 AM (201, 24.2%) for females.
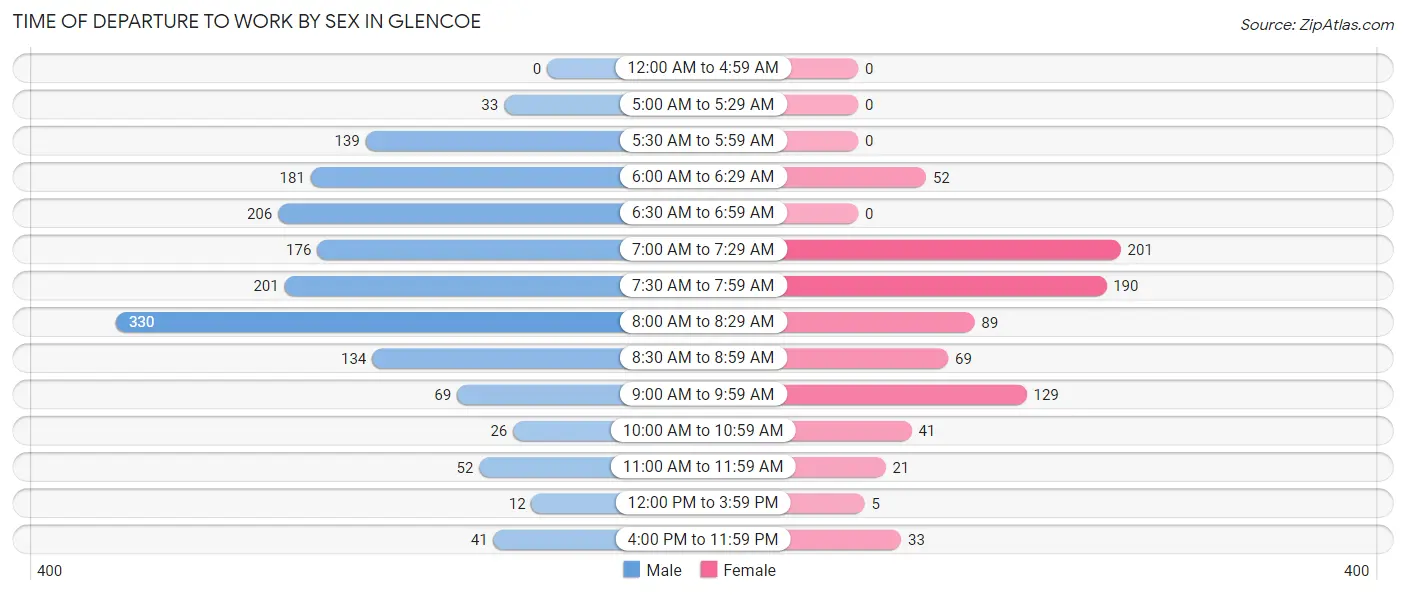
| Time of Departure | Male | Female |
| 12:00 AM to 4:59 AM | 0 (0.0%) | 0 (0.0%) |
| 5:00 AM to 5:29 AM | 33 (2.1%) | 0 (0.0%) |
| 5:30 AM to 5:59 AM | 139 (8.7%) | 0 (0.0%) |
| 6:00 AM to 6:29 AM | 181 (11.3%) | 52 (6.3%) |
| 6:30 AM to 6:59 AM | 206 (12.9%) | 0 (0.0%) |
| 7:00 AM to 7:29 AM | 176 (11.0%) | 201 (24.2%) |
| 7:30 AM to 7:59 AM | 201 (12.6%) | 190 (22.9%) |
| 8:00 AM to 8:29 AM | 330 (20.6%) | 89 (10.7%) |
| 8:30 AM to 8:59 AM | 134 (8.4%) | 69 (8.3%) |
| 9:00 AM to 9:59 AM | 69 (4.3%) | 129 (15.5%) |
| 10:00 AM to 10:59 AM | 26 (1.6%) | 41 (4.9%) |
| 11:00 AM to 11:59 AM | 52 (3.3%) | 21 (2.5%) |
| 12:00 PM to 3:59 PM | 12 (0.7%) | 5 (0.6%) |
| 4:00 PM to 11:59 PM | 41 (2.6%) | 33 (4.0%) |
| Total | 1,600 (100.0%) | 830 (100.0%) |
Housing Occupancy in Glencoe
Occupancy by Ownership in Glencoe
Of the total 3,072 dwellings in Glencoe, owner-occupied units account for 2,860 (93.1%), while renter-occupied units make up 212 (6.9%).
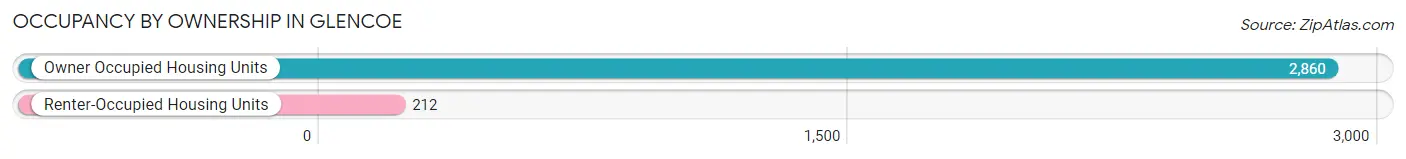
| Occupancy | # Housing Units | % Housing Units |
| Owner Occupied Housing Units | 2,860 | 93.1% |
| Renter-Occupied Housing Units | 212 | 6.9% |
| Total Occupied Housing Units | 3,072 | 100.0% |
Occupancy by Household Size in Glencoe
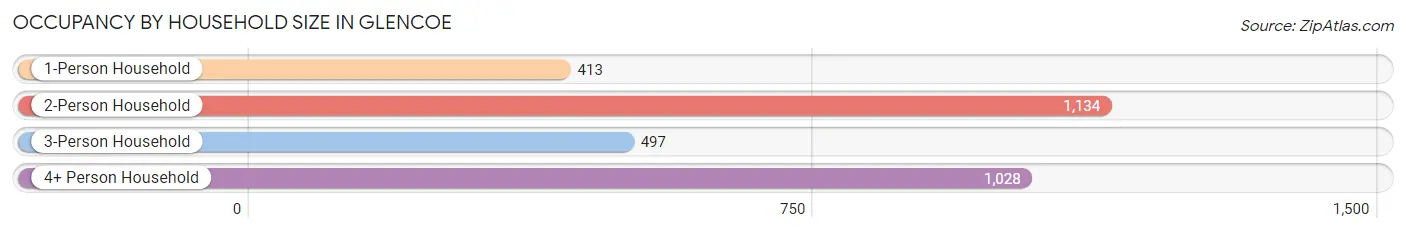
| Household Size | # Housing Units | % Housing Units |
| 1-Person Household | 413 | 13.4% |
| 2-Person Household | 1,134 | 36.9% |
| 3-Person Household | 497 | 16.2% |
| 4+ Person Household | 1,028 | 33.5% |
| Total Housing Units | 3,072 | 100.0% |
Occupancy by Ownership by Household Size in Glencoe
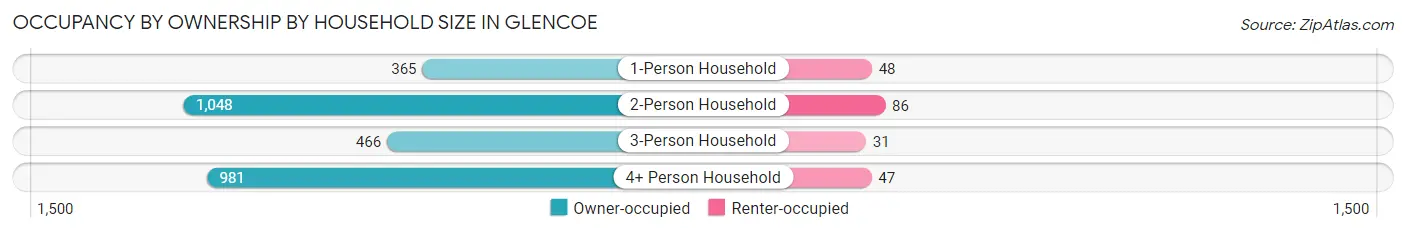
| Household Size | Owner-occupied | Renter-occupied |
| 1-Person Household | 365 (88.4%) | 48 (11.6%) |
| 2-Person Household | 1,048 (92.4%) | 86 (7.6%) |
| 3-Person Household | 466 (93.8%) | 31 (6.2%) |
| 4+ Person Household | 981 (95.4%) | 47 (4.6%) |
| Total Housing Units | 2,860 (93.1%) | 212 (6.9%) |
Occupancy by Educational Attainment in Glencoe
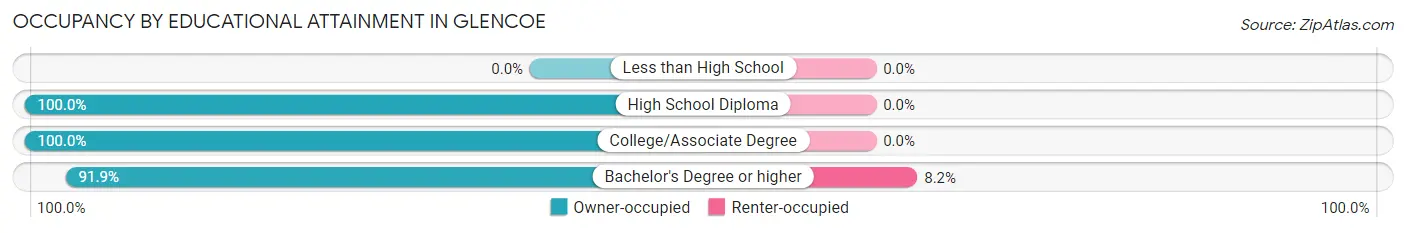
| Household Size | Owner-occupied | Renter-occupied |
| Less than High School | 0 (0.0%) | 0 (0.0%) |
| High School Diploma | 121 (100.0%) | 0 (0.0%) |
| College/Associate Degree | 349 (100.0%) | 0 (0.0%) |
| Bachelor's Degree or higher | 2,390 (91.8%) | 212 (8.2%) |
Occupancy by Age of Householder in Glencoe
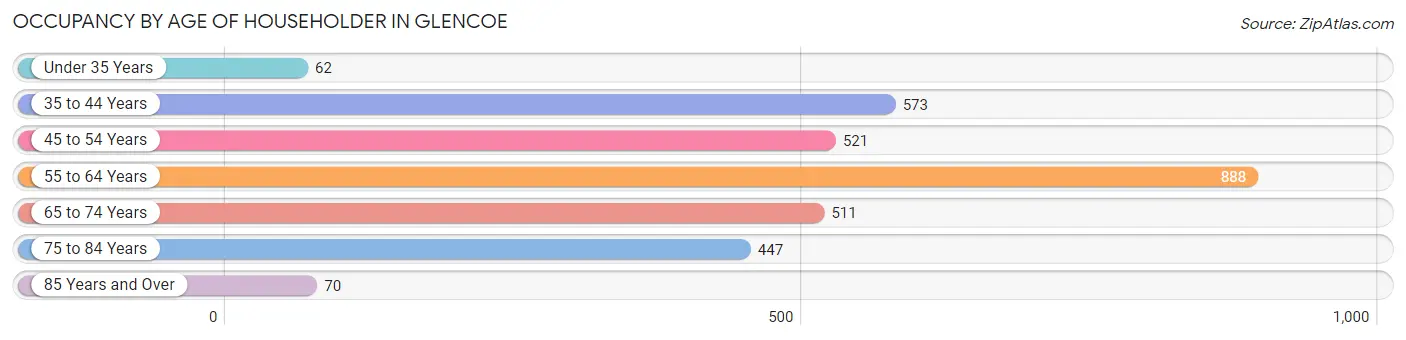
| Age Bracket | # Households | % Households |
| Under 35 Years | 62 | 2.0% |
| 35 to 44 Years | 573 | 18.6% |
| 45 to 54 Years | 521 | 17.0% |
| 55 to 64 Years | 888 | 28.9% |
| 65 to 74 Years | 511 | 16.6% |
| 75 to 84 Years | 447 | 14.5% |
| 85 Years and Over | 70 | 2.3% |
| Total | 3,072 | 100.0% |
Housing Finances in Glencoe
Median Income by Occupancy in Glencoe
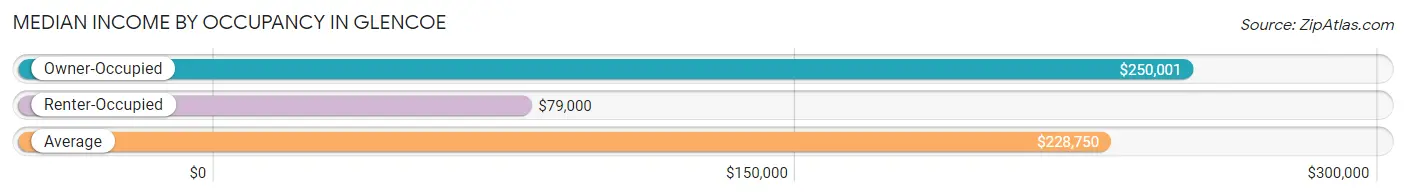
| Occupancy Type | # Households | Median Income |
| Owner-Occupied | 2,860 (93.1%) | $250,001 |
| Renter-Occupied | 212 (6.9%) | $79,000 |
| Average | 3,072 (100.0%) | $228,750 |
Occupancy by Householder Income Bracket in Glencoe
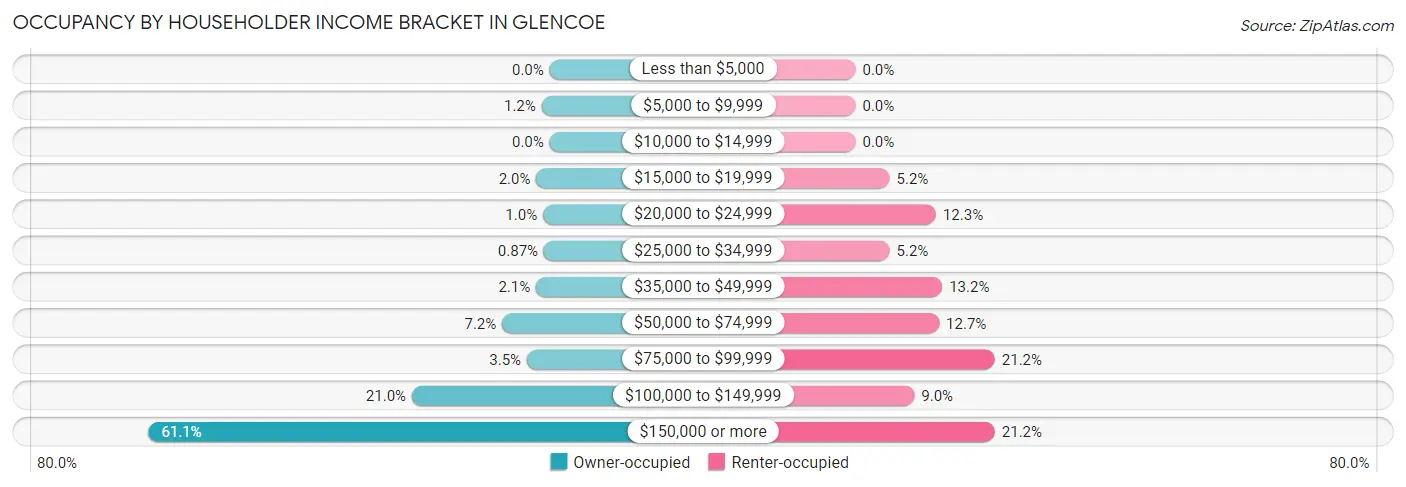
| Income Bracket | Owner-occupied | Renter-occupied |
| Less than $5,000 | 0 (0.0%) | 0 (0.0%) |
| $5,000 to $9,999 | 35 (1.2%) | 0 (0.0%) |
| $10,000 to $14,999 | 0 (0.0%) | 0 (0.0%) |
| $15,000 to $19,999 | 58 (2.0%) | 11 (5.2%) |
| $20,000 to $24,999 | 29 (1.0%) | 26 (12.3%) |
| $25,000 to $34,999 | 25 (0.9%) | 11 (5.2%) |
| $35,000 to $49,999 | 59 (2.1%) | 28 (13.2%) |
| $50,000 to $74,999 | 207 (7.2%) | 27 (12.7%) |
| $75,000 to $99,999 | 99 (3.5%) | 45 (21.2%) |
| $100,000 to $149,999 | 600 (21.0%) | 19 (9.0%) |
| $150,000 or more | 1,748 (61.1%) | 45 (21.2%) |
| Total | 2,860 (100.0%) | 212 (100.0%) |
Monthly Housing Cost Tiers in Glencoe
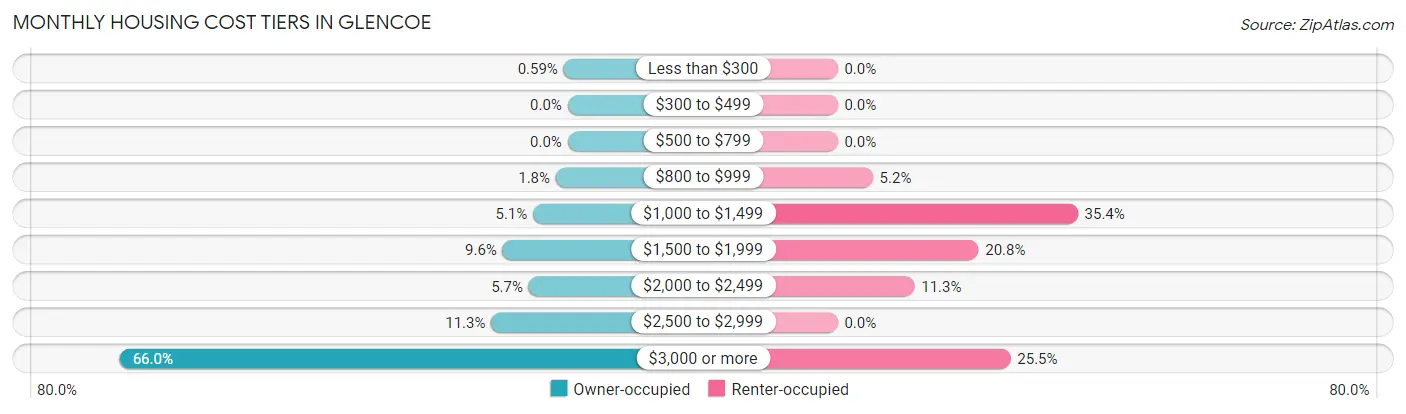
| Monthly Cost | Owner-occupied | Renter-occupied |
| Less than $300 | 17 (0.6%) | 0 (0.0%) |
| $300 to $499 | 0 (0.0%) | 0 (0.0%) |
| $500 to $799 | 0 (0.0%) | 0 (0.0%) |
| $800 to $999 | 50 (1.8%) | 11 (5.2%) |
| $1,000 to $1,499 | 146 (5.1%) | 75 (35.4%) |
| $1,500 to $1,999 | 274 (9.6%) | 44 (20.7%) |
| $2,000 to $2,499 | 164 (5.7%) | 24 (11.3%) |
| $2,500 to $2,999 | 322 (11.3%) | 0 (0.0%) |
| $3,000 or more | 1,887 (66.0%) | 54 (25.5%) |
| Total | 2,860 (100.0%) | 212 (100.0%) |
Physical Housing Characteristics in Glencoe
Housing Structures in Glencoe
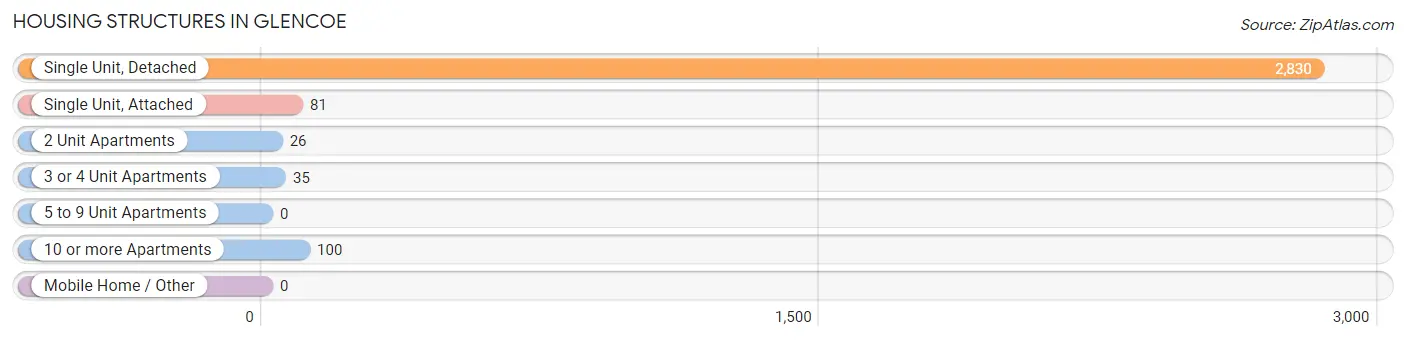
| Structure Type | # Housing Units | % Housing Units |
| Single Unit, Detached | 2,830 | 92.1% |
| Single Unit, Attached | 81 | 2.6% |
| 2 Unit Apartments | 26 | 0.9% |
| 3 or 4 Unit Apartments | 35 | 1.1% |
| 5 to 9 Unit Apartments | 0 | 0.0% |
| 10 or more Apartments | 100 | 3.3% |
| Mobile Home / Other | 0 | 0.0% |
| Total | 3,072 | 100.0% |
Housing Structures by Occupancy in Glencoe
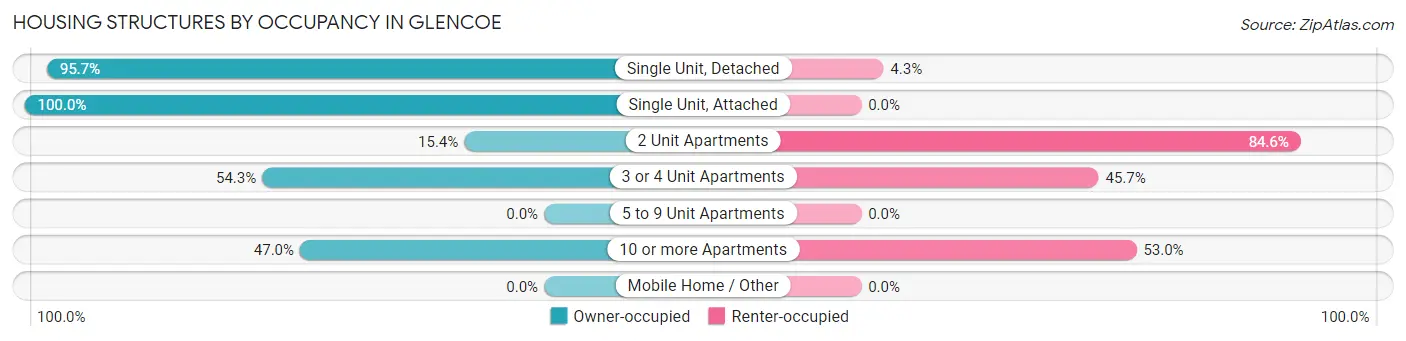
| Structure Type | Owner-occupied | Renter-occupied |
| Single Unit, Detached | 2,709 (95.7%) | 121 (4.3%) |
| Single Unit, Attached | 81 (100.0%) | 0 (0.0%) |
| 2 Unit Apartments | 4 (15.4%) | 22 (84.6%) |
| 3 or 4 Unit Apartments | 19 (54.3%) | 16 (45.7%) |
| 5 to 9 Unit Apartments | 0 (0.0%) | 0 (0.0%) |
| 10 or more Apartments | 47 (47.0%) | 53 (53.0%) |
| Mobile Home / Other | 0 (0.0%) | 0 (0.0%) |
| Total | 2,860 (93.1%) | 212 (6.9%) |
Housing Structures by Number of Rooms in Glencoe
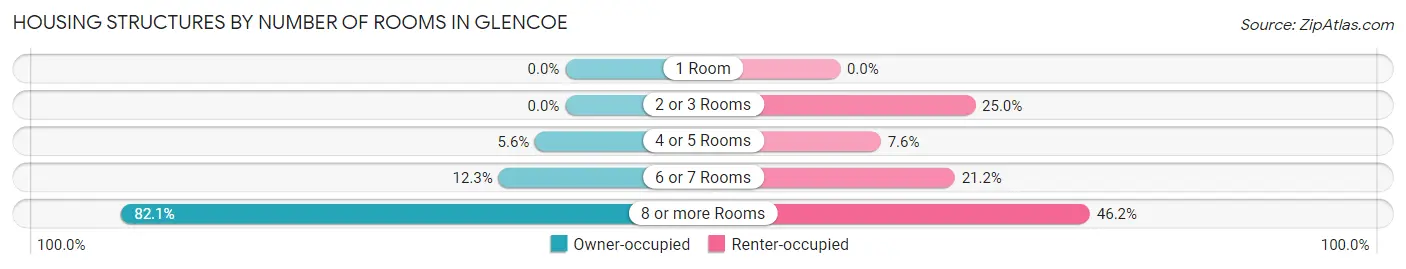
| Number of Rooms | Owner-occupied | Renter-occupied |
| 1 Room | 0 (0.0%) | 0 (0.0%) |
| 2 or 3 Rooms | 0 (0.0%) | 53 (25.0%) |
| 4 or 5 Rooms | 159 (5.6%) | 16 (7.5%) |
| 6 or 7 Rooms | 353 (12.3%) | 45 (21.2%) |
| 8 or more Rooms | 2,348 (82.1%) | 98 (46.2%) |
| Total | 2,860 (100.0%) | 212 (100.0%) |
Housing Structure by Heating Type in Glencoe
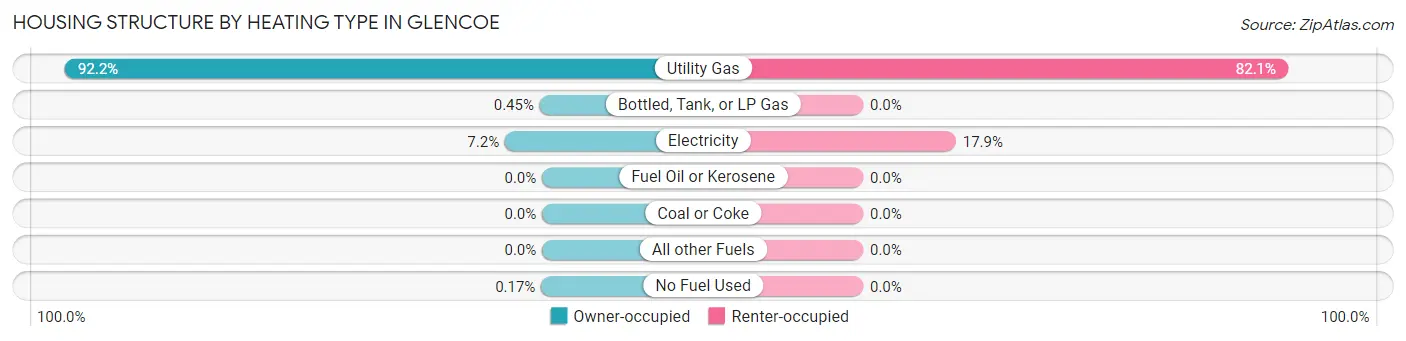
| Heating Type | Owner-occupied | Renter-occupied |
| Utility Gas | 2,637 (92.2%) | 174 (82.1%) |
| Bottled, Tank, or LP Gas | 13 (0.4%) | 0 (0.0%) |
| Electricity | 205 (7.2%) | 38 (17.9%) |
| Fuel Oil or Kerosene | 0 (0.0%) | 0 (0.0%) |
| Coal or Coke | 0 (0.0%) | 0 (0.0%) |
| All other Fuels | 0 (0.0%) | 0 (0.0%) |
| No Fuel Used | 5 (0.2%) | 0 (0.0%) |
| Total | 2,860 (100.0%) | 212 (100.0%) |
Household Vehicle Usage in Glencoe
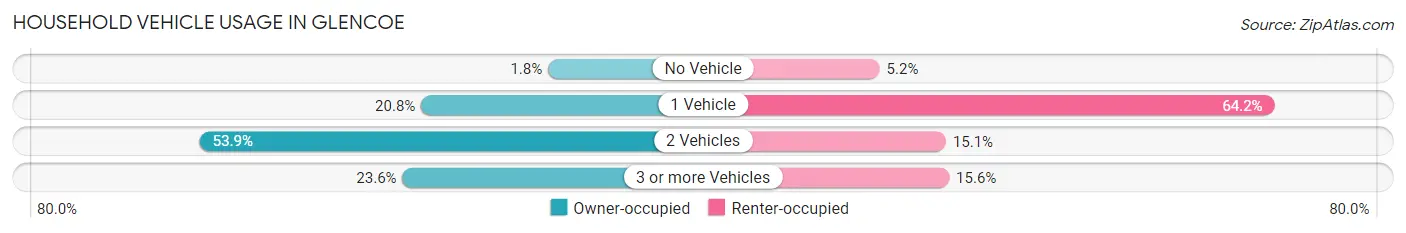
| Vehicles per Household | Owner-occupied | Renter-occupied |
| No Vehicle | 52 (1.8%) | 11 (5.2%) |
| 1 Vehicle | 594 (20.8%) | 136 (64.1%) |
| 2 Vehicles | 1,540 (53.8%) | 32 (15.1%) |
| 3 or more Vehicles | 674 (23.6%) | 33 (15.6%) |
| Total | 2,860 (100.0%) | 212 (100.0%) |
Real Estate & Mortgages in Glencoe
Real Estate and Mortgage Overview in Glencoe
| Characteristic | Without Mortgage | With Mortgage |
| Housing Units | 1,083 | 1,777 |
| Median Property Value | $1,011,300 | $1,402,700 |
| Median Household Income | $171,534 | $1,171 |
| Monthly Housing Costs | $1,501 | $1,575 |
| Real Estate Taxes | $10,001 | $0 |
Property Value by Mortgage Status in Glencoe
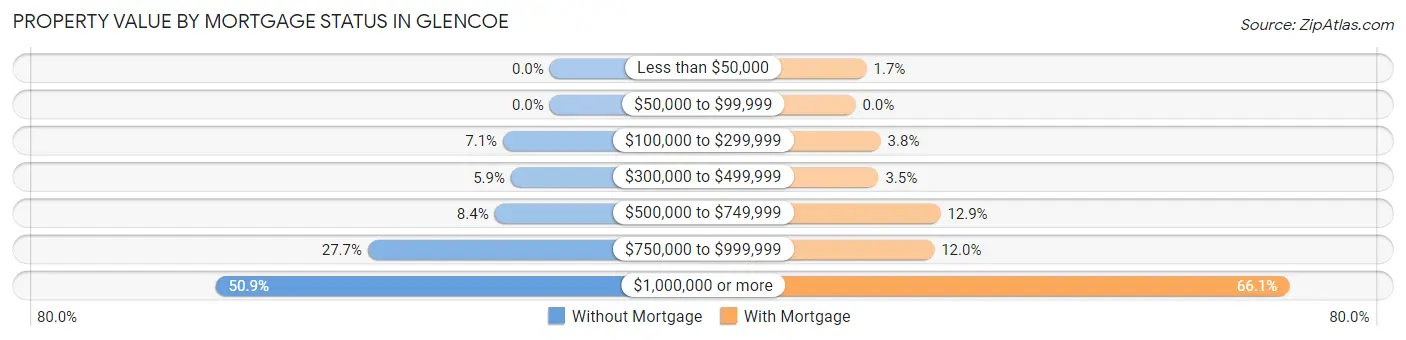
| Property Value | Without Mortgage | With Mortgage |
| Less than $50,000 | 0 (0.0%) | 30 (1.7%) |
| $50,000 to $99,999 | 0 (0.0%) | 0 (0.0%) |
| $100,000 to $299,999 | 77 (7.1%) | 68 (3.8%) |
| $300,000 to $499,999 | 64 (5.9%) | 62 (3.5%) |
| $500,000 to $749,999 | 91 (8.4%) | 230 (12.9%) |
| $750,000 to $999,999 | 300 (27.7%) | 213 (12.0%) |
| $1,000,000 or more | 551 (50.9%) | 1,174 (66.1%) |
| Total | 1,083 (100.0%) | 1,777 (100.0%) |
Household Income by Mortgage Status in Glencoe
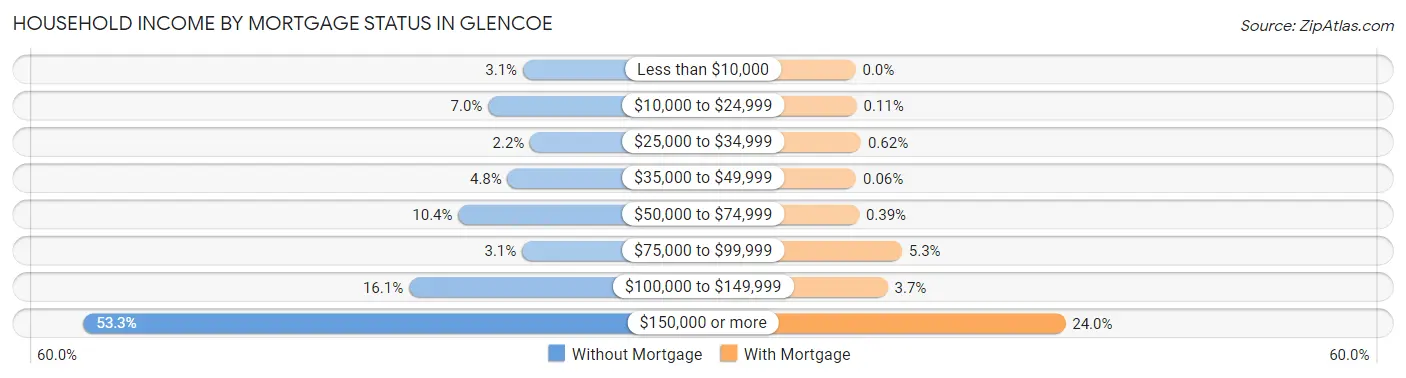
| Household Income | Without Mortgage | With Mortgage |
| Less than $10,000 | 33 (3.0%) | 0 (0.0%) |
| $10,000 to $24,999 | 76 (7.0%) | 2 (0.1%) |
| $25,000 to $34,999 | 24 (2.2%) | 11 (0.6%) |
| $35,000 to $49,999 | 52 (4.8%) | 1 (0.1%) |
| $50,000 to $74,999 | 113 (10.4%) | 7 (0.4%) |
| $75,000 to $99,999 | 34 (3.1%) | 94 (5.3%) |
| $100,000 to $149,999 | 174 (16.1%) | 65 (3.7%) |
| $150,000 or more | 577 (53.3%) | 426 (24.0%) |
| Total | 1,083 (100.0%) | 1,777 (100.0%) |
Property Value to Household Income Ratio in Glencoe
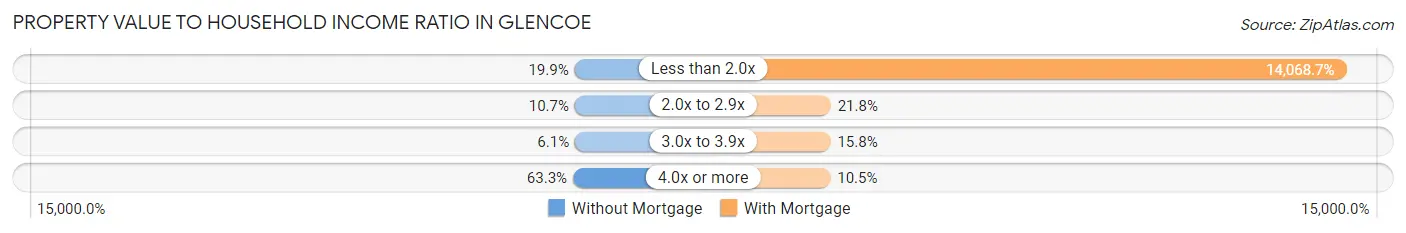
| Value-to-Income Ratio | Without Mortgage | With Mortgage |
| Less than 2.0x | 215 (19.9%) | 250,001 (14,068.7%) |
| 2.0x to 2.9x | 116 (10.7%) | 388 (21.8%) |
| 3.0x to 3.9x | 66 (6.1%) | 280 (15.8%) |
| 4.0x or more | 686 (63.3%) | 187 (10.5%) |
| Total | 1,083 (100.0%) | 1,777 (100.0%) |
Real Estate Taxes by Mortgage Status in Glencoe
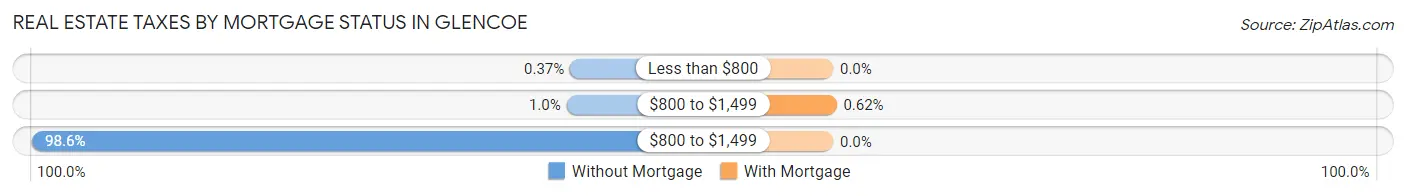
| Property Taxes | Without Mortgage | With Mortgage |
| Less than $800 | 4 (0.4%) | 0 (0.0%) |
| $800 to $1,499 | 11 (1.0%) | 11 (0.6%) |
| $800 to $1,499 | 1,068 (98.6%) | 0 (0.0%) |
| Total | 1,083 (100.0%) | 1,777 (100.0%) |
Health & Disability in Glencoe
Health Insurance Coverage by Age in Glencoe
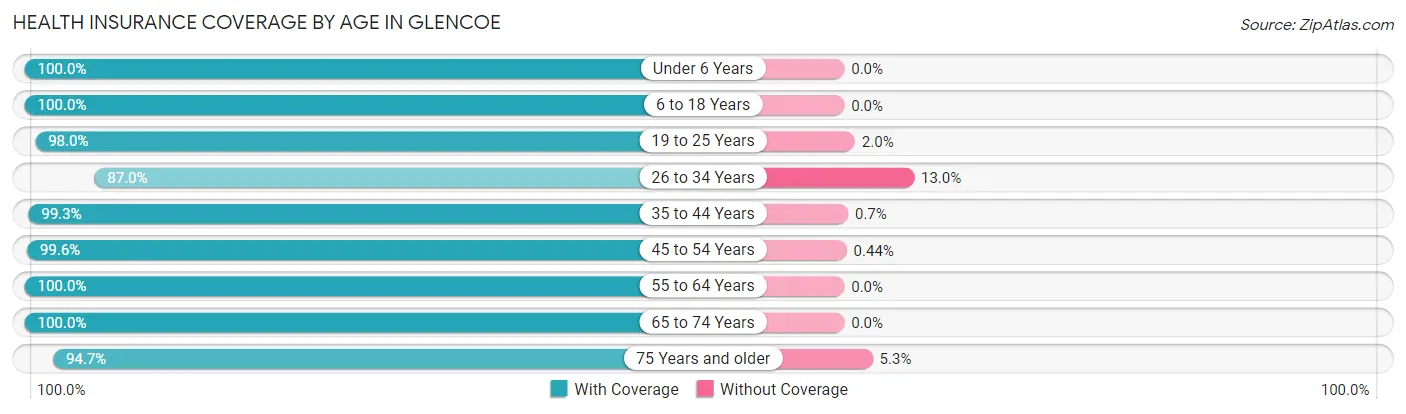
| Age Bracket | With Coverage | Without Coverage |
| Under 6 Years | 632 (100.0%) | 0 (0.0%) |
| 6 to 18 Years | 1,976 (100.0%) | 0 (0.0%) |
| 19 to 25 Years | 496 (98.0%) | 10 (2.0%) |
| 26 to 34 Years | 127 (87.0%) | 19 (13.0%) |
| 35 to 44 Years | 1,130 (99.3%) | 8 (0.7%) |
| 45 to 54 Years | 1,132 (99.6%) | 5 (0.4%) |
| 55 to 64 Years | 1,509 (100.0%) | 0 (0.0%) |
| 65 to 74 Years | 892 (100.0%) | 0 (0.0%) |
| 75 Years and older | 806 (94.7%) | 45 (5.3%) |
| Total | 8,700 (99.0%) | 87 (1.0%) |
Health Insurance Coverage by Citizenship Status in Glencoe
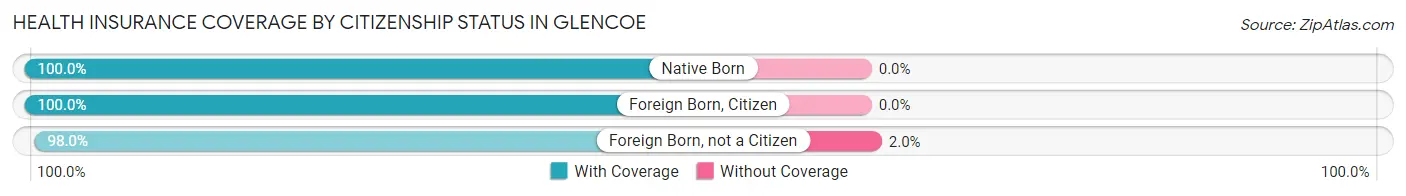
| Citizenship Status | With Coverage | Without Coverage |
| Native Born | 632 (100.0%) | 0 (0.0%) |
| Foreign Born, Citizen | 1,976 (100.0%) | 0 (0.0%) |
| Foreign Born, not a Citizen | 496 (98.0%) | 10 (2.0%) |
Health Insurance Coverage by Household Income in Glencoe
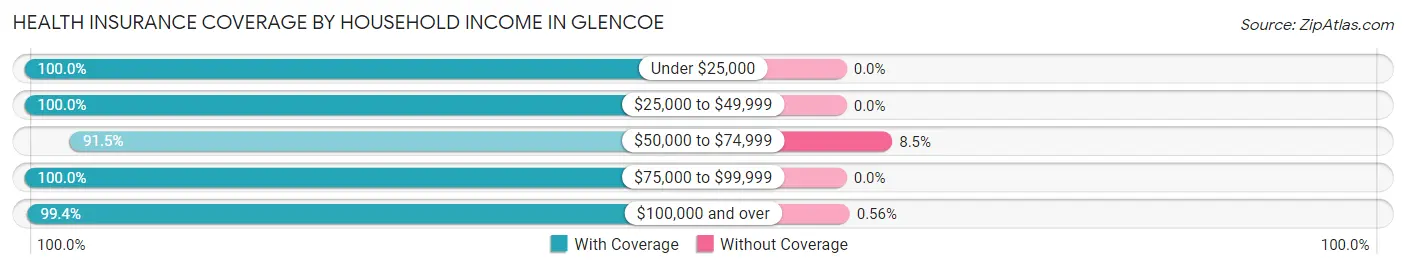
| Household Income | With Coverage | Without Coverage |
| Under $25,000 | 190 (100.0%) | 0 (0.0%) |
| $25,000 to $49,999 | 173 (100.0%) | 0 (0.0%) |
| $50,000 to $74,999 | 483 (91.5%) | 45 (8.5%) |
| $75,000 to $99,999 | 436 (100.0%) | 0 (0.0%) |
| $100,000 and over | 7,414 (99.4%) | 42 (0.6%) |
Public vs Private Health Insurance Coverage by Age in Glencoe
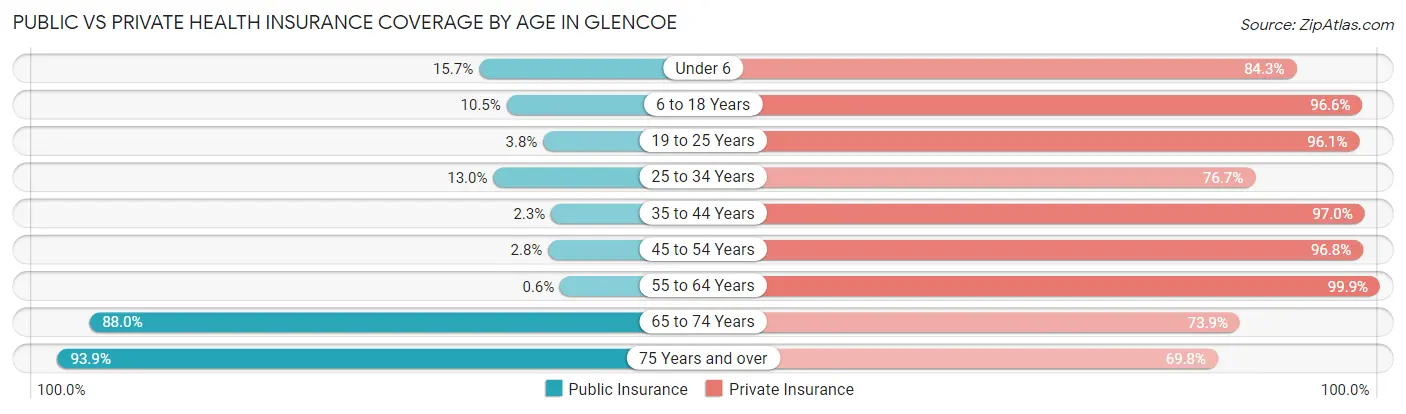
| Age Bracket | Public Insurance | Private Insurance |
| Under 6 | 99 (15.7%) | 533 (84.3%) |
| 6 to 18 Years | 208 (10.5%) | 1,909 (96.6%) |
| 19 to 25 Years | 19 (3.7%) | 486 (96.1%) |
| 25 to 34 Years | 19 (13.0%) | 112 (76.7%) |
| 35 to 44 Years | 26 (2.3%) | 1,104 (97.0%) |
| 45 to 54 Years | 32 (2.8%) | 1,100 (96.8%) |
| 55 to 64 Years | 9 (0.6%) | 1,507 (99.9%) |
| 65 to 74 Years | 785 (88.0%) | 659 (73.9%) |
| 75 Years and over | 799 (93.9%) | 594 (69.8%) |
| Total | 1,996 (22.7%) | 8,004 (91.1%) |
Disability Status by Sex by Age in Glencoe
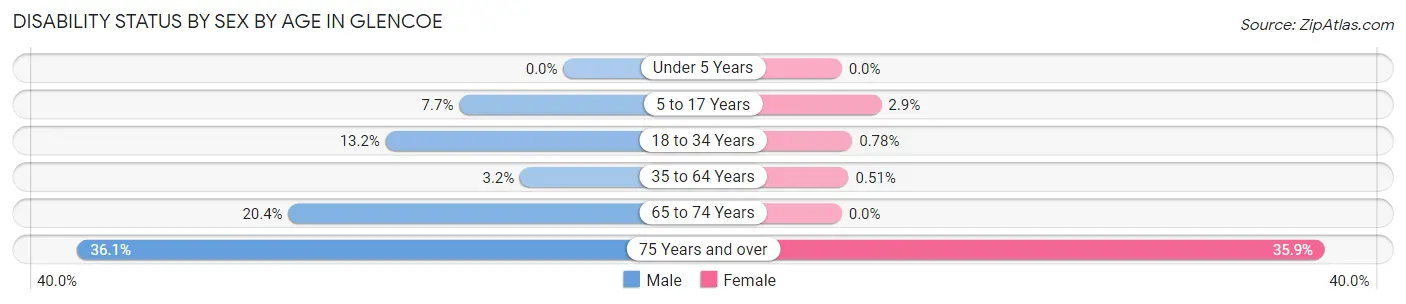
| Age Bracket | Male | Female |
| Under 5 Years | 0 (0.0%) | 0 (0.0%) |
| 5 to 17 Years | 81 (7.7%) | 28 (2.9%) |
| 18 to 34 Years | 36 (13.2%) | 4 (0.8%) |
| 35 to 64 Years | 59 (3.2%) | 10 (0.5%) |
| 65 to 74 Years | 89 (20.4%) | 0 (0.0%) |
| 75 Years and over | 141 (36.1%) | 165 (35.9%) |
Disability Class by Sex by Age in Glencoe
Disability Class: Hearing Difficulty
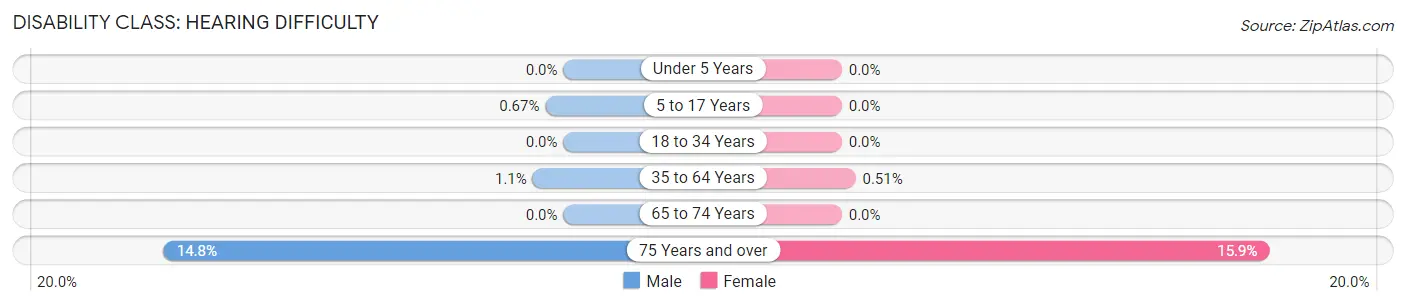
| Age Bracket | Male | Female |
| Under 5 Years | 0 (0.0%) | 0 (0.0%) |
| 5 to 17 Years | 7 (0.7%) | 0 (0.0%) |
| 18 to 34 Years | 0 (0.0%) | 0 (0.0%) |
| 35 to 64 Years | 21 (1.1%) | 10 (0.5%) |
| 65 to 74 Years | 0 (0.0%) | 0 (0.0%) |
| 75 Years and over | 58 (14.8%) | 73 (15.9%) |
Disability Class: Vision Difficulty
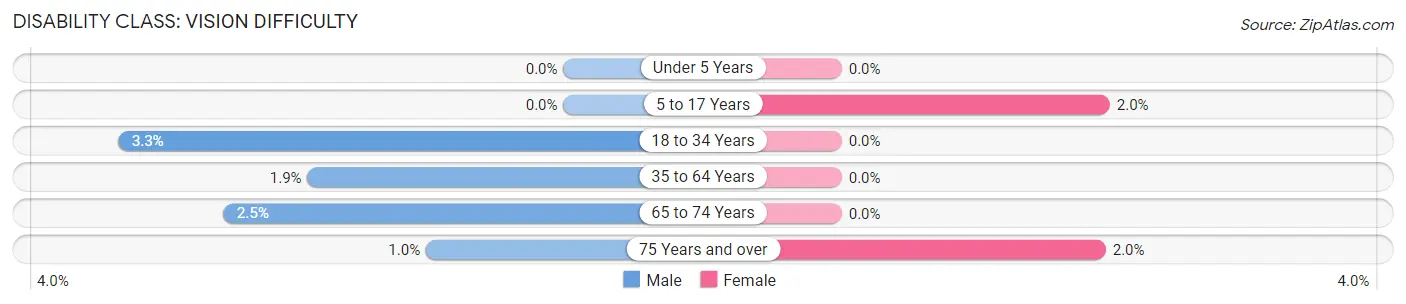
| Age Bracket | Male | Female |
| Under 5 Years | 0 (0.0%) | 0 (0.0%) |
| 5 to 17 Years | 0 (0.0%) | 19 (2.0%) |
| 18 to 34 Years | 9 (3.3%) | 0 (0.0%) |
| 35 to 64 Years | 35 (1.9%) | 0 (0.0%) |
| 65 to 74 Years | 11 (2.5%) | 0 (0.0%) |
| 75 Years and over | 4 (1.0%) | 9 (2.0%) |
Disability Class: Cognitive Difficulty
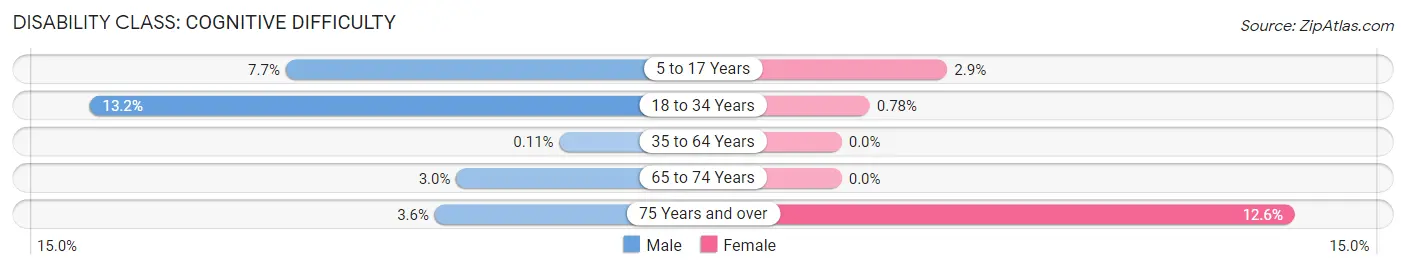
| Age Bracket | Male | Female |
| 5 to 17 Years | 81 (7.7%) | 28 (2.9%) |
| 18 to 34 Years | 36 (13.2%) | 4 (0.8%) |
| 35 to 64 Years | 2 (0.1%) | 0 (0.0%) |
| 65 to 74 Years | 13 (3.0%) | 0 (0.0%) |
| 75 Years and over | 14 (3.6%) | 58 (12.6%) |
Disability Class: Ambulatory Difficulty
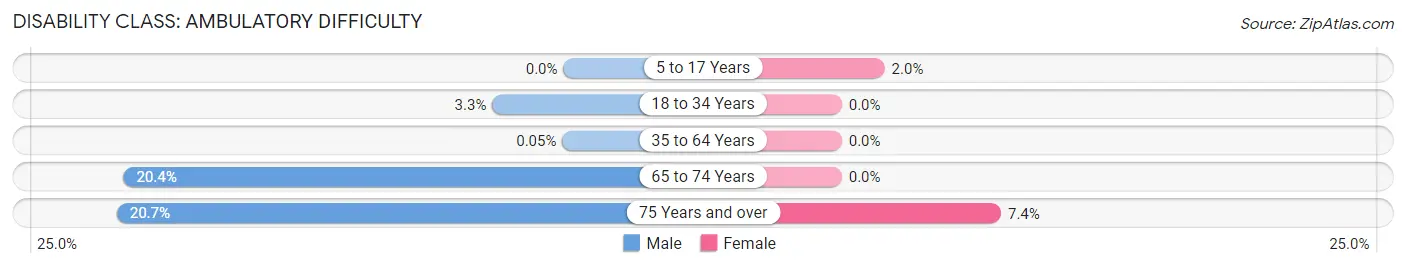
| Age Bracket | Male | Female |
| 5 to 17 Years | 0 (0.0%) | 19 (2.0%) |
| 18 to 34 Years | 9 (3.3%) | 0 (0.0%) |
| 35 to 64 Years | 1 (0.1%) | 0 (0.0%) |
| 65 to 74 Years | 89 (20.4%) | 0 (0.0%) |
| 75 Years and over | 81 (20.7%) | 34 (7.4%) |
Disability Class: Self-Care Difficulty
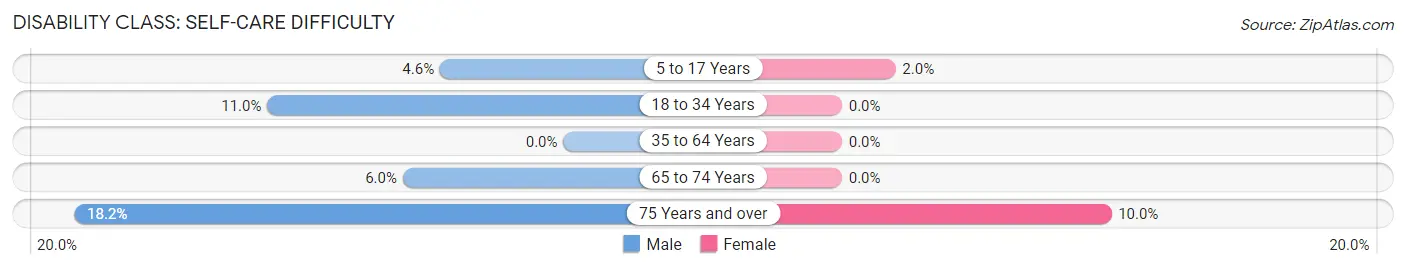
| Age Bracket | Male | Female |
| 5 to 17 Years | 48 (4.6%) | 19 (2.0%) |
| 18 to 34 Years | 30 (11.0%) | 0 (0.0%) |
| 35 to 64 Years | 0 (0.0%) | 0 (0.0%) |
| 65 to 74 Years | 26 (6.0%) | 0 (0.0%) |
| 75 Years and over | 71 (18.2%) | 46 (10.0%) |
Technology Access in Glencoe
Computing Device Access in Glencoe
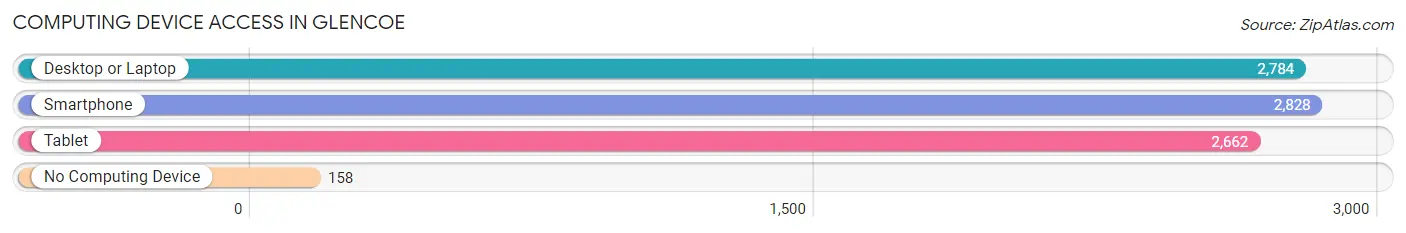
| Device Type | # Households | % Households |
| Desktop or Laptop | 2,784 | 90.6% |
| Smartphone | 2,828 | 92.1% |
| Tablet | 2,662 | 86.7% |
| No Computing Device | 158 | 5.1% |
| Total | 3,072 | 100.0% |
Internet Access in Glencoe
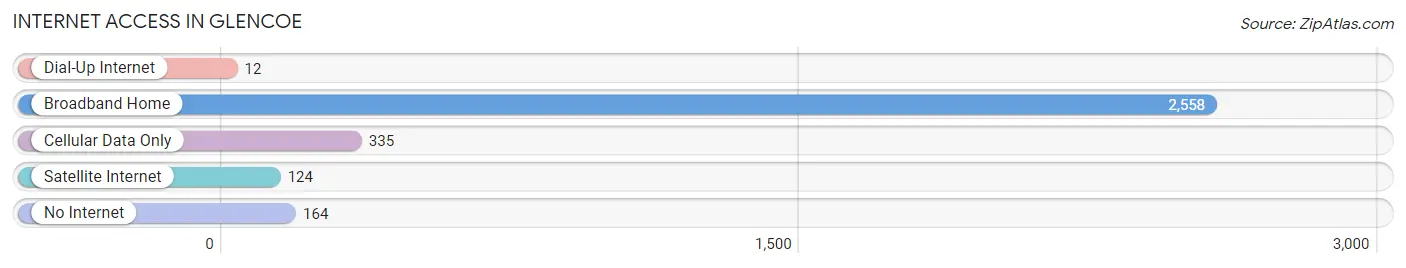
| Internet Type | # Households | % Households |
| Dial-Up Internet | 12 | 0.4% |
| Broadband Home | 2,558 | 83.3% |
| Cellular Data Only | 335 | 10.9% |
| Satellite Internet | 124 | 4.0% |
| No Internet | 164 | 5.3% |
| Total | 3,072 | 100.0% |
Glencoe Summary
Glencoe, Illinois is a small village located in Cook County, approximately 25 miles north of downtown Chicago. The village is situated on the shores of Lake Michigan and is bordered by the communities of Winnetka, Northfield, and Highland Park. The village has a population of 8,723 people, according to the 2010 census, and is known for its beautiful homes, lush parks, and excellent schools.
Geography
Glencoe is located in the northern part of Cook County, Illinois, and is bordered by the communities of Winnetka, Northfield, and Highland Park. The village is situated on the shores of Lake Michigan and is surrounded by the Skokie Lagoons, a series of interconnected lagoons and wetlands. The village is also home to the Glencoe Beach, a popular destination for swimming, fishing, and other recreational activities. The village is located in the Central Lake Michigan Lowland, a region characterized by rolling hills, wooded areas, and numerous small lakes and ponds.
Economy
Glencoe is a wealthy village, with a median household income of $180,000, according to the 2010 census. The village is home to a number of large corporations, including Kraft Foods, Abbott Laboratories, and the Chicago Tribune. The village is also home to a number of small businesses, including restaurants, boutiques, and specialty shops. The village is also home to a number of financial institutions, including banks, investment firms, and insurance companies.
Demographics
According to the 2010 census, Glencoe has a population of 8,723 people. The village is predominantly white, with a population that is 94.3% white, 1.3% African American, 1.2% Asian, and 1.2% Hispanic or Latino. The village is also home to a large Jewish population, with approximately 25% of the population identifying as Jewish.
The village has a median age of 45.7 years, with a median household income of $180,000. The village is also home to a large number of college-educated residents, with approximately 70% of the population having a bachelor's degree or higher.
Conclusion
Glencoe, Illinois is a small village located in Cook County, approximately 25 miles north of downtown Chicago. The village is situated on the shores of Lake Michigan and is bordered by the communities of Winnetka, Northfield, and Highland Park. The village has a population of 8,723 people, according to the 2010 census, and is known for its beautiful homes, lush parks, and excellent schools. The village is predominantly white, with a median household income of $180,000, and is home to a large number of college-educated residents. The village is also home to a number of large corporations, small businesses, and financial institutions.
Common Questions
What is Per Capita Income in Glencoe?
Per Capita income in Glencoe is $135,540.
What is the Median Family Income in Glencoe?
Median Family Income in Glencoe is $250,001.
What is the Median Household income in Glencoe?
Median Household Income in Glencoe is $228,750.
What is Income or Wage Gap in Glencoe?
Income or Wage Gap in Glencoe is 63.2%.
Women in Glencoe earn 36.8 cents for every dollar earned by a man.
What is Inequality or Gini Index in Glencoe?
Inequality or Gini Index in Glencoe is 0.55.
What is the Total Population of Glencoe?
Total Population of Glencoe is 8,787.
What is the Total Male Population of Glencoe?
Total Male Population of Glencoe is 4,254.
What is the Total Female Population of Glencoe?
Total Female Population of Glencoe is 4,533.
What is the Ratio of Males per 100 Females in Glencoe?
There are 93.85 Males per 100 Females in Glencoe.
What is the Ratio of Females per 100 Males in Glencoe?
There are 106.56 Females per 100 Males in Glencoe.
What is the Median Population Age in Glencoe?
Median Population Age in Glencoe is 44.9 Years.
What is the Average Family Size in Glencoe
Average Family Size in Glencoe is 3.1 People.
What is the Average Household Size in Glencoe
Average Household Size in Glencoe is 2.9 People.
How Large is the Labor Force in Glencoe?
There are 3,457 People in the Labor Forcein in Glencoe.
What is the Percentage of People in the Labor Force in Glencoe?
52.5% of People are in the Labor Force in Glencoe.
What is the Unemployment Rate in Glencoe?
Unemployment Rate in Glencoe is 3.9%.