Zip Codes with the Highest Percentage of Population Employed in Legal Services & Support in Schaumburg, IL
RELATED REPORTS & OPTIONS
Legal Services & Support
Schaumburg
Compare Zip Codes
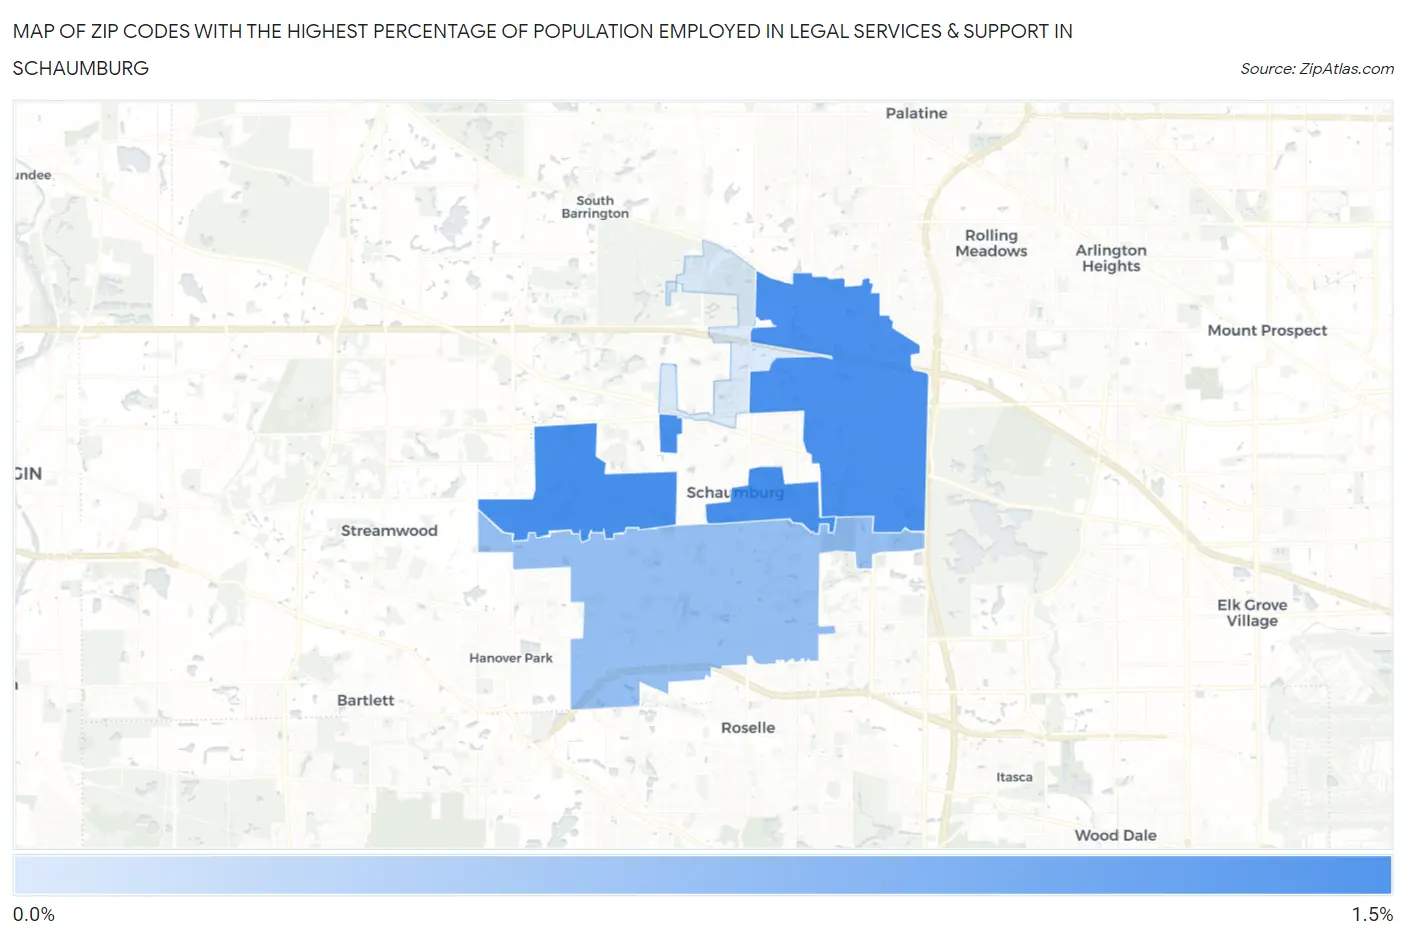
Map of Zip Codes with the Highest Percentage of Population Employed in Legal Services & Support in Schaumburg
0.49%
1.3%
Zip Codes with the Highest Percentage of Population Employed in Legal Services & Support in Schaumburg, IL
| Zip Code | % Employed | vs State | vs National | |
| 1. | 60194 | 1.3% | 1.3%(-0.079)#218 | 1.2%(+0.087)#6,097 |
| 2. | 60173 | 1.3% | 1.3%(-0.089)#222 | 1.2%(+0.077)#6,147 |
| 3. | 60193 | 0.86% | 1.3%(-0.486)#330 | 1.2%(-0.320)#8,904 |
| 4. | 60195 | 0.49% | 1.3%(-0.859)#505 | 1.2%(-0.693)#12,748 |
1
Common Questions
What are the Top 3 Zip Codes with the Highest Percentage of Population Employed in Legal Services & Support in Schaumburg, IL?
Top 3 Zip Codes with the Highest Percentage of Population Employed in Legal Services & Support in Schaumburg, IL are:
What zip code has the Highest Percentage of Population Employed in Legal Services & Support in Schaumburg, IL?
60194 has the Highest Percentage of Population Employed in Legal Services & Support in Schaumburg, IL with 1.3%.
What is the Percentage of Population Employed in Legal Services & Support in Schaumburg, IL?
Percentage of Population Employed in Legal Services & Support in Schaumburg is 1.0%.
What is the Percentage of Population Employed in Legal Services & Support in Illinois?
Percentage of Population Employed in Legal Services & Support in Illinois is 1.3%.
What is the Percentage of Population Employed in Legal Services & Support in the United States?
Percentage of Population Employed in Legal Services & Support in the United States is 1.2%.