Zip Codes with the Highest Percentage of Population with a Degree in Visual and Performing Arts in Edmonds, WA
RELATED REPORTS & OPTIONS
Visual and Performing Arts
Edmonds
Compare Zip Codes
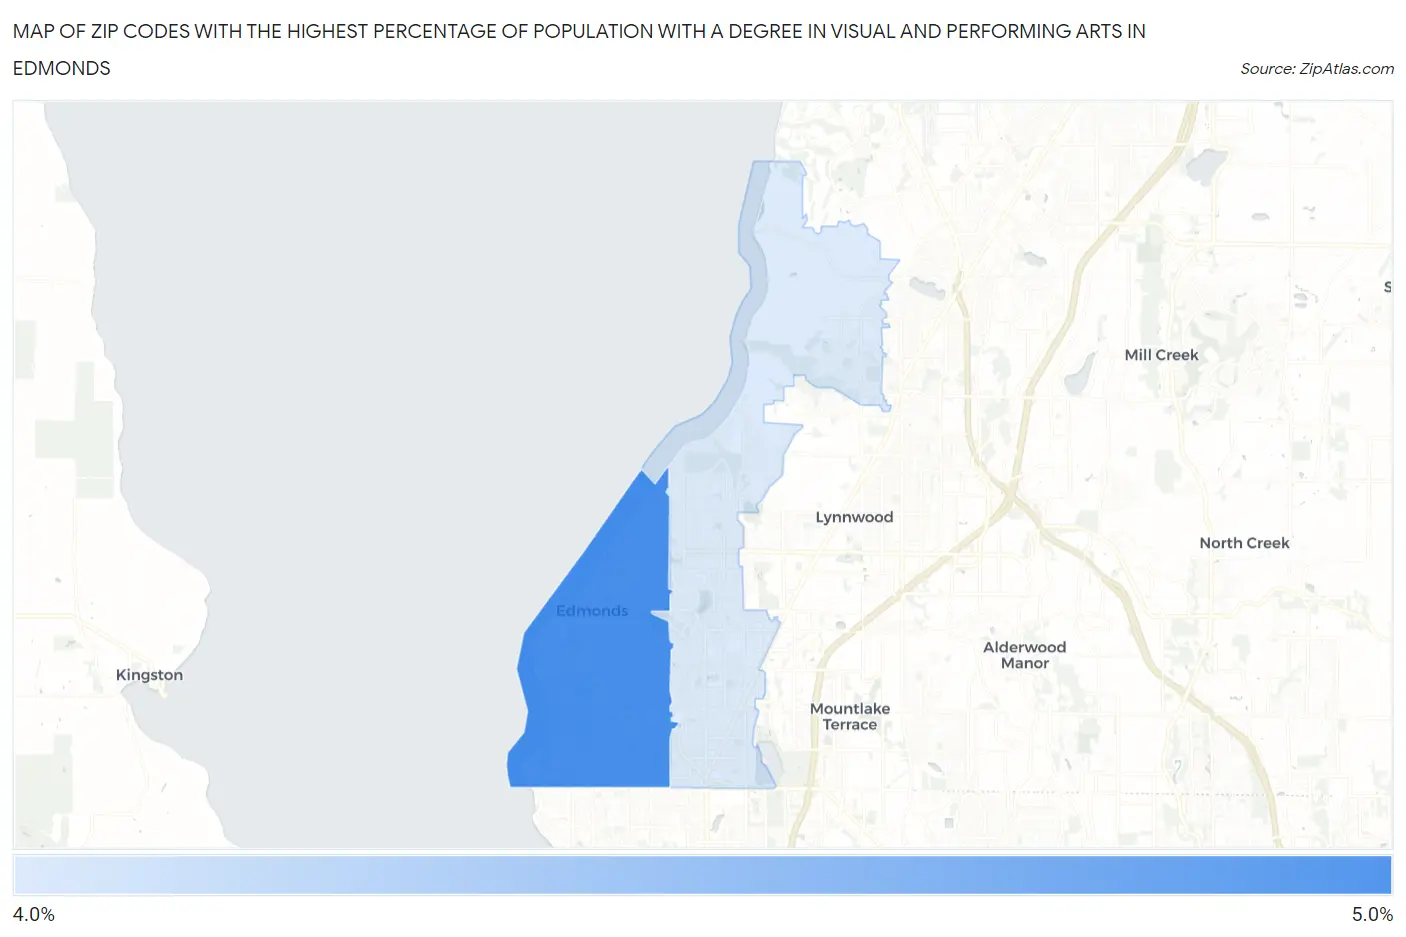
Map of Zip Codes with the Highest Percentage of Population with a Degree in Visual and Performing Arts in Edmonds
4.1%
4.8%
Zip Codes with the Highest Percentage of Population with a Degree in Visual and Performing Arts in Edmonds, WA
| Zip Code | % Graduates | vs State | vs National | |
| 1. | 98020 | 4.8% | 4.6%(+0.178)#188 | 4.3%(+0.545)#7,083 |
| 2. | 98026 | 4.1% | 4.6%(-0.495)#233 | 4.3%(-0.128)#8,851 |
1
Common Questions
What are the Top Zip Codes with the Highest Percentage of Population with a Degree in Visual and Performing Arts in Edmonds, WA?
Top Zip Codes with the Highest Percentage of Population with a Degree in Visual and Performing Arts in Edmonds, WA are:
What zip code has the Highest Percentage of Population with a Degree in Visual and Performing Arts in Edmonds, WA?
98020 has the Highest Percentage of Population with a Degree in Visual and Performing Arts in Edmonds, WA with 4.8%.
What is the Percentage of Population with a Degree in Visual and Performing Arts in Edmonds, WA?
Percentage of Population with a Degree in Visual and Performing Arts in Edmonds is 4.4%.
What is the Percentage of Population with a Degree in Visual and Performing Arts in Washington?
Percentage of Population with a Degree in Visual and Performing Arts in Washington is 4.6%.
What is the Percentage of Population with a Degree in Visual and Performing Arts in the United States?
Percentage of Population with a Degree in Visual and Performing Arts in the United States is 4.3%.