Zip Codes with the Highest Percentage of Population Employed in Agriculture, Fishing & Hunting in Bellevue, WA
RELATED REPORTS & OPTIONS
Agriculture, Fishing & Hunting
Bellevue
Compare Zip Codes
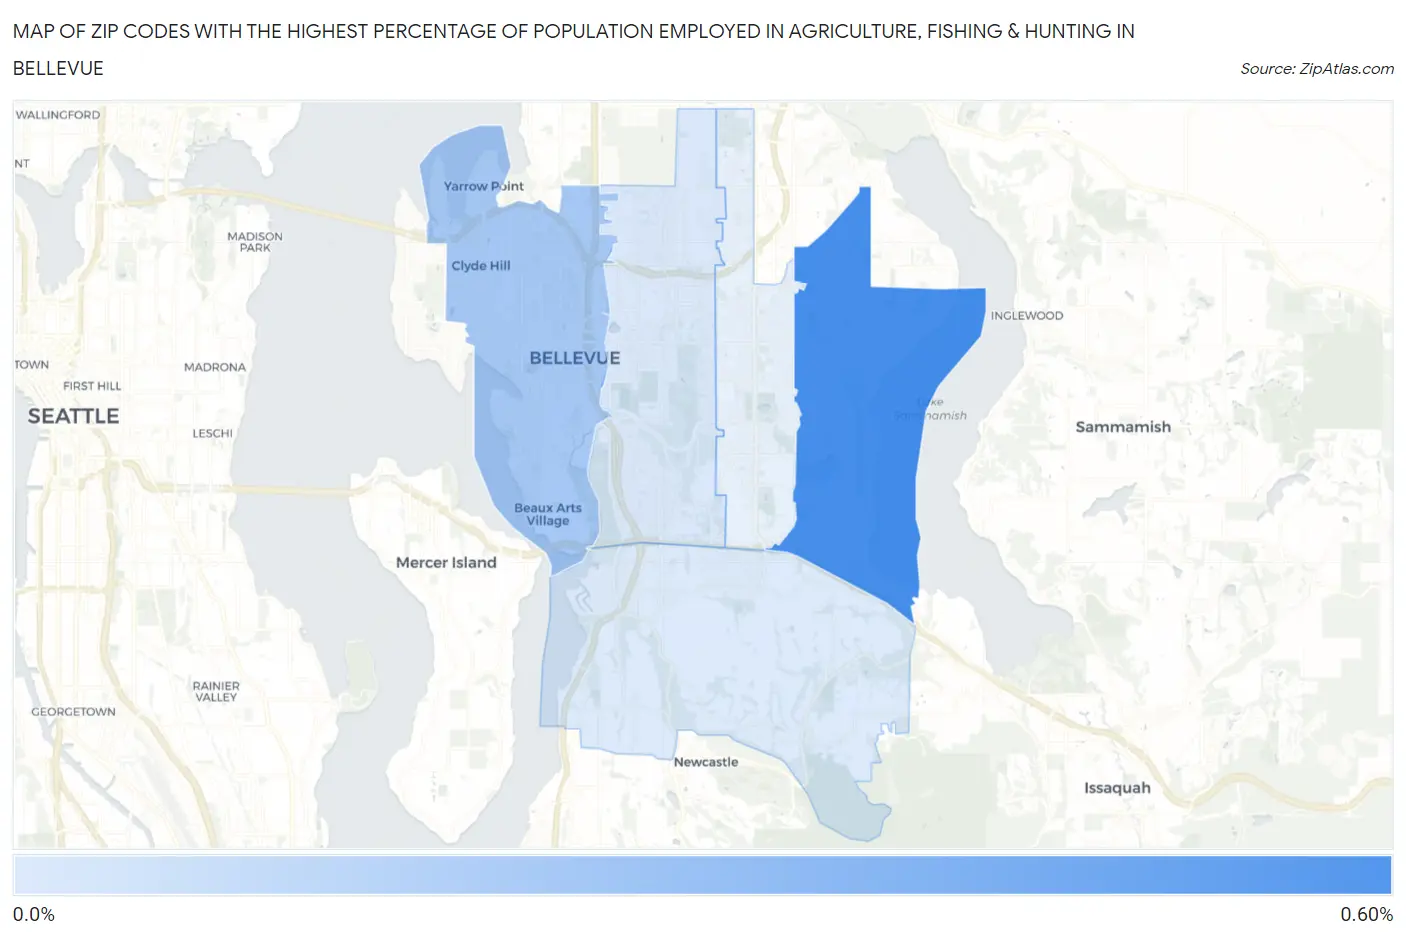
Map of Zip Codes with the Highest Percentage of Population Employed in Agriculture, Fishing & Hunting in Bellevue
0.076%
0.58%
Zip Codes with the Highest Percentage of Population Employed in Agriculture, Fishing & Hunting in Bellevue, WA
| Zip Code | % Employed | vs State | vs National | |
| 1. | 98008 | 0.58% | 2.4%(-1.81)#394 | 1.2%(-0.618)#18,622 |
| 2. | 98004 | 0.26% | 2.4%(-2.13)#460 | 1.2%(-0.937)#21,626 |
| 3. | 98005 | 0.086% | 2.4%(-2.30)#501 | 1.2%(-1.11)#23,872 |
| 4. | 98006 | 0.076% | 2.4%(-2.31)#502 | 1.2%(-1.12)#24,009 |
1
Common Questions
What are the Top 3 Zip Codes with the Highest Percentage of Population Employed in Agriculture, Fishing & Hunting in Bellevue, WA?
Top 3 Zip Codes with the Highest Percentage of Population Employed in Agriculture, Fishing & Hunting in Bellevue, WA are:
What zip code has the Highest Percentage of Population Employed in Agriculture, Fishing & Hunting in Bellevue, WA?
98008 has the Highest Percentage of Population Employed in Agriculture, Fishing & Hunting in Bellevue, WA with 0.58%.
What is the Percentage of Population Employed in Agriculture, Fishing & Hunting in Bellevue, WA?
Percentage of Population Employed in Agriculture, Fishing & Hunting in Bellevue is 0.19%.
What is the Percentage of Population Employed in Agriculture, Fishing & Hunting in Washington?
Percentage of Population Employed in Agriculture, Fishing & Hunting in Washington is 2.4%.
What is the Percentage of Population Employed in Agriculture, Fishing & Hunting in the United States?
Percentage of Population Employed in Agriculture, Fishing & Hunting in the United States is 1.2%.