Zip Codes with the Highest Percentage of Population Employed in Health Diagnosing & Treating in Rule, TX
RELATED REPORTS & OPTIONS
Health Diagnosing & Treating
Rule
Compare Zip Codes
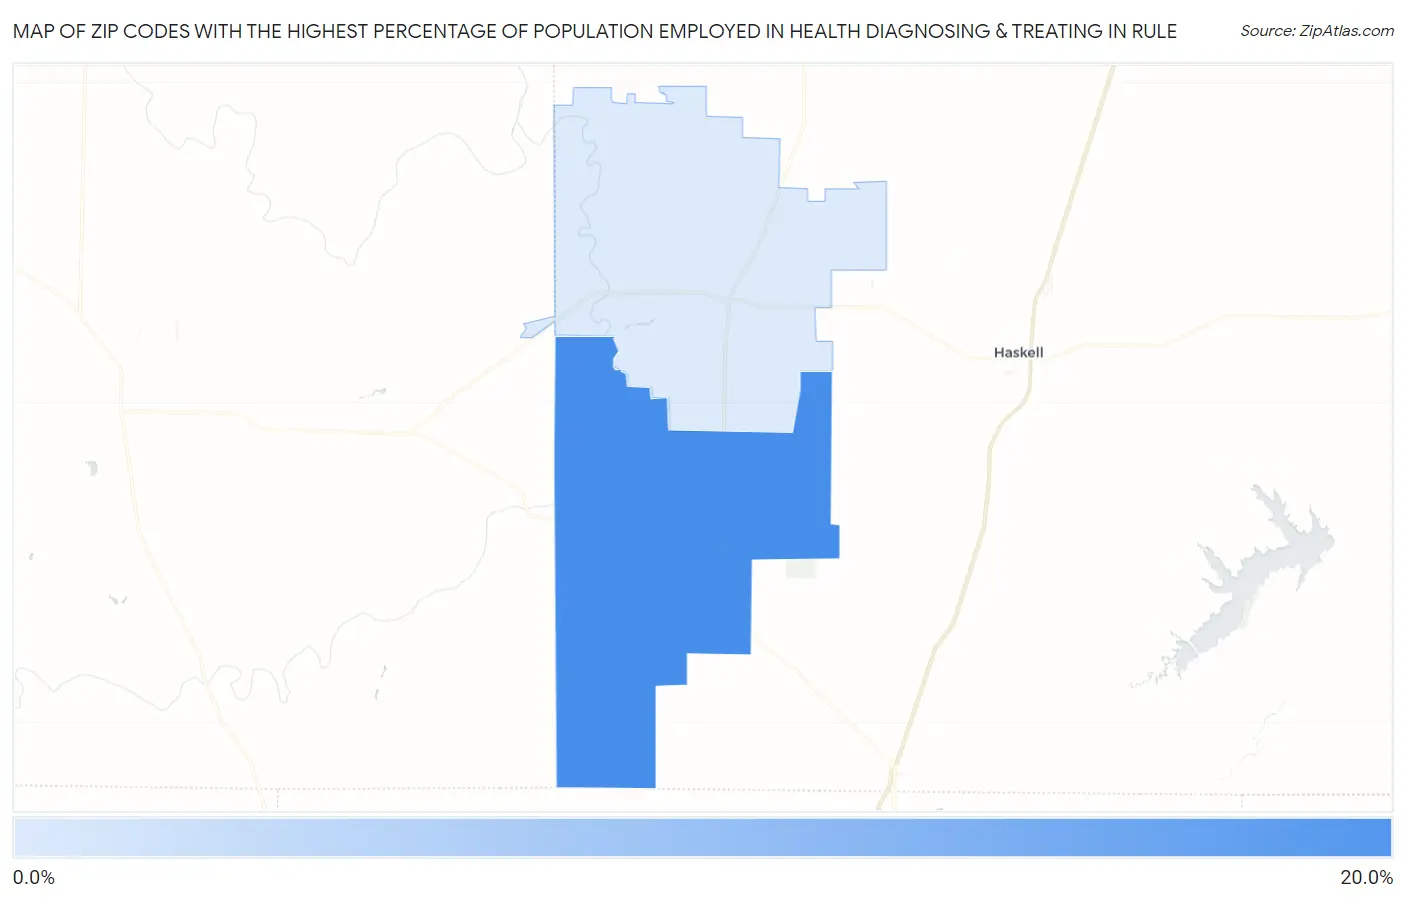
Map of Zip Codes with the Highest Percentage of Population Employed in Health Diagnosing & Treating in Rule
6.4%
15.4%
Zip Codes with the Highest Percentage of Population Employed in Health Diagnosing & Treating in Rule, TX
| Zip Code | % Employed | vs State | vs National | |
| 1. | 79548 | 15.4% | 5.5%(+9.87)#53 | 6.2%(+9.14)#1,064 |
| 2. | 79547 | 6.4% | 5.5%(+0.857)#527 | 6.2%(+0.131)#12,480 |
1
Common Questions
What are the Top Zip Codes with the Highest Percentage of Population Employed in Health Diagnosing & Treating in Rule, TX?
Top Zip Codes with the Highest Percentage of Population Employed in Health Diagnosing & Treating in Rule, TX are:
What zip code has the Highest Percentage of Population Employed in Health Diagnosing & Treating in Rule, TX?
79548 has the Highest Percentage of Population Employed in Health Diagnosing & Treating in Rule, TX with 15.4%.
What is the Percentage of Population Employed in Health Diagnosing & Treating in Rule, TX?
Percentage of Population Employed in Health Diagnosing & Treating in Rule is 4.3%.
What is the Percentage of Population Employed in Health Diagnosing & Treating in Texas?
Percentage of Population Employed in Health Diagnosing & Treating in Texas is 5.5%.
What is the Percentage of Population Employed in Health Diagnosing & Treating in the United States?
Percentage of Population Employed in Health Diagnosing & Treating in the United States is 6.2%.