Zip Codes with the Highest Percentage of Population Employed in Health Diagnosing & Treating in Granbury, TX
RELATED REPORTS & OPTIONS
Health Diagnosing & Treating
Granbury
Compare Zip Codes
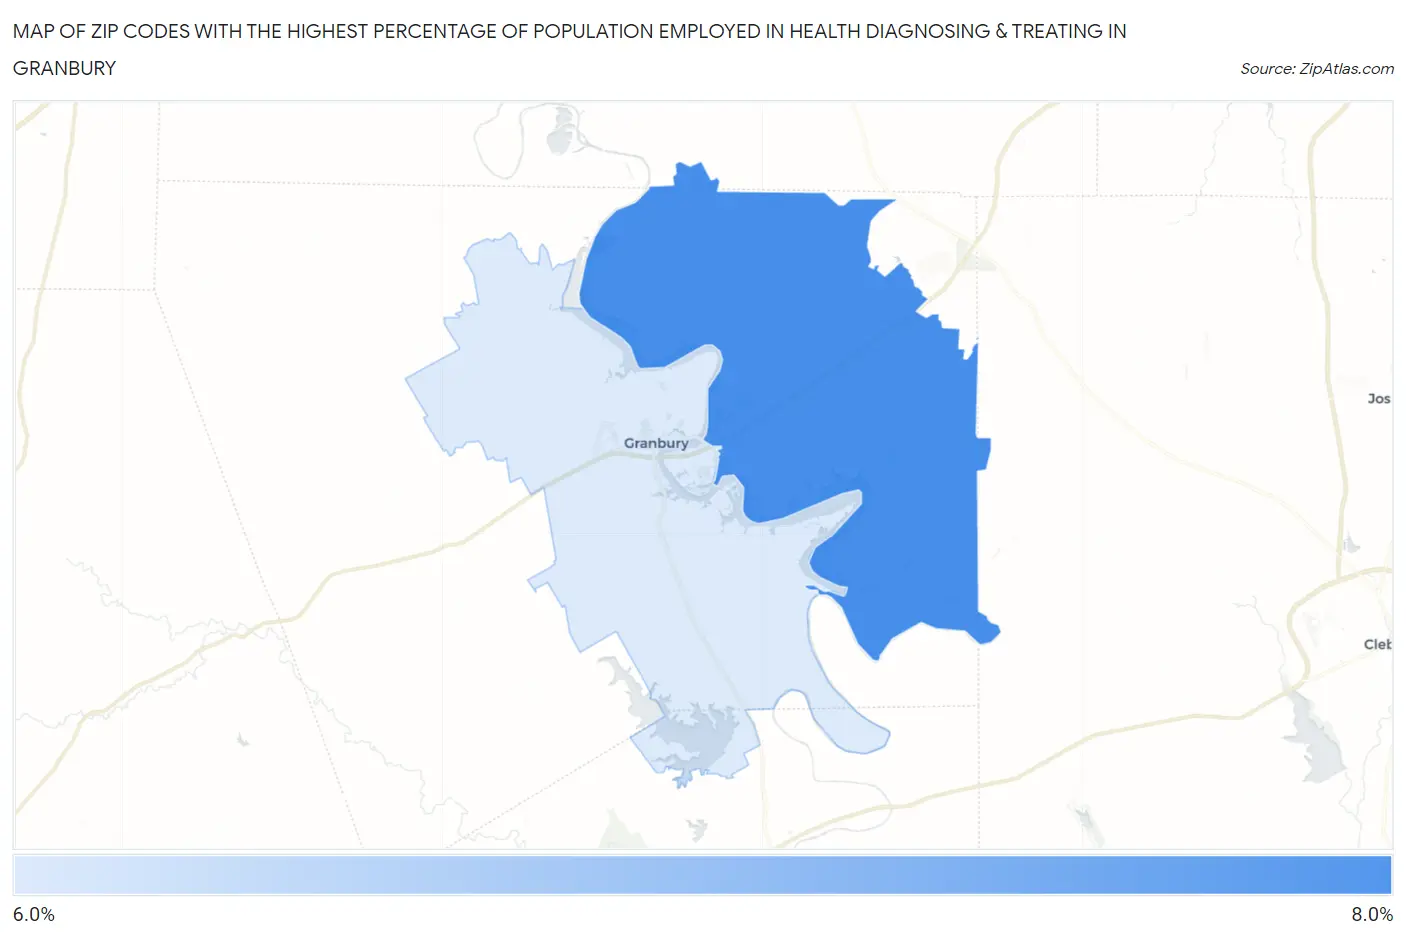
Map of Zip Codes with the Highest Percentage of Population Employed in Health Diagnosing & Treating in Granbury
6.2%
7.1%
Zip Codes with the Highest Percentage of Population Employed in Health Diagnosing & Treating in Granbury, TX
| Zip Code | % Employed | vs State | vs National | |
| 1. | 76049 | 7.1% | 5.5%(+1.58)#433 | 6.2%(+0.857)#10,029 |
| 2. | 76048 | 6.2% | 5.5%(+0.677)#565 | 6.2%(-0.049)#13,162 |
1
Common Questions
What are the Top Zip Codes with the Highest Percentage of Population Employed in Health Diagnosing & Treating in Granbury, TX?
Top Zip Codes with the Highest Percentage of Population Employed in Health Diagnosing & Treating in Granbury, TX are:
What zip code has the Highest Percentage of Population Employed in Health Diagnosing & Treating in Granbury, TX?
76049 has the Highest Percentage of Population Employed in Health Diagnosing & Treating in Granbury, TX with 7.1%.
What is the Percentage of Population Employed in Health Diagnosing & Treating in Granbury, TX?
Percentage of Population Employed in Health Diagnosing & Treating in Granbury is 7.3%.
What is the Percentage of Population Employed in Health Diagnosing & Treating in Texas?
Percentage of Population Employed in Health Diagnosing & Treating in Texas is 5.5%.
What is the Percentage of Population Employed in Health Diagnosing & Treating in the United States?
Percentage of Population Employed in Health Diagnosing & Treating in the United States is 6.2%.