Zip Codes with the Highest Percentage of Population Employed in Health Diagnosing & Treating in Lancaster, TX
RELATED REPORTS & OPTIONS
Health Diagnosing & Treating
Lancaster
Compare Zip Codes
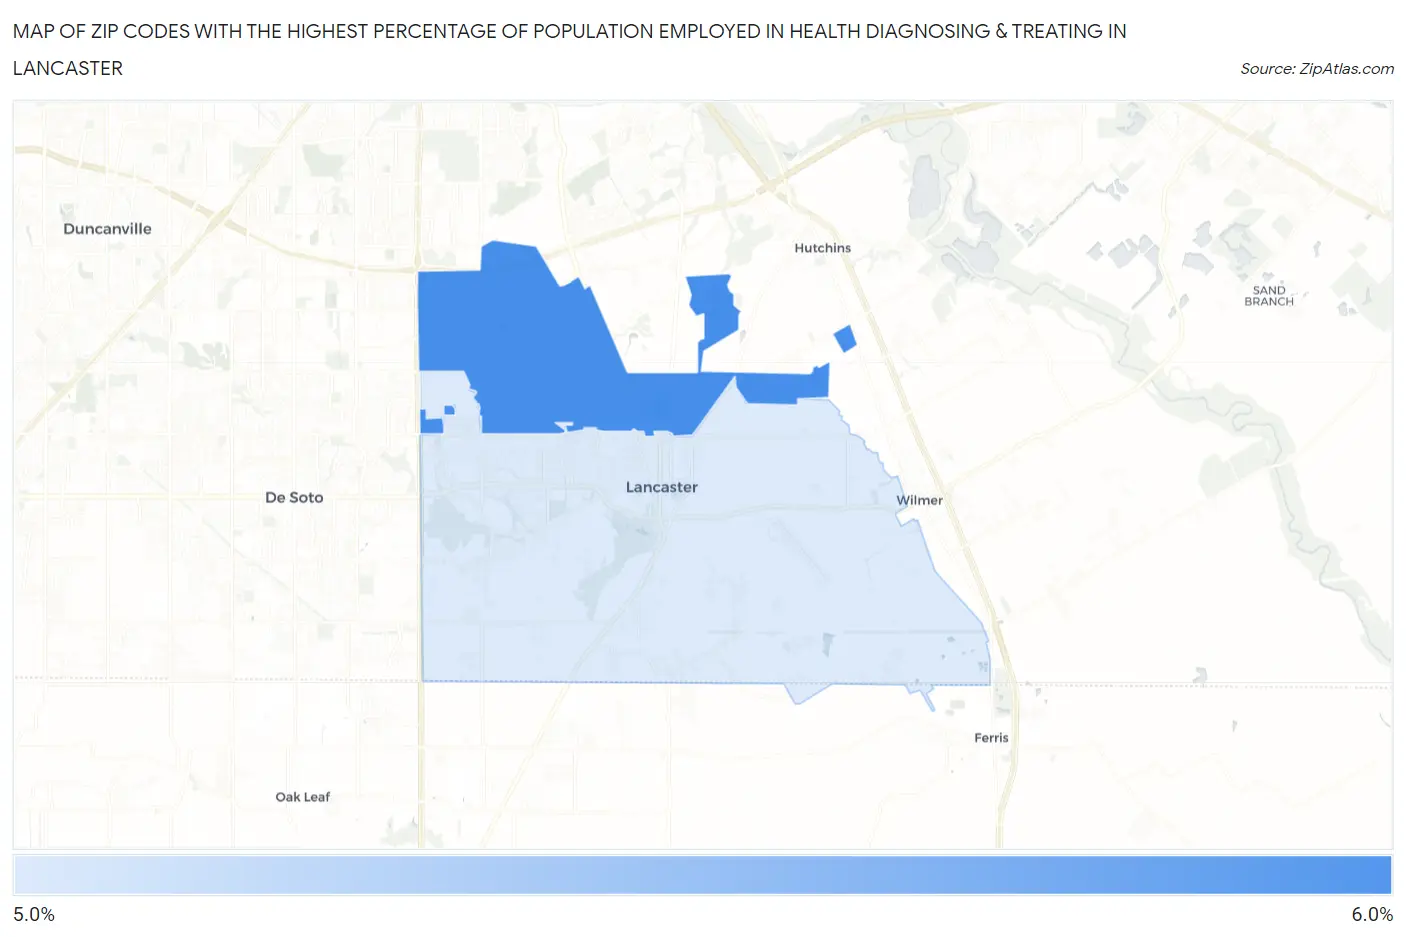
Map of Zip Codes with the Highest Percentage of Population Employed in Health Diagnosing & Treating in Lancaster
5.2%
5.8%
Zip Codes with the Highest Percentage of Population Employed in Health Diagnosing & Treating in Lancaster, TX
| Zip Code | % Employed | vs State | vs National | |
| 1. | 75134 | 5.8% | 5.5%(+0.271)#638 | 6.2%(-0.455)#14,647 |
| 2. | 75146 | 5.2% | 5.5%(-0.300)#778 | 6.2%(-1.03)#16,869 |
1
Common Questions
What are the Top Zip Codes with the Highest Percentage of Population Employed in Health Diagnosing & Treating in Lancaster, TX?
Top Zip Codes with the Highest Percentage of Population Employed in Health Diagnosing & Treating in Lancaster, TX are:
What zip code has the Highest Percentage of Population Employed in Health Diagnosing & Treating in Lancaster, TX?
75134 has the Highest Percentage of Population Employed in Health Diagnosing & Treating in Lancaster, TX with 5.8%.
What is the Percentage of Population Employed in Health Diagnosing & Treating in Lancaster, TX?
Percentage of Population Employed in Health Diagnosing & Treating in Lancaster is 4.4%.
What is the Percentage of Population Employed in Health Diagnosing & Treating in Texas?
Percentage of Population Employed in Health Diagnosing & Treating in Texas is 5.5%.
What is the Percentage of Population Employed in Health Diagnosing & Treating in the United States?
Percentage of Population Employed in Health Diagnosing & Treating in the United States is 6.2%.