Zip Codes with the Highest Percentage of Population Employed in Health Diagnosing & Treating in Grand Prairie, TX
RELATED REPORTS & OPTIONS
Health Diagnosing & Treating
Grand Prairie
Compare Zip Codes
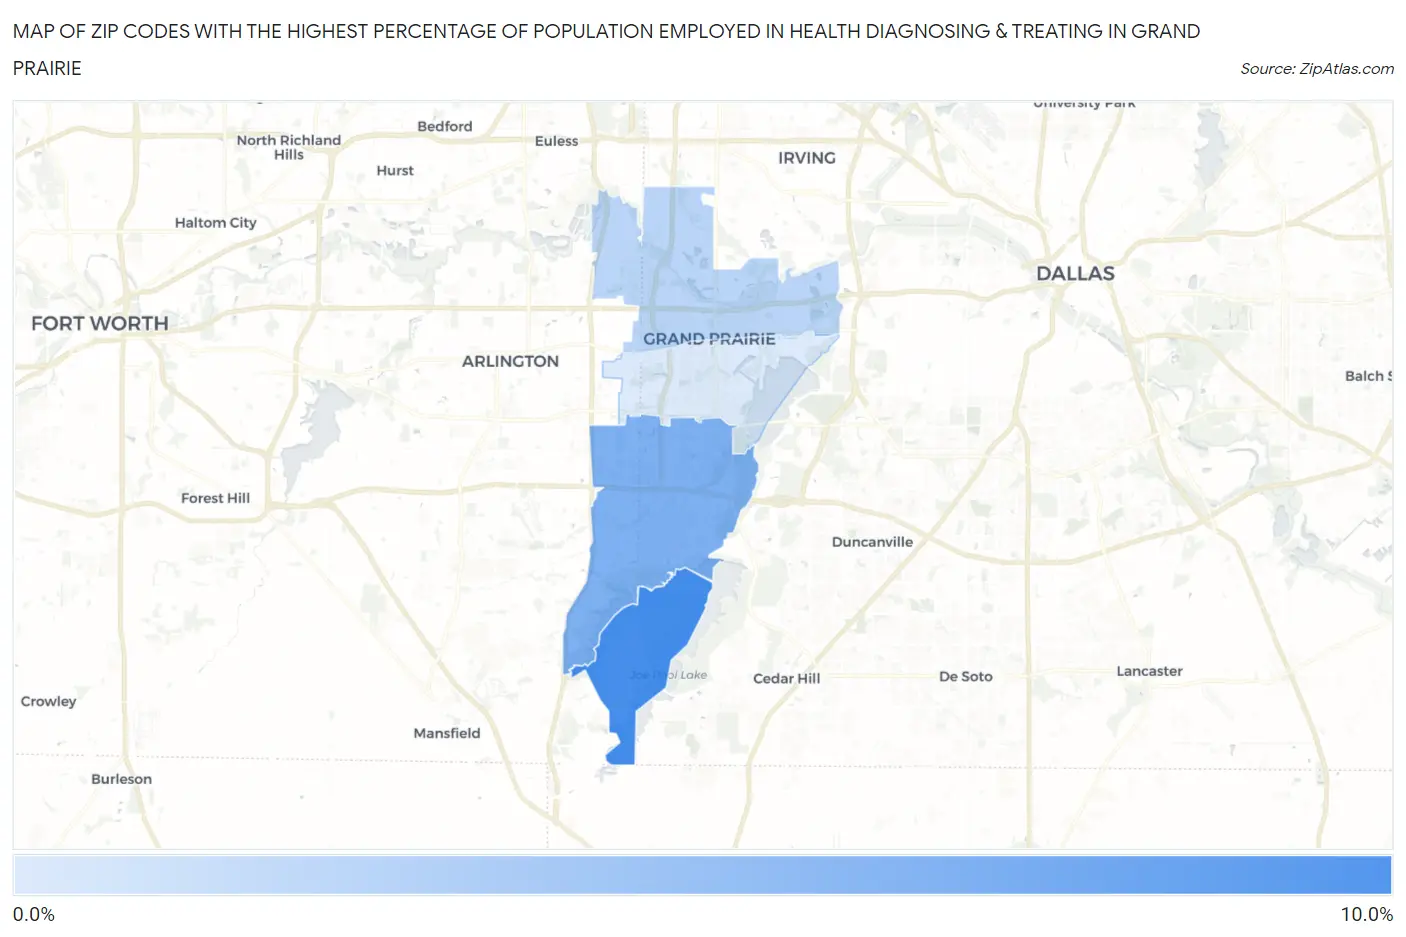
Map of Zip Codes with the Highest Percentage of Population Employed in Health Diagnosing & Treating in Grand Prairie
1.6%
9.4%
Zip Codes with the Highest Percentage of Population Employed in Health Diagnosing & Treating in Grand Prairie, TX
| Zip Code | % Employed | vs State | vs National | |
| 1. | 75054 | 9.4% | 5.5%(+3.83)#202 | 6.2%(+3.11)#4,755 |
| 2. | 75052 | 6.4% | 5.5%(+0.892)#519 | 6.2%(+0.166)#12,332 |
| 3. | 75050 | 3.3% | 5.5%(-2.18)#1,213 | 6.2%(-2.91)#23,353 |
| 4. | 75051 | 1.6% | 5.5%(-3.87)#1,534 | 6.2%(-4.60)#27,010 |
1
Common Questions
What are the Top 3 Zip Codes with the Highest Percentage of Population Employed in Health Diagnosing & Treating in Grand Prairie, TX?
Top 3 Zip Codes with the Highest Percentage of Population Employed in Health Diagnosing & Treating in Grand Prairie, TX are:
What zip code has the Highest Percentage of Population Employed in Health Diagnosing & Treating in Grand Prairie, TX?
75054 has the Highest Percentage of Population Employed in Health Diagnosing & Treating in Grand Prairie, TX with 9.4%.
What is the Percentage of Population Employed in Health Diagnosing & Treating in Grand Prairie, TX?
Percentage of Population Employed in Health Diagnosing & Treating in Grand Prairie is 5.0%.
What is the Percentage of Population Employed in Health Diagnosing & Treating in Texas?
Percentage of Population Employed in Health Diagnosing & Treating in Texas is 5.5%.
What is the Percentage of Population Employed in Health Diagnosing & Treating in the United States?
Percentage of Population Employed in Health Diagnosing & Treating in the United States is 6.2%.