Zip Codes with the Highest Percentage of Population Employed in Health Diagnosing & Treating in Beaumont, TX
RELATED REPORTS & OPTIONS
Health Diagnosing & Treating
Beaumont
Compare Zip Codes
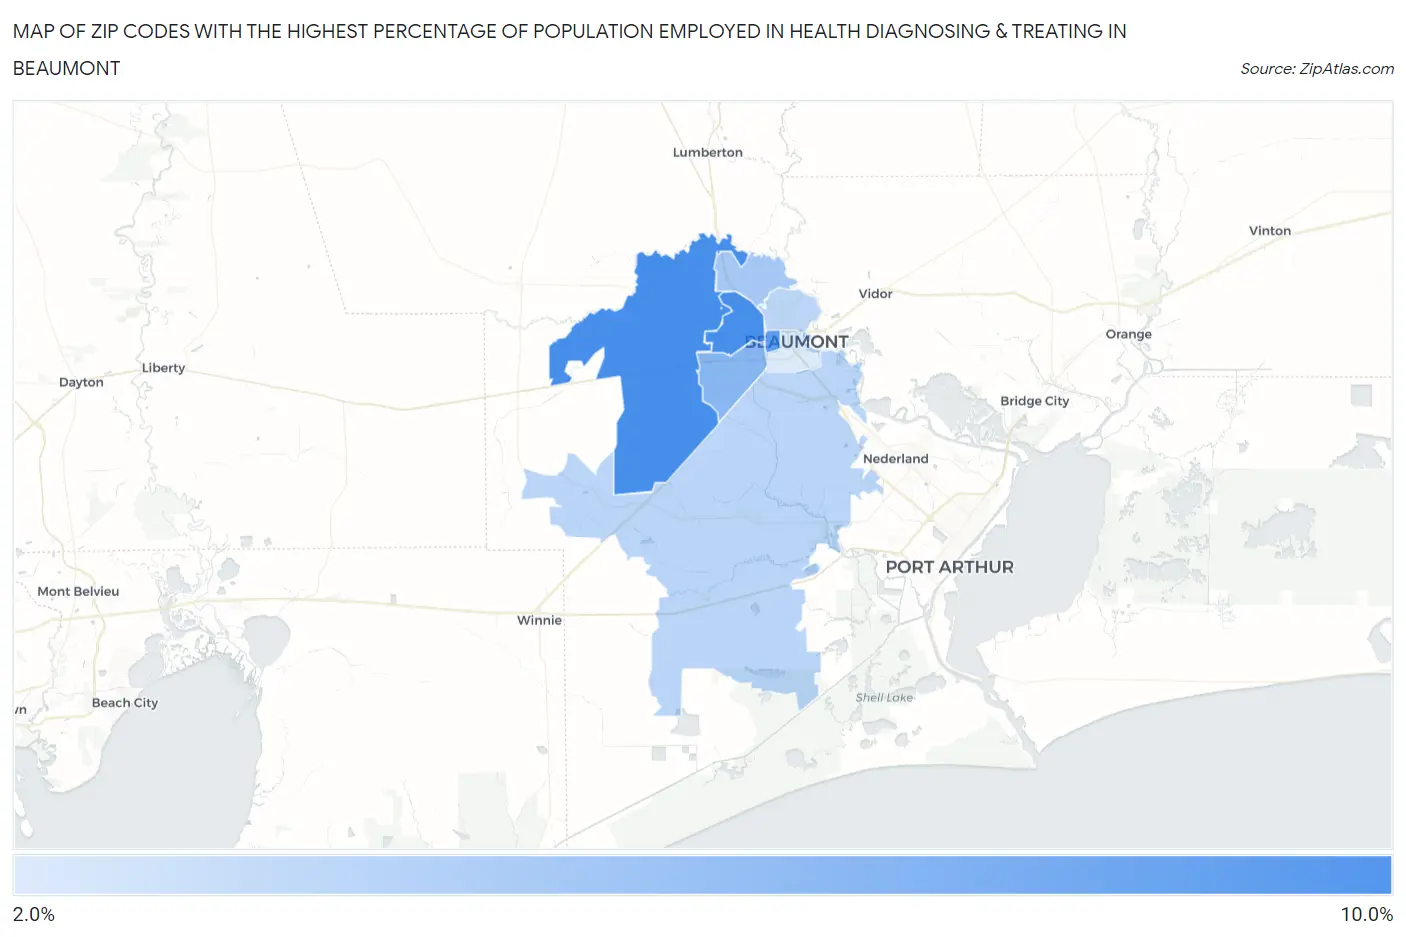
Map of Zip Codes with the Highest Percentage of Population Employed in Health Diagnosing & Treating in Beaumont
2.1%
8.6%
Zip Codes with the Highest Percentage of Population Employed in Health Diagnosing & Treating in Beaumont, TX
| Zip Code | % Employed | vs State | vs National | |
| 1. | 77706 | 8.6% | 5.5%(+3.13)#244 | 6.2%(+2.40)#6,034 |
| 2. | 77713 | 8.6% | 5.5%(+3.08)#250 | 6.2%(+2.35)#6,146 |
| 3. | 77702 | 7.7% | 5.5%(+2.15)#360 | 6.2%(+1.43)#8,323 |
| 4. | 77707 | 5.8% | 5.5%(+0.283)#635 | 6.2%(-0.443)#14,608 |
| 5. | 77708 | 4.4% | 5.5%(-1.12)#966 | 6.2%(-1.85)#20,005 |
| 6. | 77705 | 3.6% | 5.5%(-1.97)#1,165 | 6.2%(-2.69)#22,758 |
| 7. | 77703 | 3.5% | 5.5%(-2.06)#1,185 | 6.2%(-2.79)#23,033 |
| 8. | 77701 | 2.1% | 5.5%(-3.47)#1,456 | 6.2%(-4.19)#26,377 |
1
Common Questions
What are the Top 5 Zip Codes with the Highest Percentage of Population Employed in Health Diagnosing & Treating in Beaumont, TX?
Top 5 Zip Codes with the Highest Percentage of Population Employed in Health Diagnosing & Treating in Beaumont, TX are:
What zip code has the Highest Percentage of Population Employed in Health Diagnosing & Treating in Beaumont, TX?
77706 has the Highest Percentage of Population Employed in Health Diagnosing & Treating in Beaumont, TX with 8.6%.
What is the Percentage of Population Employed in Health Diagnosing & Treating in Beaumont, TX?
Percentage of Population Employed in Health Diagnosing & Treating in Beaumont is 5.4%.
What is the Percentage of Population Employed in Health Diagnosing & Treating in Texas?
Percentage of Population Employed in Health Diagnosing & Treating in Texas is 5.5%.
What is the Percentage of Population Employed in Health Diagnosing & Treating in the United States?
Percentage of Population Employed in Health Diagnosing & Treating in the United States is 6.2%.