Zip Codes with the Highest Percentage of Population Employed in Health Diagnosing & Treating in Bedford, TX
RELATED REPORTS & OPTIONS
Health Diagnosing & Treating
Bedford
Compare Zip Codes
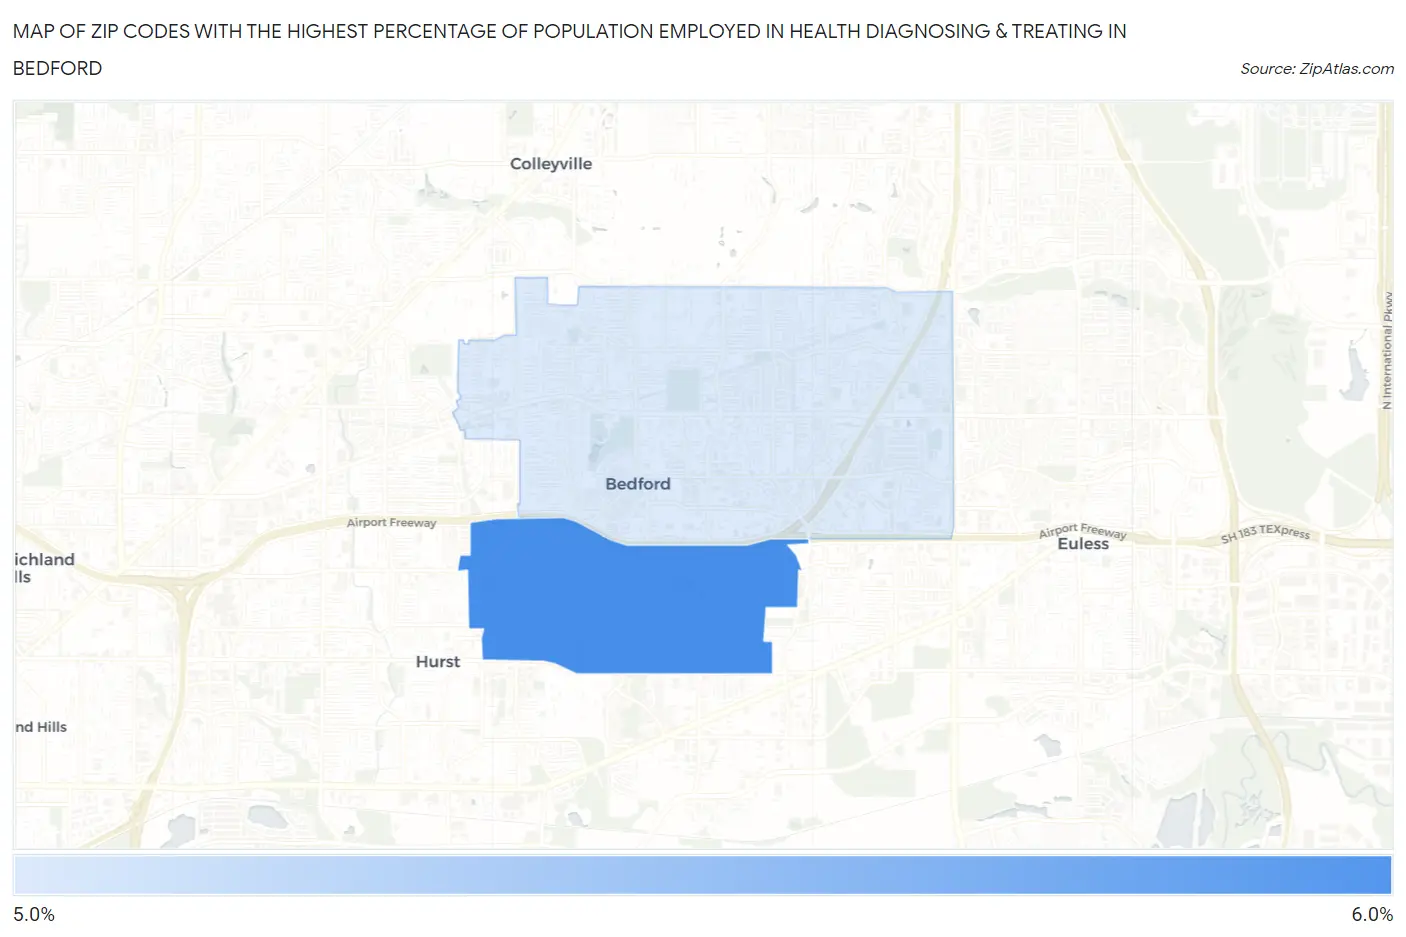
Map of Zip Codes with the Highest Percentage of Population Employed in Health Diagnosing & Treating in Bedford
5.0%
5.6%
Zip Codes with the Highest Percentage of Population Employed in Health Diagnosing & Treating in Bedford, TX
| Zip Code | % Employed | vs State | vs National | |
| 1. | 76022 | 5.6% | 5.5%(+0.130)#669 | 6.2%(-0.596)#15,191 |
| 2. | 76021 | 5.0% | 5.5%(-0.507)#824 | 6.2%(-1.23)#17,651 |
1
Common Questions
What are the Top Zip Codes with the Highest Percentage of Population Employed in Health Diagnosing & Treating in Bedford, TX?
Top Zip Codes with the Highest Percentage of Population Employed in Health Diagnosing & Treating in Bedford, TX are:
What zip code has the Highest Percentage of Population Employed in Health Diagnosing & Treating in Bedford, TX?
76022 has the Highest Percentage of Population Employed in Health Diagnosing & Treating in Bedford, TX with 5.6%.
What is the Percentage of Population Employed in Health Diagnosing & Treating in Bedford, TX?
Percentage of Population Employed in Health Diagnosing & Treating in Bedford is 5.2%.
What is the Percentage of Population Employed in Health Diagnosing & Treating in Texas?
Percentage of Population Employed in Health Diagnosing & Treating in Texas is 5.5%.
What is the Percentage of Population Employed in Health Diagnosing & Treating in the United States?
Percentage of Population Employed in Health Diagnosing & Treating in the United States is 6.2%.