Zip Codes with the Highest Percentage of Population Employed in Health Diagnosing & Treating in Mesquite, TX
RELATED REPORTS & OPTIONS
Health Diagnosing & Treating
Mesquite
Compare Zip Codes
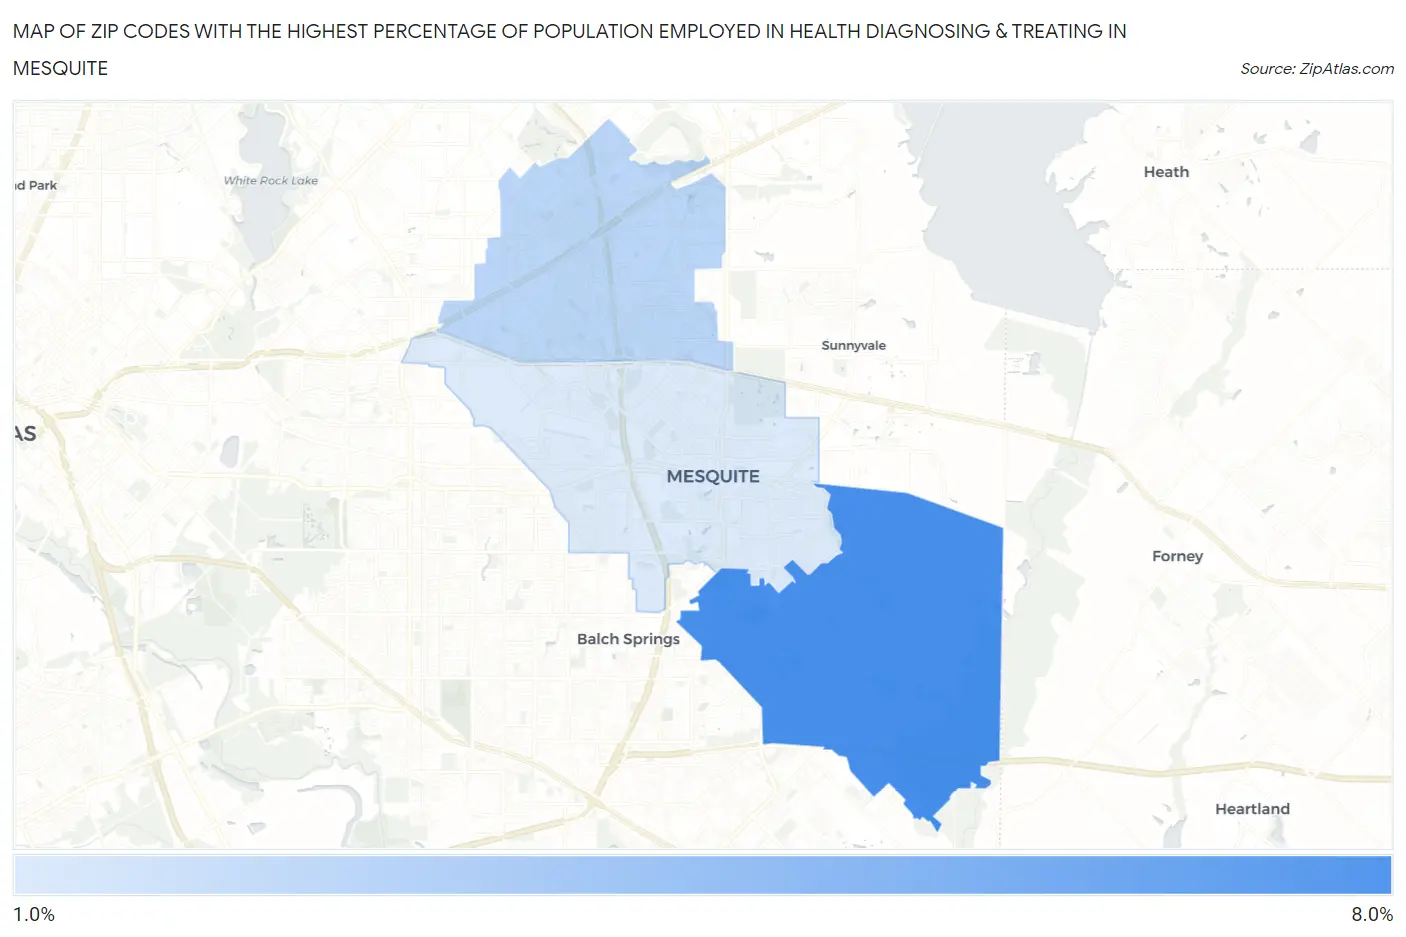
Map of Zip Codes with the Highest Percentage of Population Employed in Health Diagnosing & Treating in Mesquite
1.9%
7.6%
Zip Codes with the Highest Percentage of Population Employed in Health Diagnosing & Treating in Mesquite, TX
| Zip Code | % Employed | vs State | vs National | |
| 1. | 75181 | 7.6% | 5.5%(+2.13)#364 | 6.2%(+1.40)#8,389 |
| 2. | 75150 | 3.2% | 5.5%(-2.35)#1,259 | 6.2%(-3.08)#23,879 |
| 3. | 75149 | 1.9% | 5.5%(-3.62)#1,489 | 6.2%(-4.34)#26,636 |
1
Common Questions
What are the Top Zip Codes with the Highest Percentage of Population Employed in Health Diagnosing & Treating in Mesquite, TX?
Top Zip Codes with the Highest Percentage of Population Employed in Health Diagnosing & Treating in Mesquite, TX are:
What zip code has the Highest Percentage of Population Employed in Health Diagnosing & Treating in Mesquite, TX?
75181 has the Highest Percentage of Population Employed in Health Diagnosing & Treating in Mesquite, TX with 7.6%.
What is the Percentage of Population Employed in Health Diagnosing & Treating in Mesquite, TX?
Percentage of Population Employed in Health Diagnosing & Treating in Mesquite is 9.8%.
What is the Percentage of Population Employed in Health Diagnosing & Treating in Texas?
Percentage of Population Employed in Health Diagnosing & Treating in Texas is 5.5%.
What is the Percentage of Population Employed in Health Diagnosing & Treating in the United States?
Percentage of Population Employed in Health Diagnosing & Treating in the United States is 6.2%.