Zip Codes with the Highest Percentage of Population Employed in Health Diagnosing & Treating in Victoria, TX
RELATED REPORTS & OPTIONS
Health Diagnosing & Treating
Victoria
Compare Zip Codes
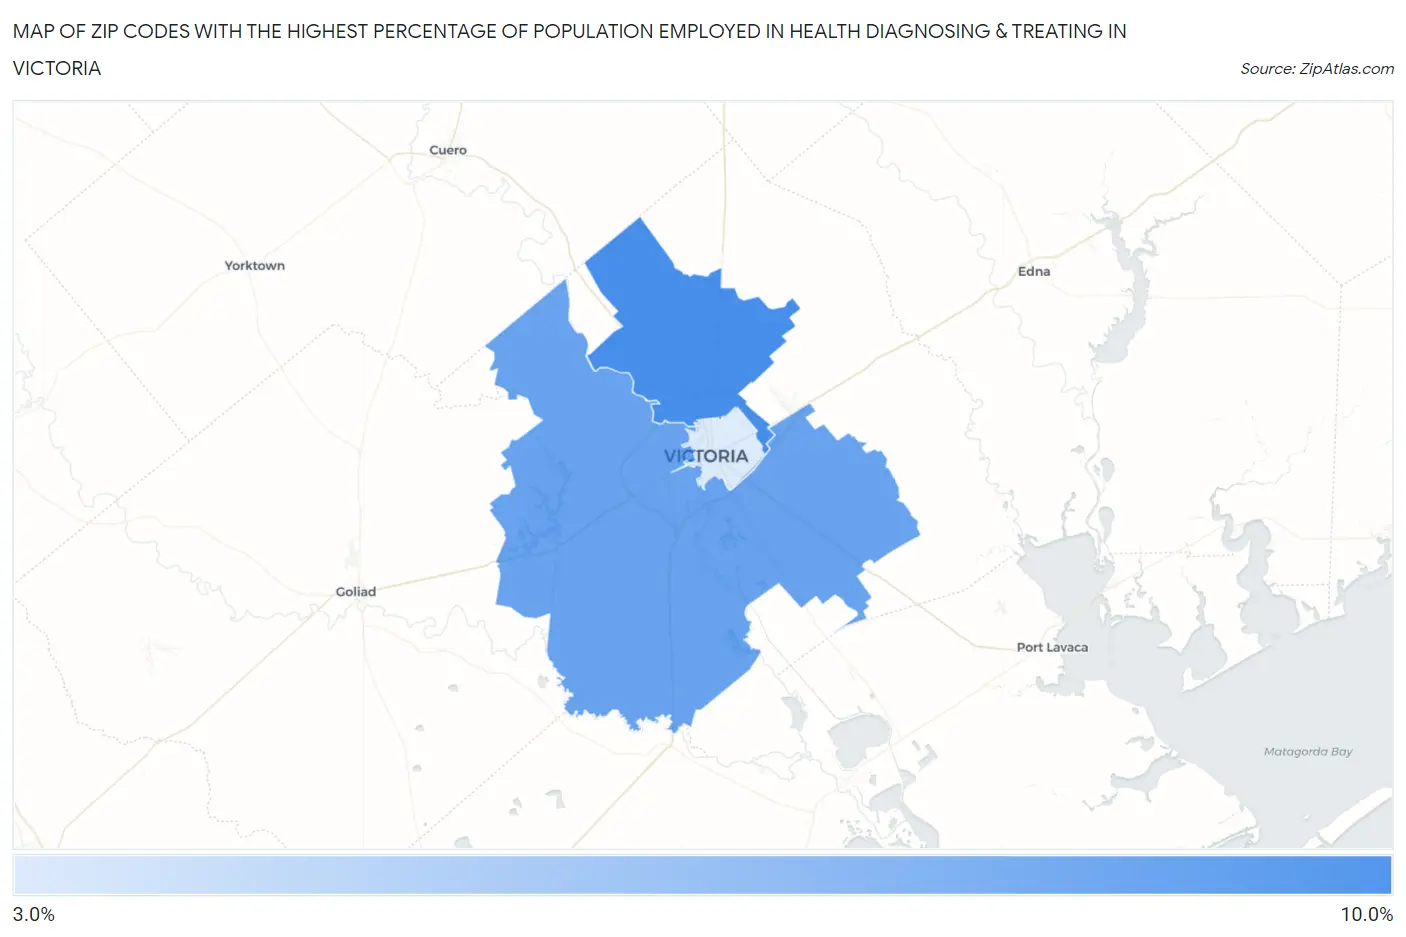
Map of Zip Codes with the Highest Percentage of Population Employed in Health Diagnosing & Treating in Victoria
3.8%
8.9%
Zip Codes with the Highest Percentage of Population Employed in Health Diagnosing & Treating in Victoria, TX
| Zip Code | % Employed | vs State | vs National | |
| 1. | 77904 | 8.9% | 5.5%(+3.35)#229 | 6.2%(+2.62)#5,596 |
| 2. | 77905 | 7.7% | 5.5%(+2.22)#354 | 6.2%(+1.49)#8,164 |
| 3. | 77901 | 3.8% | 5.5%(-1.70)#1,106 | 6.2%(-2.42)#21,937 |
1
Common Questions
What are the Top Zip Codes with the Highest Percentage of Population Employed in Health Diagnosing & Treating in Victoria, TX?
Top Zip Codes with the Highest Percentage of Population Employed in Health Diagnosing & Treating in Victoria, TX are:
What zip code has the Highest Percentage of Population Employed in Health Diagnosing & Treating in Victoria, TX?
77904 has the Highest Percentage of Population Employed in Health Diagnosing & Treating in Victoria, TX with 8.9%.
What is the Percentage of Population Employed in Health Diagnosing & Treating in Victoria, TX?
Percentage of Population Employed in Health Diagnosing & Treating in Victoria is 6.0%.
What is the Percentage of Population Employed in Health Diagnosing & Treating in Texas?
Percentage of Population Employed in Health Diagnosing & Treating in Texas is 5.5%.
What is the Percentage of Population Employed in Health Diagnosing & Treating in the United States?
Percentage of Population Employed in Health Diagnosing & Treating in the United States is 6.2%.