Zip Codes with the Highest Percentage of Population Employed in Health Diagnosing & Treating in Texas City, TX
RELATED REPORTS & OPTIONS
Health Diagnosing & Treating
Texas City
Compare Zip Codes
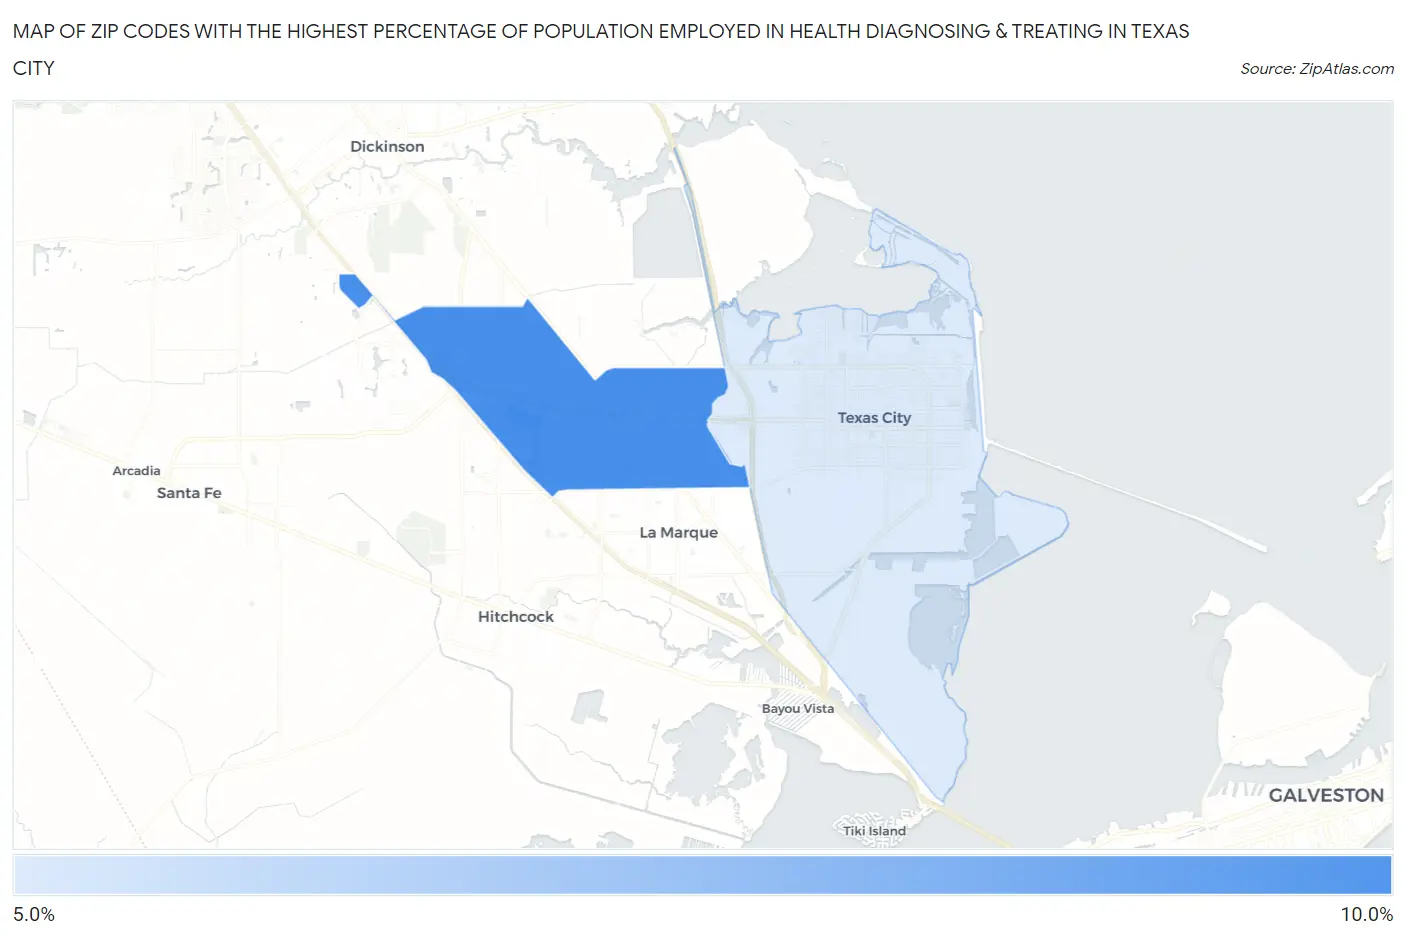
Map of Zip Codes with the Highest Percentage of Population Employed in Health Diagnosing & Treating in Texas City
5.5%
8.1%
Zip Codes with the Highest Percentage of Population Employed in Health Diagnosing & Treating in Texas City, TX
| Zip Code | % Employed | vs State | vs National | |
| 1. | 77591 | 8.1% | 5.5%(+2.58)#304 | 6.2%(+1.86)#7,244 |
| 2. | 77590 | 5.5% | 5.5%(+0.031)#697 | 6.2%(-0.695)#15,599 |
1
Common Questions
What are the Top Zip Codes with the Highest Percentage of Population Employed in Health Diagnosing & Treating in Texas City, TX?
Top Zip Codes with the Highest Percentage of Population Employed in Health Diagnosing & Treating in Texas City, TX are:
What zip code has the Highest Percentage of Population Employed in Health Diagnosing & Treating in Texas City, TX?
77591 has the Highest Percentage of Population Employed in Health Diagnosing & Treating in Texas City, TX with 8.1%.
What is the Percentage of Population Employed in Health Diagnosing & Treating in Texas City, TX?
Percentage of Population Employed in Health Diagnosing & Treating in Texas City is 5.8%.
What is the Percentage of Population Employed in Health Diagnosing & Treating in Texas?
Percentage of Population Employed in Health Diagnosing & Treating in Texas is 5.5%.
What is the Percentage of Population Employed in Health Diagnosing & Treating in the United States?
Percentage of Population Employed in Health Diagnosing & Treating in the United States is 6.2%.