Zip Codes with the Highest Percentage of Population Employed in Health Diagnosing & Treating in Greenville, TX
RELATED REPORTS & OPTIONS
Health Diagnosing & Treating
Greenville
Compare Zip Codes
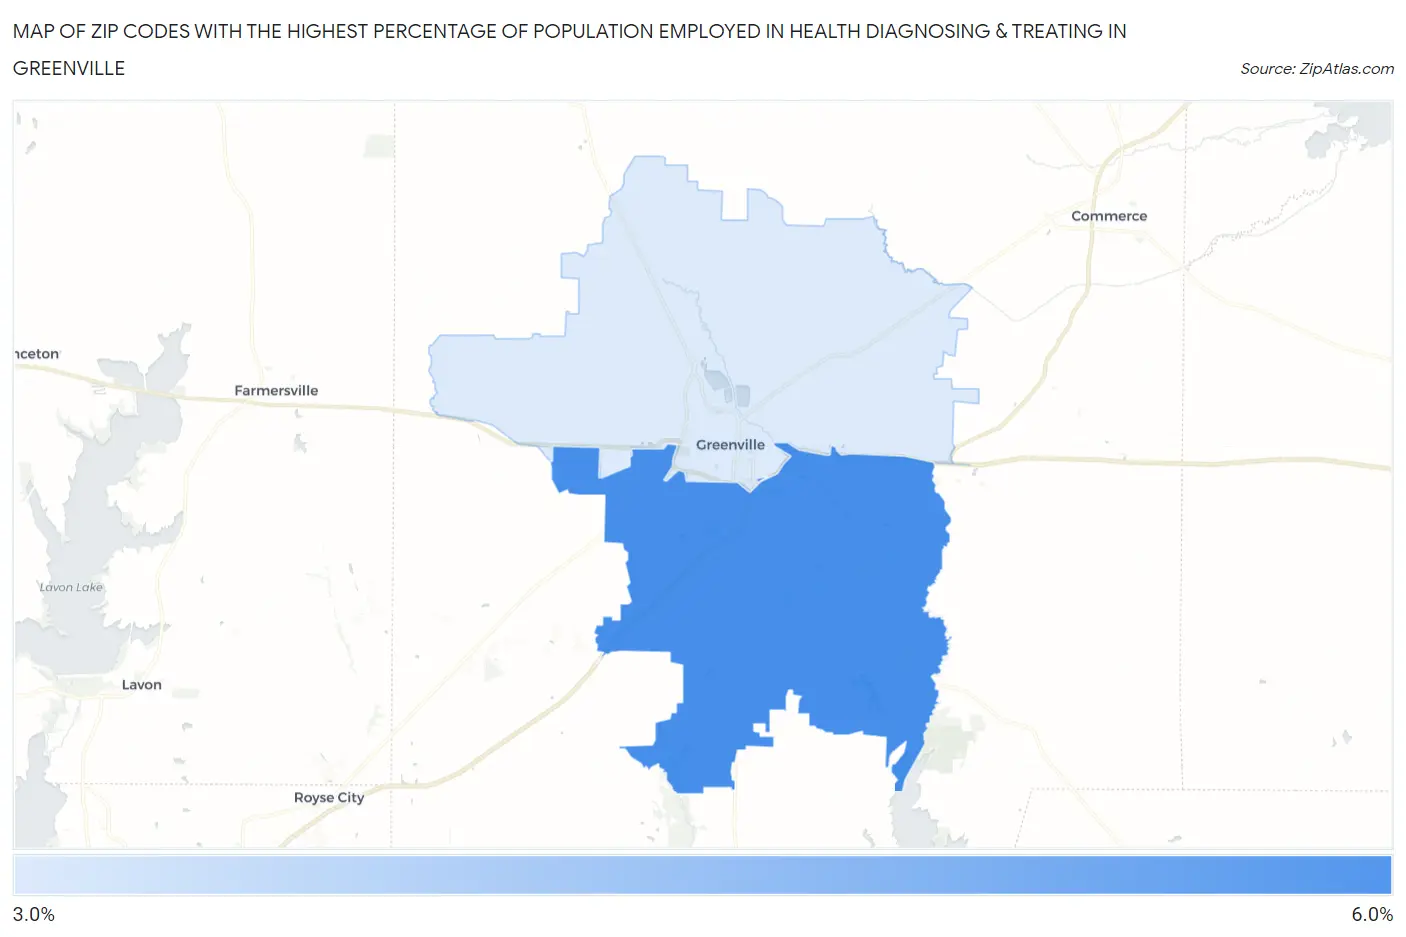
Map of Zip Codes with the Highest Percentage of Population Employed in Health Diagnosing & Treating in Greenville
3.2%
5.8%
Zip Codes with the Highest Percentage of Population Employed in Health Diagnosing & Treating in Greenville, TX
| Zip Code | % Employed | vs State | vs National | |
| 1. | 75402 | 5.8% | 5.5%(+0.236)#644 | 6.2%(-0.490)#14,778 |
| 2. | 75401 | 3.2% | 5.5%(-2.31)#1,243 | 6.2%(-3.03)#23,750 |
1
Common Questions
What are the Top Zip Codes with the Highest Percentage of Population Employed in Health Diagnosing & Treating in Greenville, TX?
Top Zip Codes with the Highest Percentage of Population Employed in Health Diagnosing & Treating in Greenville, TX are:
What zip code has the Highest Percentage of Population Employed in Health Diagnosing & Treating in Greenville, TX?
75402 has the Highest Percentage of Population Employed in Health Diagnosing & Treating in Greenville, TX with 5.8%.
What is the Percentage of Population Employed in Health Diagnosing & Treating in Greenville, TX?
Percentage of Population Employed in Health Diagnosing & Treating in Greenville is 3.3%.
What is the Percentage of Population Employed in Health Diagnosing & Treating in Texas?
Percentage of Population Employed in Health Diagnosing & Treating in Texas is 5.5%.
What is the Percentage of Population Employed in Health Diagnosing & Treating in the United States?
Percentage of Population Employed in Health Diagnosing & Treating in the United States is 6.2%.