Zip Codes with the Highest Percentage of Population with a Degree in Visual and Performing Arts in Granbury, TX
RELATED REPORTS & OPTIONS
Visual and Performing Arts
Granbury
Compare Zip Codes
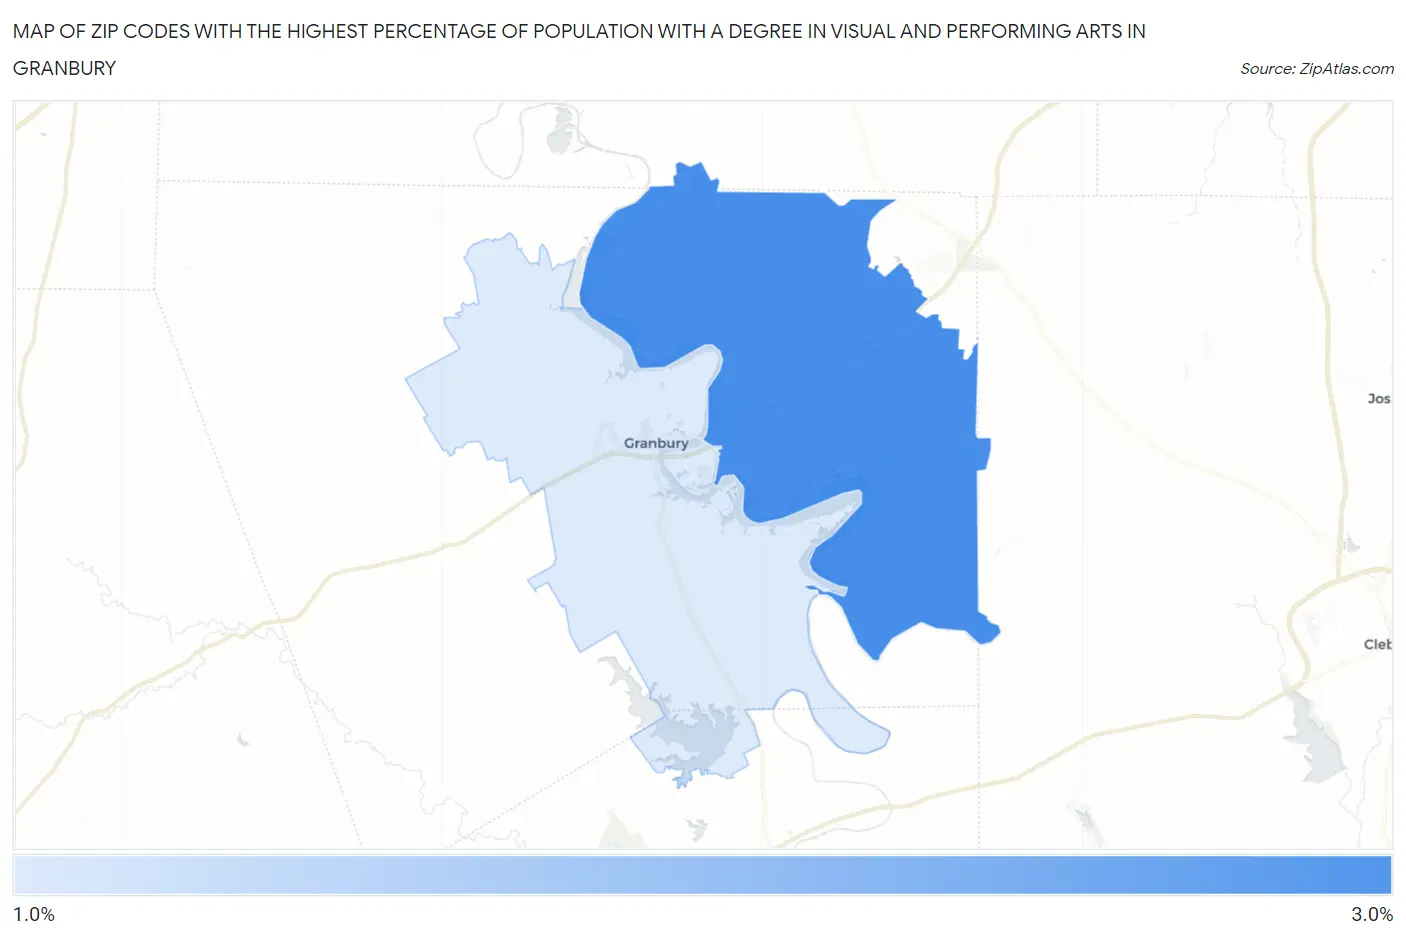
Map of Zip Codes with the Highest Percentage of Population with a Degree in Visual and Performing Arts in Granbury
1.4%
3.0%
Zip Codes with the Highest Percentage of Population with a Degree in Visual and Performing Arts in Granbury, TX
| Zip Code | % Graduates | vs State | vs National | |
| 1. | 76049 | 3.0% | 3.2%(-0.211)#611 | 4.3%(-1.25)#12,733 |
| 2. | 76048 | 1.4% | 3.2%(-1.82)#1,017 | 4.3%(-2.86)#18,491 |
1
Common Questions
What are the Top Zip Codes with the Highest Percentage of Population with a Degree in Visual and Performing Arts in Granbury, TX?
Top Zip Codes with the Highest Percentage of Population with a Degree in Visual and Performing Arts in Granbury, TX are:
What zip code has the Highest Percentage of Population with a Degree in Visual and Performing Arts in Granbury, TX?
76049 has the Highest Percentage of Population with a Degree in Visual and Performing Arts in Granbury, TX with 3.0%.
What is the Percentage of Population with a Degree in Visual and Performing Arts in Granbury, TX?
Percentage of Population with a Degree in Visual and Performing Arts in Granbury is 0.93%.
What is the Percentage of Population with a Degree in Visual and Performing Arts in Texas?
Percentage of Population with a Degree in Visual and Performing Arts in Texas is 3.2%.
What is the Percentage of Population with a Degree in Visual and Performing Arts in the United States?
Percentage of Population with a Degree in Visual and Performing Arts in the United States is 4.3%.