Zip Codes with the Highest Percentage of Population Employed in Computer & Mathematics in Fort Mill, SC
RELATED REPORTS & OPTIONS
Computer & Mathematics
Fort Mill
Compare Zip Codes
Map of Zip Codes with the Highest Percentage of Population Employed in Computer & Mathematics in Fort Mill
4.8%
7.5%
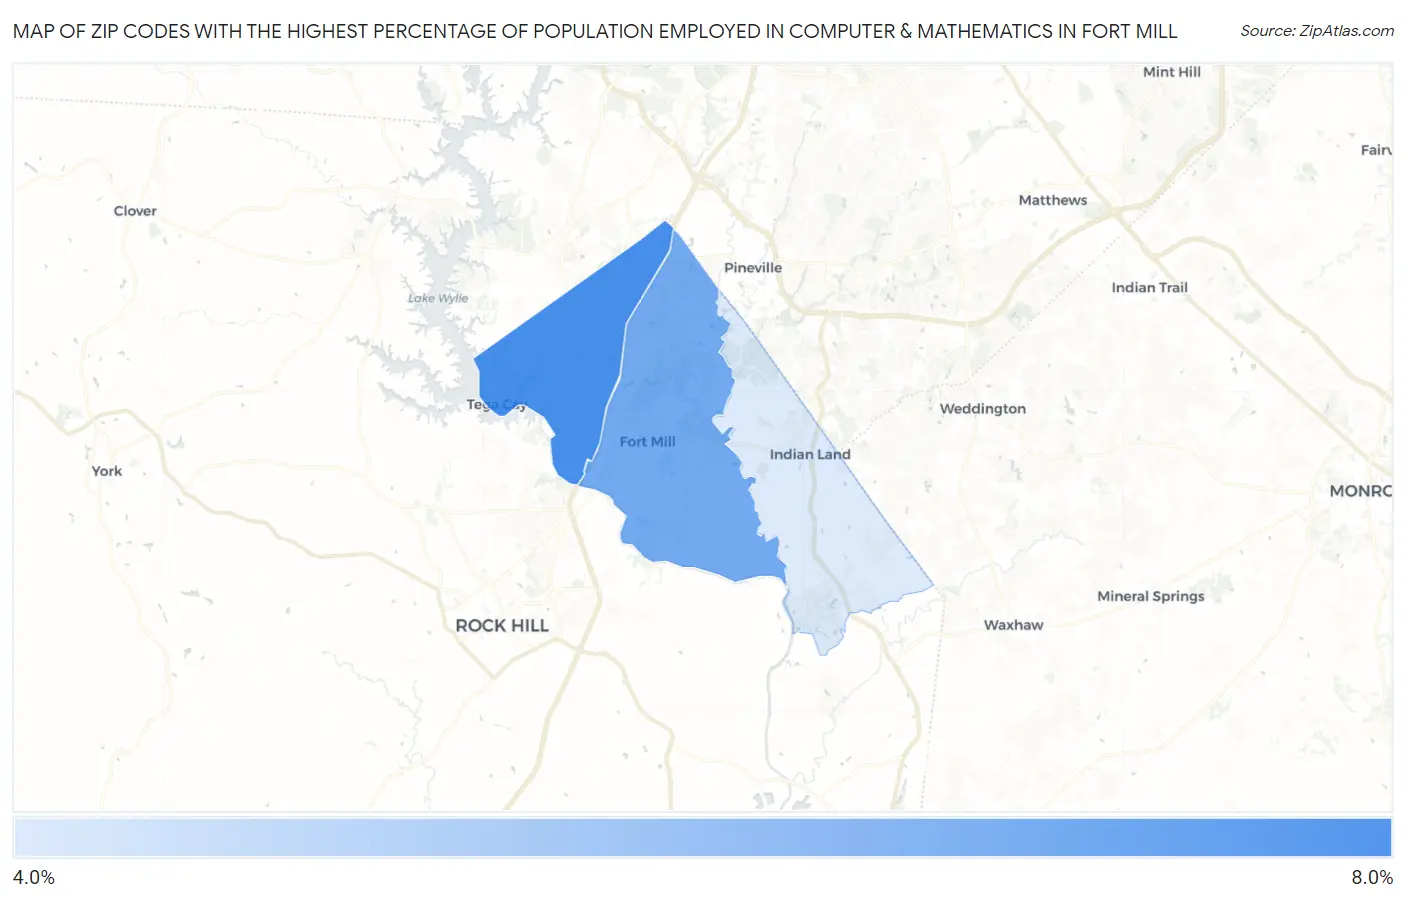
Zip Codes with the Highest Percentage of Population Employed in Computer & Mathematics in Fort Mill, SC
| Zip Code | % Employed | vs State | vs National | |
| 1. | 29708 | 7.5% | 2.4%(+5.03)#6 | 3.5%(+3.93)#1,405 |
| 2. | 29715 | 6.7% | 2.4%(+4.25)#9 | 3.5%(+3.14)#1,818 |
| 3. | 29707 | 4.8% | 2.4%(+2.40)#20 | 3.5%(+1.29)#3,624 |
1
Common Questions
What are the Top Zip Codes with the Highest Percentage of Population Employed in Computer & Mathematics in Fort Mill, SC?
Top Zip Codes with the Highest Percentage of Population Employed in Computer & Mathematics in Fort Mill, SC are:
What zip code has the Highest Percentage of Population Employed in Computer & Mathematics in Fort Mill, SC?
29708 has the Highest Percentage of Population Employed in Computer & Mathematics in Fort Mill, SC with 7.5%.
What is the Percentage of Population Employed in Computer & Mathematics in Fort Mill, SC?
Percentage of Population Employed in Computer & Mathematics in Fort Mill is 5.7%.
What is the Percentage of Population Employed in Computer & Mathematics in South Carolina?
Percentage of Population Employed in Computer & Mathematics in South Carolina is 2.4%.
What is the Percentage of Population Employed in Computer & Mathematics in the United States?
Percentage of Population Employed in Computer & Mathematics in the United States is 3.5%.