Zip Codes with the Highest Percentage of Population Employed in Administrative & Support Services in Fort Mill, SC
RELATED REPORTS & OPTIONS
Administrative & Support Services
Fort Mill
Compare Zip Codes
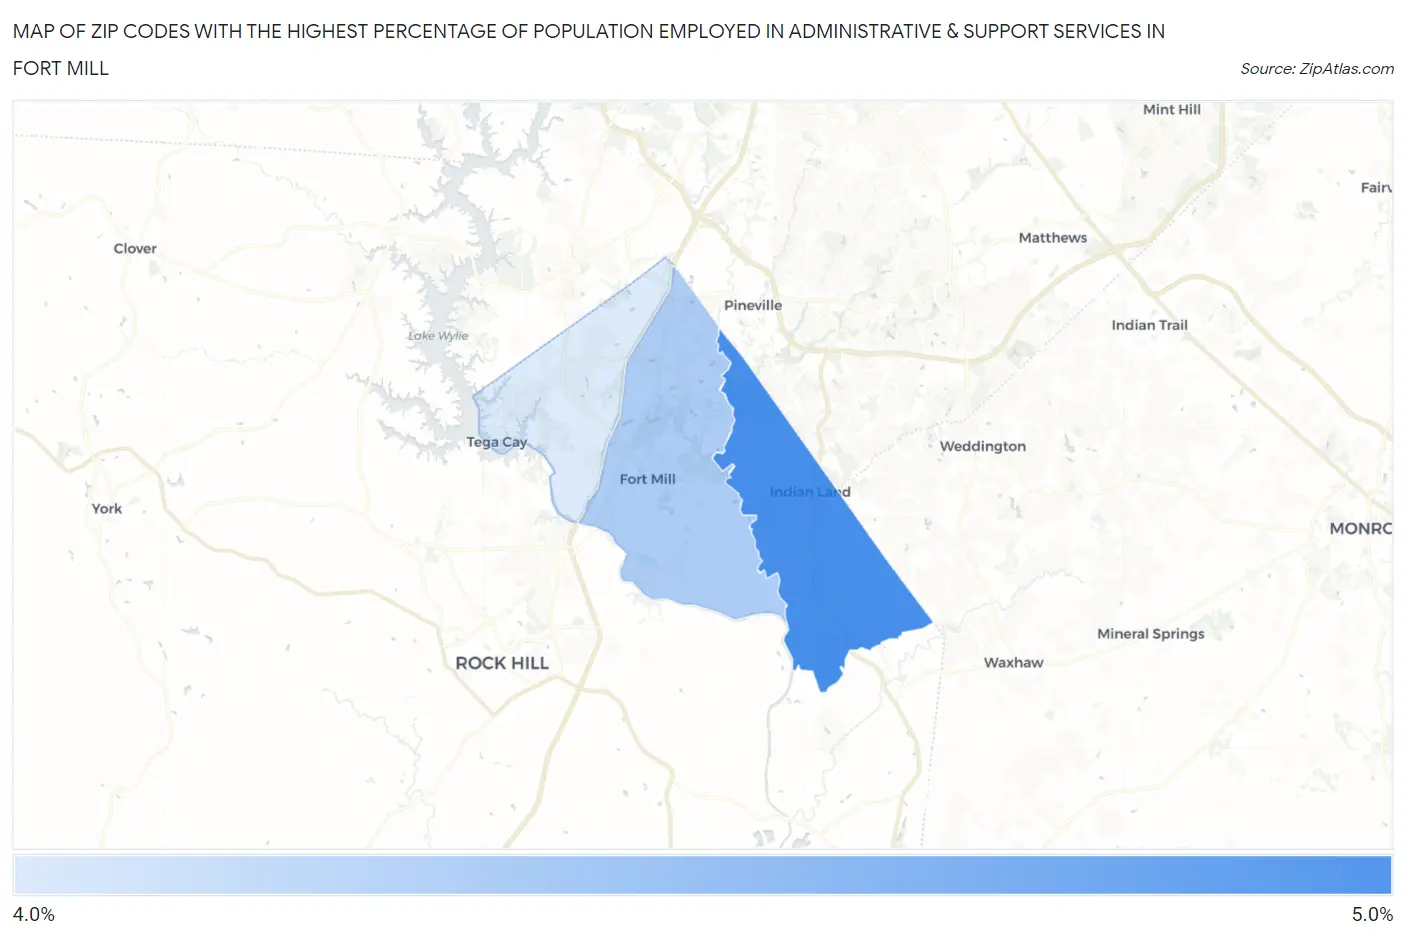
Map of Zip Codes with the Highest Percentage of Population Employed in Administrative & Support Services in Fort Mill
4.3%
4.5%
Zip Codes with the Highest Percentage of Population Employed in Administrative & Support Services in Fort Mill, SC
| Zip Code | % Employed | vs State | vs National | |
| 1. | 29707 | 4.5% | 4.8%(-0.314)#192 | 4.1%(+0.380)#8,624 |
| 2. | 29715 | 4.3% | 4.8%(-0.497)#203 | 4.1%(+0.197)#9,306 |
| 3. | 29708 | 4.3% | 4.8%(-0.585)#207 | 4.1%(+0.109)#9,596 |
1
Common Questions
What are the Top Zip Codes with the Highest Percentage of Population Employed in Administrative & Support Services in Fort Mill, SC?
Top Zip Codes with the Highest Percentage of Population Employed in Administrative & Support Services in Fort Mill, SC are:
What zip code has the Highest Percentage of Population Employed in Administrative & Support Services in Fort Mill, SC?
29707 has the Highest Percentage of Population Employed in Administrative & Support Services in Fort Mill, SC with 4.5%.
What is the Percentage of Population Employed in Administrative & Support Services in Fort Mill, SC?
Percentage of Population Employed in Administrative & Support Services in Fort Mill is 3.5%.
What is the Percentage of Population Employed in Administrative & Support Services in South Carolina?
Percentage of Population Employed in Administrative & Support Services in South Carolina is 4.8%.
What is the Percentage of Population Employed in Administrative & Support Services in the United States?
Percentage of Population Employed in Administrative & Support Services in the United States is 4.1%.