Zip Codes with the Highest Percentage of Population Employed in Legal Services & Support in Fort Mill, SC
RELATED REPORTS & OPTIONS
Legal Services & Support
Fort Mill
Compare Zip Codes
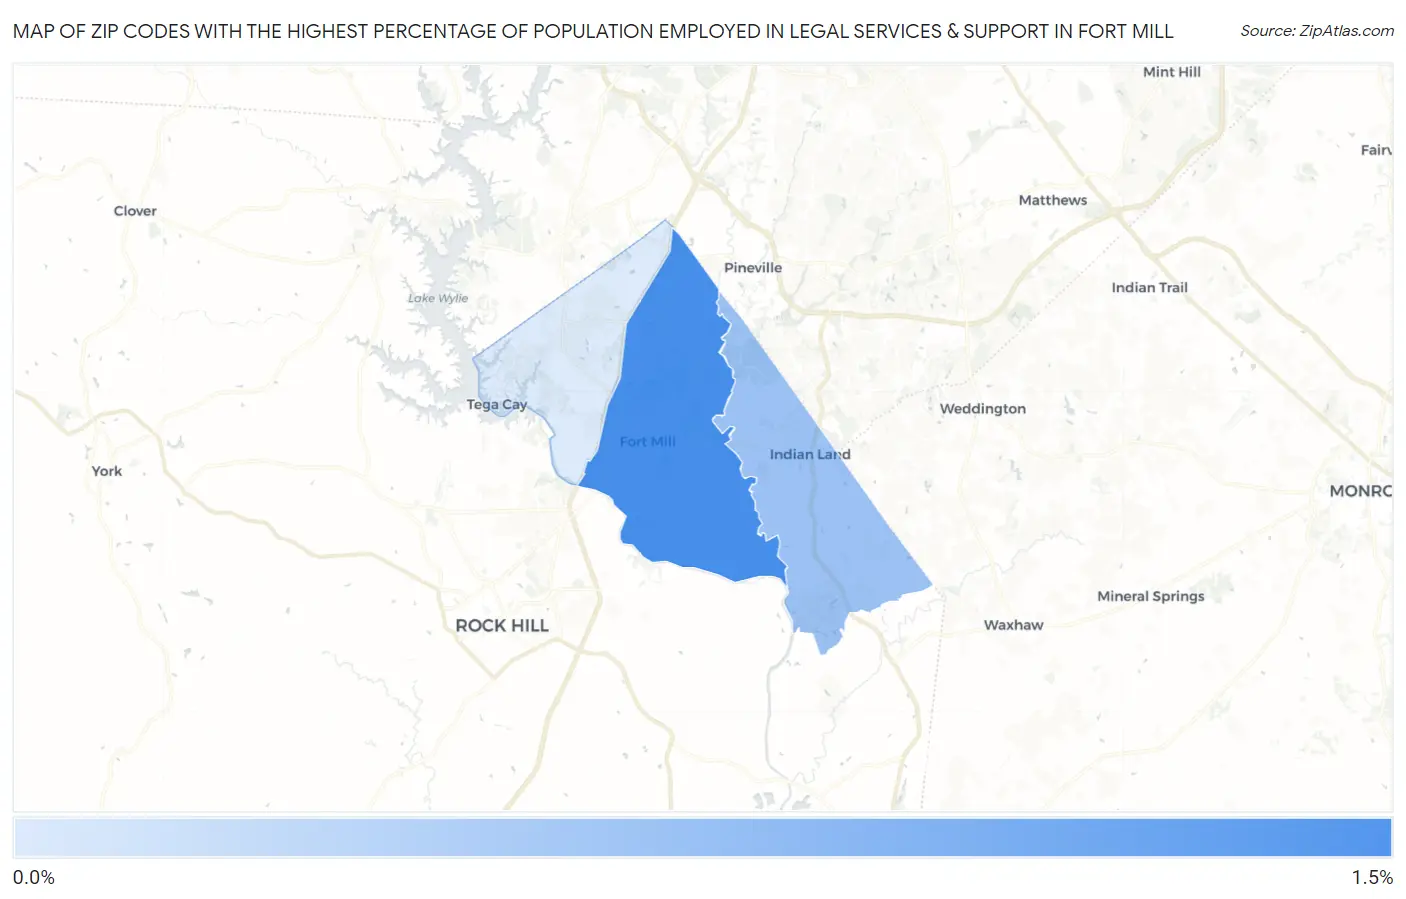
Map of Zip Codes with the Highest Percentage of Population Employed in Legal Services & Support in Fort Mill
0.47%
1.3%
Zip Codes with the Highest Percentage of Population Employed in Legal Services & Support in Fort Mill, SC
| Zip Code | % Employed | vs State | vs National | |
| 1. | 29715 | 1.3% | 0.97%(+0.357)#68 | 1.2%(+0.148)#5,779 |
| 2. | 29707 | 0.84% | 0.97%(-0.134)#108 | 1.2%(-0.344)#9,102 |
| 3. | 29708 | 0.47% | 0.97%(-0.502)#159 | 1.2%(-0.711)#12,980 |
1
Common Questions
What are the Top Zip Codes with the Highest Percentage of Population Employed in Legal Services & Support in Fort Mill, SC?
Top Zip Codes with the Highest Percentage of Population Employed in Legal Services & Support in Fort Mill, SC are:
What zip code has the Highest Percentage of Population Employed in Legal Services & Support in Fort Mill, SC?
29715 has the Highest Percentage of Population Employed in Legal Services & Support in Fort Mill, SC with 1.3%.
What is the Percentage of Population Employed in Legal Services & Support in Fort Mill, SC?
Percentage of Population Employed in Legal Services & Support in Fort Mill is 1.6%.
What is the Percentage of Population Employed in Legal Services & Support in South Carolina?
Percentage of Population Employed in Legal Services & Support in South Carolina is 0.97%.
What is the Percentage of Population Employed in Legal Services & Support in the United States?
Percentage of Population Employed in Legal Services & Support in the United States is 1.2%.