Black/African American Single Male Poverty
COMPARE
Black/African American
Select to Compare
Single Male Poverty
Black/African American Single Male Poverty
16.2%
POVERTY | SINGLE MALES
0.0/ 100
METRIC RATING
317th/ 347
METRIC RANK
Black/African American Single Male Poverty Correlation Chart
The statistical analysis conducted on geographies consisting of 472,674,082 people shows a significant positive correlation between the proportion of Blacks/African Americans and poverty level among single males in the United States with a correlation coefficient (R) of 0.670 and weighted average of 16.2%. On average, for every 1% (one percent) increase in Blacks/African Americans within a typical geography, there is an increase of 0.12% in poverty level among single males.
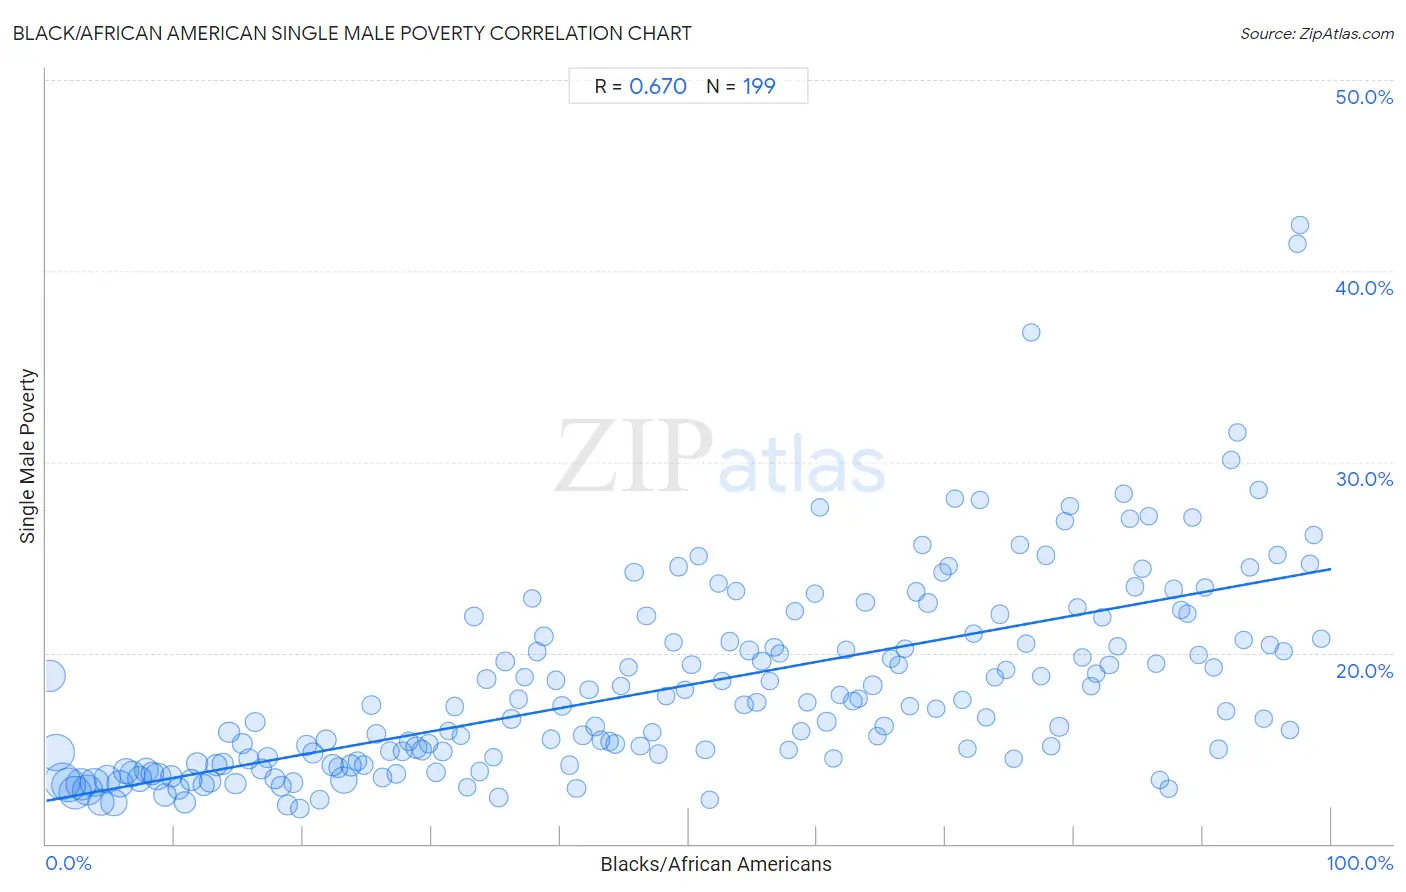
It is essential to understand that the correlation between the percentage of Blacks/African Americans and poverty level among single males does not imply a direct cause-and-effect relationship. It remains uncertain whether the presence of Blacks/African Americans influences an upward or downward trend in the level of poverty level among single males within an area, or if Blacks/African Americans simply ended up residing in those areas with higher or lower levels of poverty level among single males due to other factors.
Demographics Similar to Blacks/African Americans by Single Male Poverty
In terms of single male poverty, the demographic groups most similar to Blacks/African Americans are Dutch West Indian (16.1%, a difference of 0.34%), Cheyenne (16.1%, a difference of 0.48%), Alaskan Athabascan (16.1%, a difference of 0.53%), Chickasaw (16.3%, a difference of 0.80%), and Cherokee (16.1%, a difference of 0.82%).
| Demographics | Rating | Rank | Single Male Poverty |
| Yakama | 0.0 /100 | #310 | Tragic 15.9% |
| Seminole | 0.0 /100 | #311 | Tragic 16.0% |
| Comanche | 0.0 /100 | #312 | Tragic 16.0% |
| Cherokee | 0.0 /100 | #313 | Tragic 16.1% |
| Alaskan Athabascans | 0.0 /100 | #314 | Tragic 16.1% |
| Cheyenne | 0.0 /100 | #315 | Tragic 16.1% |
| Dutch West Indians | 0.0 /100 | #316 | Tragic 16.1% |
| Blacks/African Americans | 0.0 /100 | #317 | Tragic 16.2% |
| Chickasaw | 0.0 /100 | #318 | Tragic 16.3% |
| Chippewa | 0.0 /100 | #319 | Tragic 16.4% |
| Marshallese | 0.0 /100 | #320 | Tragic 16.4% |
| Osage | 0.0 /100 | #321 | Tragic 16.5% |
| Shoshone | 0.0 /100 | #322 | Tragic 16.7% |
| Creek | 0.0 /100 | #323 | Tragic 16.8% |
| Immigrants from Yemen | 0.0 /100 | #324 | Tragic 16.9% |
Black/African American Single Male Poverty Correlation Summary
| Measurement | Black/African American Data | Single Male Poverty Data |
| Minimum | 0.27% | 11.9% |
| Maximum | 99.2% | 42.4% |
| Range | 98.9% | 30.6% |
| Mean | 49.7% | 18.3% |
| Median | 49.7% | 17.2% |
| Interquartile 25% (IQ1) | 24.7% | 14.2% |
| Interquartile 75% (IQ3) | 74.7% | 20.7% |
| Interquartile Range (IQR) | 49.9% | 6.5% |
| Standard Deviation (Sample) | 28.8% | 5.2% |
| Standard Deviation (Population) | 28.7% | 5.2% |
Correlation Details
| Black/African American Percentile | Sample Size | Single Male Poverty |
[ 0.0% - 0.5% ] 0.27% | 19,152,354 | 18.8% |
[ 0.5% - 1.0% ] 0.74% | 24,858,956 | 14.8% |
[ 1.0% - 1.5% ] 1.23% | 24,897,825 | 13.3% |
[ 1.5% - 2.0% ] 1.73% | 21,859,176 | 13.1% |
[ 2.0% - 2.5% ] 2.24% | 19,598,636 | 12.7% |
[ 2.5% - 3.0% ] 2.76% | 16,733,884 | 13.1% |
[ 3.0% - 3.5% ] 3.25% | 16,588,737 | 12.8% |
[ 3.5% - 4.0% ] 3.74% | 13,446,970 | 13.2% |
[ 4.0% - 4.5% ] 4.24% | 12,527,249 | 12.2% |
[ 4.5% - 5.0% ] 4.74% | 12,190,261 | 13.4% |
[ 5.0% - 5.5% ] 5.24% | 11,297,490 | 12.1% |
[ 5.5% - 6.0% ] 5.76% | 11,726,216 | 13.1% |
[ 6.0% - 6.5% ] 6.23% | 10,247,600 | 13.8% |
[ 6.5% - 7.0% ] 6.72% | 10,095,067 | 13.7% |
[ 7.0% - 7.5% ] 7.26% | 9,368,248 | 13.4% |
[ 7.5% - 8.0% ] 7.75% | 8,021,834 | 13.8% |
[ 8.0% - 8.5% ] 8.24% | 7,224,020 | 13.7% |
[ 8.5% - 9.0% ] 8.69% | 11,186,487 | 13.5% |
[ 9.0% - 9.5% ] 9.23% | 6,660,806 | 12.5% |
[ 9.5% - 10.0% ] 9.75% | 4,870,292 | 13.5% |
[ 10.0% - 10.5% ] 10.27% | 5,465,219 | 12.9% |
[ 10.5% - 11.0% ] 10.76% | 5,282,642 | 12.2% |
[ 11.0% - 11.5% ] 11.27% | 4,972,564 | 13.3% |
[ 11.5% - 12.0% ] 11.75% | 5,986,005 | 14.2% |
[ 12.0% - 12.5% ] 12.23% | 5,143,582 | 13.1% |
[ 12.5% - 13.0% ] 12.74% | 4,543,972 | 13.3% |
[ 13.0% - 13.5% ] 13.27% | 4,736,157 | 14.1% |
[ 13.5% - 14.0% ] 13.72% | 4,481,100 | 14.2% |
[ 14.0% - 14.5% ] 14.23% | 3,904,423 | 15.8% |
[ 14.5% - 15.0% ] 14.73% | 3,594,699 | 13.2% |
[ 15.0% - 15.5% ] 15.25% | 3,833,716 | 15.2% |
[ 15.5% - 16.0% ] 15.74% | 3,082,437 | 14.4% |
[ 16.0% - 16.5% ] 16.25% | 2,868,077 | 16.4% |
[ 16.5% - 17.0% ] 16.75% | 2,875,194 | 13.9% |
[ 17.0% - 17.5% ] 17.21% | 3,056,847 | 14.5% |
[ 17.5% - 18.0% ] 17.77% | 3,382,357 | 13.4% |
[ 18.0% - 18.5% ] 18.26% | 3,336,165 | 13.0% |
[ 18.5% - 19.0% ] 18.73% | 3,329,045 | 12.1% |
[ 19.0% - 19.5% ] 19.23% | 2,900,691 | 13.2% |
[ 19.5% - 20.0% ] 19.75% | 2,159,291 | 11.9% |
[ 20.0% - 20.5% ] 20.24% | 2,388,260 | 15.2% |
[ 20.5% - 21.0% ] 20.76% | 2,107,906 | 14.7% |
[ 21.0% - 21.5% ] 21.29% | 2,465,752 | 12.3% |
[ 21.5% - 22.0% ] 21.77% | 3,581,153 | 15.5% |
[ 22.0% - 22.5% ] 22.31% | 4,574,763 | 14.1% |
[ 22.5% - 23.0% ] 22.71% | 2,872,733 | 14.0% |
[ 23.0% - 23.5% ] 23.15% | 11,439,634 | 13.4% |
[ 23.5% - 24.0% ] 23.75% | 3,779,205 | 14.1% |
[ 24.0% - 24.5% ] 24.22% | 1,897,076 | 14.3% |
[ 24.5% - 25.0% ] 24.73% | 1,608,636 | 14.1% |
[ 25.0% - 25.5% ] 25.27% | 1,379,446 | 17.3% |
[ 25.5% - 26.0% ] 25.71% | 1,342,291 | 15.8% |
[ 26.0% - 26.5% ] 26.21% | 1,637,112 | 13.5% |
[ 26.5% - 27.0% ] 26.77% | 1,948,609 | 14.8% |
[ 27.0% - 27.5% ] 27.23% | 1,478,769 | 13.6% |
[ 27.5% - 28.0% ] 27.76% | 1,426,294 | 14.9% |
[ 28.0% - 28.5% ] 28.21% | 1,761,060 | 15.4% |
[ 28.5% - 29.0% ] 28.80% | 4,654,564 | 15.0% |
[ 29.0% - 29.5% ] 29.24% | 3,117,571 | 14.9% |
[ 29.5% - 30.0% ] 29.77% | 1,813,692 | 15.2% |
[ 30.0% - 30.5% ] 30.36% | 2,137,225 | 13.7% |
[ 30.5% - 31.0% ] 30.82% | 1,109,174 | 14.8% |
[ 31.0% - 31.5% ] 31.30% | 829,588 | 15.9% |
[ 31.5% - 32.0% ] 31.80% | 884,858 | 17.2% |
[ 32.0% - 32.5% ] 32.27% | 1,144,730 | 15.7% |
[ 32.5% - 33.0% ] 32.74% | 636,377 | 13.0% |
[ 33.0% - 33.5% ] 33.25% | 1,128,205 | 21.9% |
[ 33.5% - 34.0% ] 33.74% | 858,976 | 13.8% |
[ 34.0% - 34.5% ] 34.28% | 746,697 | 18.6% |
[ 34.5% - 35.0% ] 34.79% | 805,730 | 14.5% |
[ 35.0% - 35.5% ] 35.24% | 1,698,635 | 12.5% |
[ 35.5% - 36.0% ] 35.74% | 1,152,253 | 19.5% |
[ 36.0% - 36.5% ] 36.23% | 1,117,435 | 16.5% |
[ 36.5% - 37.0% ] 36.75% | 484,887 | 17.6% |
[ 37.0% - 37.5% ] 37.25% | 888,218 | 18.7% |
[ 37.5% - 38.0% ] 37.80% | 771,240 | 22.8% |
[ 38.0% - 38.5% ] 38.18% | 906,714 | 20.1% |
[ 38.5% - 39.0% ] 38.70% | 1,329,663 | 20.9% |
[ 39.0% - 39.5% ] 39.31% | 470,736 | 15.5% |
[ 39.5% - 40.0% ] 39.68% | 827,735 | 18.5% |
[ 40.0% - 40.5% ] 40.15% | 2,644,631 | 17.2% |
[ 40.5% - 41.0% ] 40.72% | 1,126,802 | 14.1% |
[ 41.0% - 41.5% ] 41.26% | 961,237 | 12.9% |
[ 41.5% - 42.0% ] 41.75% | 874,615 | 15.7% |
[ 42.0% - 42.5% ] 42.25% | 791,853 | 18.1% |
[ 42.5% - 43.0% ] 42.73% | 963,721 | 16.1% |
[ 43.0% - 43.5% ] 43.18% | 952,220 | 15.4% |
[ 43.5% - 44.0% ] 43.83% | 864,715 | 15.4% |
[ 44.0% - 44.5% ] 44.29% | 1,121,944 | 15.2% |
[ 44.5% - 45.0% ] 44.74% | 617,997 | 18.3% |
[ 45.0% - 45.5% ] 45.34% | 597,138 | 19.2% |
[ 45.5% - 46.0% ] 45.74% | 577,040 | 24.2% |
[ 46.0% - 46.5% ] 46.25% | 626,254 | 15.1% |
[ 46.5% - 47.0% ] 46.71% | 987,815 | 21.9% |
[ 47.0% - 47.5% ] 47.15% | 643,463 | 15.8% |
[ 47.5% - 48.0% ] 47.64% | 961,429 | 14.7% |
[ 48.0% - 48.5% ] 48.26% | 283,644 | 17.7% |
[ 48.5% - 49.0% ] 48.84% | 460,922 | 20.5% |
[ 49.0% - 49.5% ] 49.23% | 459,221 | 24.5% |
[ 49.5% - 50.0% ] 49.73% | 452,748 | 18.1% |
[ 50.0% - 50.5% ] 50.24% | 867,205 | 19.4% |
[ 50.5% - 51.0% ] 50.77% | 166,564 | 25.0% |
[ 51.0% - 51.5% ] 51.31% | 484,069 | 14.9% |
[ 51.5% - 52.0% ] 51.63% | 613,816 | 12.3% |
[ 52.0% - 52.5% ] 52.29% | 502,474 | 23.6% |
[ 52.5% - 53.0% ] 52.62% | 649,125 | 18.5% |
[ 53.0% - 53.5% ] 53.21% | 675,271 | 20.6% |
[ 53.5% - 54.0% ] 53.72% | 357,531 | 23.2% |
[ 54.0% - 54.5% ] 54.33% | 662,138 | 17.3% |
[ 54.5% - 55.0% ] 54.71% | 337,772 | 20.1% |
[ 55.0% - 55.5% ] 55.29% | 407,969 | 17.4% |
[ 55.5% - 56.0% ] 55.68% | 439,006 | 19.5% |
[ 56.0% - 56.5% ] 56.33% | 489,722 | 18.5% |
[ 56.5% - 57.0% ] 56.66% | 466,180 | 20.3% |
[ 57.0% - 57.5% ] 57.10% | 661,094 | 19.9% |
[ 57.5% - 58.0% ] 57.78% | 276,836 | 14.9% |
[ 58.0% - 58.5% ] 58.22% | 286,008 | 22.2% |
[ 58.5% - 59.0% ] 58.77% | 257,692 | 15.9% |
[ 59.0% - 59.5% ] 59.20% | 320,824 | 17.4% |
[ 59.5% - 60.0% ] 59.78% | 338,657 | 23.1% |
[ 60.0% - 60.5% ] 60.22% | 236,209 | 27.6% |
[ 60.5% - 61.0% ] 60.75% | 412,688 | 16.4% |
[ 61.0% - 61.5% ] 61.26% | 821,491 | 14.5% |
[ 61.5% - 62.0% ] 61.73% | 372,681 | 17.8% |
[ 62.0% - 62.5% ] 62.27% | 420,596 | 20.1% |
[ 62.5% - 63.0% ] 62.78% | 494,137 | 17.5% |
[ 63.0% - 63.5% ] 63.24% | 286,096 | 17.6% |
[ 63.5% - 64.0% ] 63.75% | 372,670 | 22.6% |
[ 64.0% - 64.5% ] 64.30% | 1,023,266 | 18.3% |
[ 64.5% - 65.0% ] 64.72% | 314,238 | 15.7% |
[ 65.0% - 65.5% ] 65.21% | 498,997 | 16.2% |
[ 65.5% - 66.0% ] 65.77% | 226,964 | 19.7% |
[ 66.0% - 66.5% ] 66.31% | 231,643 | 19.4% |
[ 66.5% - 67.0% ] 66.82% | 279,307 | 20.2% |
[ 67.0% - 67.5% ] 67.21% | 221,891 | 17.2% |
[ 67.5% - 68.0% ] 67.69% | 157,385 | 23.2% |
[ 68.0% - 68.5% ] 68.17% | 130,128 | 25.6% |
[ 68.5% - 69.0% ] 68.61% | 422,782 | 22.6% |
[ 69.0% - 69.5% ] 69.28% | 174,277 | 17.1% |
[ 69.5% - 70.0% ] 69.79% | 111,726 | 24.2% |
[ 70.0% - 70.5% ] 70.26% | 267,603 | 24.5% |
[ 70.5% - 71.0% ] 70.70% | 357,245 | 28.1% |
[ 71.0% - 71.5% ] 71.27% | 242,347 | 17.5% |
[ 71.5% - 72.0% ] 71.71% | 212,072 | 15.0% |
[ 72.0% - 72.5% ] 72.20% | 230,234 | 21.0% |
[ 72.5% - 73.0% ] 72.67% | 142,940 | 28.0% |
[ 73.0% - 73.5% ] 73.16% | 262,529 | 16.6% |
[ 73.5% - 74.0% ] 73.79% | 330,771 | 18.7% |
[ 74.0% - 74.5% ] 74.26% | 235,321 | 22.0% |
[ 74.5% - 75.0% ] 74.67% | 270,513 | 19.1% |
[ 75.0% - 75.5% ] 75.24% | 161,698 | 14.4% |
[ 75.5% - 76.0% ] 75.77% | 241,670 | 25.6% |
[ 76.0% - 76.5% ] 76.30% | 234,131 | 20.5% |
[ 76.5% - 77.0% ] 76.62% | 84,383 | 36.8% |
[ 77.0% - 77.5% ] 77.39% | 215,350 | 18.8% |
[ 77.5% - 78.0% ] 77.78% | 825,487 | 25.1% |
[ 78.0% - 78.5% ] 78.18% | 166,575 | 15.1% |
[ 78.5% - 79.0% ] 78.84% | 246,411 | 16.1% |
[ 79.0% - 79.5% ] 79.27% | 254,278 | 26.9% |
[ 79.5% - 80.0% ] 79.71% | 116,541 | 27.7% |
[ 80.0% - 80.5% ] 80.21% | 280,919 | 22.4% |
[ 80.5% - 81.0% ] 80.64% | 217,469 | 19.8% |
[ 81.0% - 81.5% ] 81.29% | 237,013 | 18.2% |
[ 81.5% - 82.0% ] 81.68% | 280,453 | 18.9% |
[ 82.0% - 82.5% ] 82.19% | 434,281 | 21.9% |
[ 82.5% - 83.0% ] 82.73% | 151,249 | 19.4% |
[ 83.0% - 83.5% ] 83.35% | 77,828 | 20.3% |
[ 83.5% - 84.0% ] 83.89% | 60,855 | 28.3% |
[ 84.0% - 84.5% ] 84.33% | 182,339 | 27.1% |
[ 84.5% - 85.0% ] 84.73% | 154,372 | 23.5% |
[ 85.0% - 85.5% ] 85.27% | 129,275 | 24.4% |
[ 85.5% - 86.0% ] 85.82% | 106,416 | 27.1% |
[ 86.0% - 86.5% ] 86.33% | 141,729 | 19.4% |
[ 86.5% - 87.0% ] 86.65% | 257,460 | 13.3% |
[ 87.0% - 87.5% ] 87.31% | 129,722 | 12.9% |
[ 87.5% - 88.0% ] 87.75% | 193,356 | 23.3% |
[ 88.0% - 88.5% ] 88.29% | 107,820 | 22.2% |
[ 88.5% - 89.0% ] 88.77% | 191,694 | 22.1% |
[ 89.0% - 89.5% ] 89.17% | 124,491 | 27.1% |
[ 89.5% - 90.0% ] 89.70% | 219,574 | 19.9% |
[ 90.0% - 90.5% ] 90.18% | 67,731 | 23.4% |
[ 90.5% - 91.0% ] 90.87% | 100,090 | 19.2% |
[ 91.0% - 91.5% ] 91.23% | 369,530 | 14.9% |
[ 91.5% - 92.0% ] 91.80% | 121,833 | 16.9% |
[ 92.0% - 92.5% ] 92.26% | 94,369 | 30.1% |
[ 92.5% - 93.0% ] 92.68% | 140,115 | 31.6% |
[ 93.0% - 93.5% ] 93.21% | 176,202 | 20.7% |
[ 93.5% - 94.0% ] 93.70% | 258,081 | 24.5% |
[ 94.0% - 94.5% ] 94.38% | 114,142 | 28.5% |
[ 94.5% - 95.0% ] 94.76% | 85,527 | 16.5% |
[ 95.0% - 95.5% ] 95.22% | 79,202 | 20.4% |
[ 95.5% - 96.0% ] 95.81% | 72,864 | 25.1% |
[ 96.0% - 96.5% ] 96.27% | 43,763 | 20.1% |
[ 96.5% - 97.0% ] 96.82% | 13,264 | 15.9% |
[ 97.0% - 97.5% ] 97.36% | 1,475 | 41.4% |
[ 97.5% - 98.0% ] 97.57% | 1,070 | 42.4% |
[ 98.0% - 98.5% ] 98.35% | 2,846 | 24.7% |
[ 98.5% - 99.0% ] 98.64% | 13,982 | 26.2% |
[ 99.0% - 99.5% ] 99.22% | 13,155 | 20.8% |