Tlingit-Haida vs Immigrants from Oceania Single Male Poverty
COMPARE
Tlingit-Haida
Immigrants from Oceania
Single Male Poverty
Single Male Poverty Comparison
Tlingit-Haida
Immigrants from Oceania
11.6%
SINGLE MALE POVERTY
99.9/ 100
METRIC RATING
49th/ 347
METRIC RANK
12.4%
SINGLE MALE POVERTY
91.1/ 100
METRIC RATING
117th/ 347
METRIC RANK
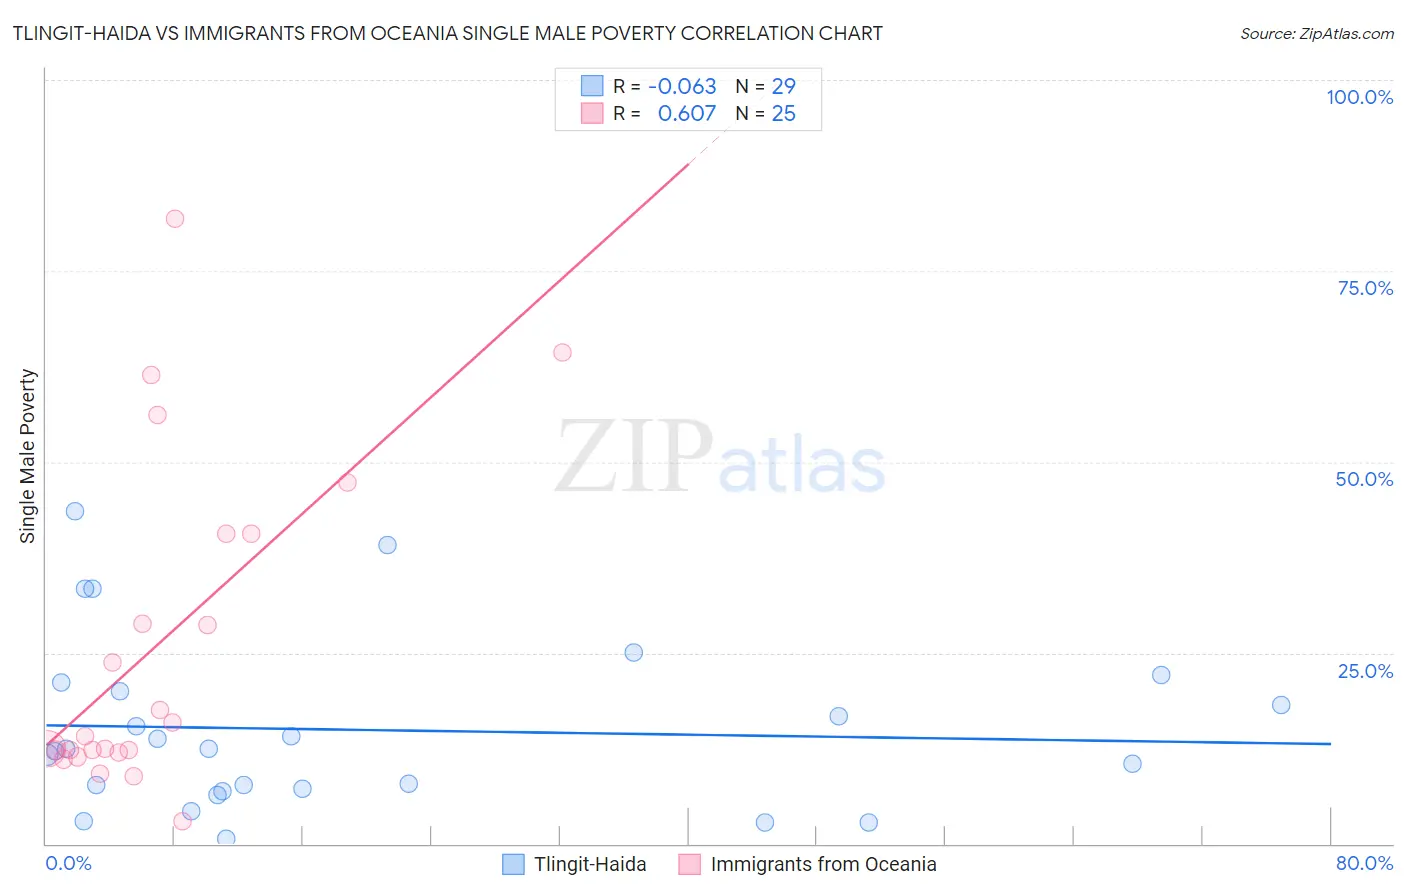
Tlingit-Haida vs Immigrants from Oceania Single Male Poverty Correlation Chart
The statistical analysis conducted on geographies consisting of 58,517,751 people shows a slight negative correlation between the proportion of Tlingit-Haida and poverty level among single males in the United States with a correlation coefficient (R) of -0.063 and weighted average of 11.6%. Similarly, the statistical analysis conducted on geographies consisting of 275,455,617 people shows a significant positive correlation between the proportion of Immigrants from Oceania and poverty level among single males in the United States with a correlation coefficient (R) of 0.607 and weighted average of 12.4%, a difference of 7.0%.
Single Male Poverty Correlation Summary
| Measurement | Tlingit-Haida | Immigrants from Oceania |
| Minimum | 0.66% | 3.0% |
| Maximum | 43.6% | 81.8% |
| Range | 43.0% | 78.9% |
| Mean | 14.9% | 26.0% |
| Median | 12.4% | 14.1% |
| Interquartile 25% (IQ1) | 7.1% | 12.1% |
| Interquartile 75% (IQ3) | 20.6% | 40.5% |
| Interquartile Range (IQR) | 13.5% | 28.4% |
| Standard Deviation (Sample) | 11.1% | 21.2% |
| Standard Deviation (Population) | 10.9% | 20.8% |
Similar Demographics by Single Male Poverty
Demographics Similar to Tlingit-Haida by Single Male Poverty
In terms of single male poverty, the demographic groups most similar to Tlingit-Haida are Immigrants from Indonesia (11.6%, a difference of 0.020%), Immigrants from Lithuania (11.6%, a difference of 0.060%), Nepalese (11.6%, a difference of 0.10%), Paraguayan (11.6%, a difference of 0.17%), and Immigrants from Bulgaria (11.6%, a difference of 0.29%).
| Demographics | Rating | Rank | Single Male Poverty |
| Egyptians | 99.9 /100 | #42 | Exceptional 11.5% |
| Immigrants | Peru | 99.9 /100 | #43 | Exceptional 11.5% |
| Immigrants | Cameroon | 99.9 /100 | #44 | Exceptional 11.5% |
| Immigrants | Poland | 99.9 /100 | #45 | Exceptional 11.5% |
| Immigrants | Bulgaria | 99.9 /100 | #46 | Exceptional 11.6% |
| Nepalese | 99.9 /100 | #47 | Exceptional 11.6% |
| Immigrants | Indonesia | 99.9 /100 | #48 | Exceptional 11.6% |
| Tlingit-Haida | 99.9 /100 | #49 | Exceptional 11.6% |
| Immigrants | Lithuania | 99.9 /100 | #50 | Exceptional 11.6% |
| Paraguayans | 99.9 /100 | #51 | Exceptional 11.6% |
| Samoans | 99.9 /100 | #52 | Exceptional 11.7% |
| Bulgarians | 99.9 /100 | #53 | Exceptional 11.7% |
| Immigrants | Uzbekistan | 99.9 /100 | #54 | Exceptional 11.7% |
| Cypriots | 99.9 /100 | #55 | Exceptional 11.7% |
| Burmese | 99.8 /100 | #56 | Exceptional 11.7% |
Demographics Similar to Immigrants from Oceania by Single Male Poverty
In terms of single male poverty, the demographic groups most similar to Immigrants from Oceania are Immigrants from Syria (12.4%, a difference of 0.010%), Immigrants from Southern Europe (12.4%, a difference of 0.070%), Albanian (12.4%, a difference of 0.10%), Immigrants from Albania (12.4%, a difference of 0.13%), and Nicaraguan (12.4%, a difference of 0.18%).
| Demographics | Rating | Rank | Single Male Poverty |
| Immigrants | Portugal | 93.6 /100 | #110 | Exceptional 12.3% |
| Immigrants | North Macedonia | 93.6 /100 | #111 | Exceptional 12.3% |
| Kenyans | 93.3 /100 | #112 | Exceptional 12.4% |
| Pakistanis | 92.4 /100 | #113 | Exceptional 12.4% |
| Nicaraguans | 92.1 /100 | #114 | Exceptional 12.4% |
| Immigrants | Southern Europe | 91.5 /100 | #115 | Exceptional 12.4% |
| Immigrants | Syria | 91.2 /100 | #116 | Exceptional 12.4% |
| Immigrants | Oceania | 91.1 /100 | #117 | Exceptional 12.4% |
| Albanians | 90.6 /100 | #118 | Exceptional 12.4% |
| Immigrants | Albania | 90.3 /100 | #119 | Exceptional 12.4% |
| Venezuelans | 89.4 /100 | #120 | Excellent 12.4% |
| Icelanders | 88.2 /100 | #121 | Excellent 12.5% |
| Serbians | 87.9 /100 | #122 | Excellent 12.5% |
| Immigrants | Kenya | 87.6 /100 | #123 | Excellent 12.5% |
| Russians | 87.3 /100 | #124 | Excellent 12.5% |