Tlingit-Haida vs Laotian Single Male Poverty
COMPARE
Tlingit-Haida
Laotian
Single Male Poverty
Single Male Poverty Comparison
Tlingit-Haida
Laotians
11.6%
SINGLE MALE POVERTY
99.9/ 100
METRIC RATING
49th/ 347
METRIC RANK
11.9%
SINGLE MALE POVERTY
99.6/ 100
METRIC RATING
65th/ 347
METRIC RANK
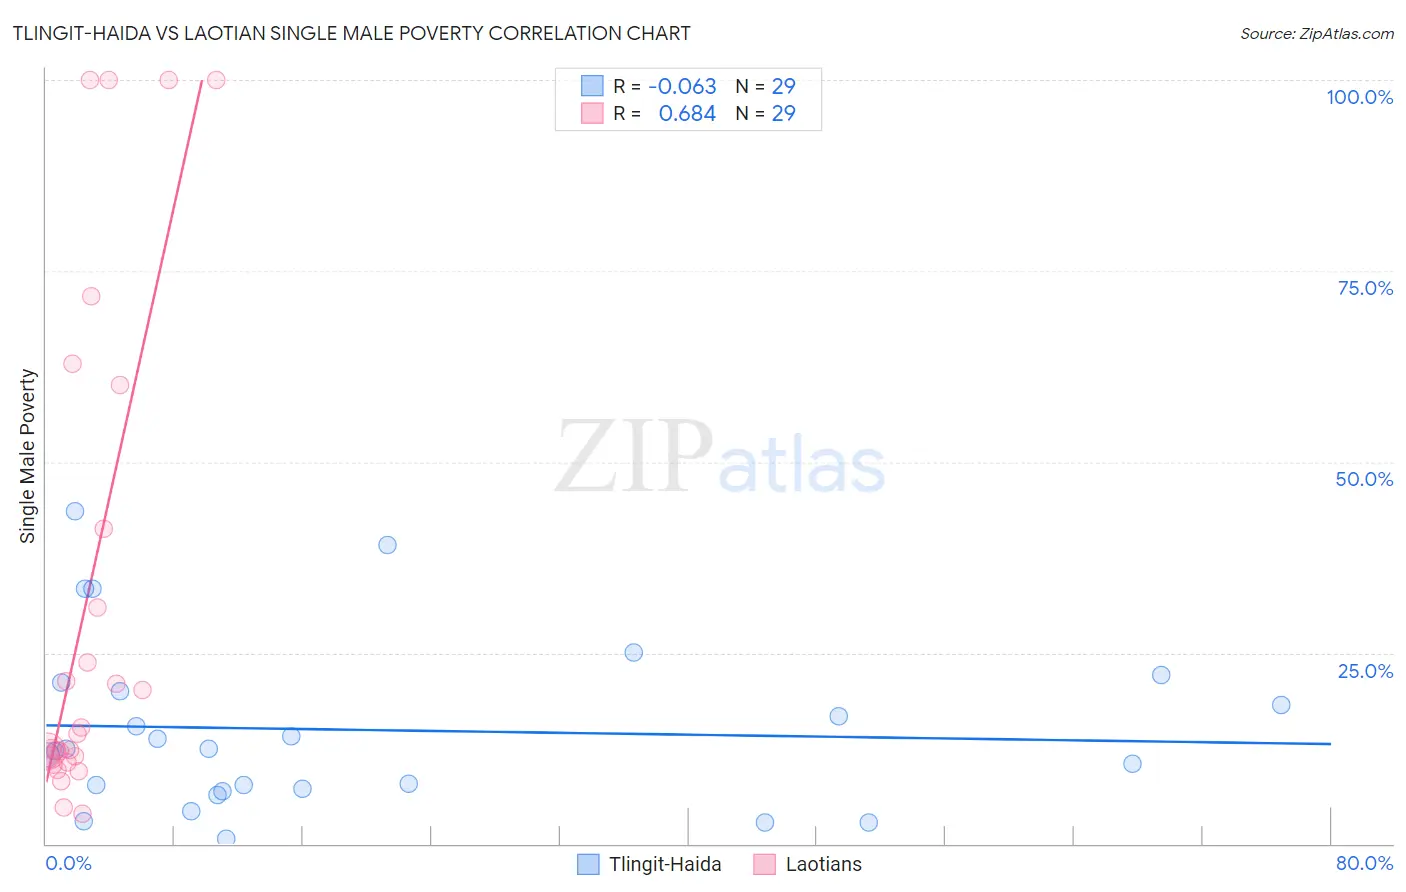
Tlingit-Haida vs Laotian Single Male Poverty Correlation Chart
The statistical analysis conducted on geographies consisting of 58,517,751 people shows a slight negative correlation between the proportion of Tlingit-Haida and poverty level among single males in the United States with a correlation coefficient (R) of -0.063 and weighted average of 11.6%. Similarly, the statistical analysis conducted on geographies consisting of 207,953,623 people shows a significant positive correlation between the proportion of Laotians and poverty level among single males in the United States with a correlation coefficient (R) of 0.684 and weighted average of 11.9%, a difference of 2.2%.
Single Male Poverty Correlation Summary
| Measurement | Tlingit-Haida | Laotian |
| Minimum | 0.66% | 3.9% |
| Maximum | 43.6% | 100.0% |
| Range | 43.0% | 96.1% |
| Mean | 14.9% | 31.9% |
| Median | 12.4% | 14.3% |
| Interquartile 25% (IQ1) | 7.1% | 11.0% |
| Interquartile 75% (IQ3) | 20.6% | 50.7% |
| Interquartile Range (IQR) | 13.5% | 39.7% |
| Standard Deviation (Sample) | 11.1% | 32.6% |
| Standard Deviation (Population) | 10.9% | 32.0% |
Demographics Similar to Tlingit-Haida and Laotians by Single Male Poverty
In terms of single male poverty, the demographic groups most similar to Tlingit-Haida are Immigrants from Indonesia (11.6%, a difference of 0.020%), Immigrants from Lithuania (11.6%, a difference of 0.060%), Nepalese (11.6%, a difference of 0.10%), Paraguayan (11.6%, a difference of 0.17%), and Samoan (11.7%, a difference of 0.47%). Similarly, the demographic groups most similar to Laotians are Immigrants from Uruguay (11.9%, a difference of 0.0%), Immigrants from Ukraine (11.9%, a difference of 0.020%), Immigrants from Eastern Europe (11.8%, a difference of 0.10%), Immigrants from Belarus (11.8%, a difference of 0.23%), and Immigrants from Sri Lanka (11.8%, a difference of 0.29%).
| Demographics | Rating | Rank | Single Male Poverty |
| Nepalese | 99.9 /100 | #47 | Exceptional 11.6% |
| Immigrants | Indonesia | 99.9 /100 | #48 | Exceptional 11.6% |
| Tlingit-Haida | 99.9 /100 | #49 | Exceptional 11.6% |
| Immigrants | Lithuania | 99.9 /100 | #50 | Exceptional 11.6% |
| Paraguayans | 99.9 /100 | #51 | Exceptional 11.6% |
| Samoans | 99.9 /100 | #52 | Exceptional 11.7% |
| Bulgarians | 99.9 /100 | #53 | Exceptional 11.7% |
| Immigrants | Uzbekistan | 99.9 /100 | #54 | Exceptional 11.7% |
| Cypriots | 99.9 /100 | #55 | Exceptional 11.7% |
| Burmese | 99.8 /100 | #56 | Exceptional 11.7% |
| Immigrants | Romania | 99.8 /100 | #57 | Exceptional 11.7% |
| Immigrants | Brazil | 99.8 /100 | #58 | Exceptional 11.7% |
| Brazilians | 99.8 /100 | #59 | Exceptional 11.8% |
| Peruvians | 99.8 /100 | #60 | Exceptional 11.8% |
| Cambodians | 99.8 /100 | #61 | Exceptional 11.8% |
| Immigrants | Sri Lanka | 99.7 /100 | #62 | Exceptional 11.8% |
| Immigrants | Belarus | 99.7 /100 | #63 | Exceptional 11.8% |
| Immigrants | Eastern Europe | 99.6 /100 | #64 | Exceptional 11.8% |
| Laotians | 99.6 /100 | #65 | Exceptional 11.9% |
| Immigrants | Uruguay | 99.6 /100 | #66 | Exceptional 11.9% |
| Immigrants | Ukraine | 99.6 /100 | #67 | Exceptional 11.9% |