Tlingit-Haida vs Immigrants from Asia Single Male Poverty
COMPARE
Tlingit-Haida
Immigrants from Asia
Single Male Poverty
Single Male Poverty Comparison
Tlingit-Haida
Immigrants from Asia
11.6%
SINGLE MALE POVERTY
99.9/ 100
METRIC RATING
49th/ 347
METRIC RANK
11.4%
SINGLE MALE POVERTY
100.0/ 100
METRIC RATING
28th/ 347
METRIC RANK
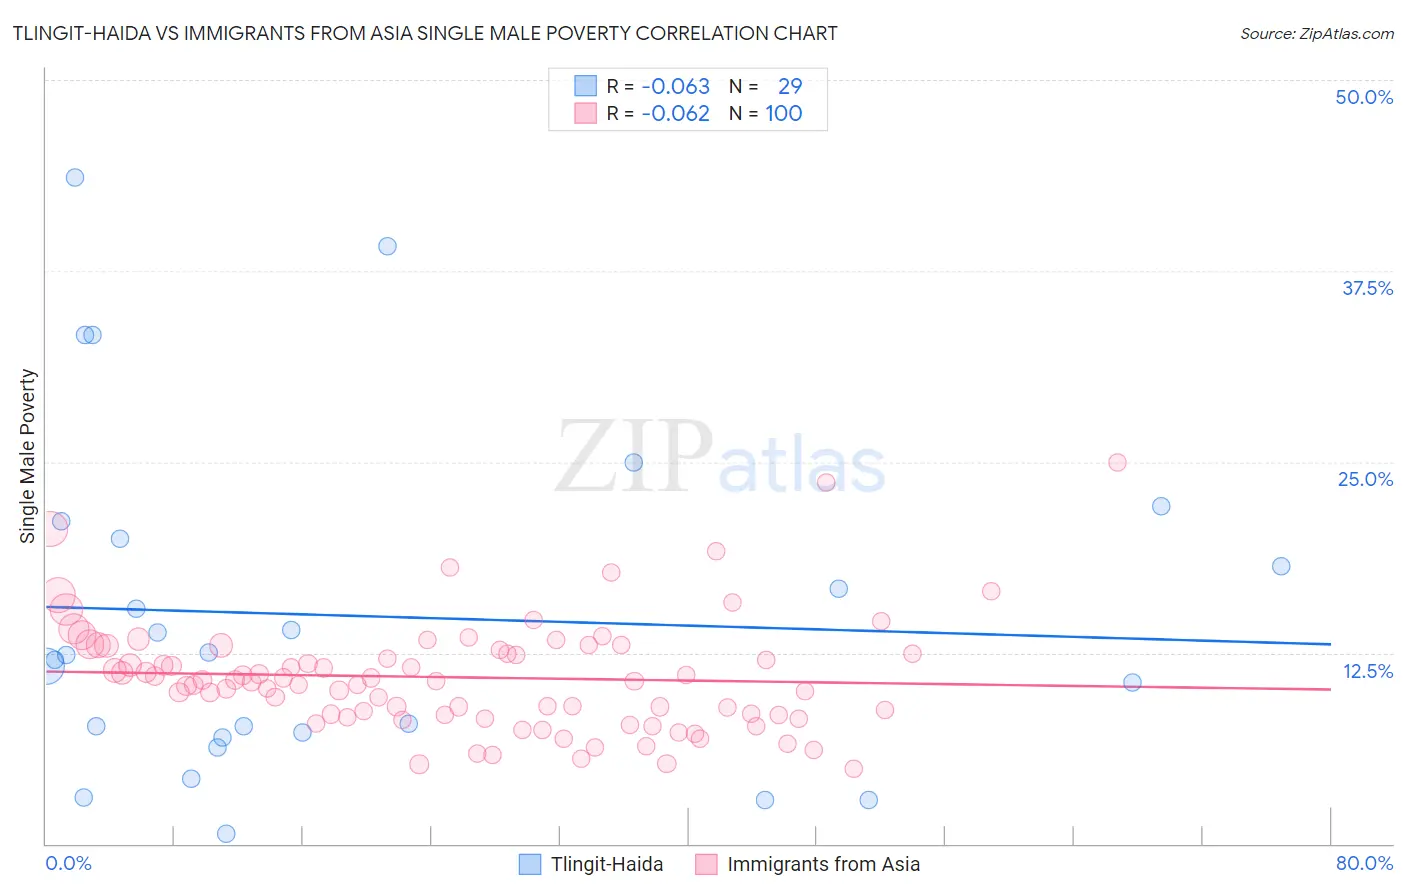
Tlingit-Haida vs Immigrants from Asia Single Male Poverty Correlation Chart
The statistical analysis conducted on geographies consisting of 58,517,751 people shows a slight negative correlation between the proportion of Tlingit-Haida and poverty level among single males in the United States with a correlation coefficient (R) of -0.063 and weighted average of 11.6%. Similarly, the statistical analysis conducted on geographies consisting of 461,688,534 people shows a slight negative correlation between the proportion of Immigrants from Asia and poverty level among single males in the United States with a correlation coefficient (R) of -0.062 and weighted average of 11.4%, a difference of 1.9%.
Single Male Poverty Correlation Summary
| Measurement | Tlingit-Haida | Immigrants from Asia |
| Minimum | 0.66% | 4.9% |
| Maximum | 43.6% | 25.0% |
| Range | 43.0% | 20.1% |
| Mean | 14.9% | 10.9% |
| Median | 12.4% | 10.6% |
| Interquartile 25% (IQ1) | 7.1% | 8.4% |
| Interquartile 75% (IQ3) | 20.6% | 12.8% |
| Interquartile Range (IQR) | 13.5% | 4.4% |
| Standard Deviation (Sample) | 11.1% | 3.7% |
| Standard Deviation (Population) | 10.9% | 3.6% |
Similar Demographics by Single Male Poverty
Demographics Similar to Tlingit-Haida by Single Male Poverty
In terms of single male poverty, the demographic groups most similar to Tlingit-Haida are Immigrants from Indonesia (11.6%, a difference of 0.020%), Immigrants from Lithuania (11.6%, a difference of 0.060%), Nepalese (11.6%, a difference of 0.10%), Paraguayan (11.6%, a difference of 0.17%), and Immigrants from Bulgaria (11.6%, a difference of 0.29%).
| Demographics | Rating | Rank | Single Male Poverty |
| Egyptians | 99.9 /100 | #42 | Exceptional 11.5% |
| Immigrants | Peru | 99.9 /100 | #43 | Exceptional 11.5% |
| Immigrants | Cameroon | 99.9 /100 | #44 | Exceptional 11.5% |
| Immigrants | Poland | 99.9 /100 | #45 | Exceptional 11.5% |
| Immigrants | Bulgaria | 99.9 /100 | #46 | Exceptional 11.6% |
| Nepalese | 99.9 /100 | #47 | Exceptional 11.6% |
| Immigrants | Indonesia | 99.9 /100 | #48 | Exceptional 11.6% |
| Tlingit-Haida | 99.9 /100 | #49 | Exceptional 11.6% |
| Immigrants | Lithuania | 99.9 /100 | #50 | Exceptional 11.6% |
| Paraguayans | 99.9 /100 | #51 | Exceptional 11.6% |
| Samoans | 99.9 /100 | #52 | Exceptional 11.7% |
| Bulgarians | 99.9 /100 | #53 | Exceptional 11.7% |
| Immigrants | Uzbekistan | 99.9 /100 | #54 | Exceptional 11.7% |
| Cypriots | 99.9 /100 | #55 | Exceptional 11.7% |
| Burmese | 99.8 /100 | #56 | Exceptional 11.7% |
Demographics Similar to Immigrants from Asia by Single Male Poverty
In terms of single male poverty, the demographic groups most similar to Immigrants from Asia are Immigrants from China (11.4%, a difference of 0.070%), Immigrants from Egypt (11.4%, a difference of 0.10%), Iranian (11.4%, a difference of 0.16%), Immigrants from Iran (11.4%, a difference of 0.25%), and Immigrants from Eastern Asia (11.4%, a difference of 0.34%).
| Demographics | Rating | Rank | Single Male Poverty |
| Asians | 100.0 /100 | #21 | Exceptional 11.2% |
| Immigrants | Pakistan | 100.0 /100 | #22 | Exceptional 11.2% |
| Bolivians | 100.0 /100 | #23 | Exceptional 11.2% |
| Indians (Asian) | 100.0 /100 | #24 | Exceptional 11.3% |
| Maltese | 100.0 /100 | #25 | Exceptional 11.3% |
| Immigrants | Japan | 100.0 /100 | #26 | Exceptional 11.3% |
| Immigrants | China | 100.0 /100 | #27 | Exceptional 11.4% |
| Immigrants | Asia | 100.0 /100 | #28 | Exceptional 11.4% |
| Immigrants | Egypt | 100.0 /100 | #29 | Exceptional 11.4% |
| Iranians | 100.0 /100 | #30 | Exceptional 11.4% |
| Immigrants | Iran | 100.0 /100 | #31 | Exceptional 11.4% |
| Immigrants | Eastern Asia | 100.0 /100 | #32 | Exceptional 11.4% |
| Immigrants | Vietnam | 100.0 /100 | #33 | Exceptional 11.4% |
| Immigrants | Ethiopia | 100.0 /100 | #34 | Exceptional 11.4% |
| Immigrants | South Eastern Asia | 100.0 /100 | #35 | Exceptional 11.4% |