Tlingit-Haida vs Immigrants from Micronesia Single Male Poverty
COMPARE
Tlingit-Haida
Immigrants from Micronesia
Single Male Poverty
Single Male Poverty Comparison
Tlingit-Haida
Immigrants from Micronesia
11.6%
SINGLE MALE POVERTY
99.9/ 100
METRIC RATING
49th/ 347
METRIC RANK
13.5%
SINGLE MALE POVERTY
1.2/ 100
METRIC RATING
246th/ 347
METRIC RANK
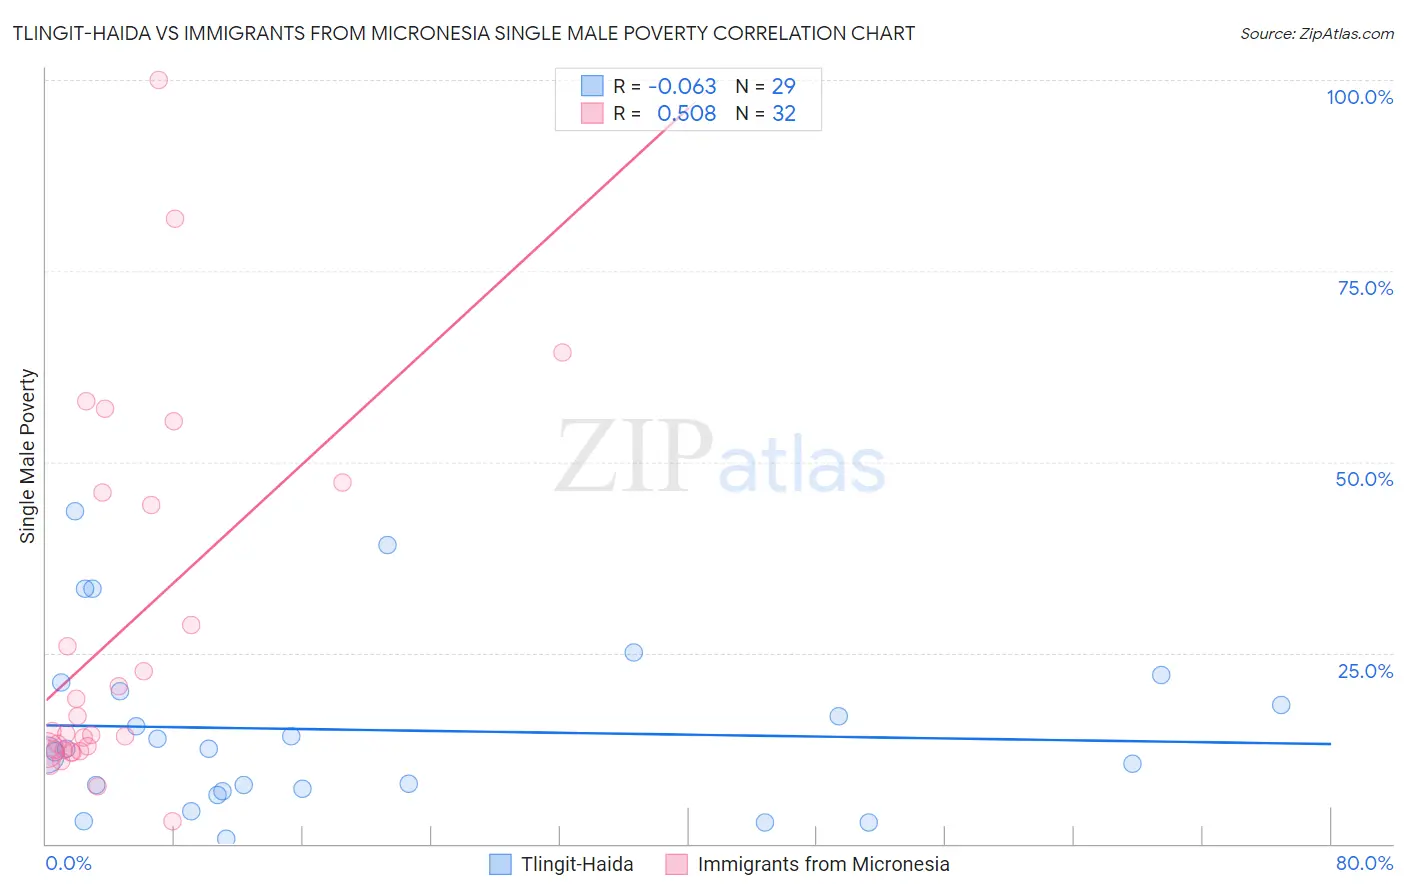
Tlingit-Haida vs Immigrants from Micronesia Single Male Poverty Correlation Chart
The statistical analysis conducted on geographies consisting of 58,517,751 people shows a slight negative correlation between the proportion of Tlingit-Haida and poverty level among single males in the United States with a correlation coefficient (R) of -0.063 and weighted average of 11.6%. Similarly, the statistical analysis conducted on geographies consisting of 60,290,539 people shows a substantial positive correlation between the proportion of Immigrants from Micronesia and poverty level among single males in the United States with a correlation coefficient (R) of 0.508 and weighted average of 13.5%, a difference of 16.7%.
Single Male Poverty Correlation Summary
| Measurement | Tlingit-Haida | Immigrants from Micronesia |
| Minimum | 0.66% | 3.0% |
| Maximum | 43.6% | 100.0% |
| Range | 43.0% | 97.0% |
| Mean | 14.9% | 27.8% |
| Median | 12.4% | 14.5% |
| Interquartile 25% (IQ1) | 7.1% | 12.2% |
| Interquartile 75% (IQ3) | 20.6% | 45.2% |
| Interquartile Range (IQR) | 13.5% | 32.9% |
| Standard Deviation (Sample) | 11.1% | 23.9% |
| Standard Deviation (Population) | 10.9% | 23.5% |
Similar Demographics by Single Male Poverty
Demographics Similar to Tlingit-Haida by Single Male Poverty
In terms of single male poverty, the demographic groups most similar to Tlingit-Haida are Immigrants from Indonesia (11.6%, a difference of 0.020%), Immigrants from Lithuania (11.6%, a difference of 0.060%), Nepalese (11.6%, a difference of 0.10%), Paraguayan (11.6%, a difference of 0.17%), and Immigrants from Bulgaria (11.6%, a difference of 0.29%).
| Demographics | Rating | Rank | Single Male Poverty |
| Egyptians | 99.9 /100 | #42 | Exceptional 11.5% |
| Immigrants | Peru | 99.9 /100 | #43 | Exceptional 11.5% |
| Immigrants | Cameroon | 99.9 /100 | #44 | Exceptional 11.5% |
| Immigrants | Poland | 99.9 /100 | #45 | Exceptional 11.5% |
| Immigrants | Bulgaria | 99.9 /100 | #46 | Exceptional 11.6% |
| Nepalese | 99.9 /100 | #47 | Exceptional 11.6% |
| Immigrants | Indonesia | 99.9 /100 | #48 | Exceptional 11.6% |
| Tlingit-Haida | 99.9 /100 | #49 | Exceptional 11.6% |
| Immigrants | Lithuania | 99.9 /100 | #50 | Exceptional 11.6% |
| Paraguayans | 99.9 /100 | #51 | Exceptional 11.6% |
| Samoans | 99.9 /100 | #52 | Exceptional 11.7% |
| Bulgarians | 99.9 /100 | #53 | Exceptional 11.7% |
| Immigrants | Uzbekistan | 99.9 /100 | #54 | Exceptional 11.7% |
| Cypriots | 99.9 /100 | #55 | Exceptional 11.7% |
| Burmese | 99.8 /100 | #56 | Exceptional 11.7% |
Demographics Similar to Immigrants from Micronesia by Single Male Poverty
In terms of single male poverty, the demographic groups most similar to Immigrants from Micronesia are Belgian (13.5%, a difference of 0.010%), Czech (13.5%, a difference of 0.040%), Immigrants from Latin America (13.5%, a difference of 0.10%), Spanish (13.6%, a difference of 0.28%), and Immigrants from Somalia (13.6%, a difference of 0.30%).
| Demographics | Rating | Rank | Single Male Poverty |
| Czechoslovakians | 3.0 /100 | #239 | Tragic 13.4% |
| Belizeans | 2.3 /100 | #240 | Tragic 13.4% |
| Immigrants | Germany | 2.1 /100 | #241 | Tragic 13.4% |
| Carpatho Rusyns | 2.1 /100 | #242 | Tragic 13.4% |
| Barbadians | 2.1 /100 | #243 | Tragic 13.4% |
| Immigrants | Senegal | 1.7 /100 | #244 | Tragic 13.5% |
| Immigrants | Latin America | 1.3 /100 | #245 | Tragic 13.5% |
| Immigrants | Micronesia | 1.2 /100 | #246 | Tragic 13.5% |
| Belgians | 1.2 /100 | #247 | Tragic 13.5% |
| Czechs | 1.2 /100 | #248 | Tragic 13.5% |
| Spanish | 1.0 /100 | #249 | Tragic 13.6% |
| Immigrants | Somalia | 1.0 /100 | #250 | Tragic 13.6% |
| Immigrants | Zaire | 0.9 /100 | #251 | Tragic 13.6% |
| Finns | 0.9 /100 | #252 | Tragic 13.6% |
| German Russians | 0.8 /100 | #253 | Tragic 13.6% |