Tlingit-Haida vs Immigrants from Panama Single Male Poverty
COMPARE
Tlingit-Haida
Immigrants from Panama
Single Male Poverty
Single Male Poverty Comparison
Tlingit-Haida
Immigrants from Panama
11.6%
SINGLE MALE POVERTY
99.9/ 100
METRIC RATING
49th/ 347
METRIC RANK
12.6%
SINGLE MALE POVERTY
72.1/ 100
METRIC RATING
150th/ 347
METRIC RANK
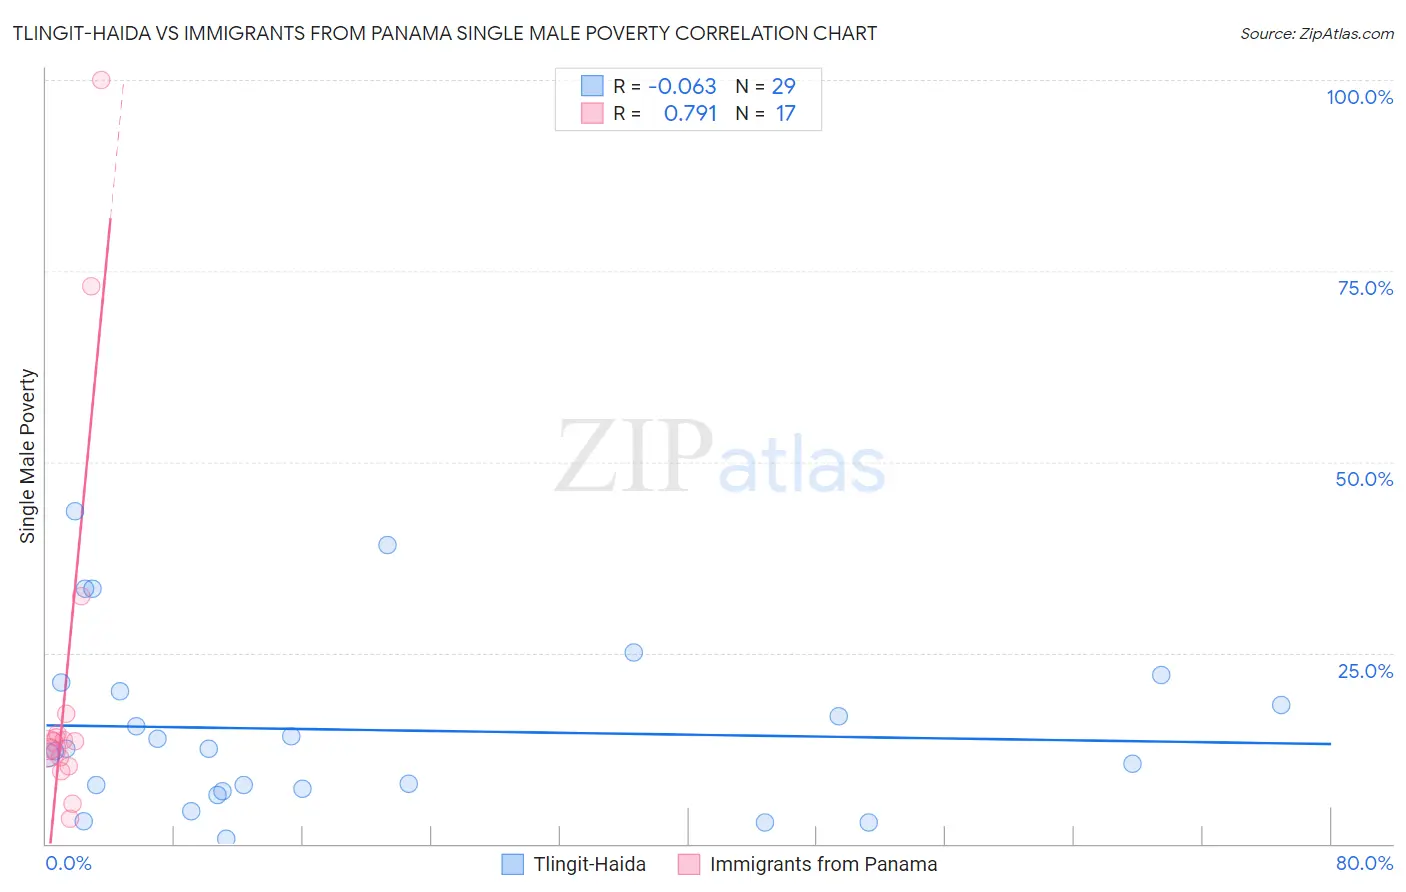
Tlingit-Haida vs Immigrants from Panama Single Male Poverty Correlation Chart
The statistical analysis conducted on geographies consisting of 58,517,751 people shows a slight negative correlation between the proportion of Tlingit-Haida and poverty level among single males in the United States with a correlation coefficient (R) of -0.063 and weighted average of 11.6%. Similarly, the statistical analysis conducted on geographies consisting of 206,693,503 people shows a strong positive correlation between the proportion of Immigrants from Panama and poverty level among single males in the United States with a correlation coefficient (R) of 0.791 and weighted average of 12.6%, a difference of 9.0%.
Single Male Poverty Correlation Summary
| Measurement | Tlingit-Haida | Immigrants from Panama |
| Minimum | 0.66% | 3.3% |
| Maximum | 43.6% | 100.0% |
| Range | 43.0% | 96.7% |
| Mean | 14.9% | 21.6% |
| Median | 12.4% | 13.3% |
| Interquartile 25% (IQ1) | 7.1% | 10.7% |
| Interquartile 75% (IQ3) | 20.6% | 15.6% |
| Interquartile Range (IQR) | 13.5% | 4.9% |
| Standard Deviation (Sample) | 11.1% | 25.6% |
| Standard Deviation (Population) | 10.9% | 24.8% |
Similar Demographics by Single Male Poverty
Demographics Similar to Tlingit-Haida by Single Male Poverty
In terms of single male poverty, the demographic groups most similar to Tlingit-Haida are Immigrants from Indonesia (11.6%, a difference of 0.020%), Immigrants from Lithuania (11.6%, a difference of 0.060%), Nepalese (11.6%, a difference of 0.10%), Paraguayan (11.6%, a difference of 0.17%), and Immigrants from Bulgaria (11.6%, a difference of 0.29%).
| Demographics | Rating | Rank | Single Male Poverty |
| Egyptians | 99.9 /100 | #42 | Exceptional 11.5% |
| Immigrants | Peru | 99.9 /100 | #43 | Exceptional 11.5% |
| Immigrants | Cameroon | 99.9 /100 | #44 | Exceptional 11.5% |
| Immigrants | Poland | 99.9 /100 | #45 | Exceptional 11.5% |
| Immigrants | Bulgaria | 99.9 /100 | #46 | Exceptional 11.6% |
| Nepalese | 99.9 /100 | #47 | Exceptional 11.6% |
| Immigrants | Indonesia | 99.9 /100 | #48 | Exceptional 11.6% |
| Tlingit-Haida | 99.9 /100 | #49 | Exceptional 11.6% |
| Immigrants | Lithuania | 99.9 /100 | #50 | Exceptional 11.6% |
| Paraguayans | 99.9 /100 | #51 | Exceptional 11.6% |
| Samoans | 99.9 /100 | #52 | Exceptional 11.7% |
| Bulgarians | 99.9 /100 | #53 | Exceptional 11.7% |
| Immigrants | Uzbekistan | 99.9 /100 | #54 | Exceptional 11.7% |
| Cypriots | 99.9 /100 | #55 | Exceptional 11.7% |
| Burmese | 99.8 /100 | #56 | Exceptional 11.7% |
Demographics Similar to Immigrants from Panama by Single Male Poverty
In terms of single male poverty, the demographic groups most similar to Immigrants from Panama are Immigrants from Hungary (12.6%, a difference of 0.010%), Australian (12.6%, a difference of 0.050%), Sierra Leonean (12.6%, a difference of 0.060%), Yugoslavian (12.6%, a difference of 0.13%), and Immigrants (12.7%, a difference of 0.13%).
| Demographics | Rating | Rank | Single Male Poverty |
| Immigrants | France | 75.8 /100 | #143 | Good 12.6% |
| Hawaiians | 75.1 /100 | #144 | Good 12.6% |
| Immigrants | Lebanon | 75.0 /100 | #145 | Good 12.6% |
| Native Hawaiians | 75.0 /100 | #146 | Good 12.6% |
| Malaysians | 74.8 /100 | #147 | Good 12.6% |
| Yugoslavians | 73.9 /100 | #148 | Good 12.6% |
| Sierra Leoneans | 73.0 /100 | #149 | Good 12.6% |
| Immigrants | Panama | 72.1 /100 | #150 | Good 12.6% |
| Immigrants | Hungary | 71.9 /100 | #151 | Good 12.6% |
| Australians | 71.4 /100 | #152 | Good 12.6% |
| Immigrants | Immigrants | 70.1 /100 | #153 | Good 12.7% |
| Immigrants | Scotland | 68.9 /100 | #154 | Good 12.7% |
| Immigrants | Spain | 68.7 /100 | #155 | Good 12.7% |
| Vietnamese | 67.9 /100 | #156 | Good 12.7% |
| Latvians | 67.9 /100 | #157 | Good 12.7% |