Zip Codes with the Highest Percentage of Population with a Degree in Liberal Arts and History in Portland, OR
RELATED REPORTS & OPTIONS
Liberal Arts and History
Portland
Compare Zip Codes
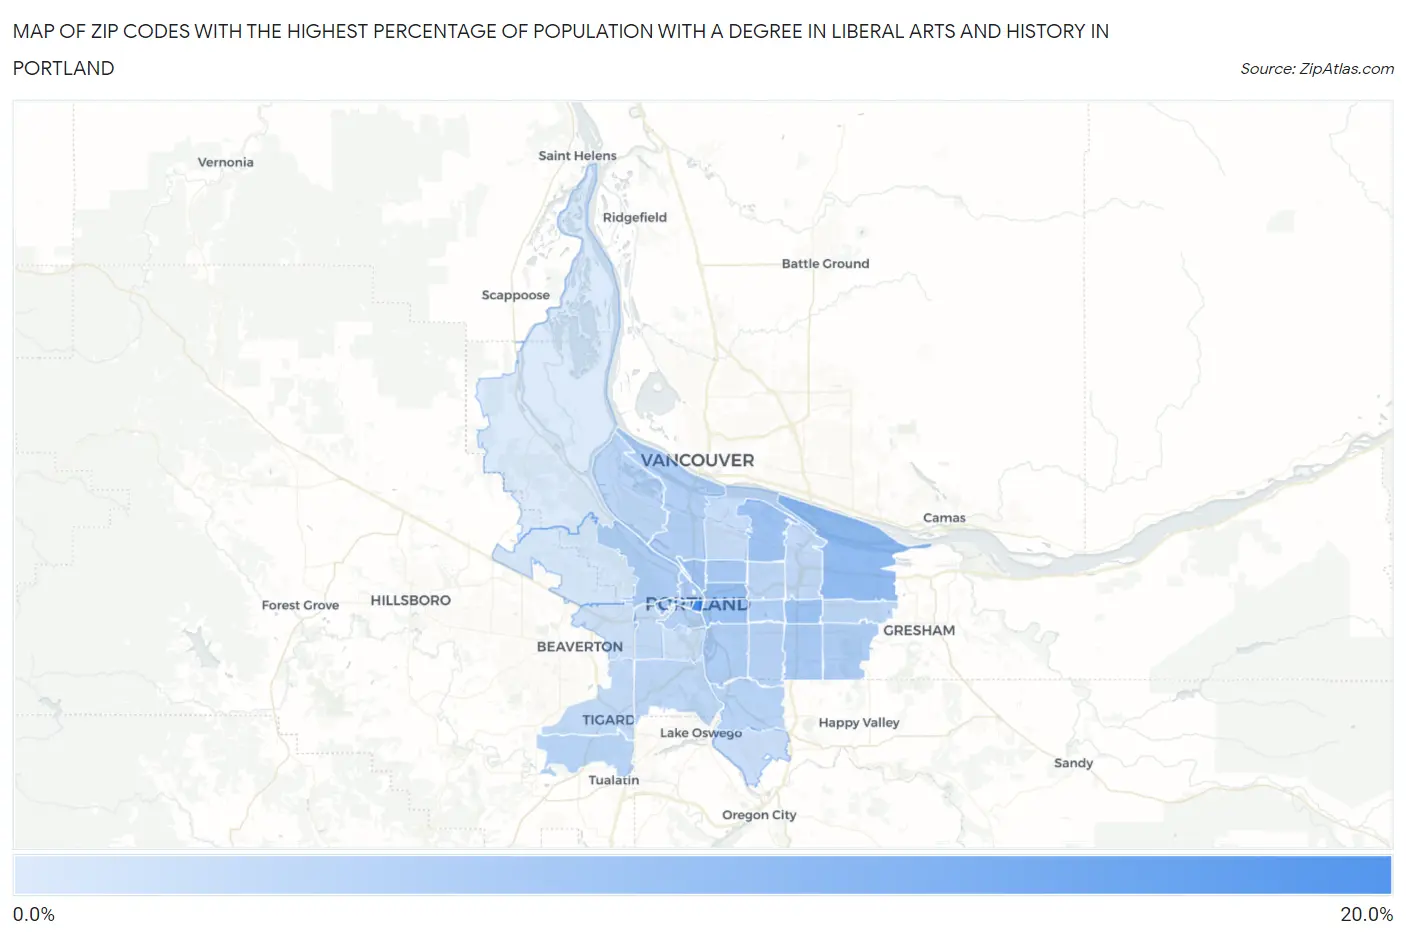
Map of Zip Codes with the Highest Percentage of Population with a Degree in Liberal Arts and History in Portland
3.7%
16.2%
Zip Codes with the Highest Percentage of Population with a Degree in Liberal Arts and History in Portland, OR
| Zip Code | % Graduates | vs State | vs National | |
| 1. | 97204 | 16.2% | 6.1%(+10.1)#24 | 4.9%(+11.3)#1,231 |
| 2. | 97230 | 9.7% | 6.1%(+3.66)#79 | 4.9%(+4.87)#3,278 |
| 3. | 97232 | 9.4% | 6.1%(+3.27)#86 | 4.9%(+4.48)#3,557 |
| 4. | 97216 | 8.8% | 6.1%(+2.70)#98 | 4.9%(+3.90)#4,058 |
| 5. | 97214 | 8.7% | 6.1%(+2.59)#101 | 4.9%(+3.79)#4,155 |
| 6. | 97227 | 8.6% | 6.1%(+2.49)#102 | 4.9%(+3.70)#4,276 |
| 7. | 97218 | 8.5% | 6.1%(+2.46)#103 | 4.9%(+3.67)#4,298 |
| 8. | 97205 | 8.1% | 6.1%(+1.98)#109 | 4.9%(+3.18)#4,830 |
| 9. | 97266 | 7.8% | 6.1%(+1.72)#117 | 4.9%(+2.93)#5,172 |
| 10. | 97212 | 7.8% | 6.1%(+1.71)#118 | 4.9%(+2.92)#5,190 |
| 11. | 97209 | 7.6% | 6.1%(+1.52)#124 | 4.9%(+2.73)#5,440 |
| 12. | 97236 | 7.4% | 6.1%(+1.33)#128 | 4.9%(+2.53)#5,740 |
| 13. | 97210 | 7.4% | 6.1%(+1.28)#130 | 4.9%(+2.48)#5,792 |
| 14. | 97202 | 7.2% | 6.1%(+1.11)#134 | 4.9%(+2.32)#6,071 |
| 15. | 97215 | 7.0% | 6.1%(+0.970)#139 | 4.9%(+2.18)#6,308 |
| 16. | 97217 | 7.0% | 6.1%(+0.872)#142 | 4.9%(+2.08)#6,469 |
| 17. | 97201 | 6.8% | 6.1%(+0.769)#146 | 4.9%(+1.98)#6,645 |
| 18. | 97206 | 6.7% | 6.1%(+0.612)#151 | 4.9%(+1.82)#6,961 |
| 19. | 97224 | 6.5% | 6.1%(+0.433)#158 | 4.9%(+1.64)#7,319 |
| 20. | 97222 | 6.5% | 6.1%(+0.403)#159 | 4.9%(+1.61)#7,377 |
| 21. | 97203 | 6.2% | 6.1%(+0.145)#171 | 4.9%(+1.35)#7,973 |
| 22. | 97233 | 6.2% | 6.1%(+0.109)#174 | 4.9%(+1.32)#8,053 |
| 23. | 97213 | 6.0% | 6.1%(-0.029)#177 | 4.9%(+1.18)#8,386 |
| 24. | 97219 | 6.0% | 6.1%(-0.066)#179 | 4.9%(+1.14)#8,488 |
| 25. | 97220 | 5.9% | 6.1%(-0.175)#182 | 4.9%(+1.03)#8,766 |
| 26. | 97223 | 5.8% | 6.1%(-0.317)#189 | 4.9%(+0.889)#9,135 |
| 27. | 97221 | 5.7% | 6.1%(-0.362)#193 | 4.9%(+0.844)#9,249 |
| 28. | 97211 | 5.3% | 6.1%(-0.734)#214 | 4.9%(+0.472)#10,289 |
| 29. | 97267 | 5.1% | 6.1%(-0.945)#227 | 4.9%(+0.261)#10,920 |
| 30. | 97239 | 4.9% | 6.1%(-1.16)#234 | 4.9%(+0.049)#11,582 |
| 31. | 97225 | 4.8% | 6.1%(-1.29)#241 | 4.9%(-0.085)#12,012 |
| 32. | 97229 | 4.2% | 6.1%(-1.87)#260 | 4.9%(-0.666)#13,990 |
| 33. | 97231 | 3.7% | 6.1%(-2.38)#276 | 4.9%(-1.18)#15,933 |
1
Common Questions
What are the Top 10 Zip Codes with the Highest Percentage of Population with a Degree in Liberal Arts and History in Portland, OR?
Top 10 Zip Codes with the Highest Percentage of Population with a Degree in Liberal Arts and History in Portland, OR are:
What zip code has the Highest Percentage of Population with a Degree in Liberal Arts and History in Portland, OR?
97204 has the Highest Percentage of Population with a Degree in Liberal Arts and History in Portland, OR with 16.2%.
What is the Percentage of Population with a Degree in Liberal Arts and History in Portland, OR?
Percentage of Population with a Degree in Liberal Arts and History in Portland is 6.9%.
What is the Percentage of Population with a Degree in Liberal Arts and History in Oregon?
Percentage of Population with a Degree in Liberal Arts and History in Oregon is 6.1%.
What is the Percentage of Population with a Degree in Liberal Arts and History in the United States?
Percentage of Population with a Degree in Liberal Arts and History in the United States is 4.9%.