Zip Codes with the Highest Percentage of Population with a Degree in Liberal Arts and History in Springfield, OR
RELATED REPORTS & OPTIONS
Liberal Arts and History
Springfield
Compare Zip Codes
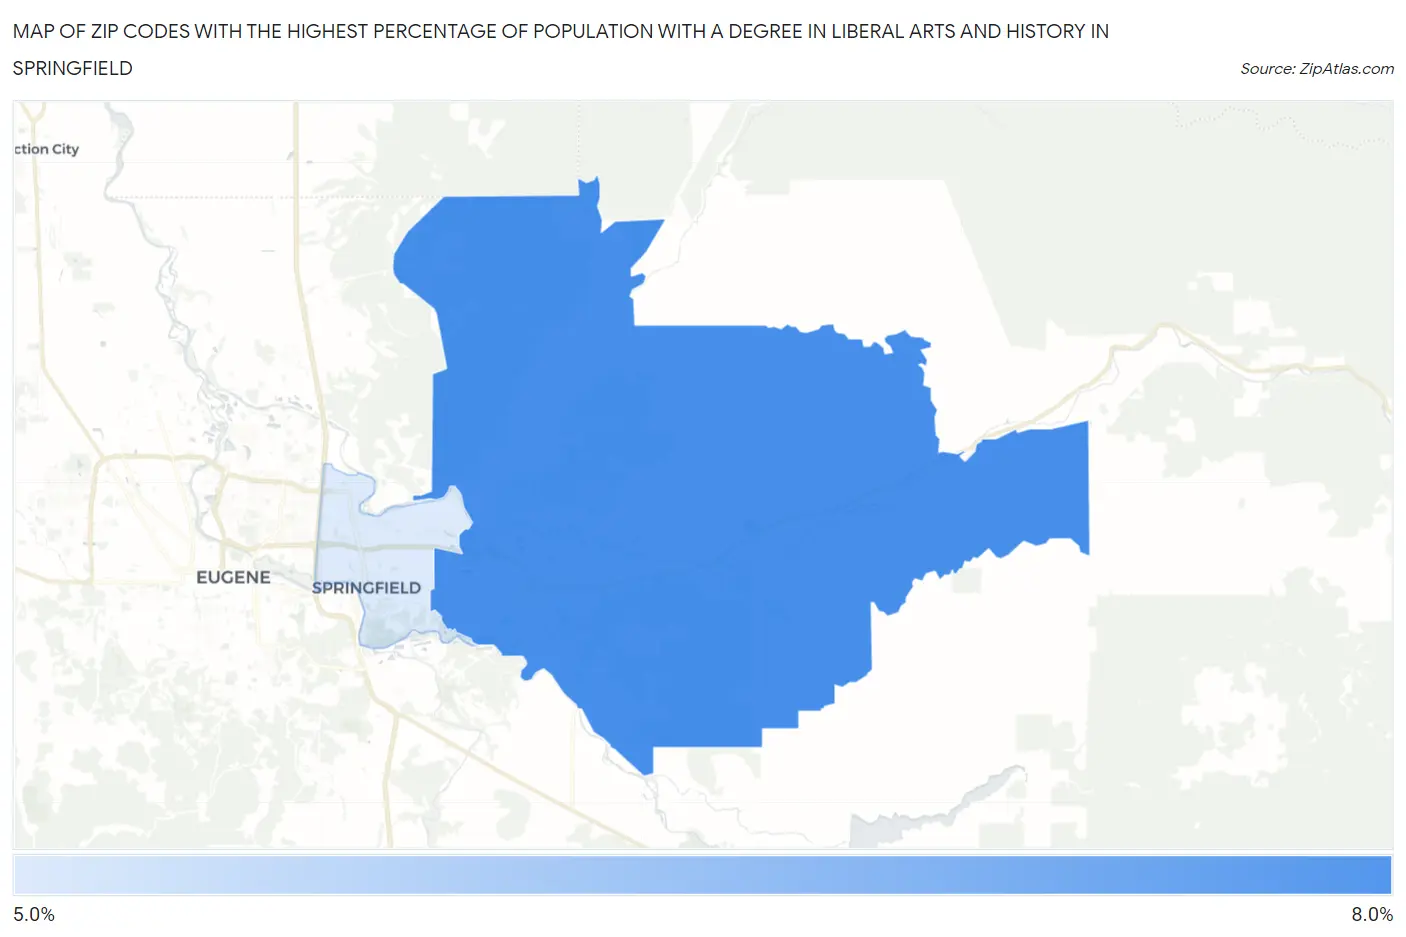
Map of Zip Codes with the Highest Percentage of Population with a Degree in Liberal Arts and History in Springfield
5.7%
6.7%
Zip Codes with the Highest Percentage of Population with a Degree in Liberal Arts and History in Springfield, OR
| Zip Code | % Graduates | vs State | vs National | |
| 1. | 97478 | 6.7% | 6.1%(+0.597)#152 | 4.9%(+1.80)#6,989 |
| 2. | 97477 | 5.7% | 6.1%(-0.346)#191 | 4.9%(+0.861)#9,209 |
1
Common Questions
What are the Top Zip Codes with the Highest Percentage of Population with a Degree in Liberal Arts and History in Springfield, OR?
Top Zip Codes with the Highest Percentage of Population with a Degree in Liberal Arts and History in Springfield, OR are:
What zip code has the Highest Percentage of Population with a Degree in Liberal Arts and History in Springfield, OR?
97478 has the Highest Percentage of Population with a Degree in Liberal Arts and History in Springfield, OR with 6.7%.
What is the Percentage of Population with a Degree in Liberal Arts and History in Springfield, OR?
Percentage of Population with a Degree in Liberal Arts and History in Springfield is 6.0%.
What is the Percentage of Population with a Degree in Liberal Arts and History in Oregon?
Percentage of Population with a Degree in Liberal Arts and History in Oregon is 6.1%.
What is the Percentage of Population with a Degree in Liberal Arts and History in the United States?
Percentage of Population with a Degree in Liberal Arts and History in the United States is 4.9%.